


Indoor Exposure and Regional Inhaled Deposited Dose Rate during Smoking and Incense Stick Burning—The Jordanian Case as an Example for Eastern Mediterranean Conditions


Abstract
:1. Introduction
2. Materials and Methods
2.1. Measurement Setup
2.2. Exposure Scenarios
2.3. Data Handling
2.4. Particle Emission Rate and Loss Rate Calculation—A Simple Indoor Aerosol Model
2.5. Reigional Inhaled Deposited Dose in the Respiratory Tracts
- The minute ventilation (VE, m3/h), which is the volume of breathed air per time (Table 1);
- The measured particle number size distribution ( , particles/cm3):

| Activity | Female | Male | DF Curve Type |
|---|---|---|---|
| Walking (4.0 km/h) | 1.20 | 1.38 | Exercise |
| Standing | 0.48 | 0.66 | at rest |

3. Results and Discussion
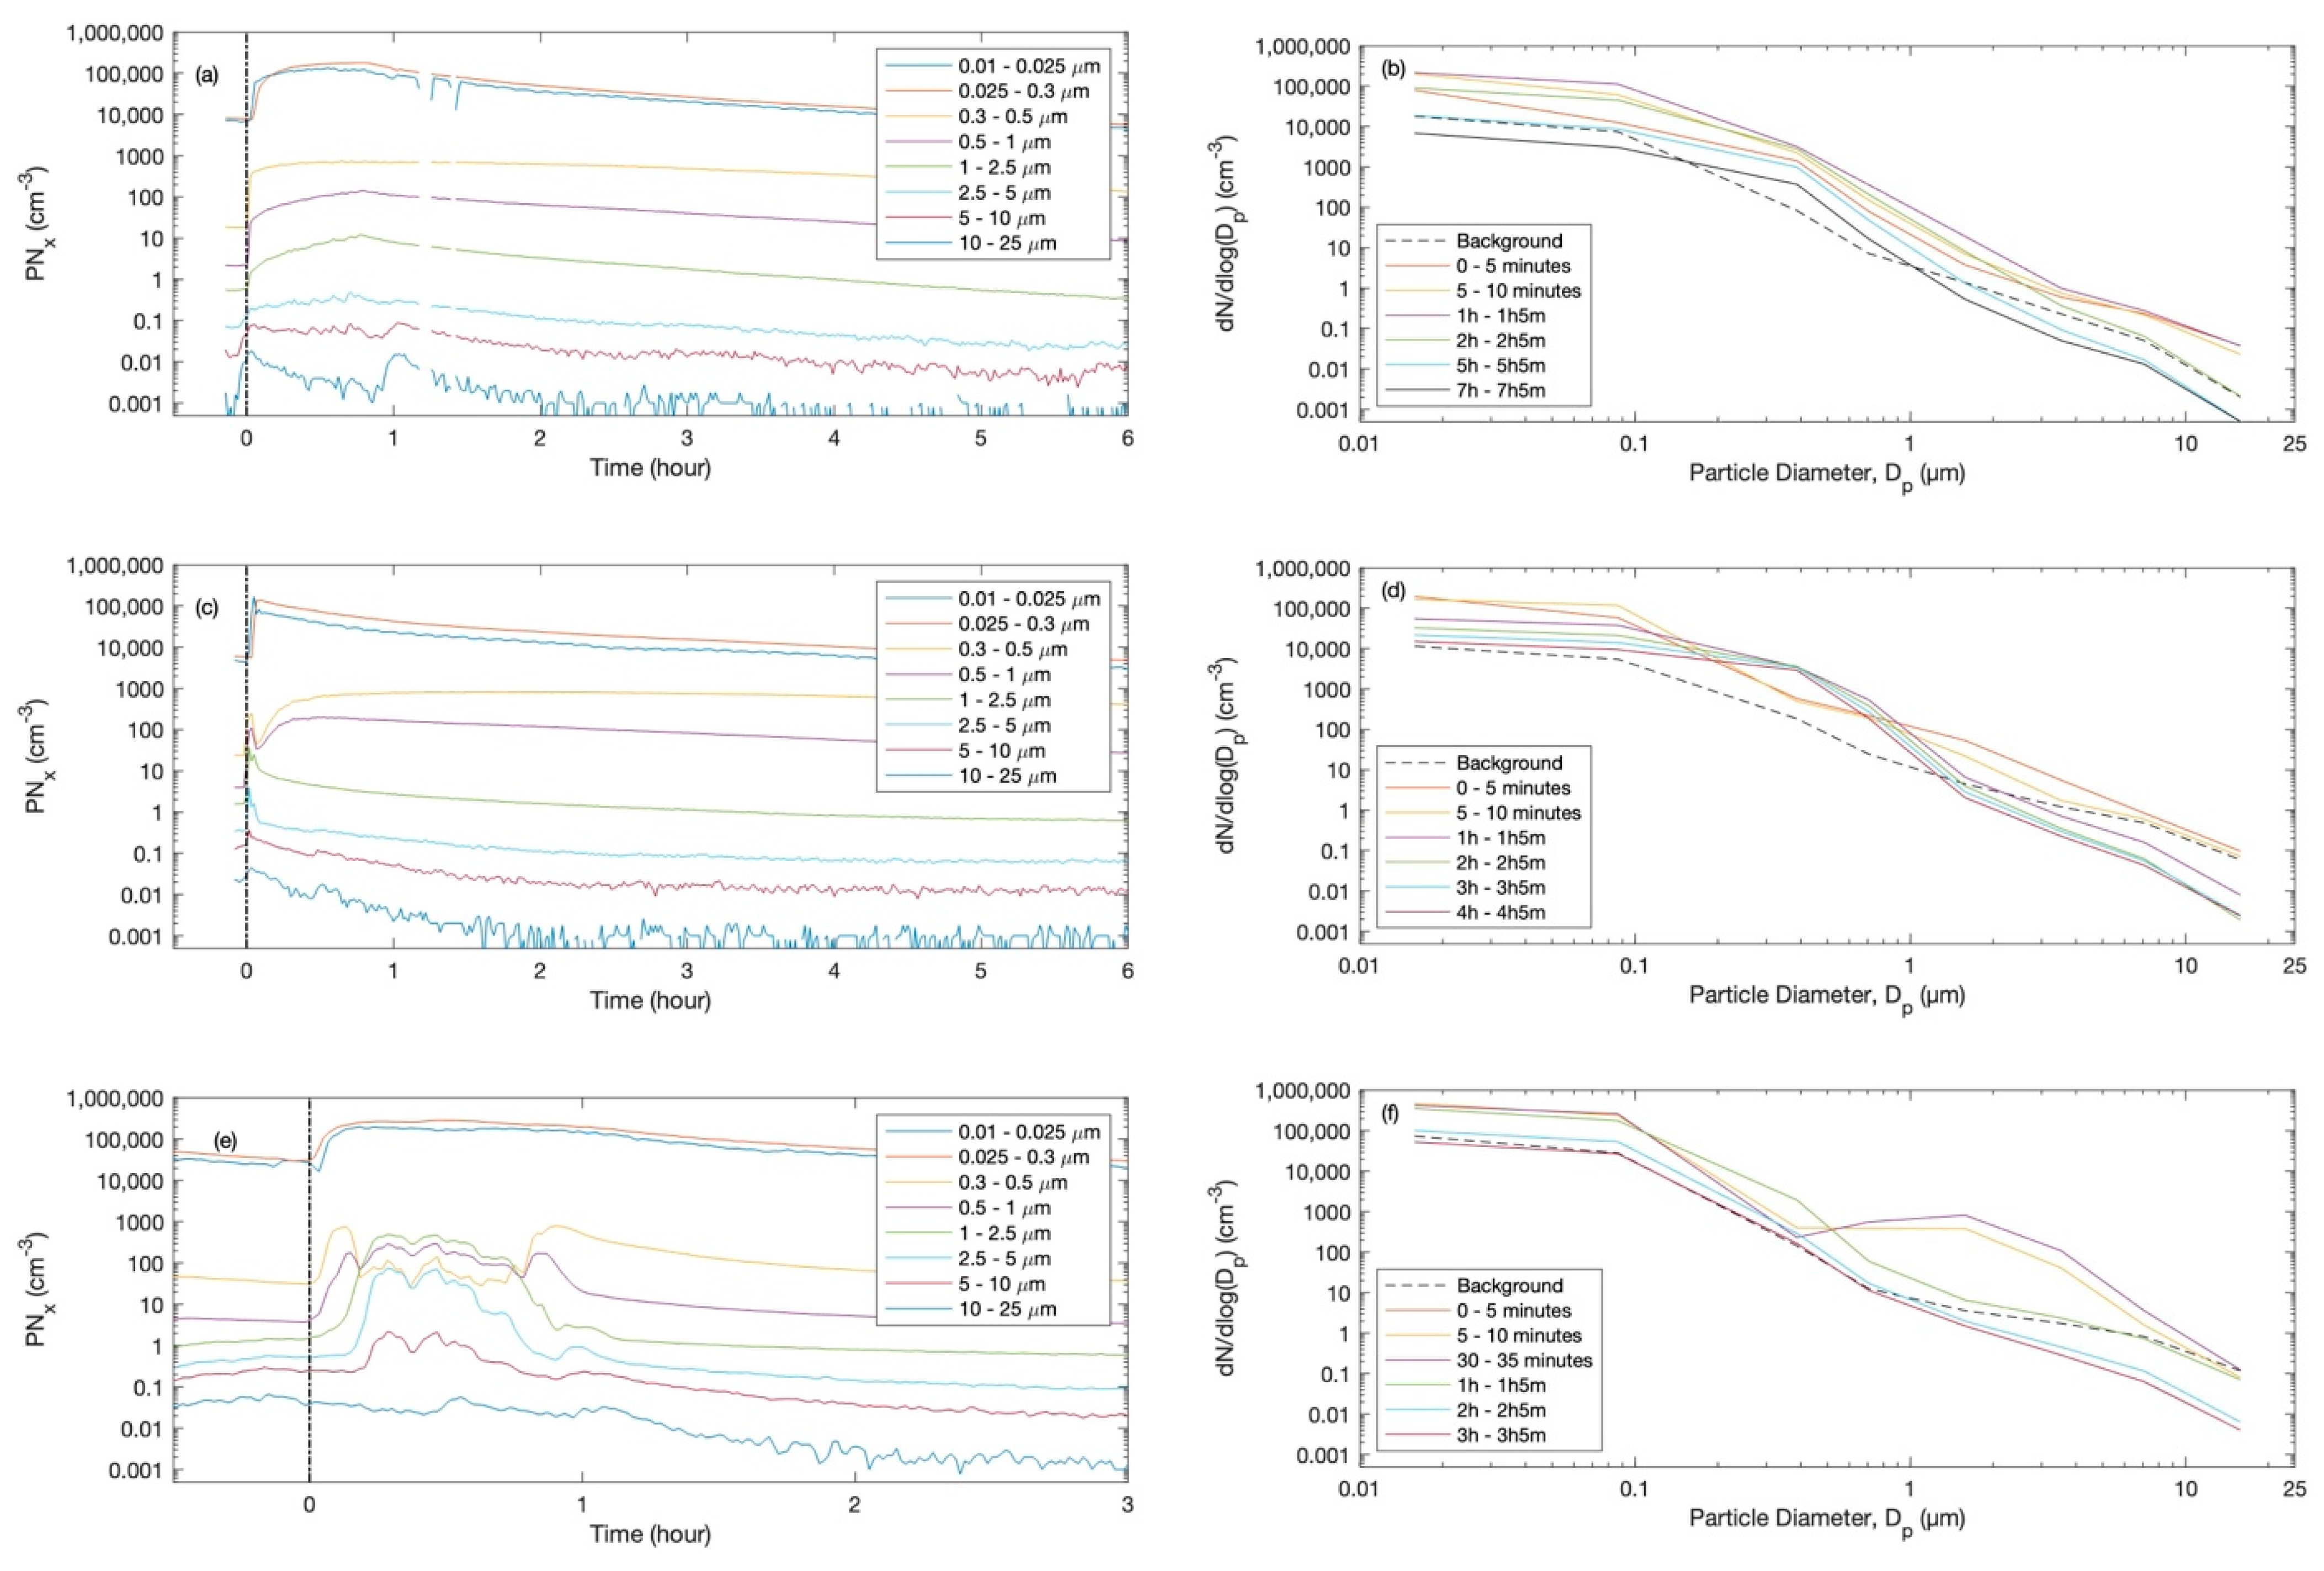
3.1. Temporal Variation, Size Distirbutions, and Particle Losses
3.2. Exposure
3.2.1. Incense Sticks
3.2.2. Cigarette
3.2.3. Shisha
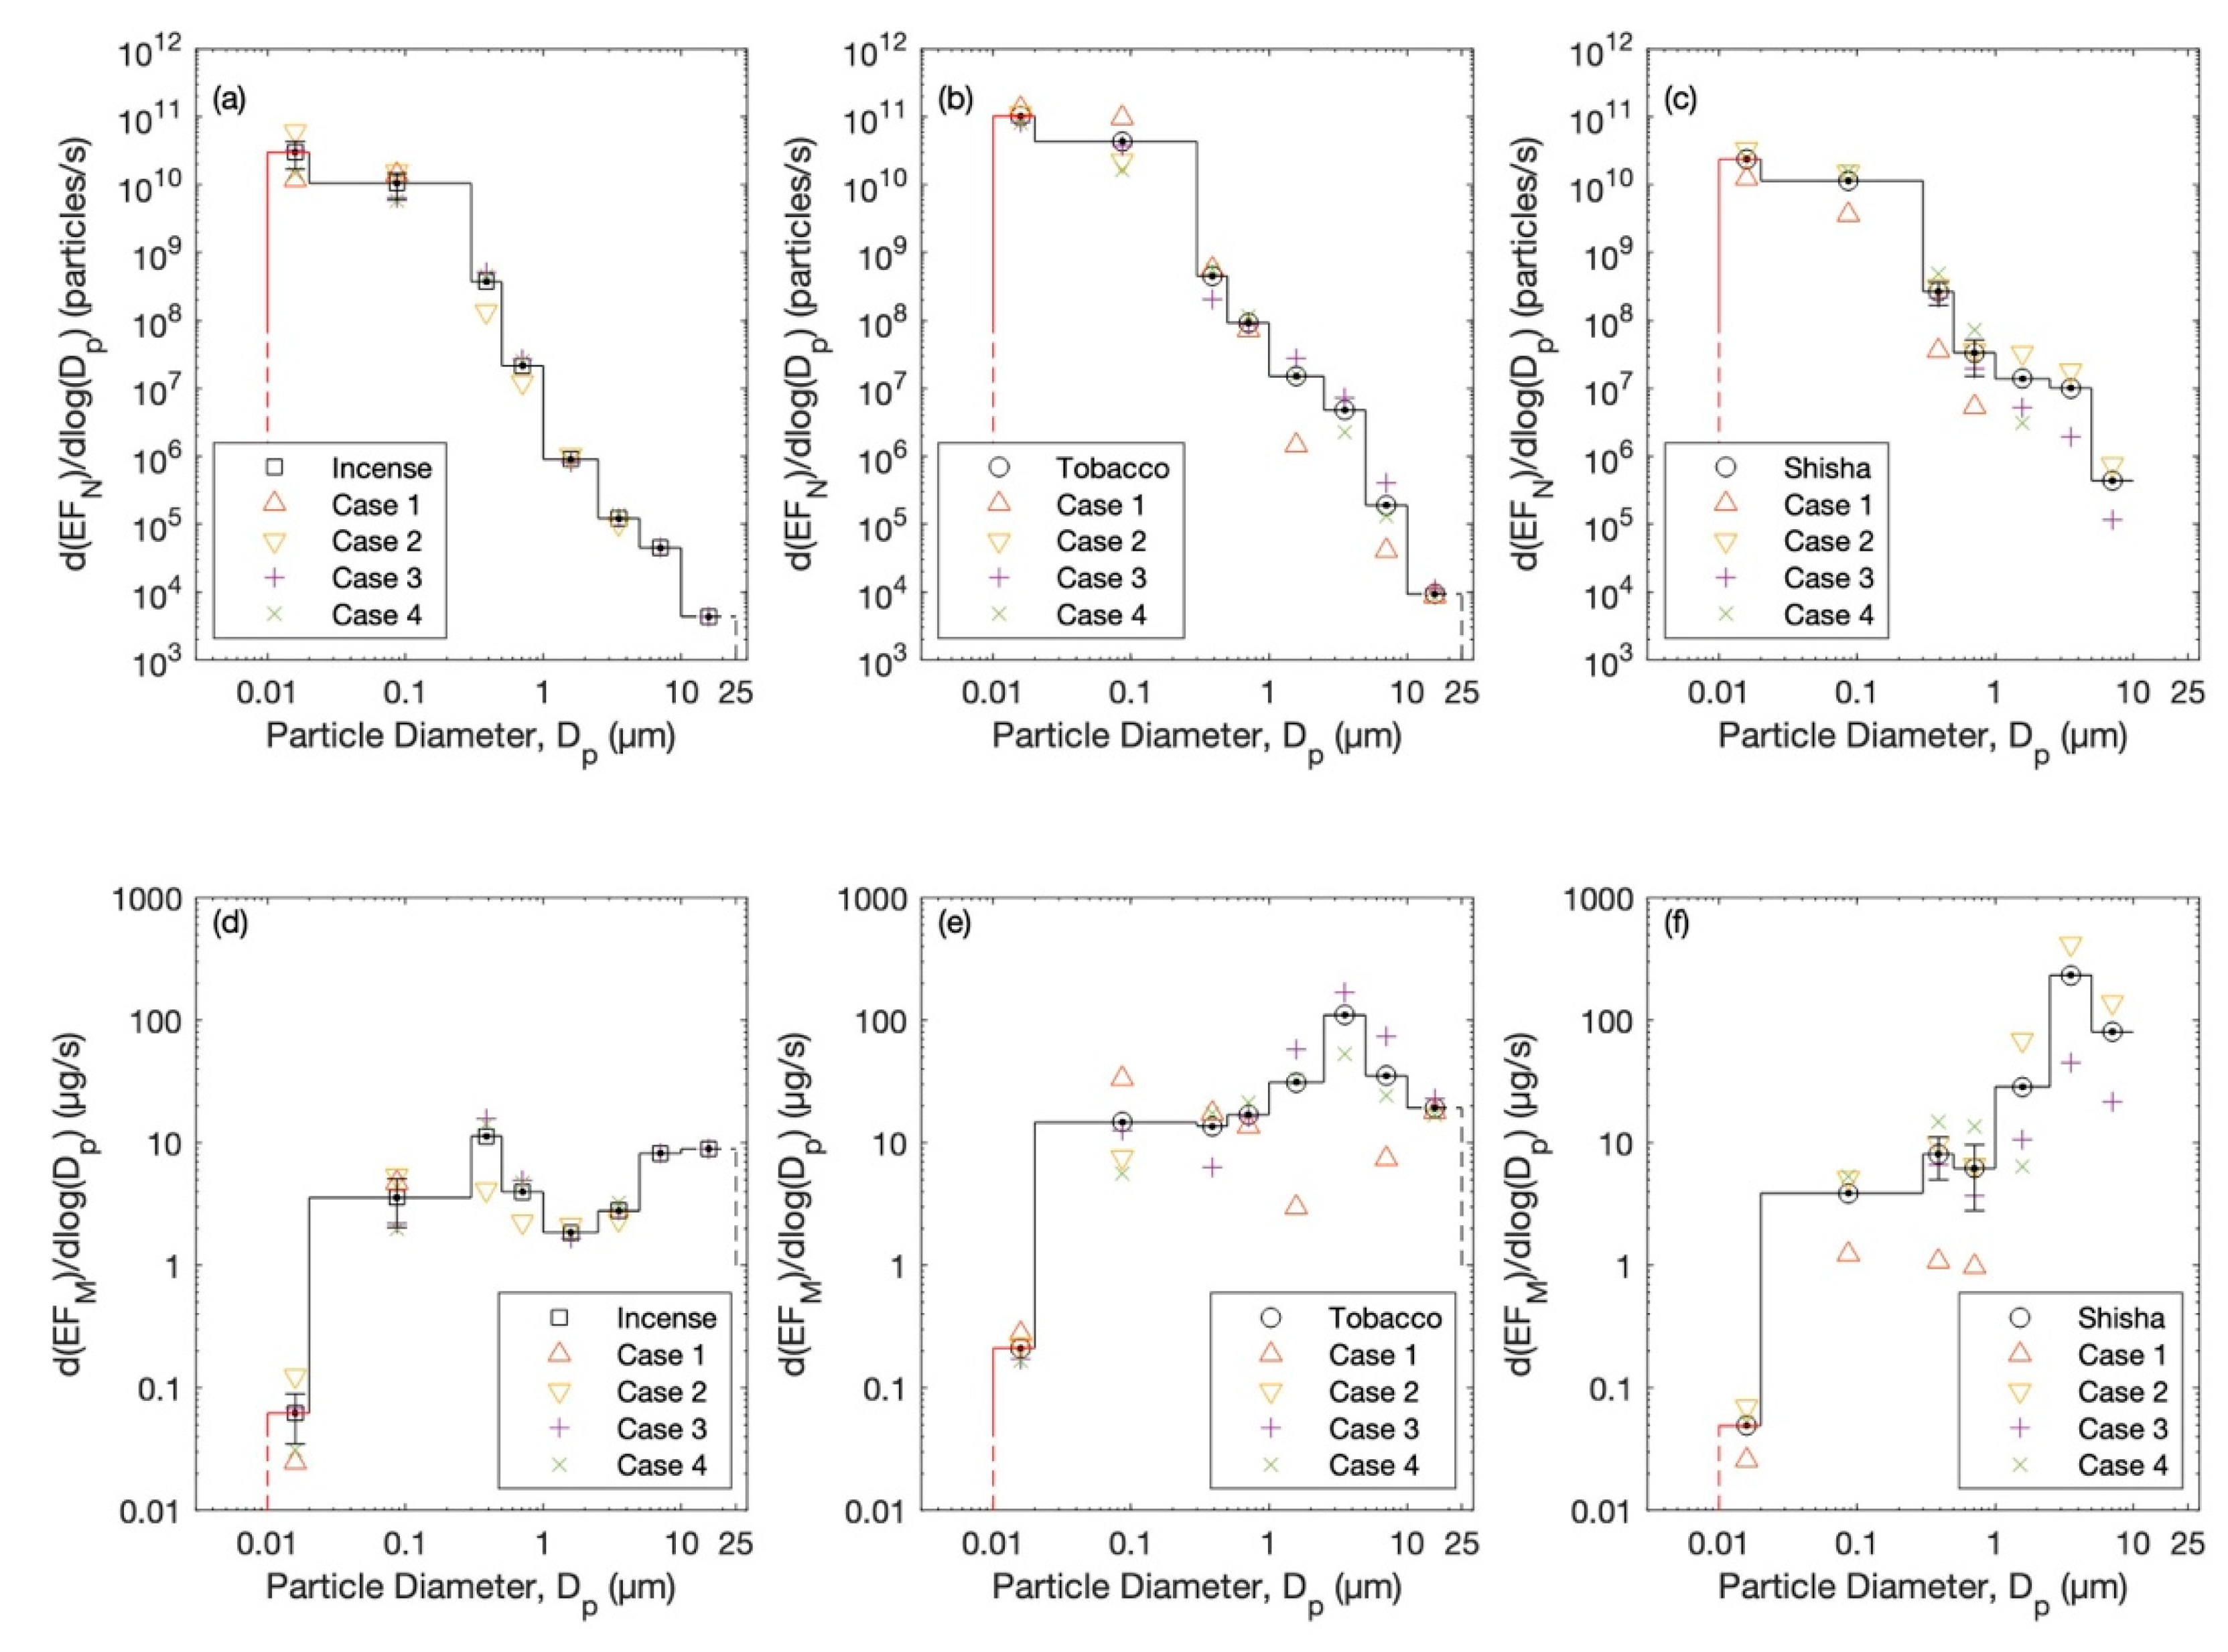
3.3. Particle Emission Rates
3.4. Regional Inhaled Deposited Dose
4. Conclusions
Funding
Institutional Review Board Statement
Informed Consent Statement
Data Availability Statement
Acknowledgments
Conflicts of Interest
References
- Cobb, C.O.; Shihadeh, A.; Weaver, M.F.; Eissenberg, T. Waterpipe Tobacco Smoking and Cigarette Smoking: A Direct Comparison of Toxicant Exposure and Subjective Effects. Nicotine Tob. Res. 2011, 13, 78–87. [Google Scholar] [CrossRef] [PubMed] [Green Version]
- Prignot, J. Risks and Subjective Effects of Waterpipe versus Cigarette Smoking. Breathe 2011, 7, 371. [Google Scholar] [CrossRef]
- Goel, A.; Wathore, R.; Chakraborty, T.; Agrawal, M. Characteristics of Exposure to Particles Due to Incense Burning inside Temples in Kanpur, India. Aerosol Air Qual. Res. 2017, 17, 608–615. [Google Scholar] [CrossRef] [Green Version]
- Fang, G.-C.; Chu, C.-C.; Wu, Y.-S.; Fu, P.P.-C. Emission Characters of Particulate Concentrations and Dry Deposition Studies for Incense Burning at a Taiwanese Temple. Toxicol. Ind. Health 2002, 18, 183–190. [Google Scholar] [CrossRef]
- Chiang, K.-C.; Chio, C.-P.; Chiang, Y.-H.; Liao, C.-M. Assessing Hazardous Risks of Human Exposure to Temple Airborne Polycyclic Aromatic Hydrocarbons. J. Hazard. Mater. 2009, 166, 676–685. [Google Scholar] [CrossRef]
- Hu, M.-T.; Chen, S.-J.; Huang, K.-L.; Lin, Y.-C.; Lee, W.-J.; Chang-Chien, G.-P.; Tsai, J.-H.; Lee, J.-T.; Chiu, C.-H. Characteritization of, and Health Risks from, Polychlorinated Dibenzo-p-Dioxins/Dibenzofurans from Incense Burned in a Temple. Sci. Total. Environ. 2009, 407, 4870–4875. [Google Scholar] [CrossRef]
- Bhadauria, V.; Parmar, D.; Ganguly, R.; Rathi, A.K.; Kumar, P. Exposure Assessment of PM2.5 in Temple Premises and Crematoriums in Kanpur, India. Environ. Sci. Pollut. Res. 2022, 29, 38374–38384. [Google Scholar] [CrossRef]
- Polednik, B. Particle Exposure in a Baroque Church during Sunday Masses. Environ. Res. 2013, 126, 215–220. [Google Scholar] [CrossRef]
- Maziak, W. The Global Epidemic of Waterpipe Smoking. Addict. Behav. 2011, 36, 1–5. [Google Scholar] [CrossRef] [Green Version]
- Maziak, W. The Waterpipe: An Emerging Global Risk for Cancer. Cancer Epidemiol. 2013, 37, 1–4. [Google Scholar] [CrossRef]
- Azab, M.; Khabour, O.F.; Alkaraki, A.K.; Eissenberg, T.; Alzoubi, K.H.; Primack, B.A. Water Pipe Tobacco Smoking among University Students in Jordan. Nicotine Tob. Res. 2010, 12, 606–612. [Google Scholar] [CrossRef] [PubMed] [Green Version]
- Warren, C.W.; Lea, V.; Lee, J.; Jones, N.R.; Asma, S.; McKenna, M. Change in Tobacco Use among 13-15 Year Olds between 1999 and 2008: Findings from the Global Youth Tobacco Survey. Glob. Health Promot. 2009, 16 (Suppl. S2), 38–90. [Google Scholar] [CrossRef] [PubMed]
- El-Awa, F.; Warren, C.W.; Jones, N.R. Changes in Tobacco Use among 13-15-Year-Olds between 1999 and 2007: Findings from the Eastern Mediterranean Region. East. Mediterr. Health J. 2010, 16, 266–273. [Google Scholar] [CrossRef] [PubMed]
- Erguder, T.; Cakir, B.; Babalioglu, N.; Dogusan, H.; Turkoral, E.; Warren, C.W. Tobacco Use among Institutionalized Adolescents in Turkey: Does Social Environment Affect the Risk? Int. J. Public Health 2009, 54, 379–389. [Google Scholar] [CrossRef]
- Warren, C.W.; Erguder, T.; Lee, J.; Lea, V.; Sauer, A.G.; Jones, N.R.; Bilir, N. Effect of Policy Changes on Cigarette Sales: The Case of Turkey. Eur. J. Public Health 2012, 22, 712–716. [Google Scholar] [CrossRef]
- Koh, H.K.; Alpert, H.R.; Judge, C.M.; Caughey, R.W.; Elqura, L.J.; Connolly, G.N.; Warren, C.W. Understanding Worldwide Youth Attitudes towards Smoke-Free Policies: An Analysis of the Global Youth Tobacco Survey. Tob. Control. 2011, 20, 219–225. [Google Scholar] [CrossRef]
- Barbouni, A.; Hadjichristodoulou, C.; Merakou, K.; Antoniadou, E.; Kourea, K.; Miloni, E.; Warren, C.W.; Rahiotis, G.; Kremastinou, J. Tobacco Use, Exposure to Secondhand Smoke, and Cessation Counseling Among Health Professions Students: Greek Data from the Global Health Professions Student Survey (GHPSS). Int. J. Environ. Res. Public Health 2012, 9, 331–342. [Google Scholar] [CrossRef] [Green Version]
- Warren, C.W.; Jones, N.R.; Peruga, A.; Chauvin, J.; Baptiste, J.P.; Costa de Silva, V.; el Awa, F.; Tsouros, A.; Rahman, K.; Fishburn, B.; et al. Global Youth Tobacco Surveillance, 2000–2007. MMWR. Surveill. Summ. Morb. Mortal. Wkly. Rep. Surveill. Summ./CDC 2008, 57, 1–28. [Google Scholar]
- Basir, F.; Khan, M.S.; Ahmed, B.; Farooq, W.; Virji, R.N. The Frequency of Shisha (Waterpipe) Smoking in Students of Different Age Groups. J. Coll. Physicians Surg. Pak. 2014, 24, 265–268. [Google Scholar]
- Jawaid, A.; Zafar, A.M.; Rehman, T.-U.; Nazir, M.R.; Ghafoor, Z.A.; Afzal, O.; Khan, J.A. Knowledge, Attitudes and Practice of University Students Regarding Waterpipe Smoking in Pakistan. Int. J. Tuberc. Lung Dis. 2008, 12, 1077–1084. [Google Scholar]
- Anjum, Q.; Ahmed, F.; Ashfaq, T. Knowledge, Attitude and Perception of Water Pipe Smoking (Shisha) among Adolescents Aged 14–19 Years. J. Pak. Med. Assoc. 2008, 58, 312–317. [Google Scholar] [PubMed]
- Hussein, T.; Alameer, A.; Jaghbeir, O.; Albeitshaweesh, K.; Malkawi, M.; Boor, B.E.; Koivisto, A.J.; Löndahl, J.; Alrifai, O.; Al-Hunaiti, A. Indoor Particle Concentrations, Size Distributions, and Exposures in Middle Eastern Microenvironments. Atmosphere 2020, 11, 41. [Google Scholar] [CrossRef] [Green Version]
- Hussein, T. Indoor-to-Outdoor Relationship of Aerosol Particles inside a Naturally Ventilated Apartment—A Comparison between Single-Parameter Analysis and Indoor Aerosol Model Simulation. Sci. Total Environ. 2017, 596–597, 321–330. [Google Scholar] [CrossRef] [PubMed]
- Yeatts, K.B.; El-Sadig, M.; Leith, D.; Kalsbeek, W.; Al-Maskari, F.; Couper, D.; Funk, W.E.; Zoubeidi, T.; Chan, R.L.; Trent, C.; et al. Indoor Air Pollutants and Health in the United Arab Emirates. Environ. Health Perspect. 2012, 120, 687–694. [Google Scholar] [CrossRef]
- Blank, M.D.; Brown, K.W.; Goodman, R.J.; Eissenberg, T. An Observational Study of Group Waterpipe Use in a Natural Environment. Nicotine Tob. Res. 2014, 16, 93–99. [Google Scholar] [CrossRef] [Green Version]
- Salloum, R.G.; Thrasher, J.F.; Kates, F.R.; Maziak, W. Water Pipe Tobacco Smoking in the United States: Findings from the National Adult Tobacco Survey. Prev. Med. 2015, 71, 88–93. [Google Scholar] [CrossRef] [Green Version]
- Salloum, R.G.; Nakkash, R.; Abu-Rmeileh, N.M.E.; Hamadeh, R.R.; Darawad, M.W.; Kheirallah, K.A.; Al-Farsi, Y.; Yusufali, A.; Thomas, J.; Mostafa, A.; et al. Individual-Level Determinants of Waterpipe Smoking Demand in Four Eastern-Mediterranean Countries. Health Promot. Int. 2019, 34, 1157–1166. [Google Scholar] [CrossRef]
- Amoatey, P.; Omidvarborna, H.; Baawain, M.S.; Al-Mamun, A. Indoor Air Pollution and Exposure Assessment of the Gulf Cooperation Council Countries: A Critical Review. Environ. Int. 2018, 121, 491–506. [Google Scholar] [CrossRef]
- el Amin, S.E.T. School Smoking Policies and Health Science Students’ Use of Cigarettes, Shisha, and Dipping Tombak in Sudan. Front. Public Health 2019, 7, 290. [Google Scholar] [CrossRef]
- Hensel, E.C.; Sarles, S.E.; Al-Olayan, A.; Difrancesco, A.G.; Jayasekera, S.; Eddingsaas, N.C.; Robinson, R.J. A Proposed Waterpipe Emissions Topography Protocol Reflecting Natural Environment User Behaviour. Int. J. Environ. Res. Public Health 2020, 17, 92. [Google Scholar] [CrossRef] [Green Version]
- Alali, W.Q.; Longenecker, J.C.; Alwotyan, R.; AlKandari, H.; Al-Mulla, F.; al Duwairi, Q. Prevalence of Smoking in the Kuwaiti Adult Population in 2014: A Cross-Sectional Study. Environ. Sci. Pollut. Res. 2021, 28, 10053–10067. [Google Scholar] [CrossRef] [PubMed]
- Erythropel, H.C.; Garcia Torres, D.S.; Woodrow, J.G.; de Winter, T.M.; Falinski, M.M.; Anastas, P.T.; O’Malley, S.S.; Krishnan-Sarin, S.; Zimmerman, J.B. Quantification of Flavorants and Nicotine in Waterpipe Tobacco and Mainstream Smoke and Comparison to E-Cigarette Aerosol. Nicotine Tob. Res. 2021, 23, 600–604. [Google Scholar] [CrossRef] [PubMed]
- Hirpa, S.; Fogarty, A.; Addissie, A.; Bauld, L.; Frese, T.; Unverzagt, S.; Kantelhardt, E.J.; Getachew, S.; Deressa, W. An Emerging Problem of Shisha Smoking among High School Students in Ethiopia. Int. J. Environ. Res. Public Health 2021, 18, 7023. [Google Scholar] [CrossRef] [PubMed]
- Semple, S.; Dobson, R.; O’Donnell, R.; Zainal Abidin, E.; Tigova, O.; Okello, G.; Fernández, E. Smoke-Free Spaces: A Decade of Progress, a Need for More? Tob. Control. 2022, 31, 250–256. [Google Scholar] [CrossRef]
- Azagba, S.; Latham, K.; Shan, L. Waterpipe Tobacco Smoking Trends among Middle and High School Students in the United States from 2011 to 2017. Drug Alcohol Depend. 2019, 200, 19–25. [Google Scholar] [CrossRef]
- Shihadeh, A.; Azar, S.; Antonios, C.; Haddad, A. Towards a Topographical Model of Narghile Water-Pipe Café Smoking: A Pilot Study in a High Socioeconomic Status Neighborhood of Beirut, Lebanon. Pharm. Biochem. Behav. 2004, 79, 75–82. [Google Scholar] [CrossRef]
- Dalibalta, S.; Elsayed, Y.; Alqtaishat, F.; Gomes, I.; Fernandes, N. A Health Risk Assessment of Arabian Incense (Bakhour) Smoke in the United Arab Emirates. Sci. Total Environ. 2015, 511, 684–691. [Google Scholar] [CrossRef]
- King, B.A.; Dube, S.R.; Tynan, M.A. Current Tobacco Use among Adults in the United States: Findings from the National Adult Tobacco Survey. Am. J. Public Health 2012, 102, e93–e100. [Google Scholar] [CrossRef]
- Majeed, B.A.; Sterling, K.L.; Weaver, S.R.; Pechacek, T.F.; Eriksen, M.P. Prevalence and Harm Perceptions of Hookah Smoking among U.S. Adults, 2014–2015. Addict. Behav. 2017, 69, 78–86. [Google Scholar] [CrossRef]
- Robinson, J.N.; Wang, B.; Jackson, K.J.; Donaldson, E.A.; Ryant, C.A. Characteristics of Hookah Tobacco Smoking Sessions and Correlates of Use Frequency among US Adults: Findings from Wave 1 of the Population Assessment of Tobacco and Health (PATH) Study. Nicotine Tob. Res. 2018, 20, 731–740. [Google Scholar] [CrossRef] [Green Version]
- Rezk-Hanna, M.; Macabasco-O’Connell, A.; Woo, M. Hookah Smoking among Young Adults in Southern California. Nurs. Res. 2014, 63, 300–306. [Google Scholar] [CrossRef] [PubMed]
- Hensel, E.C.; Eddingsaas, N.C.; Saleh, Q.M.; Jayasekera, S.; Sarles, S.E.; Difrancesco, A.G.; Robinson, R.J. Proposed Standard Test Protocols and Outcome Measures for Quantitative Comparison of Emissions from Electronic Nicotine Delivery Systems. Int. J. Environ. Res. Public Health 2022, 19, 2144. [Google Scholar] [CrossRef] [PubMed]
- Gordon, T.; Karey, E.; Rebuli, M.E.; Escobar, Y.-N.H.; Jaspers, I.; Chen, L.C. E-Cigarette Toxicology. Annu. Rev. Pharm. Toxicol. 2022, 62, 301–322. [Google Scholar] [CrossRef]
- Stone, M.D.; DeAtley, T.; Pianin, S.; Strasser, A.A.; Audrain-McGovern, J. Switching from Cigarettes to IQOS: A Pilot Examination of IQOS-Associated Reward, Reinforcement, and Abstinence Relief. Drug Alcohol Depend. 2022, 238, 109569. [Google Scholar] [CrossRef] [PubMed]
- Lempert, L.K.; Bialous, S.; Glantz, S. FDA’s Reduced Exposure Marketing Order for IQOS: Why It Is Not a Reliable Global Model. Tob. Control. 2022, 31, E83–E87. [Google Scholar] [CrossRef]
- Uguna, C.N.; Snape, C.E. Should IQOS Emissions Be Considered as Smoke and Harmful to Health? A Review of the Chemical Evidence. ACS. Omega 2022, 7, 22111–22124. [Google Scholar] [CrossRef]
- Orzabal, M.R.; Naik, V.D.; Lee, J.; Hillhouse, A.E.; Brashear, W.A.; Threadgill, D.W.; Ramadoss, J. Impact of E-Cig Aerosol Vaping on Fetal and Neonatal Respiratory Development and Function. Transl. Res. 2022, 246, 102–114. [Google Scholar] [CrossRef]
- Onoue, A.; Inaba, Y.; Machida, K.; Samukawa, T.; Inoue, H.; Kurosawa, H.; Ogata, H.; Kunugita, N.; Omori, H. Association between Fathers’ Use of Heated Tobacco Products and Urinary Cotinine Concentrations in Their Spouses and Children. Int. J. Environ. Res. Public Health 2022, 19, 6275. [Google Scholar] [CrossRef]
- Farrell, K.R.; Weitzman, M.; Karey, E.; Lai, T.K.Y.; Gordon, T.; Xu, S. Passive Exposure to E-Cigarette Emissions Is Associated with Worsened Mental Health. BMC Public Health 2022, 22, 1138. [Google Scholar] [CrossRef]
- Çetintaş, E.; Luo, Y.; Nguyen, C.; Guo, Y.; Li, L.; Zhu, Y.; Ozcan, A. Characterization of Exhaled E-Cigarette Aerosols in a Vape Shop Using a Field-Portable Holographic on-Chip Microscope. Sci. Rep. 2022, 12, 3175. [Google Scholar] [CrossRef]
- Vivarelli, F.; Granata, S.; Rullo, L.; Mussoni, M.; Candeletti, S.; Romualdi, P.; Fimognari, C.; Cruz-Chamorro, I.; Carrillo-Vico, A.; Paolini, M.; et al. On the Toxicity of E-Cigarettes Consumption: Focus on Pathological Cellular Mechanisms. Pharm. Res. 2022, 182, 106315. [Google Scholar] [CrossRef] [PubMed]
- Talih, S.; Balhas, Z.; Eissenberg, T.; Salman, R.; Karaoghlanian, N.; Hellani, A.E.; Baalbaki, R.; Saliba, N.; Shihadeh, A. Effects of User Puff Topography, Device Voltage, and Liquid Nicotine Concentration on Electronic Cigarette Nicotine Yield: Measurements and Model Predictions. Nicotine Tob. Res. 2015, 17, 150–157. [Google Scholar] [CrossRef]
- Amorós-Pérez, A.; Cano-Casanova, L.; Román-Martínez, M.D.C.; Lillo-Ródenas, M.Á. Comparison of Particulate Matter Emission and Soluble Matter Collected from Combustion Cigarettes and Heated Tobacco Products Using a Setup Designed to Simulate Puffing Regimes. Chem. Eng. J. Adv. 2021, 8, 100144. [Google Scholar] [CrossRef]
- Nitta, N.A.; Sato, T.; Komura, M.; Yoshikawa, H.; Suzuki, Y.; Mitsui, A.; Kuwasaki, E.; Takahashi, F.; Kodama, Y.; Seyama, K.; et al. Exposure to the Heated Tobacco Product IQOS Generates Apoptosis-Mediated Pulmonary Emphysema in Murine Lungs. Am. J. Physiol. Lung Cell Mol. Physiol. 2022, 322, L699–L711. [Google Scholar] [CrossRef] [PubMed]
- Wiens, T.; Taylor, J.; Cole, C.; Saravia, S.; Peterson, J.; Lunda, M.; Margetta, J.; D’Heilly, P.; Holzbauer, S.; Lynfield, R. Lessons Learned from the E-Cigarette, or Vaping, Product Use–Associated Lung Injury (EVALI) Outbreak Response, Minnesota, 2019–2020. Public Health Rep. 2022, 137, 1053–1060. [Google Scholar] [CrossRef]
- Raja, A.; Zelikoff, J.T.; Jaimes, E.A. A Contemporary Review of Nephrotoxicity and E-Cigarette Use. Curr. Opin. Toxicol. 2022, 31, 100361. [Google Scholar] [CrossRef]
- McKenzie, C.R.L.; Davis, J.; Dunlop, A.J. E-Cigarette or Vaping Product Use-Associated Lung Injury in an Adolescent. Med. J. Aust. 2022, 216, 374. [Google Scholar] [CrossRef]
- Williams, M.A.; Reddy, G.; Quinn, M.J.; Millikan Bell, A. Toxicological Assessment of Electronic Cigarette Vaping: An Emerging Threat to Force Health, Readiness and Resilience in the U.S. Army. Drug Chem. Toxicol. 2022, 45, 2049–2085. [Google Scholar] [CrossRef]
- Chan, B.S.; Kiss, A.; McIntosh, N.; Sheppeard, V.; Dawson, A.H. E-Cigarette or Vaping Product Use-Associated Lung Injury in an Adolescent. Med. J. Aust. 2021, 215, 313–314.e1. [Google Scholar] [CrossRef]
- Nafees, A.A.; Taj, T.; Kadir, M.M.; Fatmi, Z.; Lee, K.; Sathiakumar, N. Indoor Air Pollution (PM2.5) Due to Secondhand Smoke in Selected Hospitality and Entertainment Venues of Karachi, Pakistan. Tob. Control. 2012, 21, 460–464. [Google Scholar] [CrossRef]
- Russo, E.T.; Hulse, T.E.; Adamkiewicz, G.; Levy, D.E.; Bethune, L.; Kane, J.; Reid, M.; Shah, S.N. Comparison of Indoor Air Quality in Smoke-Permitted and Smoke-Free Multiunit Housing: Findings from the Boston Housing Authority. Nicotine Tob. Res. 2015, 17, 316–322. [Google Scholar] [CrossRef] [PubMed] [Green Version]
- Muñoz, C.; Droppelmann, A.; Erazo, M.; Aceituno, P.; Orellana, C.; Parro, J.; Mesias, S.; Marchetti, N.; Navas-Acien, A.; Iglesias, V. Occupational Exposure to Polycyclic Aromatic Hydrocarbons: A Cross-Sectional Study in Bars and Restaurants in Santiago, Chile. Am. J. Ind. Med. 2016, 59, 887–896. [Google Scholar] [CrossRef] [Green Version]
- Dobson, R.; Demou, E.; Semple, S. Occupational Exposure to Second-Hand Tobacco Smoke: Development of a Job Exposure Matrix. Ann. Work Expo. Health 2021, 65, 1133–1138. [Google Scholar] [CrossRef] [PubMed]
- Puvanesarajah, S.; Tsai, J.; Alexander, D.S.; Tynan, M.A.; Gentzke, A.S. Youth Indoor and Outdoor Exposure to Secondhand Smoke and Secondhand Aerosol. Am. J. Prev. Med. 2022, 62, 903–913. [Google Scholar] [CrossRef]
- Veerabhdrappa, S.K.; Yadav, S.; Ramachandra, S.S.; Dicksit, D.D.; Muttalib, K.B.A.; Zamzuri, A.T.B. Secondhand Smoke Exposure from the Indoor and Outdoor Shisha Centers Located at the Perimeter of Educational Institutions in Malaysia: A Cross-Sectional Study. J. Public Health Policy 2022, 43, 77–88. [Google Scholar] [CrossRef] [PubMed]
- Sureda, X.; Bilal, U.; Fernández, E.; Valiente, R.; Escobar, F.J.; Navas-Acien, A.; Franco, M. Second-Hand Smoke Exposure in Outdoor Hospitality Venues: Smoking Visibility and Assessment of Airborne Markers. Environ. Res. 2018, 165, 220–227. [Google Scholar] [CrossRef]
- Nandasena, S.; Wickremasinghe, A.R.; Lee, K.; Sathiakumar, N. Indoor Fine Particle (PM2.5) Pollution Exposure Due to Secondhand Smoke in Selected Public Places of Sri Lanka. Am. J. Ind. Med. 2012, 55, 1129–1136. [Google Scholar] [CrossRef] [Green Version]
- Kuo, H.-W.; Rees, V.W. Third-Hand Smoke (THS): What Is It and What Should We Do about It? J. Formos. Med. Assoc. 2019, 118, 1478–1479. [Google Scholar] [CrossRef]
- Lidón-Moyano, C.; Fu, M.; Perez-Ortuño, R.; Ballbè, M.; Garcia, E.; Martín-Sánchez, J.C.; Pascual, J.A.; Fernández, E.; Martínez-Sánchez, J.M. Toward a Correct Measure of Third-Hand Exposure. Environ. Res. 2021, 194, 110686. [Google Scholar] [CrossRef]
- Wu, J.-X.; Lau, A.T.Y.; Xu, Y.-M. Indoor Secondary Pollutants Cannot Be Ignored: Third-Hand Smoke. Toxics 2022, 10, 363. [Google Scholar] [CrossRef]
- Lidón-Moyano, C.; Fu, M.; Pérez-Ortuño, R.; Ballbè, M.; Garcia, E.; Martín-Sánchez, J.C.; Pascual, J.A.; Fernández, E.; Martínez-Sánchez, J.M. Third-Hand Exposure at Homes: Assessment Using Salivary Cotinine. Environ. Res. 2021, 196, 110393. [Google Scholar] [CrossRef]
- Özpinar, S.; Demir, Y.; Yazicioğlu, B.; Bayçelebi, S. Pregnant Women’s Beliefs about Third-Hand Smoke and Exposure to Tobacco Smoke. Cent. Eur. J. Public Health 2022, 30, 154–159. [Google Scholar] [CrossRef] [PubMed]
- Borujeni, E.T.; Yaghmaian, K.; Naddafi, K.; Hassanvand, M.S.; Naderi, M. Identification and Determination of the Volatile Organics of Third-Hand Smoke from Different Cigarettes and Clothing Fabrics. J. Environ. Health Sci. Eng. 2022, 20, 53–63. [Google Scholar] [CrossRef] [PubMed]
- Yang, J.; Hashemi, S.; Han, W.; Song, Y.; Lim, Y. Exposure and Risk Assessment of Second-and Third-Hand Tobacco Smoke Using Urinary Cotinine Levels in South Korea. Int. J. Environ. Res. Public Health 2022, 19, 3746. [Google Scholar] [CrossRef]
- Mahabee-Gittens, E.M.; Merianos, A.L.; Matt, G.E. Comment Regarding Categorization of Third-Hand Smoke Exposure in “Third-Hand Exposure at Homes: Assessment Using Salivary Cotinine”. Environ. Res. 2021, 195, 110595. [Google Scholar] [CrossRef] [PubMed]
- Moon, S.Y.; Kim, T.; Kim, Y.-J.; Kim, Y.; Kim, S.Y.; Kang, D. Public Facility Utility and Third-Hand Smoking Exposure without First and Second-Hand Smoking According to Urinary Cotinine Level. Int. J. Environ. Res. Public Health 2019, 16, 855. [Google Scholar] [CrossRef] [Green Version]
- Jiang, W.; Wu, H.; Yu, X.; Wang, Y.; Gu, W.; Wei, W.; Li, B.; Jiang, X.; Wang, Y.; Hou, W.; et al. Third-Hand Smoke Exposure Is Associated with Abnormal Serum Melatonin Level via Hypomethylation of CYP1A2 Promoter: Evidence from Human and Animal Studies. Environ. Pollut. 2021, 277, 116669. [Google Scholar] [CrossRef]
- Lai, F.Y.; Lympousi, K.; Been, F.; Benaglia, L.; Udrisard, R.; Delémont, O.; Esseiva, P.; Thomaidis, N.S.; Covaci, A.; van Nuijs, A.L.N. Levels of 4-(Methylnitrosamino)-1-(3-Pyridyl)-1-Butanone (NNK) in Raw Wastewater as an Innovative Perspective for Investigating Population-Wide Exposure to Third-Hand Smoke. Sci. Rep. 2018, 8, 13254. [Google Scholar] [CrossRef]
- de Granda-Orive, J.I.; Solano-Reina, S.; Jiménez-Ruiz, C.A. Is Smoking Outside an Enclosed Space Enough to Prevent Second and Third-Hand Exposure?|¿Salir a Fumar Fuera de Un Ambiente Cerrado Es Suficiente Para Evitar El Tabaquismo de Segunda y Tercera Mano? Arch. Bronconeumol. 2021, 57, 83–84. [Google Scholar] [CrossRef]
- Shihadeh, A. Investigation of Mainstream Smoke Aerosol of the Argileh Water Pipe. Food Chem. Toxicol. 2003, 41, 143–152. [Google Scholar] [CrossRef]
- Shihadeh, A.; Saleh, R. Polycyclic Aromatic Hydrocarbons, Carbon Monoxide, “Tar”, and Nicotine in the Mainstream Smoke Aerosol of the Narghile Water Pipe. Food Chem. Toxicol. 2005, 43, 655–661. [Google Scholar] [CrossRef] [PubMed]
- al Rashidi, M.; Shihadeh, A.; Saliba, N.A. Volatile Aldehydes in the Mainstream Smoke of the Narghile Waterpipe. Food Chem. Toxicol. 2008, 46, 3546–3549. [Google Scholar] [CrossRef] [PubMed] [Green Version]
- Sepetdjian, E.; Shihadeh, A.; Saliba, N.A. Measurement of 16 Polycyclic Aromatic Hydrocarbons in Narghile Waterpipe Tobacco Smoke. Food Chem. Toxicol. 2008, 46, 1582–1590. [Google Scholar] [CrossRef] [PubMed]
- Eissenberg, T.; Shihadeh, A. Waterpipe Tobacco and Cigarette Smoking. Direct Comparison of Toxicant Exposure. Am. J. Prev. Med. 2009, 37, 518–523. [Google Scholar] [CrossRef] [Green Version]
- Daher, N.; Saleh, R.; Jaroudi, E.; Sheheitli, H.; Badr, T.; Sepetdjian, E.; al Rashidi, M.; Saliba, N.; Shihadeh, A. Comparison of Carcinogen, Carbon Monoxide, and Ultrafine Particle Emissions from Narghile Waterpipe and Cigarette Smoking: Sidestream Smoke Measurements and Assessment of Second-Hand Smoke Emission Factors. Atmos. Environ. 2010, 44, 8–14. [Google Scholar] [CrossRef] [Green Version]
- Kumar, S.R.; Davies, S.; Weitzman, M.; Sherman, S. A Review of Air Quality, Biological Indicators and Health Effects of Second-Hand Waterpipe Smoke Exposure. Tob. Control. 2015, 24, i54–i59. [Google Scholar] [CrossRef]
- Kim, K.-H.; Kabir, E.; Jahan, S.A. Waterpipe Tobacco Smoking and Its Human Health Impacts. J. Hazard Mater. 2016, 317, 229–236. [Google Scholar] [CrossRef]
- Wang, H.; Li, X.; Guo, J.; Peng, B.; Cui, H.; Liu, K.; Wang, S.; Qin, Y.; Sun, P.; Zhao, L.; et al. Distribution of Toxic Chemicals in Particles of Various Sizes from Mainstream Cigarette Smoke. Inhal. Toxicol. 2016, 28, 89–94. [Google Scholar] [CrossRef]
- Phares, D.J.; Collier, S.; Zheng, Z.; Jung, H.S. In-Situ Analysis of the Gas- and Particle-Phase in Cigarette Smoke by Chemical Ionization TOF-MS. J. Aerosol Sci. 2017, 106, 132–141. [Google Scholar] [CrossRef] [Green Version]
- Feliu, A.; Fu, M.; Russo, M.; Martinez, C.; Sureda, X.; López, M.J.; Cortés, N.; Fernández, E. Exposure to Second-Hand Tobacco Smoke in Waterpipe Cafés in Barcelona, Spain: An Assessment of Airborne Nicotine and PM2.5. Environ. Res. 2020, 184, 109347. [Google Scholar] [CrossRef]
- Haiduc, A.; Zanetti, F.; Zhao, X.; Schlage, W.K.; Scherer, M.; Pluym, N.; Schlenger, P.; Ivanov, N.V.; Majeed, S.; Hoeng, J.; et al. Analysis of Chemical Deposits on Tooth Enamel Exposed to Total Particulate Matter from Cigarette Smoke and Tobacco Heating System 2.2 Aerosol by Novel GC–MS Deconvolution Procedures. J. Chromatogr. B Anal. Technol. Biomed. Life Sci. 2020, 1152, 122228. [Google Scholar] [CrossRef] [PubMed]
- Jaccard, G.; Tafin Djoko, D.; Korneliou, A.; Belushkin, M. Analysis of Waterpipe Aerosol Constituents in Accordance with the ISO Standard 22486. Toxicol. Rep. 2020, 7, 1344–1349. [Google Scholar] [CrossRef] [PubMed]
- Martinasek, M.P.; Calvanese, A.V.; Lipski, B.K. A Naturalistic Study of Carbon Monoxide, Heart Rate, Oxygen Saturation, and Perfusion Index in Hookah Lounge Patrons. Respir. Care 2021, 66, 269–274. [Google Scholar] [CrossRef] [PubMed]
- Niu, X.; Jones, T.; BéruBé, K.; Chuang, H.-C.; Sun, J.; Ho, K.F. The Oxidative Capacity of Indoor Source Combustion Derived Particulate Matter and Resulting Respiratory Toxicity. Sci. Total. Environ. 2021, 767, 144391. [Google Scholar] [CrossRef] [PubMed]
- Zhang, S.; Wang, Z.; Zhang, J.; Guo, D.; Chen, Y. Inhalable Cigarette-Burning Particles: Size-Resolved Chemical Composition and Mixing State. Environ. Res. 2021, 202, 111790. [Google Scholar] [CrossRef] [PubMed]
- Amorós-Pérez, A.; Cano-Casanova, L.; Román-Martínez, M.D.C.; Lillo-Ródenas, M.Á. Solid Matter and Soluble Compounds Collected from Cigarette Smoke and Heated Tobacco Product Aerosol Using a Laboratory Designed Puffing Setup. Environ. Res. 2022, 206, 112619. [Google Scholar] [CrossRef] [PubMed]
- Holt, J.C.M.; Mayer-Helm, B.; Gafner, J.; Zierlinger, M.; Hirn, C.; Paschke, T.; Eilenberger, G.; Kuba, M.; Pummer, S.; Charriere, M. Investigating the Transfer Rate of Waterpipe Additives to Smoke as an Integral Part of Toxicological Risk Assessments. Toxicol. Rep. 2022, 9, 945–950. [Google Scholar] [CrossRef]
- Jung, C.-C.; Syu, Z.-H.; Su, H.-J.; Lian, P.-Y.; Chen, N.-T. Stable C and N Isotopes of PM2.5 and Size-Segregated Particles Emitted from Incense Stick and Cigarette Burning. Environ. Res. 2022, 212, 113346. [Google Scholar] [CrossRef]
- Fromme, H.; Dietrich, S.; Heitmann, D.; Dressel, H.; Diemer, J.; Schulz, T.; Jörres, R.A.; Berlin, K.; Völkel, W. Indoor Air Contamination during a Waterpipe (Narghile) Smoking Session. Food Chem. Toxicol. 2009, 47, 1636–1641. [Google Scholar] [CrossRef]
- Schubert, J.; Müller, F.D.; Schmidt, R.; Luch, A.; Schulz, T.G. Waterpipe Smoke: Source of Toxic and Carcinogenic VOCs, Phenols and Heavy Metals? Arch. Toxicol. 2015, 89, 2129–2139. [Google Scholar] [CrossRef]
- Bernd, K.; DeGrood, D.; Stadtler, H.; Coats, S.; Carmack, D.; Mailig, R.; Lidsky, S.; Hauser, C. Contributions of Charcoal, Tobacco, and Syrup to the Toxicity and Particle Distribution of Waterpipe Tobacco Smoke. Toxicol. Lett. 2019, 313, 60–65. [Google Scholar] [CrossRef] [PubMed]
- Ho, S.S.H.; Yu, J.Z. Concentrations of Formaldehyde and Other Carbonyls in Environments Affected by Incense Burning. J. Environ. Monit. 2002, 4, 728–733. [Google Scholar] [CrossRef] [PubMed]
- Chuang, H.-C.; Jones, T.; Chen, Y.; Bell, J.; Wenger, J.; Bérubé, K. Characterisation of Airborne Particles and Associated Organic Components Produced from Incense Burning. Anal. Bioanal. Chem. 2011, 401, 3095–3102. [Google Scholar] [CrossRef] [PubMed]
- See, S.W.; Balasubramanian, R. Characterization of Fine Particle Emissions from Incense Burning. Build. Environ. 2011, 46, 1074–1080. [Google Scholar] [CrossRef]
- Stabile, L.; Fuoco, F.C.; Buonanno, G. Characteristics of Particles and Black Carbon Emitted by Combustion of Incenses, Candles and Anti-Mosquito Products. Build. Environ. 2012, 56, 184–191. [Google Scholar] [CrossRef]
- Manoukian, A.; Quivet, E.; Temime-Roussel, B.; Nicolas, M.; Maupetit, F.; Wortham, H. Emission Characteristics of Air Pollutants from Incense and Candle Burning in Indoor Atmospheres. Environ. Sci. Pollut. Res. 2013, 20, 4659–4670. [Google Scholar] [CrossRef] [PubMed]
- Hwang, Y.-H.; Lin, Y.-S.; Lin, C.-Y.; Wang, I.-J. Incense Burning at Home and the Blood Lead Level of Preschoolers in Taiwan. Environ. Sci. Pollut. Res. 2014, 21, 13480–13487. [Google Scholar] [CrossRef]
- Višić, B.; Kranjc, E.; Pirker, L.; Bačnik, U.; Tavčar, G.; Škapin, S.; Remškar, M. Incense Powder and Particle Emission Characteristics during and after Burning Incense in an Unventilated Room Setting. Air Qual. Atmos. Health 2018, 11, 649–663. [Google Scholar] [CrossRef]
- Ndong Ba, A.; Verdin, A.; Cazier, F.; Garcon, G.; Thomas, J.; Cabral, M.; Dewaele, D.; Genevray, P.; Garat, A.; Allorge, D.; et al. Individual Exposure Level Following Indoor and Outdoor Air Pollution Exposure in Dakar (Senegal). Environ. Pollut. 2019, 248, 397–407. [Google Scholar] [CrossRef]
- Chinh, N.N.B.; Fujii, Y.; Hien, T.T.; Takenaka, N. Characteristics of Gas Phase Carbonyl Emission and Excess Risk from Incense Stick Burning. Water Air Soil Pollut. 2020, 231, 297. [Google Scholar] [CrossRef]
- Vora, A.; Chalbot, M.-C.G.; Shin, J.Y.; Kavouras, I.G. Size Distribution and Lung Deposition of Particle Mass Generated by Indoor Activities. Indoor Built Environ. 2021, 30, 1344–1352. [Google Scholar] [CrossRef]
- Thuy, N.T.; May, D.T.; Thao, D.N.P.; Thuy, V.T.T.; Thanh, D.V.; Thanh, N.T.; Huy, N.N. Field Study of Visitors’ Behavior in Incense Burning and Its Induced Air Pollution Assessment and Treatment. Environ. Sci. Pollut. Res. 2022, 29, 45933–45946. [Google Scholar] [CrossRef] [PubMed]
- Yang, T.-T.; Ho, S.-C.; Chuang, L.-T.; Chuang, H.-C.; Li, Y.-T.; Wu, J.-J. Characterization of Particulate-Phase Polycyclic Aromatic Hydrocarbons Emitted from Incense Burning and Their Bioreactivity in RAW264.7 Macrophage. Environ. Pollut. 2017, 220, 1190–1198. [Google Scholar] [CrossRef] [PubMed]
- Bu-Olayan, A.H.; Thomas, B.V. Exposition of Respiratory Ailments from Trace Metals Concentrations in Incenses. Sci. Rep. 2021, 11, 10210. [Google Scholar] [CrossRef] [PubMed]
- Raad, D.; Gaddam, S.; Schunemann, H.J.; Irani, J.; Abou Jaoude, P.; Honeine, R.; Akl, E.A. Effects of Water-Pipe Smoking on Lung Function: A Systematic Review and Meta-Analysis. Chest 2011, 139, 764–774. [Google Scholar] [CrossRef] [PubMed]
- Tse, L.A.; Yu, I.T.-S.; Qiu, H.; Au, J.S.K.; Wang, X.-R. A Case-Referent Study of Lung Cancer and Incense Smoke, Smoking, and Residential Radon in Chinese Men. Environ. Health Perspect 2011, 119, 1641–1646. [Google Scholar] [CrossRef] [PubMed]
- Almedawar, M.M.; Walsh, J.L.; Isma’eel, H.A. Waterpipe Smoking and Risk of Coronary Artery Disease. Curr. Opin. Cardiol. 2016, 31, 545–550. [Google Scholar] [CrossRef]
- El-Zaatari, Z.M.; Chami, H.A.; Zaatari, G.S. Health Effects Associated with Waterpipe Smoking. Tob. Control. 2015, 24, i31–i43. [Google Scholar] [CrossRef] [Green Version]
- Veen, M. Carbon Monoxide Poisoning Caused by Water Pipe Smoking: A Case Series. J. Emerg. Med. 2016, 51, e41–e44. [Google Scholar] [CrossRef]
- Chen, Y.C.; Ho, W.C.; Yu, Y.H. Adolescent Lung Function Associated with Incense Burning and Other Environmental Exposures at Home. Indoor. Air. 2017, 27, 746–752. [Google Scholar] [CrossRef]
- Kuo, S.-C.; Tsai, Y.I. Emission Characteristics of Allergenic Terpenols in PM2.5 Released from Incense Burning and the Effect of Light on the Emissions. Sci. Total Environ. 2017, 584–585, 495–504. [Google Scholar] [CrossRef] [PubMed]
- Eichhorn, L.; Michaelis, D.; Kemmerer, M.; Jüttner, B.; Tetzlaff, K. Carbon Monoxide Poisoning from Waterpipe Smoking: A Retrospective Cohort Study. Clin. Toxicol. 2018, 56, 264–272. [Google Scholar] [CrossRef]
- Kammoolkon, R.; Taneepanichskul, N.; Pitaknoppakul, N.; Lertmaharit, S.; Lohsoonthorn, V. Incense Smoke and Increasing Carotid Intima Media Thickness: A Cross-Sectional Study of the Thai-Vietnamese Community. Asia Pac. J. Public Health 2018, 30, 178–187. [Google Scholar] [CrossRef] [PubMed]
- Wei, C.-F.; Chen, M.-H.; Lin, C.-C.; Guo, Y.L.; Lin, S.-J.; Hsieh, W.-S.; Chen, P.-C. Household Incense Burning and Infant Gross Motor Development: Results from the Taiwan Birth Cohort Study. Environ. Int. 2018, 115, 110–116. [Google Scholar] [CrossRef] [PubMed]
- Ghosh, B.; Reyes-Caballero, H.; Akgün-Ölmez, S.G.; Nishida, K.; Chandrala, L.; Smirnova, L.; Biswal, S.; Sidhaye, V.K. Effect of Sub-Chronic Exposure to Cigarette Smoke, Electronic Cigarette and Waterpipe on Human Lung Epithelial Barrier Function. BMC. Pulm. Med. 2020, 20, 216. [Google Scholar] [CrossRef]
- Guo, S.-E.; Chi, M.-C.; Lin, C.-M.; Yang, T.-M. Contributions of Burning Incense on Indoor Air Pollution Levels and on the Health Status of Patients with Chronic Obstructive Pulmonary Disease. PeerJ 2020, 8, e9768. [Google Scholar] [CrossRef]
- Wei, C.-F.; Lin, C.-C.; Tsai, M.-S.; Guo, Y.L.; Lin, S.-J.; Liao, H.-F.; Hsieh, W.-S.; Chen, M.-H.; Chen, P.-C. Associations between Household Incense Burning and Delayed Motor Development among Preterm Infants Modified by Gestational Age and Maternal Educational Status. Indoor Air 2021, 31, 660–672. [Google Scholar] [CrossRef]
- Hung, D.-Z.; Yang, K.-W.; Wu, C.-C.; Hung, Y.-H. Lead Poisoning Due to Incense Burning: An Outbreak in a Family. Clin. Toxicol. 2021, 59, 756–759. [Google Scholar] [CrossRef]
- Hsieh, S.-W.; Chen, S.-C.; Chen, C.-H.; Wu, M.-T.; Hung, C.-H. Risk of Cognitive Impairment from Exposure to Incense Smoke. Int. J. Environ. Health Res. 2021. [Google Scholar] [CrossRef]
- Lee, C.-W.; Vo, T.T.T.; Wee, Y.; Chiang, Y.-C.; Chi, M.-C.; Chen, M.-L.; Hsu, L.-F.; Fang, M.-L.; Lee, K.-H.; Guo, S.-E.; et al. The Adverse Impact of Incense Smoke on Human Health: From Mechanisms to Implications. J. Inflamm. Res. 2021, 14, 5451–5472. [Google Scholar] [CrossRef]
- Qasim, H.; Alarabi, A.B.; Alzoubi, K.H.; Karim, Z.A.; Alshbool, F.Z.; Khasawneh, F.T. The Effects of Hookah/Waterpipe Smoking on General Health and the Cardiovascular System. Environ. Health Prev. Med. 2019, 24, 58. [Google Scholar] [CrossRef] [PubMed] [Green Version]
- Yadav, V.K.; Malik, P.; Tirth, V.; Khan, S.H.; Yadav, K.K.; Islam, S.; Choudhary, N.; Inwati, G.K.; Arabi, A.; Kim, D.-H.; et al. Health and Environmental Risks of Incense Smoke: Mechanistic Insights and Cumulative Evidence. J. Inflamm. Res. 2022, 15, 2665–2693. [Google Scholar] [CrossRef] [PubMed]
- Hussein, T.; Al-Jaghbeer, O.; Bqour, N.; Zidan, B.; Lahlouh, B. Exposure to Aerosols Emitted from Common Heating Combustion Sources Indoors—The Jordanian Case as an Example for Eastern Mediterranean Conditions. Atmosphere 2022, 13, 870. [Google Scholar] [CrossRef]
- Hussein, T.; Kulmala, M. Indoor Aerosol Modeling: Basic Principles and Practical Applications. Water Air Soil Pollut. Focus 2008, 8, 23–34. [Google Scholar] [CrossRef]
- Hussein, T.; Korhonen, H.; Herrmann, E.; Hämeri, K.; Lehtinen, K.E.J.; Kulmala, M. Emission Rates Due to Indoor Activities: Indoor Aerosol Model Development, Evaluation, and Applications. Aerosol Sci. Technol. 2005, 39, 1111–1127. [Google Scholar] [CrossRef]
- Salthammer, T.; Zhao, J.; Schieweck, A.; Uhde, E.; Hussein, T.; Antretter, F.; Künzel, H.; Pazold, M.; Radon, J.; Birmili, W. A Holistic Modeling Framework for Estimating the Influence of Climate Change on Indoor Air Quality. Indoor Air 2022, 32, e13039. [Google Scholar] [CrossRef]
- Hussein, T.; Löndahl, J.; Paasonen, P.; Koivisto, A.J.; Petäjä, T.; Hämeri, K.; Kulmala, M. Modeling Regional Deposited Dose of Submicron Aerosol Particles. Sci. Total Environ. 2013, 458–460, 140–149. [Google Scholar] [CrossRef]
- Hussein, T.; Wierzbicka, A.; Löndahl, J.; Lazaridis, M.; Hänninen, O. Indoor Aerosol Modeling for Assessment of Exposure and Respiratory Tract Deposited Dose. Atmos. Environ. 2015, 106, 402–411. [Google Scholar] [CrossRef]
- Hussein, T.; Saleh, S.S.A.; dos Santos, V.N.; Boor, B.E.; Koivisto, A.J.; Löndahl, J. Regional Inhaled Deposited Dose of Urban Aerosols in an Eastern Mediterranean City. Atmosphere 2019, 10, 530. [Google Scholar] [CrossRef] [Green Version]
- Hussein, T.; Boor, B.E.; Löndahl, J. Regional Inhaled Deposited Dose of Indoor Combustion-Generated Aerosols in Jordanian Urban Homes. Atmosphere 2020, 11, 1150. [Google Scholar] [CrossRef]
- Human Respiratory Tract Model for Radiological Protection. A Report of a Task Group of the International Commission on Radiological Protection. Ann. ICRP 1994, 24, 1–482. [Google Scholar]
- Anjilvel, S.; Asgharian, B. A Multiple-Path Model of Particle Deposition in the Rat Lung. Toxicol. Sci. 1995, 28, 41–50. [Google Scholar] [CrossRef]
- Löndahl, J.; Massling, A.; Pagels, J.; Swietlicki, E.; Vaclavik, E.; Loft, S. Size-Resolved Respiratory-Tract Deposition of Fine and Ultrafine Hydrophobic and Hygroscopic Aerosol Particles during Rest and Exercise. Inhal. Toxicol. 2007, 19, 109–116. [Google Scholar] [CrossRef] [PubMed]
- Maziak, W.; Rastam, S.; Ibrahim, I.; Ward, K.D.; Shihadeh, A.; Eissenberg, T. CO Exposure, Puff Topography, and Subjective Effects in Waterpipe Tobacco Smokers. Nicotine Tob. Res. 2009, 11, 806–811. [Google Scholar] [CrossRef]
- Maziak, W.; Rastam, S.; Shihadeh, A.L.; Bazzi, A.; Ibrahim, I.; Zaatari, G.S.; Ward, K.D.; Eissenberg, T. Nicotine Exposure in Daily Waterpipe Smokers and Its Relation to Puff Topography. Addict. Behav. 2011, 36, 397–399. [Google Scholar] [CrossRef] [Green Version]
- Soule, E.K.; Ramôa, C.; Eissenberg, T.; Cobb, C.O. Differences in Puff Topography, Toxicant Exposure, and Subjective Response between Waterpipe Tobacco Smoking Men and Women. Exp. Clin. Psychopharmacol. 2018, 26, 440–447. [Google Scholar] [CrossRef]
- Hauser, C.D.; Mailig, R.; Stadtler, H.; Reed, J.; Chen, S.; Uffman, E.; Bernd, K. Waterpipe Tobacco Smoke Toxicity: The Impact of Waterpipe Size. Tob. Control. 2019, 29, s90–s94. [Google Scholar] [CrossRef]
- Markowicz, P.; Löndahl, J.; Wierzbicka, A.; Suleiman, R.; Shihadeh, A.; Larsson, L. A Study on Particles and Some Microbial Markers in Waterpipe Tobacco Smoke. Sci. Total. Environ. 2014, 499, 107–113. [Google Scholar] [CrossRef] [Green Version]
- Travers, M.J.; Kulak, J.A.; Vogl, L. Waterpipe Cafés Are Hazardous to Your Health: Determination of a Waterpipe Specific Calibration Factor. Int. J. Hyg. Environ. Health 2018, 221, 48–53. [Google Scholar] [CrossRef]
- Wu, C.L.; Chao, C.Y.H.; Sze-To, G.N.; Wan, M.P.; Chan, T.C. Ultrafine Particle Emissions from Cigarette Smouldering, Incense Burning, Vacuum Cleaner Motor Operation and Cooking. Indoor. Built. Environ. 2012, 21, 782–796. [Google Scholar] [CrossRef]
- Lai, A.C.K.; Nazaroff, W.W. Modeling Indoor Particle Deposition from Turbulent Flow onto Smooth Surfaces. J. Aerosol Sci. 2000, 31, 463–476. [Google Scholar] [CrossRef]
- Hussein, T.; Smolik, J.; Kerminen, V.-M.; Kulmala, M. Modeling Dry Deposition of Aerosol Particles onto Rough Surfaces. Aerosol Sci. Technol. 2012, 46, 44–59. [Google Scholar] [CrossRef] [Green Version]
- See, S.W.; Balasubramanian, R.; Man Joshi, U. Physical Characteristics of Nanoparticles Emitted from Incense Smoke. Sci. Technol. Adv. Mater. 2007, 8, 25–32. [Google Scholar] [CrossRef] [Green Version]
- Kant, N.; Müller, R.; Braun, M.; Gerber, A.; Groneberg, D. Particulate Matter in Second-Hand Smoke Emitted from Different Cigarette Sizes and Types of the Brand Vogue Mainly Smoked by Women. Int. J. Environ. Res. Public Health 2016, 13, 799. [Google Scholar] [CrossRef] [PubMed]
- Braun, M.; Koger, F.; Klingelhöfer, D.; Müller, R.; Groneberg, D.A. Particulate Matter Emissions of Four Different Cigarette Types of One Popular Brand: Influence of Tobacco Strength and Additives. Int. J. Environ. Res. Public Health 2019, 16, 263. [Google Scholar] [CrossRef] [PubMed] [Green Version]
- Adams, H.S.; Nieuwenhuijsen, M.J.; Colvile, R.N. Determinants of Fine Particle (PM2.5) Personal Exposure Levels in Transport Microenvironments, London, UK. Atmos. Environ. 2001, 35, 4557–4566. [Google Scholar] [CrossRef]
- Chan, L.Y.; Lau, W.L.; Zou, S.C.; Cao, Z.X.; Lai, S.C. Exposure Level of Carbon Monoxide and Respirable Suspended Particulate in Public Transportation Modes While Commuting in Urban Area of Guangzhou, China. Atmos. Environ. 2002, 36, 5831–5840. [Google Scholar] [CrossRef]
- Kaur, S.; Nieuwenhuijsen, M.J.; Colvile, R.N. Pedestrian Exposure to Air Pollution along a Major Road in Central London, UK. Atmos. Environ. 2005, 39, 7307–7320. [Google Scholar] [CrossRef]
- Fondelli, M.C.; Chellini, E.; Yli-Tuomi, T.; Cenni, I.; Gasparrini, A.; Nava, S.; Garcia-Orellana, I.; Lupi, A.; Grechi, D.; Mallone, S.; et al. Fine Particle Concentrations in Buses and Taxis in Florence, Italy. Atmos. Environ. 2008, 42, 8185–8193. [Google Scholar] [CrossRef]
- Sohn, H.; Lee, K. Impact of Smoking on In-Vehicle Fine Particle Exposure during Driving. Atmos. Environ. 2010, 44, 3465–3468. [Google Scholar] [CrossRef]
- Buonanno, G.; Morawska, L.; Stabile, L.; Viola, A. Exposure to Particle Number, Surface Area and PM Concentrations in Pizzerias. Atmos. Environ. 2010, 44, 3963–3969. [Google Scholar] [CrossRef] [Green Version]
- Buonanno, G.; Morawska, L.; Stabile, L.; Wang, L.; Giovinco, G. A Comparison of Submicrometer Particle Dose between Australian and Italian People. Environ. Pollut. 2012, 169, 183–189. [Google Scholar] [CrossRef] [PubMed] [Green Version]
- Fuoco, F.C.; Stabile, L.; Buonanno, G.; Trassiera, C.V.; Massimo, A.; Russi, A.; Mazaheri, M.; Morawska, L.; Andrade, A. Indoor Air Quality in Naturally Ventilated Italian Classrooms. Atmosphere 2015, 6, 1652–1675. [Google Scholar] [CrossRef] [Green Version]
- Fuoco, F.C.; Buonanno, G.; Stabile, L.; Vigo, P. Influential Parameters on Particle Concentration and Size Distribution in the Mainstream of E-Cigarettes. Environ. Pollut. 2014, 184, 523–529. [Google Scholar] [CrossRef] [PubMed]
- Stabile, L.; Fuoco, F.C.; Marini, S.; Buonanno, G. Effects of the Exposure to Indoor Cooking-Generated Particles on Nitric Oxide Exhaled by Women. Atmos. Environ. 2015, 103, 238–246. [Google Scholar] [CrossRef]
- Stabile, L.; Dell’Isola, M.; Frattolillo, A.; Massimo, A.; Russi, A. Effect of Natural Ventilation and Manual Airing on Indoor Air Quality in Naturally Ventilated Italian Classrooms. Build. Environ. 2016, 98, 180–189. [Google Scholar] [CrossRef]
- Mazaheri, M.; Lin, W.; Clifford, S.; Yue, D.; Zhai, Y.; Xu, M.; Rizza, V.; Morawska, L. Characteristics of School Children’s Personal Exposure to Ultrafine Particles in Heshan, Pearl River Delta, China—A Pilot Study. Environ. Int. 2019, 132, 105134. [Google Scholar] [CrossRef]
- Hussein, T.; Hämeri, K.; Aalto, P.; Asmi, A.; Kakko, L.; Kulmala, M. Particle Size Characterization and the Indoor-to-Outdoor Relationship of Atmospheric Aerosols in Helsinki. Scand. J. Work Environ. Health 2004, 30 (Suppl. S2), 54–62. [Google Scholar]
- Hussein, T.; Hämeri, K.; Heikkinen, M.S.A.; Kulmala, M. Indoor and Outdoor Particle Size Characterization at a Family House in Espoo-Finland. Atmos. Environ. 2005, 39, 3697–3709. [Google Scholar] [CrossRef]
- Hussein, T.; Glytsos, T.; Ondráček, J.; Dohányosová, P.; Ždímal, V.; Hämeri, K.; Lazaridis, M.; Smolík, J.; Kulmala, M. Particle Size Characterization and Emission Rates during Indoor Activities in a House. Atmos. Environ. 2006, 40, 4285–4307. [Google Scholar] [CrossRef]
- Koivisto, A.J.; Hussein, T.; Niemelä, R.; Tuomi, T.; Hämeri, K. Impact of Particle Emissions of New Laser Printers on Modeled Office Room. Atmos. Environ. 2010, 44, 2140–2146. [Google Scholar] [CrossRef]
- Hussein, T. Particle Size Distributions inside a University Office in Amman, Jordan. Jordan. J. Phys. 2014, 7, 73–83. [Google Scholar]
- Mølgaard, B.; Viitanen, A.-K.; Kangas, A.; Huhtiniemi, M.; Larsen, S.T.; Vanhala, E.; Hussein, T.; Boor, B.E.; Hämeri, K.; Koivisto, A.J. Exposure to Airborne Particles and Volatile Organic Compounds from Polyurethane Molding, Spray Painting, Lacquering, and Gluing in a Workshop. Int. J. Environ. Res. Public Health 2015, 12, 3756. [Google Scholar] [CrossRef] [PubMed] [Green Version]
- Hussein, T.; Dada, L.; Juwhari, H.; Faouri, D. Characterization, Fate, and Re-Suspension of Aerosol Particles (0.3–10 Μm): The Effects of Occupancy and Carpet Use. Aerosol Air Qual. Res. 2015, 15, 2367–2377. [Google Scholar] [CrossRef] [Green Version]
- Lazaridis, M.; Eleftheriadis, K.; Ždímal, V.; Schwarz, J.; Wagner, Z.; Ondráček, J.; Drossinos, Y.; Glytsos, T.; Vratolis, S.; Torseth, K.; et al. Number Concentrations and Modal Structure of Indoor/Outdoor Fine Particles in Four European Cities. Aerosol Air. Qual. Res. 2017, 17, 131–146. [Google Scholar] [CrossRef] [Green Version]
- Maragkidou, A.; Jaghbeir, O.; Hämeri, K.; Hussein, T. Aerosol Particles (0.3–10 μm) inside an Educational Workshop−Emission Rate and Inhaled Deposited Dose. Build. Environ. 2018, 140, 80–89. [Google Scholar] [CrossRef]
- Zhao, J.; Birmili, W.; Hussein, T.; Wehner, B.; Wiedensohler, A. Particle Number Emission Rates of Aerosol Sources in 40 German Households and Their Contributions to Ultrafine and Fine Particle Exposure. Indoor Air 2021, 31, 818–831. [Google Scholar] [CrossRef]
- Viitanen, A.-K.; Kallonen, K.; Kukko, K.; Kanerva, T.; Saukko, E.; Hussein, T.; Hämeri, K.; Säämänen, A. Technical Control of Nanoparticle Emissions from Desktop 3D Printing. Indoor Air 2021, 31, 1061–1071. [Google Scholar] [CrossRef]
- Wierzbicka, A.; Bohgard, M.; Pagels, J.H.; Dahl, A.; Löndahl, J.; Hussein, T.; Swietlicki, E.; Gudmundsson, A. Quantification of Differences between Occupancy and Total Monitoring Periods for Better Assessment of Exposure to Particles in Indoor Environments. Atmos. Environ. 2015, 106, 419–428. [Google Scholar] [CrossRef]
- Stabile, L.; Buonanno, G.; Ficco, G.; Scungio, M. Smokers’ Lung Cancer Risk Related to the Cigarette-Generated Mainstream Particles. J. Aerosol Sci. 2017, 107, 41–54. [Google Scholar] [CrossRef] [Green Version]
- Sahu, S.K.; Tiwari, M.; Bhangare, R.C.; Pandit, G.G. Particle Size Distribution of Mainstream and Exhaled Cigarette Smoke and Predictive Deposition in Human Respiratory Tract. Aerosol Air Qual. Res. 2013, 13, 324–332. [Google Scholar] [CrossRef] [Green Version]
- Li, X.; Kong, H.; Zhang, X.; Peng, B.; Nie, C.; Shen, G.; Liu, H. Characterization of Particle Size Distribution of Mainstream Cigarette Smoke Generated by Smoking Machine with an Electrical Low Pressure Impactor. J. Environ. Sci. 2014, 26, 827–833. [Google Scholar] [CrossRef] [PubMed]
- Jetter, J.J.; Guo, Z.; McBrian, J.A.; Flynn, M.R. Characterization of Emissions from Burning Incense. Sci. Total. Environ. 2002, 295, 51–67. [Google Scholar] [CrossRef] [PubMed]


| Male | Female | ||||||||
|---|---|---|---|---|---|---|---|---|---|
| H | TB | Alv | Total | H | TB | Alv | Total | ||
| Walking | Incense | 1000 | 2500 | 10,200 | 13,700 | 900 | 2300 | 8700 | 12,000 |
| Cigarette | 200 | 400 | 1700 | 2300 | 200 | 400 | 1500 | 2000 | |
| Shisha | 800 | 1800 | 7700 | 10,300 | 700 | 1700 | 6600 | 9000 | |
| Standing | Incense | 900 | 1500 | 3800 | 6300 | 700 | 1300 | 2500 | 4600 |
| Cigarette | 200 | 300 | 600 | 1100 | 100 | 200 | 400 | 800 | |
| Shisha | 700 | 1100 | 2900 | 4700 | 600 | 1000 | 1900 | 3400 | |
| Male | Female | ||||||||
|---|---|---|---|---|---|---|---|---|---|
| H | TB | Alv | Total | H | TB | Alv | Total | ||
| Walking | Incense | 190 | 410 | 1910 | 2500 | 160 | 370 | 1600 | 2130 |
| Cigarette | 40 | 90 | 400 | 520 | 30 | 80 | 340 | 450 | |
| Shisha | 410 | 930 | 3920 | 5270 | 370 | 820 | 3390 | 4580 | |
| Standing | Incense | 340 | 220 | 820 | 1380 | 240 | 200 | 520 | 970 |
| Cigarette | 100 | 40 | 170 | 310 | 70 | 40 | 110 | 220 | |
| Shisha | 1670 | 350 | 1750 | 3760 | 1150 | 300 | 1090 | 2540 |
Disclaimer/Publisher’s Note: The statements, opinions and data contained in all publications are solely those of the individual author(s) and contributor(s) and not of MDPI and/or the editor(s). MDPI and/or the editor(s) disclaim responsibility for any injury to people or property resulting from any ideas, methods, instructions or products referred to in the content. |
© 2022 by the author. Licensee MDPI, Basel, Switzerland. This article is an open access article distributed under the terms and conditions of the Creative Commons Attribution (CC BY) license (https://creativecommons.org/licenses/by/4.0/).
Share and Cite
Hussein, T. Indoor Exposure and Regional Inhaled Deposited Dose Rate during Smoking and Incense Stick Burning—The Jordanian Case as an Example for Eastern Mediterranean Conditions. Int. J. Environ. Res. Public Health 2023, 20, 587. https://doi.org/10.3390/ijerph20010587
Hussein T. Indoor Exposure and Regional Inhaled Deposited Dose Rate during Smoking and Incense Stick Burning—The Jordanian Case as an Example for Eastern Mediterranean Conditions. International Journal of Environmental Research and Public Health. 2023; 20(1):587. https://doi.org/10.3390/ijerph20010587
Chicago/Turabian StyleHussein, Tareq. 2023. "Indoor Exposure and Regional Inhaled Deposited Dose Rate during Smoking and Incense Stick Burning—The Jordanian Case as an Example for Eastern Mediterranean Conditions" International Journal of Environmental Research and Public Health 20, no. 1: 587. https://doi.org/10.3390/ijerph20010587
APA StyleHussein, T. (2023). Indoor Exposure and Regional Inhaled Deposited Dose Rate during Smoking and Incense Stick Burning—The Jordanian Case as an Example for Eastern Mediterranean Conditions. International Journal of Environmental Research and Public Health, 20(1), 587. https://doi.org/10.3390/ijerph20010587