Abstract
Tools for assessing multiple exposures across several domains (e.g., physical, chemical, and social) are of growing importance in social and environmental epidemiology because of their value in uncovering disparities and their impact on health outcomes. Here we describe work done within the Environmental influences on Child Health Outcomes (ECHO)-wide Cohort Study to build a combined exposure index. Our index considered both environmental hazards and social stressors simultaneously with national coverage for a 10-year period. Our goal was to build this index and demonstrate its utility for assessing differences in exposure for pregnancies enrolled in the ECHO-wide Cohort Study. Our unitless combined exposure index, which collapses census-tract level data into a single relative measure of exposure ranging from 0–1 (where higher values indicate higher exposure to hazards), includes indicators for major air pollutants and air toxics, features of the built environment, traffic exposures, and social determinants of health (e.g., lower educational attainment) drawn from existing data sources. We observed temporal and geographic variations in index values, with exposures being highest among participants living in the West and Northeast regions. Pregnant people who identified as Black or Hispanic (of any race) were at higher risk of living in a “high” exposure census tract (defined as an index value above 0.5) relative to those who identified as White or non-Hispanic. Index values were also higher for pregnant people with lower educational attainment. Several recommendations follow from our work, including that environmental and social stressor datasets with higher spatial and temporal resolutions are needed to ensure index-based tools fully capture the total environmental context.
1. Introduction
The use of tools and methods to assess multiple exposures that jointly impact health outcomes is an area of rapid growth in the field of environmental health. The National Institute of Environmental Health Sciences has identified the examination of the effects of co-exposures on health as a current priority [1], noting that environmental exposures do not exist in isolation and have the potential to interact in unexpected ways. Several tools have been developed to characterize how multiple environmental or social stressors may contribute to disparities in health. Examples include EJSCREEN [2], CalEnviroScreen [3], the Social Vulnerability Index (SVI) [4], and the Child Opportunity Index [5]. Most recently, the Agency for Toxic Substances and Disease Registry (ATSDR) released the Environmental Justice Index (EJI) 2022, which includes indicators of social stressors and environmental hazards along with community-level health indicators [6]. In 2022, The Council on Environmental Quality released its Climate and Economic Justice Screening Tool to assess cumulative impacts from environmental and social stressors and to designate disadvantaged communities for the targeting of investments from President Biden’s Justice40 Initiative [7]. Other tools have been developed to provide area-specific information for states and metropolitan areas [8,9,10,11,12].
There are several challenges to developing indices that account for the multitude of exposures experienced at the neighborhood or residential level. Depending on data availability, some tools can include several environmental and social indicators of neighborhood quality. For example, CalEnviroScreen 3.0 and 4.0 include data on particulate matter and ozone concentrations, pesticide use, drinking water contamination, childhood lead exposures, and a number of neighborhood-level socioeconomic indicators, among others [3,13]. However, these data are limited to California census tracts only. Key inputs, such as the pesticide use registry, are unavailable elsewhere. Other tools have excellent spatial coverage but tend to focus on only one domain. For example, the SVI covers most census tracts in the United States (U.S.) and includes indicators of neighborhood socioeconomic status (SES) such as poverty and crowded housing, but does not consider environmental exposures [4]. Both the EJI and the Climate and Economic Justice Screening Tool include a variety of social, environmental, and health indicators, but data for many indicators are not available prior to 2020 [6]. Similarly, the Environmental Protection Agency (EPA) EJSCREEN tool has integrated national-level data on environmental hazards and social stressors to examine issues of disproportionate exposures and environmental injustice in the U.S., but the tool does not provide a composite measure of cumulative exposure; while users may view data on one or more environmental hazards, the tool is limited in its temporal coverage [2]. There are limited existing options that will facilitate investigations of stressors in both the environmental and social domains using a single integrated framework across multiple years and the entire contiguous U.S. Such studies would require comprehensive data with complete geographic and temporal coverage for spatial units that are resolved enough to highlight gradients in exposure within populations.
Nevertheless, such tools can be helpful for examining inequalities in exposure and prioritizing resource deployment. Additionally, indices that characterize multiple stressors have been used as combined exposure variables in epidemiological studies. Because these index-based methods capture multiple exposures at a time, they are useful for exploring the “total” environmental context and how it contributes to health outcomes. For example, higher CalEnviroScreen cumulative impact scores have been linked to poorer ovarian cancer survival [14], higher asthma-related hospitalization rates among children [15], and reduced lung function among patients with idiopathic pulmonary fibrosis [16]. Likewise, higher SVI scores have been associated with higher heat-related emergency department visits [17] and a higher risk of postoperative complications among cancer patients [18]. Importantly, indices of environmental or social stressors have been used to explore associations between prenatal exposure and adverse outcomes such as congenital heart disease [19] and sudden unexpected infant death [20] and measures such as gestational age and birth weight [21]. However, investigations of associations between index-based exposures during the prenatal period and other perinatal or childhood health outcomes are limited.
There is growing interest in understanding how multiple environmental hazards and social stressors experienced during the sensitive prenatal and early life periods impact children’s health and well-being. The Environmental influences on Child Health Outcomes (ECHO) Program, which is sponsored by the National Institutes of Health (NIH) Office of the Director, provides an excellent opportunity to expand this body of work by leveraging the ECHO-wide Cohort Study, a collaboration of 69 cohorts that includes pregnant people and children enrolled in studies across the U.S. [22]. Because there are limited tools for assessing both environmental hazards and social stressors in a single framework with adequate spatial and temporal coverage for the ECHO-wide cohort, we sought to develop a national-level index that would incorporate data across multiple environmental and social domains with appropriate temporal coverage and application in multiple studies. Our goal was to capture indicators of environmental and social factors at the neighborhood level that would have relevance to the prenatal and early-life periods. We defined environmental hazards as features of the chemical or built environment that could potentially harm health (e.g., air pollution and lack of green space). We defined social stressors as neighborhood-level social determinants of health that reflect constructs such as lower socioeconomic status and social vulnerability. Additionally, a national data set with spatial and temporal coverage would facilitate regional analyses wherein we can explore how environmental and social determinants interact in geographically and culturally different regions of the country.
Our objective was to create a single exposure index that combined available data on several environmental and social indicators at the national level to facilitate epidemiology studies for the ECHO-wide Cohort and similar nation-wide studies. We previously used this exposure index to assess associations between combined exposure and neonatal outcomes [23]. In this prior study, we found that greater prenatal exposure to combined environmental and social hazards was associated with lower birthweight and gestational age at birth as well as a high risk of preterm birth. We observed effect modification by pregnant person race, educational attainment, and urbanicity. Here we aimed to examine the distribution of our combined exposure index for the ECHO-wide Cohort and assess inequities in combined exposures during pregnancy as a function of population demographic and socioeconomic descriptors. Greater exposure to environmental hazards and social stressors may reflect the legacy of redlining and other policies that promote racial and ethnic segregation in the U.S. [24,25,26]. Harmful environmental exposures, unfavorable social conditions, structural racism, and poor maternal and child health outcomes may form a synergistic epidemic that disproportionately impacts marginalized communities [27]. Our goal was to document the methods used to develop the index and better understand how it may be used to examine health disparities within the ECHO-wide cohort.
2. Materials and Methods
2.1. Study Population
The NIH ECHO Program combines 69 ongoing pregnancy and pediatric studies from 31 cohorts across the U.S. into one ECHO-wide Cohort [28,29]. The goal of the ECHO-wide Cohort Study is to examine environmental factors associated with child health [30]. ECHO-wide Cohort data include a combination of extant study-specific data with prospective data collection using a common protocol across studies. The current analysis used previously collected or extant data to evaluate census tract-level social and environmental stressors in relation to demographic and socioeconomic measures during pregnancy. Individual study cohorts eligible for this analysis had 30 or more pregnancies with both residential history and demographic data between 2010 and 2019. Five cohorts recruited preterm or very-low-birthweight infants from neonatal intensive care units. Two cohorts recruited specific demographic groups (Black/African American and Puerto Rican). Six cohorts recruited participants with an autism spectrum disorder diagnosis or an older sibling with a diagnosis, and one cohort recruited pregnant people who smoked and refused cessation.
Because data are continuously uploaded to the ECHO platform, we used data from the 4 March 2022 data lock (Figure S1). Participant addresses were geocoded in ArcGIS Pro Streetmap Premium Geocoder. Approximately 87% of addresses had a high-quality match (point or specific street address), which was required for inclusion in this analysis. We assigned a census tract identifier to each participant address using the 2010 census tract boundaries.
In this analysis, we included all unique pregnancies with available data. Thus, a pregnant participant could contribute data from more than one pregnancy while enrolled in their original cohort study. All participants gave informed consent in their original cohort studies using approved methods. All participants included in these analyses provided additional consent to share data with the ECHO consortium. The ECHO-wide Cohort Data Collection Protocol was approved by either the ECHO single Institutional Review Board (IRB) or the original ECHO cohort’s local IRB.
2.2. Developing the Combined Exposure Index
We examined several existing local-, state-, and national-level indices to derive a list of candidate indicators of environmental hazards and social stressors [2,4,5,8,9,10,13]. Our goal was to identify as many indicators as possible that would reflect both chemical or physical environmental hazards (e.g., exposure to ambient air pollution) and social stressors (e.g., factors that correlated with perceived stress or measures, such as transportation and housing quality). After reviewing existing tools, we identified a list of candidate indicators that met two key criteria. First, indicators were eligible for inclusion if a publicly available data source with nationally representative data could be identified. Second, indicators were eligible if sufficient temporal data were available (e.g., at least every 3 years, with some exceptions noted in the following sections). Our final list of indicators was heavily influenced by two existing tools: CalEnviroScreen and the SVI. During our methods development process, we evaluated additional individual indicators related to the social determinants of health (e.g., crime and medically underserved areas) but found that data for other indicators of interest lacked either national or temporal coverage.
2.3. Data Sources
All of our indicators were obtained from publicly available data sources with national coverage (Table 1) [4,31,32,33,34,35,36]. Environmental indicators at the neighborhood level captured hazards in two broad classes: ambient air pollutants and features of the built environment. Environmental data were obtained from six sources: the National Land Cover Database (NLCD) [31], National Emissions Inventory (NEI) [32], National Priorities List (NPL) [33], Risk-Screening Environmental Indicators (RSEI) Model [34], EPA Fused Air Quality Surface Downscaling Files (FAQSD) for ambient air pollutants (fine particulate matter with an aerodynamic diameter less than 2.5 μm [PM2.5] and ozone [O3]) [35], and the National Highway Performance and Monitoring System (NHPMS) [36].

Table 1.
Indicators included in the combined exposure index.
Social stressors were derived from the SVI [4]. These indicators represented a number of neighborhood-level factors that reflect SES and may influence population susceptibility. In our index, we included indicators of educational attainment (percentage of persons over the age of 25 without a high school diploma or the equivalent), employment status (unemployment percentage), per capita income, poverty (percentage of persons in poverty), age distribution (percentage of persons over the age of 65 and percentage of persons under the age of 18), disability (percentage of persons with a disability), household composition (percentage of single-parent households with children under the age of 18), race and ethnicity (percentage of persons of a race or ethnicity other than non-Hispanic White), language (percentage of persons who speak English “less than well”), and housing type (percentage of housing structures with 10+ units, percentage of mobile homes, percentage of overcrowded homes, percentage of households with no vehicle available, and percentage of persons in group quarters). The SVI includes the percentage of persons of a racial or ethnic group other than non-Hispanic White as a proxy for the “social and economic marginalization of certain racial and ethnic groups, including real estate discrimination” [37] in the United States. Demographic indicators at the census tract level are meant to further describe the contextual factors within a census tract rather than its composition [38]. These data were drawn from the U.S. Census Bureau American Community Survey (ACS) [39,40]. and were available at the census tract level.
2.4. Addressing Spatial and Temporal Alignment in the Environmental and Social Data Sets
Several environmental data sets were available at spatial resolutions other than the census tract level (Table 1). Therefore, we performed spatial aggregation analyses to assign values to each census tract in the United States. Data from the NLCD were available as raster files with a 30 m resolution. We aggregated these data to the census tract level using spatial overlay and extract functions, and we calculated the average percentage of land within the census tract with tree cover or land that was classified as an impervious surface. To ensure consistent interpretation of all indicators, the tree cover values were reversed (100%—% tree cover) to ensure that higher values were indicative of worse exposures (less tree cover). Images to measure tree cover are collected during the growing season and represent peak cover [41]. NEI and NPL sites were available as point estimates. We aggregated these as weighted sums of locations within the census tract and surrounding buffers around the census tract using weights specified by CalEnviroScreen 3.0 methodology [13]. The NHPMS estimates of annual average daily traffic (AADT) were available with line geography; census tract AADT was defined as the average number of vehicles per total area within the tract. RSEI and EPA FAQSD data were available at the census tract level, and no additional spatial manipulation was needed.
The combined exposure (CE) index was developed for each year of our study period (2010–2019) (Table 1). For data sets with less than annual temporal resolution, we imputed annual data from neighboring years to develop a data set with full temporal coverage. We elected to use the same exposure data for several years for two main reasons. First, we wanted to use methods that would be easily reproducible by other analysts. Second, we use long-term averages in our index, which are relatively stable over shorter periods of time (i.e., 5 years or fewer); therefore, more sophisticated methods of interpolation were not necessary. Because all of our data were collected prior to the COVID-19 pandemic, we assumed stable trends in our variables. NLCD data on impervious surfaces available for 2011, 2016, and 2019 were applied in annual exposure indices to cover 2010–2014, 2015–2017, and 2018–2019, respectively. For tree cover, 2011 and 2016 data were applied for the 2010–2014 and 2016–2019 indices, respectively. Data on NPL sites were taken from the 2017 list. Because the list has not changed substantially in recent history, we assumed that sites on the list as of 2017 were hazardous for the entire study period. RSEI data were available on an annual basis from 2010–2019. Data from 2010 through 2017 were based on RSEI model v237; 2018 data were based on model v238; and 2019 data from model v239. Data from the EPA FAQSD were available on an annual basis from 2010 through 2017; estimates from 2017 were used for 2018 and 2019. Annual AADT estimates were available for years 2011–2017; 2011 estimates were used for the 2010 index; and 2017 estimates were used in indices for 2018 and 2019.
Indicators of social stressors, which were originally developed by the Centers for Disease Control and Prevention (CDC), were acquired from data products labeled as 2010, 2014, 2016, and 2018, which were developed from 5-year estimates from the ACS from 2006–2010, 2010–2014, 2012–2016, and 2014–2018, respectively. Considering the temporal span of the ACS data sets, we applied these data, which represent 5-year averages, to our index based on the midpoint years of the data sets. Therefore, CDC data from 2006–2010 were applied to the 2010 index; data from 2010–2014 were applied to the index for years 2011–2012; data from 2012–2016 were applied to the index for years 2013–2015; and data from 2014–2018 were applied to the index for years 2016–2019.
2.5. Calculating Scores
We adopted methods used by CalEnviroScreen 3.0 (which was the most recent version of CalEnviroScreen at the time of data collection and methods development) to develop our national CE index [13]. We converted raw inputs for each variable (i.e., annual census tract values for each indicator) to percentiles scaled from 0 to 1.
We first calculated the environmental (ENV) and social (SOC) components of the CE index. To calculate ENV, the percentiles for each indicator were averaged to generate an air pollution subscore and a built environment subscore (Table 1). The final ENV index is the weighted average of the air pollution subscore (weight = 1) and the built environment subscore (weight = 0.5). The ENV scores were weighted to provided consistency with previous studies [3,10,13,23,42]. The built environment subscore (called “environmental effects” in the CalEnviroScreen methodology) is assigned half the weight of the ambient air pollution subscore due to the uncertainty in how these exposures are associated with health outcomes; a previous study of the CalEnviroScreen tool found that census tract rankings were robust to different weights [13,43]. Values for the ENV index range from 0 to 1. To calculate the SOC, percentiles of the inputs (Table 1) were averaged without weighting.
CE values were calculated as the product of the ENV and SOC scores (i.e., CE = ENV × SOC). This is the same approach used by CalEnviroScreen and other similar indices [2,3,42] and reflects the body of evidence that suggests an interaction between neighborhood factors (e.g., neighborhood SES) and environmental exposures (e.g., air pollution) on childhood health outcomes [44,45,46,47,48]. Values for the CE index range from 0 to 1, where higher scores represent higher levels of exposure to environmental hazards and social stressors.
2.6. Assigning Exposures
Participants were assigned a CE value based on the census tract in which they lived during gestation. Participants who had a pregnancy spanning more than one calendar year were assigned a CE value based on the year during which a greater proportion of the gestation occurred. For participants who moved during their pregnancy and who had residential history data (5%), we assigned CE values based on the census tract in which they lived for the greater proportion of the pregnancy.
2.7. Predictors of High Exposure
We were interested in differences in exposure based on characteristics such as race, ethnicity, and SES. Previous studies have suggested that race or ethnicity and SES may modify how environmental and social factors at the neighborhood level influence health outcomes [49,50,51,52,53]. Factors such as overt and covert racism, perceptions of social status, and social isolation may play a role in modifying the effects of neighborhood-level factors [52]. Pregnant people were characterized based on their self-reported race, ethnicity, and educational attainment (a proxy for individual-level SES). Because data on parental educational attainment were collected at multiple time points by several ECHO cohorts, we used a data source hierarchy to assign values to participants. Whenever available, we used data from the first prenatal visit. If prenatal data on parental educational attainment were not available, we used data from a childhood visit.
We were also interested in how exposures may differ for pregnant people in rural areas compared with urban areas and by geographic region. Previous studies have found that disparities in environmental exposures (e.g., air pollution and green space) by race and ethnicity differ by region or urbanicity [54,55,56]. Therefore, we also classified pregnant people as living in urban and rural regions using the 2013 Rural–Urban Continuum Code (RUCC) for the county in which they lived the longest during pregnancy [57]. We defined four primary regions of interest based on U.S. Census definitions: Northeast, South, Midwest, and West.
2.8. Statistical Analyses
We explored the distribution of the index values by year and national region for all census tracts included in our data set in two ways. First we included all census tracts and years. Then we limited our analysis to only tracts where pregnant ECHO participants resided during our study period (2010–2019). We used violin plots to examine the distribution of each of the component scores (ENV and SOC) and the CE index. We examined trends for the entire study area and specific regions in the U.S.
Our primary analysis tested the hypothesis that pregnant people from historically marginalized racial or ethnic groups and pregnant people with lower SES would be at greater risk of experiencing higher combined exposures during pregnancy. We also examined whether pregnant people in rural counties were at higher risk of living in a high-exposure census tract relative to pregnant people in urban counties. Analyses were conducted using data for the full ECHO cohort and by geographic region. Each characteristic of interest was analyzed separately; we did not mutually adjust for other characteristics (e.g., we did not include race and ethnicity in the same model).
High exposure was defined as a CE value greater than or equal to 0.5. This is the theoretical median for the CE index, which can each range from 0 to 1. In a secondary analysis, we defined high exposure as a CE value above the median of all observed values (all U.S. census tracts and years). In this secondary analysis, our threshold for high exposure was greater than or equal to 0.23 (the median of observed CE values for study participants). Because no rural census tracts had CE values above 0.5, our analysis of urban–rural disparities in exposure was limited to our secondary analysis.
We estimated the risk of being in a high-exposure census tract by race (Black or other racial groups, including Asian, Native Hawaiian and other Pacific Islander, American Indian or Alaska Native, and Multiple Races or Another Race vs. White), ethnicity (Hispanic vs. non-Hispanic), and educational attainment (less than high school or high school diploma/General Educational Development [GED] vs. some college and above). Although there are challenges for interpretation when using non-Hispanic White populations as the reference group to examine differences by race and ethnicity [58], we elected to use White as the reference group for the race category and non-Hispanic as the reference group for the ethnicity category here because participants who identified as White and non-Hispanic made up the largest proportions of our study population for those two demographic groups. We used Poisson regression with robust variance estimates [59] to calculate risk ratios for all participants at the national level and for models stratified by geographic region. We use the term relative risk to describe the likelihood of living in a high-exposure census tract relative to our reference populations.
To examine potential effect modification by geographic region, we examined the stratum-specific associations for each subgroup and included a product term of the participant characteristic (race, ethnicity, educational attainment, and urbanicity) and region to derive interaction p-values. We considered two-sided p < 0.10 as evidence for effect modification based on the p-value of the interaction terms. Because of sample size limitations, we did not include interaction terms when examining participants stratified by county type (urban vs. rural).
We included a sensitivity analysis to assess the potential influence of a residential move (defined as moving to a different census tract) during pregnancy on our results. In our study population, 640 (4.5%) pregnant people moved to a different census tract during their pregnancies. In this sensitivity analysis, we stratified our study population into two groups: those who moved during pregnancy and those who did not. We included an interaction term as the moving status and region in our sensitivity analysis.
3. Results
3.1. Temporal Trends and Regional Differences in the CE Index
Across the U.S., CE values tended to be stable from year to year (Figure S2). Mean CE values tended to be higher in the West, but differences between regions were small (Figure S3, Table S1). When including only census tracts in which ECHO participants lived, exposures varied by year (Figure S4). Across all ECHO census tracts, exposures tended to be higher in later years (2017 onward) compared with earlier years. Combined exposures to environmental hazards and social stressors were higher in the West and Northeast regions of the country (Figure 1). Plots of the individual component scores (ENV and SOC) showed similar trends as the CE index (Figures S5–S12 in the Supplementary Materials).
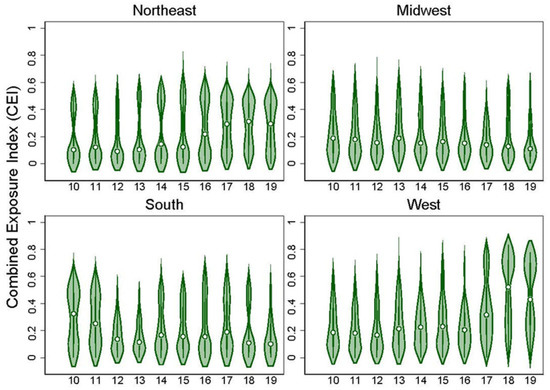
Figure 1.
Violin plots showing the distribution of the combined exposure (CE) index for all census tracts that contained an ECHO participant by region for the years 2010–2019.
3.2. Pregnancies Included in This Analysis (2010–2019)
Residential information and demographic variables were available for 14,072 pregnancies from 46 participating ECHO cohorts (Table 2, Figure S1). Of these pregnancies, 93% were pregnant people who contributed data to the study once. Our participants lived throughout the U.S. (Graphical Abstract; Figure S13) and represent 6264 different census tracts. Most participants lived in the Northeast region (n = 5642, 40%), followed by the West (n = 4012, 28%), Midwest (n = 2746, 20%), and South (n = 1672, 12%) regions. The majority of pregnant people included in our study identified as White (67%) and non-Hispanic (80%). The proportion of the study population who identified as a specific racial or ethnic group differed by region (Table 2). Participants who identified as Hispanic were more likely to live in the West (27%) and the Northeast (26%) compared with the Midwest (4%) and South (9%), and participants who identified as Black were more likely to live in the South (31%) compared with the Midwest (14%), Northeast (13%), and West (6%). Educational attainment among enrolled participants was high in our cohort, with 78% of pregnant people reporting at least some college (no degree) or higher education. Most participants (85%) lived in counties that were designated as metropolitan based on the 2013 RUCC classification system.
Table 2.
Demographics of ECHO children with residential history data (N = 14,072) by geographic region.
Table S2 in the Supplementary Materials details the number of participants from each cohort; cohorts contributed between 16 and 174 participants, with a median of 174 participants.
3.3. Relative Risk of Being in a “High” Exposure Census Tract by Participant Characteristics
Overall, pregnant people who identified as Black or another racial group (relative to White pregnant people) and pregnant people who identified as Hispanic (relative to non-Hispanic pregnant people) were at higher risk of living in a “high” exposure census tract where the CE index was higher than the theoretical median of 0.5 (Table 3). Differences in point estimates when examining geographic trends were evident (p-interaction = 0.016), although confidence intervals (CIs) for the stratified results were wide and overlapped. Racial differences in exposure were especially prevalent in the South, where Black pregnant people had a six times higher risk of being in a “high” CE exposure census tract than White pregnant people (RR = 6.04, 95% CI: 2.45–14.36). Risks for Black pregnant people were also elevated relative to White pregnant people in the Midwest region (RR = 5.21, 95% CI: 2.44–11.14). In contrast, among those residing in the Northeast, pregnant people who identified as members of other racial groups had the highest risks compared with White pregnant people (RR = 3.11, 95% CI: 2.20–4.40). For pregnant people identifying as Hispanic, the risk of living in a high-exposure tract was higher compared with non-Hispanic pregnant people overall (RR = 2.30, 95% CI: 1.77–3.00). Risks were similar for Hispanic pregnant people living in the Northeast (RR = 2.29, 95% CI: 1.58–3.31) and the West (RR = 2.91, 95% CI: 1.93–4.39) (p-interaction for ethnicity < 0.001).
Table 3.
Relative risks (95% CI) of living in a high-exposure census tract (defined as a CE index score ≥ 0.5) by maternal characteristics and geographic region (n = 14,072); p-values represent the p-value of the interaction term between the participant characteristic and region.
We also observed socioeconomic inequalities in high exposure risk (Table 3). Pregnant people with less than a high school education had higher risks of living in high CE census tracts compared with pregnant people with some college education and above (RR = 2.27, 95% CI: 1.66–3.10). Risks for this group were similar in the Northeast, Midwest, and South, but not in the West. Similar trends were observed for pregnant people with a high school degree relative to those with some college and above.
3.4. Results When Defining “High” Census Tracts as above the Observed Median for the CE Index (0.23)
When defining “high” exposure as the median of all observed values (≥0.23), the patterns we observed were similar, although the relative risks of being in a high-exposure census tract during pregnancy were attenuated (Table S3). Relative to White pregnant people, Black pregnant people had a higher risk of being in a high-exposure tract (RR = 2.33, 95% CI: 1.93–2.82), with pregnant people living in the Midwest experiencing the highest relative risk (RR = 3.65, 95% CI: 2.49–5.35) (p-interaction < 0.001). Hispanic pregnant people had a higher risk of living in a high-exposure census tract relative to non-Hispanic pregnant people both nationally (RR = 1.62, 95% CI: 1.43–1.84) and in each of the regions identified (except the South), although the interaction term was no longer significant when using this alternative definition of “high” exposure (p-interaction = 0.743). Trends for pregnant people with lower educational attainment were also consistent with the previous analysis, where pregnant people with lower reported educational attainment were at higher risk of living in a high-exposure census tract.
We observed that pregnant people living in metro counties had a higher risk of living in a census tract with a CE value ≥ 0.23 (RR = 3.03, 95% CI: 1.75–5.27) relative to those living in non-metro counties (Table S3). Relative risks were highest for pregnant people living in metro counties in the West (RR = 12.68, 95% CI: 5.57–28.90) and lowest for pregnant people living in metro counties in the South (RR = 1.28, 95% CI: 0.74–2.22), although CIs tended to be wide. Estimates of this risk were not available for participants in the Northeast due to sample size limitations.
3.5. Results of the Sensitivity Analysis Considering Movers and Non-Movers
The results were generally not sensitive to whether pregnant people moved during their pregnancy (Table S4). When stratifying participants by race or ethnicity, the risks for pregnant people who moved during pregnancy were somewhat lower compared with pregnant people who did not move. However, when stratifying by educational attainment (our proxy for SES), there were differences between pregnant people who moved and who did not move. Movers in the lower educational attainment group experienced a slightly higher risk of being in a high-exposure census tract (based on the theoretical median value of 0.5) relative to movers in the higher educational attainment group, although CIs were wide and overlapped.
4. Discussion
To facilitate studies of combined effects from multiple environmental and social stressors on childhood health outcomes, we leveraged existing national data sets to develop a combined exposure index. Within the nationwide ECHO-wide Cohort, we assigned CE index scores based on residence and timing of pregnancy and assessed differences in exposure by key demographic and socioeconomic groups. Overall, our results show that pregnant people from minoritized racial and ethnic groups and pregnant people with lower educational attainment may be at greater risk of living in a high-exposure census tract. These trends were similar whether we defined “high” exposure as above the theoretical median value (0.5) for the index or the observed median value (0.23), although the magnitude of risk was greater when using the theoretical median. Because we did not mutually adjust for other demographic characteristics, these results should be interpreted with caution. However, our results are consistent with several recent studies that have documented disparities in exposure to social and environmental risk factors by minoritized racial and ethnic groups, including air pollutants [60,61,62], parks and green space [56,63], and Superfund sites [64,65]. These differences in combined exposures to environmental hazards and social stressors likely reflect the legacy of structural and systemic racism that persists today in the U.S. [66,67].
Our national-level CE index may be useful in several future research contexts. We previously applied these measures to a study of combined exposures during the prenatal period and perinatal outcomes, including gestational age, preterm birth, and small- and large-for-gestational age, and observed that higher index scores were associated with decreased gestational age at birth [23]. However, our use of a combined exposure index, which collapses exposure information into a single metric, does not allow us to differentiate between exposures to identify the most important component or components of the mixture. A better understanding of which exposures drive associations with health outcomes is needed to elucidate the mechanisms underlying observed differences in exposure and in health effects. Similarly, identifying key components within the mixture will help identify policy and program options for addressing them. Future work may aim to investigate outcomes along the pathway between combined neighborhood exposures and perinatal outcomes, such as psychosocial stress or oxidative stress [22]. Additionally, we have estimates of each indicator for each year of the index to ensure that exposures could be investigated as separate predictors. To further elucidate how these exposures interact to influence child health outcomes, statistical methods for mixtures that leverage machine learning, such as Bayesian Kernel Machine Regression or quantile-based g-computation, can be applied to the data set [68,69,70,71].
Strengths, Limitations, and Future Directions
Our work benefits from several strengths. We were able to combine time-varying neighborhood-level exposures in two domains into a single index, which overcomes some of the limitations of other national-level tools. Additionally, we were able to assess exposures at the census tract level. The use of census tracts allowed us to capture some of the intra-county variability in exposures that may better capture the relationships between environment and health [72]. This dataset will be made available for ECHO and non-ECHO researchers to explore associations between combined exposures and other childhood health outcomes.
There are several sources of uncertainty to acknowledge when developing and interpreting the CE index. Many of these sources of uncertainty are common among other exposure indices in the literature [2,4,13]. First, the specific exposures of interest are not always clear for many built environment features. For example, living in close proximity to a Superfund site (i.e., a heavily polluted location that has been identified by the US EPA as hazardous to health and has been listed on the National Priorities List) has been linked to shortened life expectancy, particularly in areas with higher sociodemographic disadvantage [73]. However, the health risks presented by a specific site depend on a number of factors, including the historical activity at the site, groundwater and surface water conditions, and current land use practices. Thus, the relationships between proximity to Superfund sites and health outcomes may vary by location. Second, it is difficult to separate the effects of chemical and physical hazards associated with certain types of neighborhood environmental hazards (e.g., air pollutants and noise) from the effects of psychosocial stressors [74,75,76]. Third, it is challenging to empirically derive weights for component scores within the index. Whenever possible, we used CalEnviroScreen 3.0 (the version of CalEnviroScreen available at the time of methods development) weights for consistency [13].
Additionally, our work has other limitations to note. Similar to other national-level indices [2], we are limited by the availability of data sets; not all relevant indicators are included in this index. For example, we do not have indicators of water quality. Nationally representative data sets that account for both community water systems and private water systems are lacking. Thus, we cannot include indicators for hazards such as nitrates in drinking water that show clear sociodemographic patterns in the U.S. [77]. We are also not able to include indicators that may be more relevant in rural parts of the country, including pesticides and emissions from oil and gas operations. Our reliance on publicly available data sets precludes us from evaluating the entire U.S.; data are not routinely available for Alaska and Puerto Rico. Additionally, because of temporal limitations in existing data sets, for some indices, we applied the same data set to several years of the index. Contrasts in exposure were likely reduced due to this lack of temporally resolved data. Importantly, because of smaller sample sizes, we were not able to explore differences in exposure for other racial groups, including Asian, Native Hawaiian and other Pacific Islander, American Indian, and Alaska Native, and individuals reporting more than one race or other races. Previous work has demonstrated that exposures to environmental hazards and the incidence of adverse birth outcomes are higher among Asian, Native Hawaiian, and Pacific Islander populations [78,79,80] and American Indian or Alaska Native populations [81,82]. When applying our index to understand trends in exposure, we cannot rule out the influence of residential selection bias on our results [83], where individuals with higher SES are more able to choose desirable neighborhoods relative to individuals with lower SES. Lastly, our results are consistent with those from other studies in the United States but may not be generalizable outside of the country. In other regions of the world, there are likely important differences in the racial, ethnic, socioeconomic, and geographic distribution of environmental and social hazards.
5. Conclusions
To overcome some of the limitations of existing exposure indices and to facilitate health studies for the ECHO-wide Cohort, we developed a combined exposure index that accounts for environmental hazards and social stressors at the census tract level. We demonstrated the utility of our index by assessing differences in the risk of living in a high-exposure census tract for pregnant people from minoritized racial and ethnic groups, pregnant people with lower educational attainment, and pregnant people in urbanized counties. These exposure data may be useful in future studies on how neighborhood contexts influence health across childhood. Future work would benefit from national data sets for key environmental health concerns, such as water contaminants and pesticides, and social stressors that may have disproportionate effects, particularly in rural areas. Data collection efforts should focus on existing geographical gaps, including for Alaska, Hawaii, and Puerto Rico. These data sets are a requirement for capturing the full range of environmental hazards and social stressors that influence maternal and child health outcomes.
Supplementary Materials
The following supporting information can be downloaded at https://www.mdpi.com/article/10.3390/ijerph20146339/s1, Table S1: Summary (mean and SD) of the Environmental Exposure Index, Social Exposure Index, and Combined Exposure Index by year and geographic region for all National Census Tracts. Table S2: Summary of ECHO cohorts included in this study. Table S3: Relative risks (95% CI) of living in a high-exposure census tract (defined as a combined exposure index score ≥ 0.23) by maternal characteristics and geographic region (N = 14,072). Table S4: Relative risks (95% CI) of living in a high-exposure census tract by maternal characteristics and geographic region: sensitivity analysis stratified by mothers who moved vs. did not move during pregnancy (N = 14,072). Figure S1: Flowchart outlining the inclusion of study participants in the analytic cohort. Figure S2: Violin plots showing the distribution of the combined exposure index for the United States for the years 2010–2019. Figure S3: Violin plots showing the distribution of the combined exposure index for the United States by region for the years 2010–2019. Figure S4: Violin plots showing the distribution of the combined exposure index for all census tracts that contained an ECHO participant for the years 2010–2019. Figure S5: Violin plots showing the distribution of the environmental component score for the United States for the years 2010–2019. Figure S6: Violin plots showing the distribution of the environmental component score for the United States by region for the years 2010–2019. Figure S7: Violin plots showing the distribution of the environmental component score for all census tracts in which ECHO participants lived for the years 2010–2019. Figure S8: Violin plots showing the distribution of the environmental component score for all census tracts in which ECHO participants lived by region for the years 2010–2019. Figure S9: Violin plots showing the distribution of the social component score for the United States for the years 2010–2019. Figure S10: Violin plots showing the distribution of the social component score for the United States by region for the years 2010–2019. Figure S11: Violin plots showing the distribution of the social component score for all census tracts in which ECHO participants lived for the years 2010–2019. Figure S12: Violin plots showing the distribution of the social component score for all census tracts in which ECHO participants lived by region for the years 2010–2019. Figure S13: The number of participants by state and region used to assess geographic differences in the combined exposure index.
Author Contributions
Conceptualization, S.E.M., T.M.B., C.V.B., D.D., R.H., S.M., A.M.P. and A.M.K.; Data curation, M.Z., A.E.C., A.K., T.S. and W.W.; Formal analysis, M.Z., A.E.C., A.K., T.S. and W.W.; Funding acquisition, J.A., C.V.B., C.A.C.J., D.D., C.S.D., A.L.D., A.E.H., M.R.K., B.M.L., T.G.O., J.B.S. and R.J.W.; Methodology, S.E.M., M.Z., A.E.C. and A.M.K.; Project administration, D.A.H., J.A., M.M.T.-B., E.S.B., C.B., N.R.B., F.C., C.A.C.J., K.N.C., B.S.C., A.E.C.-B., W.C., L.A.C., C.S.D., A.L.D., T.M.E., T.V.H., J.B.H., A.E.H., M.R.K., B.M.L., K.Z.L., R.M.-F., T.G.O., M.P., S.S., J.B.S., T.J.W. and R.J.W.; Visualization, M.Z.; Writing—original draft, S.E.M., M.Z., A.E.C. and A.M.K.; Writing—review & editing, S.E.M., A.K., T.S., W.W., D.A.H., J.A., M.M.T.-B., E.S.B., T.M.B., C.B., C.V.B., N.R.B., F.C., C.A.C.J., K.N.C., B.S.C., A.E.C.-B., W.C., L.A.C., D.D., C.S.D., A.L.D., T.M.E., T.V.H., J.B.H., A.E.H., M.R.K., B.M.L., K.Z.L., S.M., R.M.-F., T.G.O., A.M.P., M.P., S.S., J.B.S., T.J.W., R.J.W. and A.M.K. In addition to these roles, the following authors were responsible for Data Acquisition: D.A.H., J.A., M.M.T.-B., E.S.B., C.B., N.R.B., F.C., C.A.C.J., K.N.C., B.S.C., A.E.C.-B., W.C., L.A.C., C.S.D., A.L.D., T.M.E., T.V.H., J.B.H., A.E.H., M.R.K., B.M.L., K.Z.L., R.M.-F., T.G.O., M.P., S.S., J.B.S., T.J.W. and R.J.W. All authors have read and agreed to the published version of the manuscript.
Funding
The content is solely the responsibility of the authors and does not necessarily represent the official views of the National Institutes of Health. Research reported in this publication was supported by the Environmental influences on Child Health Outcomes (ECHO) program, Office of the Director, National Institutes of Health, under Award Numbers U2COD023375 (Coordinating Center), U24OD023382 (Data Analysis Center), U24OD023319 (PRO Core), UH3OD023320 (Aschner), UH3OD023253 (Camargo), UH3OD023248 (Dabelea), UH3OD023313 (Deoni), UH3OD023328 (Duarte), UH3OD023318 (Dunlop), UH3OD023279 (Elliott), UH3OD023289 (Ferrara), UH3OD023282 (Gern), UH3OD023287 (Breton), UH3OD023365 (Hertz-Picciotto), UH3OD023244 (Hipwell), UH3OD023275 (Karagas), UH3OD023271 (Karr), UH3OD023347 (Lester), UH3OD023268 (Weiss), UH3OD023288 (McEvoy), UH3OD023342 (Lyall), UH3OD023349 (O’Connor), UH3OD023285 (Kerver), UH3OD023272 (Schantz), UH3OD023249 (Stanford), UH3OD023305 (Trasande), UH3OD023337 (Wright). Additional support was provided under the following grants: NIEHS P30 ES005022 (Zarbl) and U19AI104317 (Gern).
Role of Funding Source
The funder of this work had no role in study design; in collection, analysis, and interpretation of data; in the writing of the report; and in the decision to submit the article for publication.
Institutional Review Board Statement
Properly constituted Institutional Review Boards—either the ECHO single IRB or the ECHO cohort’s local IRB—are accountable for compliance with regulatory requirements for the ECHO-wide Cohort Data Collection Protocol at participating cohort sites. Governing IRBs review ECHO protocols and all informed consent/assent forms, HIPAA authorization forms, recruitment materials, and other relevant information prior to the initiation of any ECHO-wide Cohort Data Collection Protocol-related procedures or activities. The work of the ECHO Data Analysis Center is approved through the Johns Hopkins Bloomberg School of Public Health Institutional Review Board.
Informed Consent Statement
ECHO Cohort Investigators (or their designated study personnel) obtain written informed consent or parent’s/guardian’s permission, along with child assent as appropriate, for ECHO-wide Cohort Data Collection Protocol participation and for participation in their specific cohorts.
Data Availability Statement
De-identified data from the ECHO Program are available through NICHD’s Data and Specimen Hub (DASH). DASH is a centralized resource that allows researchers to access data from various studies via a controlled-access mechanism. Researchers can now request access to these data by creating a DASH account and submitting a Data Request Form. The NICHD DASH Data Access Committee will review the request and provide a response in approximately two to three weeks. Once granted access, researchers will be able to use the data for three years. See the DASH Tutorial for more detailed information on the process.
Acknowledgments
The authors wish to thank our ECHO colleagues; the medical, nursing, and program staff; and the children and families participating in the ECHO cohorts. We also acknowledge the contribution of the following ECHO program collaborators: ECHO Components—Coordinating Center: Duke Clinical Research Institute, Durham, North Carolina: Smith PB, Newby KL; Data Analysis Center: Johns Hopkins University Bloomberg School of Public Health, Baltimore, Maryland: Jacobson LP; Research Triangle Institute, Durham, North Carolina: Catellier DJ; Person-Reported Outcomes Core: Northwestern University, Evanston, Illinois: Gershon R, Cella D.ECHO Awardees and Cohorts—Cincinnati Children’s Hospital Medical Center, Cincinnati, Ohio: Merhar S; Indiana University, Riley Hospital for Children, Indianapolis, IN: Ren C; University of Buffalo, Jacobson School of Medicine and Biomedical Sciences, Buffalo, NY: Reynolds A; University of California, San Francisco: Keller R; University of Rochester Medical Center, Rochester, NY: Pryhuber G; University of Texas Health Sciences Center, Houston, TX: Duncan A; Vanderbilt Children’s Hospital, Nashville, TN: Moore P; Children’s Hospital and Clinic Minneapolis, MN: Lampland A; Florida Hospital for Children, Orlando, FL: Wadhawan R; Medical University of South Carolina, Charleston, SC: Wagner C; University of Arkansas for Medical Science: Keller R; University of Florida College of Medicine, Jacksonville, FL: Hudak M; University of Washington, Seattle, WA: Mayock D; Wake Forest University School of Medicine, Winston Salem, NC: Walshburn L; Icahn School of Medicine at Mount Sinai, New York, NY: Teitelbaum SL; Stroustrup A; Cohen Children’s Medical Center, Northwell Health: Stroustrup A; Boston Children’s Hospital, Boston, MA: Mansbach J; Children’s Hospital of Philadelphia, Philadelphia, PA: Spergel J; Norton Children’s Hospital, Louisville, KY: Stevenson M; Phoenix Children’s Hospital, Phoenix AZ: Bauer C; University of Puerto Rico, San Jaun, PR: Canino G; Kaiser Permanente Northern California Division of Research, Oakland, CA: Ferrara A; University of Wisconsin, Madison WI: Gern J; Henry Ford Health System: Detroit, MI: Zoratti E; Washington University in St Louis, St Louis, MO: Rivera-Spoljaric K; University of Wisconsin, Madison, WI: Singh A; University of Southern California, Los Angeles, CA: Farzan S; University of Washington, Department of Environmental and Occupational Health Sciences, Seattle, WA: Karr C; University of Tennessee Health Science Center, Memphis, TN: Mason A; Emory University, Atlanta, GA: Marsit C; Helen DeVos Children’s Hospital, Grand Rapids, MI: Pastyrnak S; Kapiolani Medical Center for Women and Children, Providence, RI: Neal C; Los Angeles Biomedical Research Institute at Harbour-UCLA Medical Center, Los Angeles CA: Smith L; Brigham and Women’s Hospital, Boston, MA: Weiss S; Boston University Medical Center, Boston, MA: O’Connor G; Kaiser Permanente, Southern California, San Diego, CA: Zeiger R; Washington University of St. Louis, St Louis, MO: Bacharier L; Indiana University, Riley Hospital for Children: Indianapolis, IN, Tepper R; Pennsylvania State University, University Park, PA: Lyall K; Johns Hopkins Bloomberg School of Public Health Kennedy Krieger Institute, Baltimore, MD: Landa R; University of California, UC Davis Medical Center Mind Institute, Sacramento, CA: Ozonoff, S; University of California, UC Davis Medical Center Mind Institute, Davis, CA: Schmidt R; University of Washington: Dager S; Children’s Hospital of Philadelphia—Center for Autism Research: Schultz R; University of North Carolina at Chapel Hill: Piven J; Johns Hopkins Bloomberg School of Public Health: Volk H; University of California, Davis Medical Center—MIND Institute: Schmidt R; University of Pittsburgh Medical Center, Magee Women’s Hospital, Pittsburgh, PA: Simhan H; Michigan State University, East Lansing, MI: Kerver J; Henry Ford Health System, Detroit, MI: Barone, C; Michigan Department of Health and Human Services, Lansing, MI: McKane, P; Michigan State University, East Lansing, MI: Paneth N; University of Michigan, Ann Arbor, MI: Elliott, M; Columbia University Medical Center, New York, NY: Herbstman J; University of Illinois, Beckman Institute, Urbana, IL: Schantz S; University of Utah, Salt Lake City, UT: Porucznik C; University of Utah, Salt Lake City, UT: Silver R; University of Utah, Salt Lake City, UT: Conradt E; New York School of Medicine, New York, NY: Trasande L; Boston Children’s Hospital, Boston MA: Bosquet-Enlow M; George Mason University, Fairfax, VA: Huddleston K; University of Minnesota, Minneapolis, MN: Nguyen R.
Conflicts of Interest
The authors declare no conflict of interest.
Abbreviations
AADT, annual average daily traffic; ACS, American Community Survey; ATSDR, Agency for Toxic Substances and Disease Registry; CDC, Centers for Disease Control and Prevention; CE, combined exposure index; CI, confidence intervals; ECHO, Environmental Influences on Child Health Outcomes; EJI, Environmental Justice Index; EPA, Environmental Protection Agency; ENV, environmental; FAQSD, Fused Air Quality Surface Downscaling Files; GED, General Educational Development; IRB, Institutional review board; NEI, National Emissions Inventory; NHPMS, National Highway Performance and Monitoring System; NIH, National Institutes of Health; NPL, National Priorities List; SES, socioeconomic status; SOC, social; SVI, Social Vulnerability Index; NLCD, National Land Cover Database; O3, ozone; RSEI, Risk-Screening Environmental Indicators; RUCC, Rural–Urban Continuum Code; U.S., United States.
References
- National Institute of Environmental Health Sciences 2018–2023 Strategic Plan. Available online: https://www.niehs.nih.gov/about/strategicplan/index.cfm (accessed on 6 September 2018).
- US Environmental Protection Agency EJSCREEN Technical Documentation. Available online: https://www.epa.gov/ejscreen/technical-information-about-ejscreen (accessed on 17 December 2021).
- August, L.; Bangia, K.; Plummer, L.; Prasad, S.; Ranjbar, K.; Slocombe, A.; Wieland, W. CalEnviroScreen 4.0. Available online: https://oehha.ca.gov/calenviroscreen/report/calenviroscreen-40 (accessed on 17 December 2021).
- Agency for Toxic Substances and Disease Registry [ATSDR] The Social Vulnerability Index (SVI): Data and Tools Download. Available online: https://svi.cdc.gov/SVIDataToolsDownload.html (accessed on 14 February 2017).
- Acevedo-Garcia, D.; McArdle, N.; Hardy, E.F.; Crisan, U.I.; Romano, B.; Norris, D.; Baek, M.; Reece, J. The Child Opportunity Index: Improving Collaboration Between Community Development And Public Health. Health Aff. 2014, 33, 1948–1957. [Google Scholar] [CrossRef] [PubMed]
- McKenzie, B.; Berens, A.; Bogović, S.; Conn, M.; Dent, A.; Flanagan, B.; Freelander, L.; Grossman, M.; Kashani, M.; Lehnert, E.; et al. Technical Documentation for the Environmental Justice Index 2022. Available online: https://www.atsdr.cdc.gov/placeandhealth/eji/docs/EJI-2022-Documentation.pdf (accessed on 11 August 2022).
- Council on Environmental Quality Climate and Economic Justice Screening Tool. Available online: https://screeningtool.geoplatform.gov (accessed on 26 August 2022).
- Sadd, J.L.; Pastor, M.; Morello-Frosch, R.; Scoggins, J.; Jesdale, B. Playing It Safe: Assessing Cumulative Impact and Social Vulnerability through an Environmental Justice Screening Method in the South Coast Air Basin, California. Int. J. Environ. Res. Public Health 2011, 8, 1441–1459. [Google Scholar] [CrossRef] [PubMed]
- Su, J.G.; Morello-Frosch, R.; Jesdale, B.M.; Kyle, A.D.; Shamasunder, B.; Jerrett, M. An Index for Assessing Demographic Inequalities in Cumulative Environmental Hazards with Application to Los Angeles, California. Environ. Sci. Technol. 2009, 43, 7626–7634. [Google Scholar] [CrossRef] [PubMed]
- Martenies, S.E.; Allshouse, W.B.; Starling, A.P.; Ringham, B.M.; Glueck, D.H.; Adgate, J.L.; Dabelea, D.; Magzamen, S. Combined Environmental and Social Exposures during Pregnancy and Associations with Neonatal Size and Body Composition: The Healthy Start Study. Environ. Epidemiol. 2019, 3, e043. [Google Scholar] [CrossRef] [PubMed]
- Department of Public Health & Environment Colorado EnviroScreen Tool. Available online: https://cdphe.colorado.gov/enviroscreen (accessed on 19 May 2023).
- University of Washington Department of Environmental & Occupational; Health Sciences and Washington State Department of Health Washington Environmental Health Disparities Map: Cumulative Impacts of Environmental Health Risk Factors Across Communities of Washington State: Technical Report Version 2.0. Available online: https://fortress.wa.gov/doh/wtn/WTNIBL/ (accessed on 24 May 2023).
- Office of Environmental Health Hazard Assessment CalEnviroScreen 3.0. Available online: https://oehha.ca.gov/calenviroscreen/report/calenviroscreen-30 (accessed on 28 November 2017).
- Vieira, V.M.; Villanueva, C.; Chang, J.; Ziogas, A.; Bristow, R.E. Impact of Community Disadvantage and Air Pollution Burden on Geographic Disparities of Ovarian Cancer Survival in California. Environ. Res. 2017, 156, 388–393. [Google Scholar] [CrossRef]
- Alcala, E.; Brown, P.; Capitman, J.A.; Gonzalez, M.; Cisneros, R. Cumulative Impact of Environmental Pollution and Population Vulnerability on Pediatric Asthma Hospitalizations: A Multilevel Analysis of CalEnviroScreen. Int. J. Environ. Res. Public Health 2019, 16, 2683. [Google Scholar] [CrossRef]
- Avitzur, N.; Noth, E.M.; Lamidi, M.; Nathan, S.D.; Collard, H.R.; DeDent, A.M.; Thakur, N.; Johannson, K.A. Relative Environmental and Social Disadvantage in Patients with Idiopathic Pulmonary Fibrosis. Thorax 2021, 77, 1237–1242. [Google Scholar] [CrossRef]
- Lehnert, E.A.; Wilt, G.; Flanagan, B.; Hallisey, E. Spatial Exploration of the CDC’s Social Vulnerability Index and Heat-Related Health Outcomes in Georgia. Int. J. Disaster Risk Reduct. 2020, 46, 101517. [Google Scholar] [CrossRef]
- Hyer, J.M.; Tsilimigras, D.I.; Diaz, A.; Mirdad, R.S.; Azap, R.A.; Cloyd, J.; Dillhoff, M.; Ejaz, A.; Tsung, A.; Pawlik, T.M. High Social Vulnerability and “Textbook Outcomes” after Cancer Operation. J. Am. Coll. Surg. 2021, 232, 351–359. [Google Scholar] [CrossRef]
- Perez, M.T.; Bucholz, E.; Asimacopoulos, E.; Ferraro, A.M.; Salem, S.M.; Schauer, J.; Holleman, C.; Sekhavat, S.; Tworetzky, W.; Powell, A.J.; et al. Impact of Maternal Social Vulnerability and Timing of Prenatal Care on Outcome of Prenatally Detected Congenital Heart Disease. Ultrasound Obstet. Gynecol. 2022, 60, 346–358. [Google Scholar] [CrossRef]
- Bandoli, G.; Baer, R.J.; Owen, M.; Kiernan, E.; Jelliffe-Pawlowski, L.; Kingsmore, S.; Chambers, C.D. Maternal, Infant, and Environmental Risk Factors for Sudden Unexpected Infant Deaths: Results from a Large, Administrative Cohort. J. Matern. Fetal Neonatal Med. 2021, 35, 8998–9005. [Google Scholar] [CrossRef] [PubMed]
- Appleton, A.A.; Lin, B.; Holdsworth, E.A.; Feingold, B.J.; Schell, L.M. Prenatal Exposure to Favorable Social and Environmental Neighborhood Conditions Is Associated with Healthy Pregnancy and Infant Outcomes. Int. J. Environ. Res. Public Health 2021, 18, 6161. [Google Scholar] [CrossRef] [PubMed]
- Padula, A.M.; Rivera-Núñez, Z.; Barrett, E.S. Combined Impacts of Prenatal Environmental Exposures and Psychosocial Stress on Offspring Health: Air Pollution and Metals. Curr. Environ. Health Rep. 2020, 7, 89–100. [Google Scholar] [CrossRef] [PubMed]
- Martenies, S.E.; Zhang, M.; Corrigan, A.E.; Kvit, A.; Shields, T.; Wheaton, W.; Bastain, T.M.; Breton, C.V.; Dabelea, D.; Habre, R.; et al. Associations between Combined Exposure to Environmental Hazards and Social Stressors at the Neighborhood Level and Individual Perinatal Outcomes in the ECHO-Wide Cohort. Health Place 2022, 76, 102858. [Google Scholar] [CrossRef] [PubMed]
- Bailey, Z.D.; Feldman, J.M.; Bassett, M.T. How Structural Racism Works—Racist Policies as a Root Cause of U.S. Racial Health Inequities. N. Engl. J. Med. 2021, 384, 768–773. [Google Scholar] [CrossRef]
- Groos, M.; Wallace, M.; Hardeman, R.; Theall, K. Measuring Inequity: A Systematic Review of Methods Used to Quantify Structural Racism. J. Health Disparities Res. Pract. 2018, 11, 13. [Google Scholar]
- Gutschow, B.; Gray, B.; Ragavan, M.I.; Sheffield, P.E.; Philipsborn, R.P.; Jee, S.H. The Intersection of Pediatrics, Climate Change, and Structural Racism: Ensuring Health Equity through Climate Justice. Curr. Probl. Pediatr. Adolesc. Health Care 2021, 51, 101028. [Google Scholar] [CrossRef]
- Shim, R.S.; Starks, S.M. COVID-19, Structural Racism, and Mental Health Inequities: Policy Implications for an Emerging Syndemic. Psychiatr. Serv. 2021, 72, 1193–1198. [Google Scholar] [CrossRef]
- LeWinn, K.Z.; Caretta, E.; Davis, A.; Anderson, A.L.; Oken, E. SPR Perspectives: Environmental Influences on Child Health Outcomes (ECHO) Program: Overcoming Challenges to Generate Engaged, Multidisciplinary Science. Pediatr. Res. 2021, 92, 1262–1269. [Google Scholar] [CrossRef]
- Blaisdell, C.J.; Park, C.; Hanspal, M.; Roary, M.; Arteaga, S.S.; Laessig, S.; Luetkemeier, E.; Gillman, M.W. The NIH ECHO Program: Investigating How Early Environmental Influences Affect Child Health. Pediatr. Res. 2021, 92, 1215–1216. [Google Scholar] [CrossRef]
- Gillman, M.W.; Blaisdell, C.J. Environmental Influences on Child Health Outcomes, a Research Program of the NIH. Curr. Opin. Pediatr. 2018, 30, 260–262. [Google Scholar] [CrossRef] [PubMed]
- Multi-Resolution Land Characteristics Consortium National Land Cover Database. Available online: https://www.mrlc.gov/ (accessed on 17 November 2017).
- US Environmental Protection Agency 2014 National Emissions Inventory Report. Available online: https://gispub.epa.gov/neireport/2014/ (accessed on 25 June 2020).
- US Environmental Protection Agency Superfund: National Priorities List (NPL). Available online: https://www.epa.gov/superfund/superfund-national-priorities-list-npl (accessed on 12 May 2022).
- US Environmental Protection Agency Risk-Screening Environmental Indicators (RSEI) Model. Available online: https://www.epa.gov/rsei (accessed on 9 November 2021).
- US Environmental Protection Agency RSIG-Related Downloadable Data Files. Available online: https://www.epa.gov/hesc/rsig-related-downloadable-data-files (accessed on 9 November 2021).
- US Department of Transportation [US DOT] Highway Performance Monitoring System. Available online: https://www.fhwa.dot.gov/policyinformation/hpms.cfm (accessed on 23 July 2018).
- Flanagan, B.E.; Gregory, E.W.; Hallisey, E.J.; Heitgerd, J.L.; Lewis, B. A Social Vulnerability Index for Disaster Management. J. Homel. Secur. Emerg. Manag. 2011, 8, 0000102202154773551792. [Google Scholar] [CrossRef]
- Duncan, C.; Jones, K.; Moon, G. Context, Composition and Heterogeneity: Using Multilevel Models in Health Research. Soc. Sci. Med. 1998, 46, 97–117. [Google Scholar] [CrossRef]
- US Census Bureau 2010–2014 American Community Survey (ACS) 5-Year Estimates. Available online: https://www.census.gov/programs-surveys/acs/ (accessed on 6 October 2016).
- US Census Bureau 2012–2016 American Community Survey (ACS) 5-Year Estimates. Available online: https://www.census.gov/programs-surveys/acs/ (accessed on 6 October 2016).
- Coulston, J.W.; Moisen, G.G.; Wilson, B.T.; Finco, M.V.; Cohen, W.B.; Brewer, C.K. Modeling Percent Tree Canopy Cover: A Pilot Study. Photogramm. Eng. Remote Sens. 2012, 78, 715–727. [Google Scholar] [CrossRef]
- Cushing, L.; Faust, J.; August, L.M.; Cendak, R.; Wieland, W.; Alexeeff, G. Racial/Ethnic Disparities in Cumulative Environmental Health Impacts in California: Evidence From a Statewide Environmental Justice Screening Tool (CalEnviroScreen 1.1). Am. J. Public Health 2015, 105, 2341–2348. [Google Scholar] [CrossRef] [PubMed]
- August, L.M.; Faust, J.B.; Cushing, L.; Zeise, L.; Alexeeff, G.V. Methodological Considerations in Screening for Cumulative Environmental Health Impacts: Lessons Learned from a Pilot Study in California. Int. J. Environ. Res. Public Health 2012, 9, 3069–3084. [Google Scholar] [CrossRef] [PubMed]
- Appleton, A.A.; Holdsworth, E.A.; Kubzansky, L.D. A Systematic Review of the Interplay Between Social Determinants and Environmental Exposures for Early-Life Outcomes. Curr. Environ. Health Rep. 2016, 3, 287–301. [Google Scholar] [CrossRef]
- Généreux, M.; Auger, N.; Goneau, M.; Daniel, M. Neighbourhood Socioeconomic Status, Maternal Education and Adverse Birth Outcomes among Mothers Living near Highways. J. Epidemiol. Community Health 2008, 62, 695–700. [Google Scholar] [CrossRef]
- Padula, A.M.; Mortimer, K.M.; Tager, I.B.; Hammond, S.K.; Lurmann, F.W.; Yang, W.; Stevenson, D.K.; Shaw, G.M. Traffic-Related Air Pollution and Risk of Preterm Birth in the San Joaquin Valley of California. Ann. Epidemiol. 2014, 24, 888–895.e4. [Google Scholar] [CrossRef] [PubMed]
- Ponce, N.A.; Hoggatt, K.J.; Wilhelm, M.; Ritz, B. Preterm Birth: The Interaction of Traffic-Related Air Pollution with Economic Hardship in Los Angeles Neighborhoods. Am. J. Epidemiol. 2005, 162, 140–148. [Google Scholar] [CrossRef]
- Yi, O.; Kim, H.; Ha, E. Does Area Level Socioeconomic Status Modify the Effects of PM10 on Preterm Delivery? Environ. Res. 2010, 110, 55–61. [Google Scholar] [CrossRef] [PubMed]
- Banay, R.F.; Bezold, C.P.; James, P.; Hart, J.E.; Laden, F. Residential Greenness: Current Perspectives on Its Impact on Maternal Health and Pregnancy Outcomes. Int. J. Womens Health 2017, 9, 133–144. [Google Scholar] [CrossRef] [PubMed]
- Culhane, J.F.; Goldenberg, R.L. Racial Disparities in Preterm Birth. Semin. Perinatol. 2011, 35, 234–239. [Google Scholar] [CrossRef] [PubMed]
- Heo, S.; Fong, K.C.; Bell, M.L. Risk of Particulate Matter on Birth Outcomes in Relation to Maternal Socio-Economic Factors: A Systematic Review. Environ. Res. Lett. 2019, 14, 123004. [Google Scholar] [CrossRef]
- Kothari, C.L.; Paul, R.; Dormitorio, B.; Ospina, F.; James, A.; Lenz, D.; Baker, K.; Curtis, A.; Wiley, J. The Interplay of Race, Socioeconomic Status and Neighborhood Residence upon Birth Outcomes in a High Black Infant Mortality Community. SSM Popul. Health 2016, 2, 859–867. [Google Scholar] [CrossRef]
- Masi, C.M.; Hawkley, L.C.; Harry Piotrowski, Z.; Pickett, K.E. Neighborhood Economic Disadvantage, Violent Crime, Group Density, and Pregnancy Outcomes in a Diverse, Urban Population. Soc. Sci. Med. 2007, 65, 2440–2457. [Google Scholar] [CrossRef]
- Clark, L.P.; Millet, D.B.; Marshall, J.D. Changes in Transportation-Related Air Pollution Exposures by Race-Ethnicity and Socioeconomic Status: Outdoor Nitrogen Dioxide in the United States in 2000 and 2010. Environ. Health Perspect. 2017, 125, 097012. [Google Scholar] [CrossRef]
- Liu, J.; Clark, L.P.; Bechle, M.J.; Hajat, A.; Kim, S.-Y.; Robinson, A.L.; Sheppard, L.; Szpiro, A.A.; Marshall, J.D. Disparities in Air Pollution Exposure in the United States by Race/Ethnicity and Income, 1990–2010. Environ. Health Perspect. 2021, 129, 127005. [Google Scholar] [CrossRef] [PubMed]
- Wen, M.; Zhang, X.; Harris, C.D.; Holt, J.B.; Croft, J.B. Spatial Disparities in the Distribution of Parks and Green Spaces in the USA. Ann. Behav. Med. 2013, 45, S18–S27. [Google Scholar] [CrossRef]
- US Department of Agriculture Rural-Urban Continuum Codes. Available online: https://www.ers.usda.gov/data-products/rural-urban-continuum-codes.aspx (accessed on 9 November 2021).
- Read, J.G.; Lynch, S.M.; West, J.S. Disaggregating Heterogeneity among Non-Hispanic Whites: Evidence and Implications for U.S. Racial/Ethnic Health Disparities. Popul. Res. Policy Rev. 2021, 40, 9–31. [Google Scholar] [CrossRef]
- Zou, G. A Modified Poisson Regression Approach to Prospective Studies with Binary Data. Am. J. Epidemiol. 2004, 159, 702–706. [Google Scholar] [CrossRef] [PubMed]
- Tessum, C.W.; Paolella, D.A.; Chambliss, S.E.; Apte, J.S.; Hill, J.D.; Marshall, J.D. PM2.5 Polluters Disproportionately and Systemically Affect People of Color in the United States. Sci. Adv. 2021, 7, eabf4491. [Google Scholar] [CrossRef] [PubMed]
- Chambliss, S.E.; Pinon, C.P.R.; Messier, K.P.; LaFranchi, B.; Upperman, C.R.; Lunden, M.M.; Robinson, A.L.; Marshall, J.D.; Apte, J.S. Local- and Regional-Scale Racial and Ethnic Disparities in Air Pollution Determined by Long-Term Mobile Monitoring. Proc. Natl. Acad. Sci. USA 2021, 118, e2109249118. [Google Scholar] [CrossRef]
- Woo, B.; Kravitz-Wirtz, N.; Sass, V.; Crowder, K.; Teixeira, S.; Takeuchi, D.T. Residential Segregation and Racial/Ethnic Disparities in Ambient Air Pollution. Race Soc. Probl. 2019, 11, 60–67. [Google Scholar] [CrossRef] [PubMed]
- Williams, T.G.; Logan, T.M.; Zuo, C.T.; Liberman, K.D.; Guikema, S.D. Parks and Safety: A Comparative Study of Green Space Access and Inequity in Five US Cities. Landsc. Urban Plan. 2020, 201, 103841. [Google Scholar] [CrossRef]
- Kramar, D.E.; Anderson, A.; Hilfer, H.; Branden, K.; Gutrich, J.J. A Spatially Informed Analysis of Environmental Justice: Analyzing the Effects of Gerrymandering and the Proximity of Minority Populations to U.S. Superfund Sites. Environ. Justice 2018, 11, 29–39. [Google Scholar] [CrossRef]
- Burwell-Naney, K.; Zhang, H.; Samantapudi, A.; Jiang, C.; Dalemarre, L.; Rice, L.; Williams, E.; Wilson, S. Spatial Disparity in the Distribution of Superfund Sites in South Carolina: An Ecological Study. Environ. Health 2013, 12, 96. [Google Scholar] [CrossRef]
- Payne-Sturges, D.C.; Gee, G.C.; Cory-Slechta, D.A. Confronting Racism in Environmental Health Sciences: Moving the Science Forward for Eliminating Racial Inequities. Environ. Health Perspect. 2021, 129, 055002. [Google Scholar] [CrossRef]
- Crear-Perry, J.; Correa-de-Araujo, R.; Lewis Johnson, T.; McLemore, M.R.; Neilson, E.; Wallace, M. Social and Structural Determinants of Health Inequities in Maternal Health. J. Women’s Health 2021, 30, 230–235. [Google Scholar] [CrossRef]
- Bobb, J.F.; Valeri, L.; Claus Henn, B.; Christiani, D.C.; Wright, R.O.; Mazumdar, M.; Godleski, J.J.; Coull, B.A. Bayesian Kernel Machine Regression for Estimating the Health Effects of Multi-Pollutant Mixtures. Biostatistics 2015, 16, 493–508. [Google Scholar] [CrossRef]
- Harley, K.G.; Berger, K.; Rauch, S.; Kogut, K.; Claus Henn, B.; Calafat, A.M.; Huen, K.; Eskenazi, B.; Holland, N. Association of Prenatal Urinary Phthalate Metabolite Concentrations and Childhood BMI and Obesity. Pediatr. Res. 2017, 82, 405–415. [Google Scholar] [CrossRef] [PubMed]
- Keil, A.P.; Buckley, J.P.; O’Brien, K.M.; Ferguson, K.K.; Zhao, S.; White, A.J. A Quantile-Based g-Computation Approach to Addressing the Effects of Exposure Mixtures. Environ. Health Perspect. 2020, 128, 047004. [Google Scholar] [CrossRef] [PubMed]
- Valeri, L.; Mazumdar, M.M.; Bobb, J.F.; Claus Henn, B.; Rodrigues, E.; Sharif, O.I.A.; Kile, M.L.; Quamruzzaman, Q.; Afroz, S.; Golam, M.; et al. The Joint Effect of Prenatal Exposure to Metal Mixtures on Neurodevelopmental Outcomes at 20–40 Months of Age: Evidence from Rural Bangladesh. Environ. Health Perspect. 2017, 125, 067015. [Google Scholar] [CrossRef] [PubMed]
- Werner, A.K.; Strosnider, H.; Kassinger, C.; Shin, M. Lessons Learned From the Environmental Public Health Tracking Sub-County Data Pilot Project. J. Public Health Manag. Pract. 2018, 24, E20–E27. [Google Scholar] [CrossRef]
- Kiaghadi, A.; Rifai, H.S.; Dawson, C.N. The Presence of Superfund Sites as a Determinant of Life Expectancy in the United States. Nat. Commun. 2021, 12, 1947. [Google Scholar] [CrossRef] [PubMed]
- Axelsson, G.; Stockfelt, L.; Andersson, E.; Gidlof-Gunnarsson, A.; Sallsten, G.; Barregard, L. Annoyance and Worry in a Petrochemical Industrial Area—Prevalence, Time Trends and Risk Indicators. Int. J. Environ. Res. Public Health 2013, 10, 1418–1438. [Google Scholar] [CrossRef]
- Marques, S.; Lima, M.L. Living in Grey Areas: Industrial Activity and Psychological Health. J. Environ. Psychol. 2011, 31, 314–322. [Google Scholar] [CrossRef]
- Ventriglio, A.; Bellomo, A.; di Gioia, I.; Di Sabatino, D.; Favale, D.; De Berardis, D.; Cianconi, P. Environmental Pollution and Mental Health: A Narrative Review of Literature. CNS Spectr. 2021, 26, 51–61. [Google Scholar] [CrossRef]
- Schaider, L.A.; Swetschinski, L.; Campbell, C.; Rudel, R.A. Environmental Justice and Drinking Water Quality: Are There Socioeconomic Disparities in Nitrate Levels in U.S. Drinking Water? Environ. Health 2019, 18, 3. [Google Scholar] [CrossRef]
- Dongarwar, D.; Tahseen, D.; Wang, L.; Aliyu, M.H.; Salihu, H.M. Trends and Predictors of Preterm Birth among Asian Americans by Ethnicity, 1992–2018. J. Matern. Neonatal Med. 2021, 35, 5881–5887. [Google Scholar] [CrossRef]
- Grineski, S.; Morales, D.X.; Collins, T.; Hernandez, E.; Fuentes, A. The Burden of Carcinogenic Air Toxics among Asian Americans in Four US Metro Areas. Popul. Environ. 2019, 40, 257–282. [Google Scholar] [CrossRef] [PubMed]
- Payne-Sturges, D.C.; Puett, R.; Cory-Slechta, D.A. Both Parents Matter: A National-Scale Analysis of Parental Race/Ethnicity, Disparities in Prenatal PM2.5 Exposures and Related Impacts on Birth Outcomes. Environ. Health 2022, 21, 47. [Google Scholar] [CrossRef] [PubMed]
- Dashner-Titus, E.J.; Hoover, J.; Li, L.; Lee, J.-H.; Du, R.; Liu, K.J.; Traber, M.G.; Ho, E.; Lewis, J.; Hudson, L.G. Metal Exposure and Oxidative Stress Markers in Pregnant Navajo Birth Cohort Study Participants. Free Radic Biol. Med. 2018, 124, 484–492. [Google Scholar] [CrossRef] [PubMed]
- Lewis, J.; Gonzales, M.; Burnette, C.; Benally, M.; Seanez, P.; Shuey, C.; Nez, H.; Nez, C.; Nez, S. Environmental Exposures to Metals in Native Communities and Implications for Child Development: Basis for the Navajo Birth Cohort Study. J. Soc. Work Disabil. Rehabil. 2015, 14, 245–269. [Google Scholar] [CrossRef] [PubMed]
- Hedman, L.; van Ham, M. Understanding Neighbourhood Effects: Selection Bias and Residential Mobility. In Neighbourhood Effects Research: New Perspectives; van Ham, M., Manley, D., Bailey, N., Simpson, L., Maclennan, D., Eds.; Springer: Dordrecht, The Netherlands, 2012; pp. 79–99. ISBN 978-94-007-2309-2. [Google Scholar]

Disclaimer/Publisher’s Note: The statements, opinions and data contained in all publications are solely those of the individual author(s) and contributor(s) and not of MDPI and/or the editor(s). MDPI and/or the editor(s) disclaim responsibility for any injury to people or property resulting from any ideas, methods, instructions or products referred to in the content. |
© 2023 by the authors. Licensee MDPI, Basel, Switzerland. This article is an open access article distributed under the terms and conditions of the Creative Commons Attribution (CC BY) license (https://creativecommons.org/licenses/by/4.0/).