
Circadian Modulation of the Antioxidant Effect of Grape Consumption: A Randomized Controlled Trial


Abstract
:1. Introduction
2. Materials and Methods
2.1. Materials and Reagents
2.2. Study Design
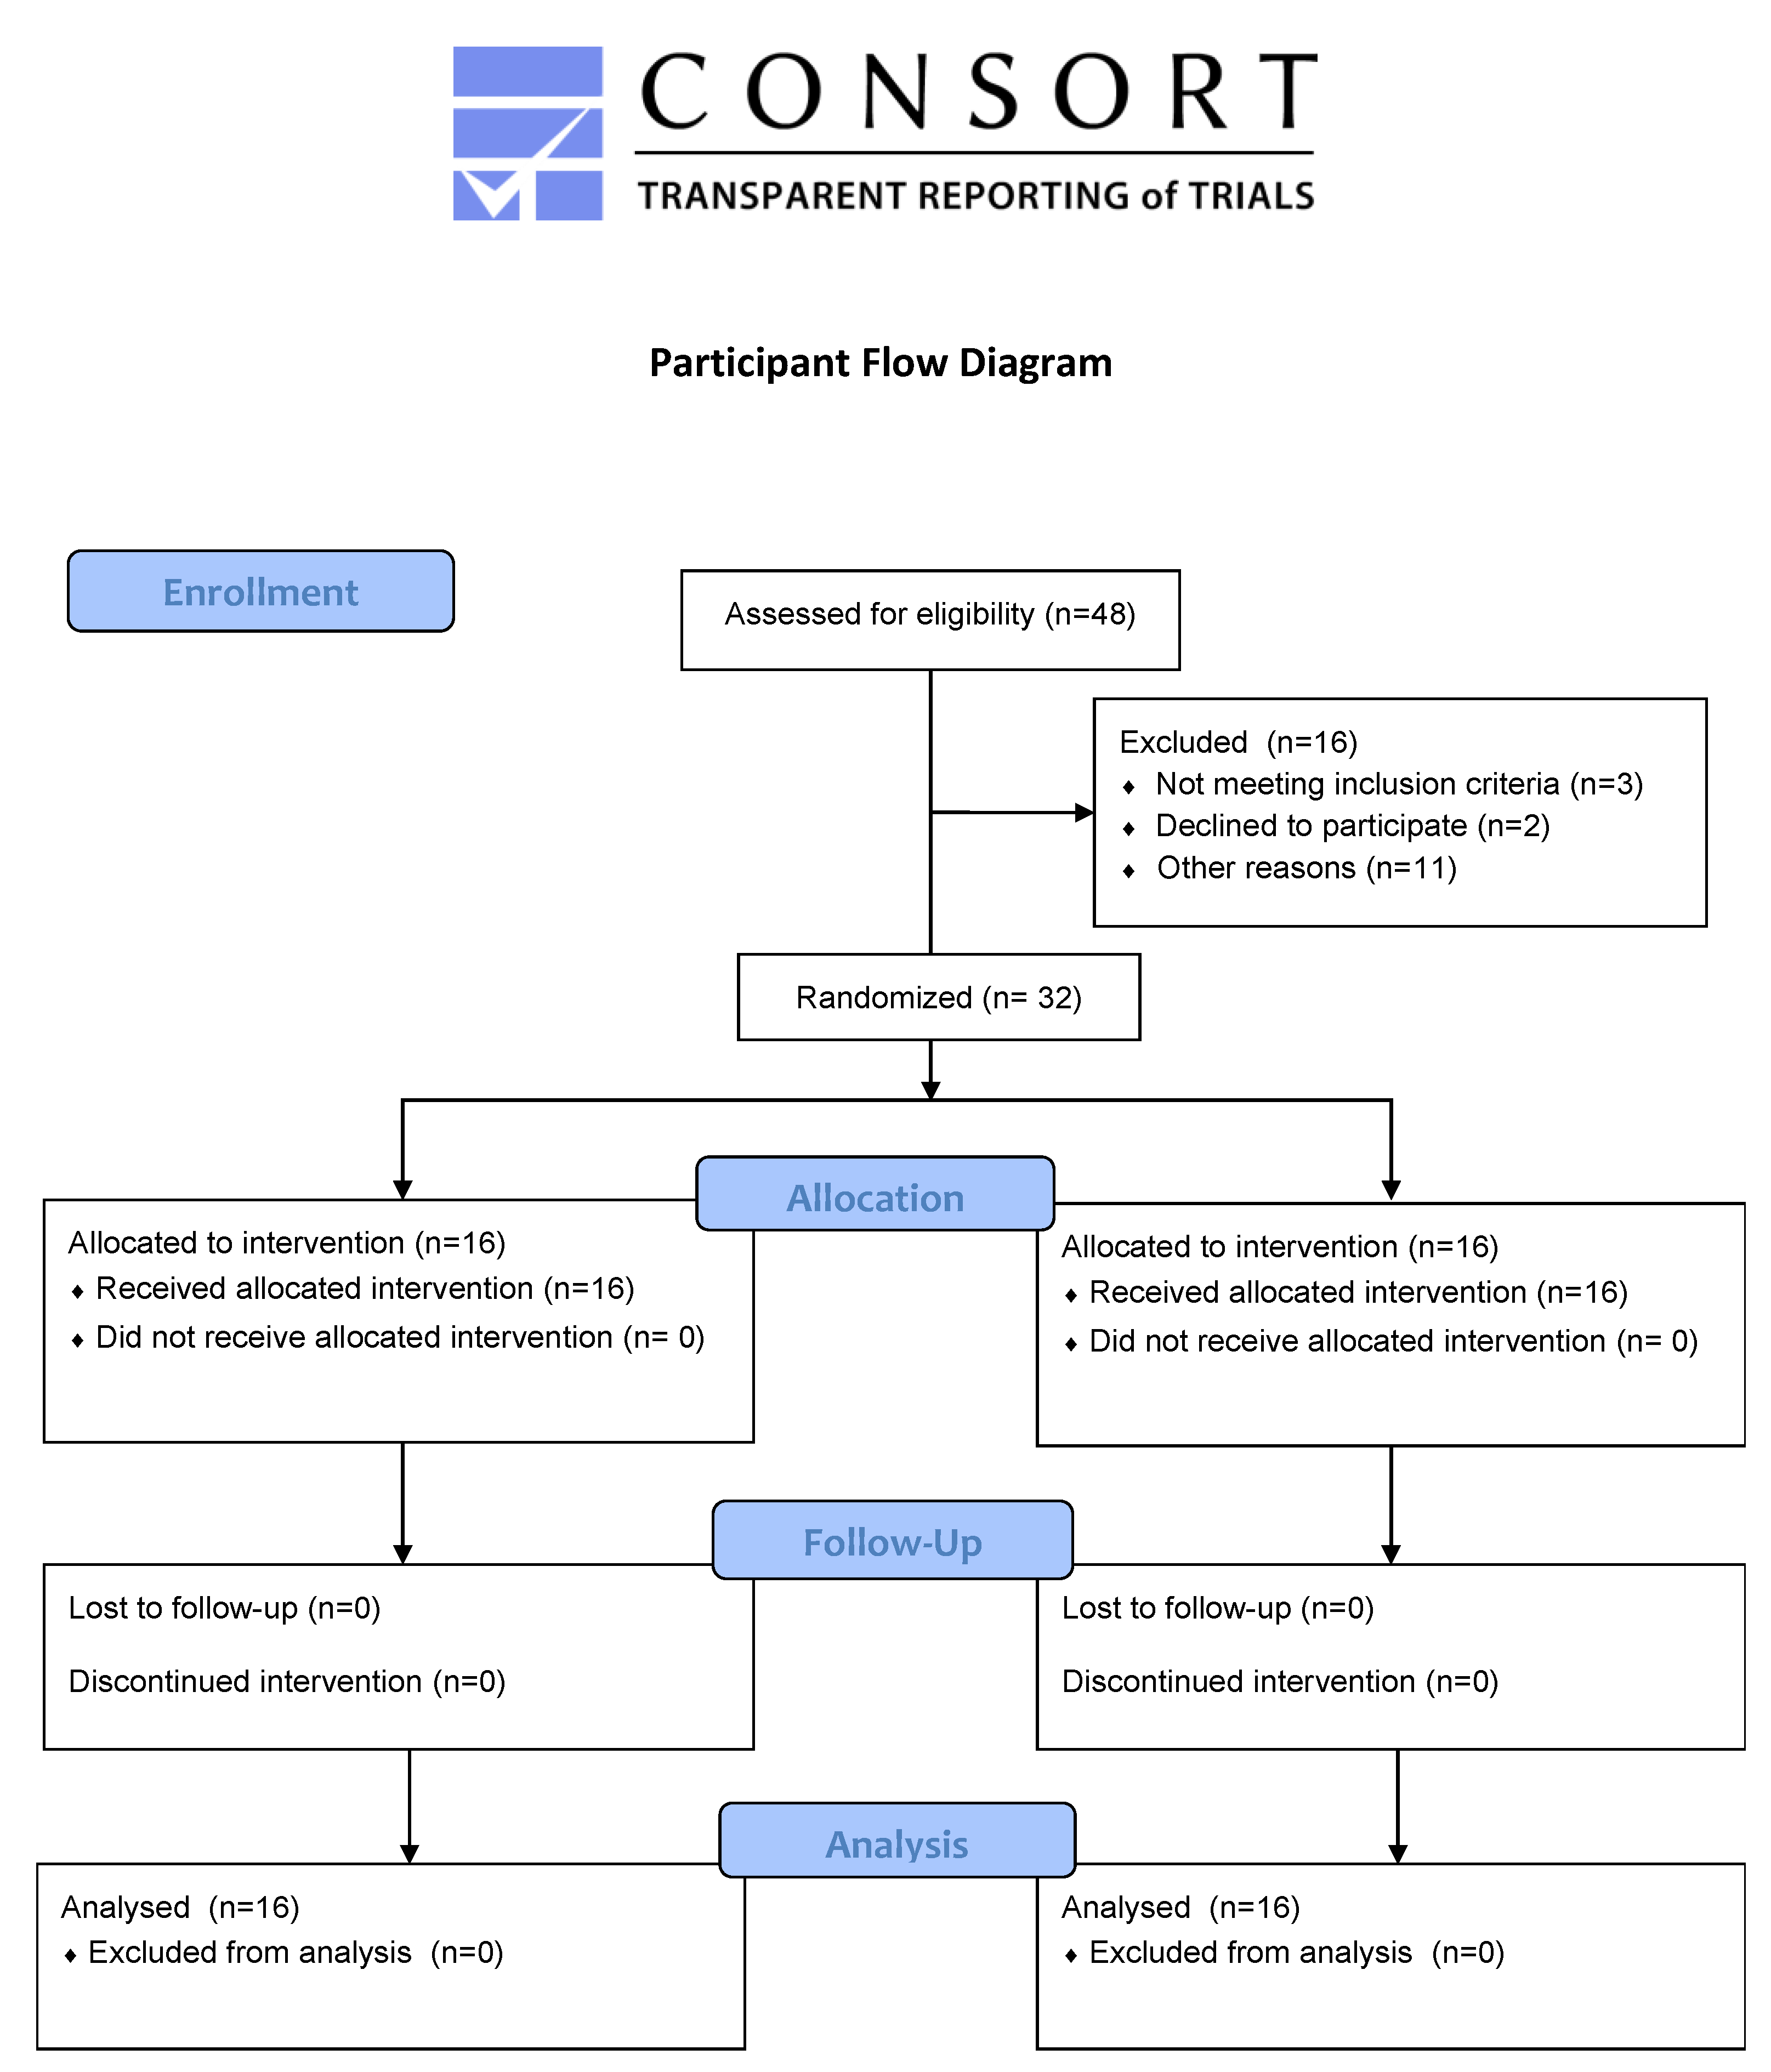
2.3. Participants
2.4. Dietary Assessment
2.5. Intervention
2.6. Anthropometric Measurements, Urine Collection and Biomarker/Metabolite Analysis
2.7. Sample Preparation
2.8. LC-MS/MS Conditions
2.9. Statistical Analysis
3. Results
3.1. Participant Characteristics
3.2. Biomarker Response to Treatment
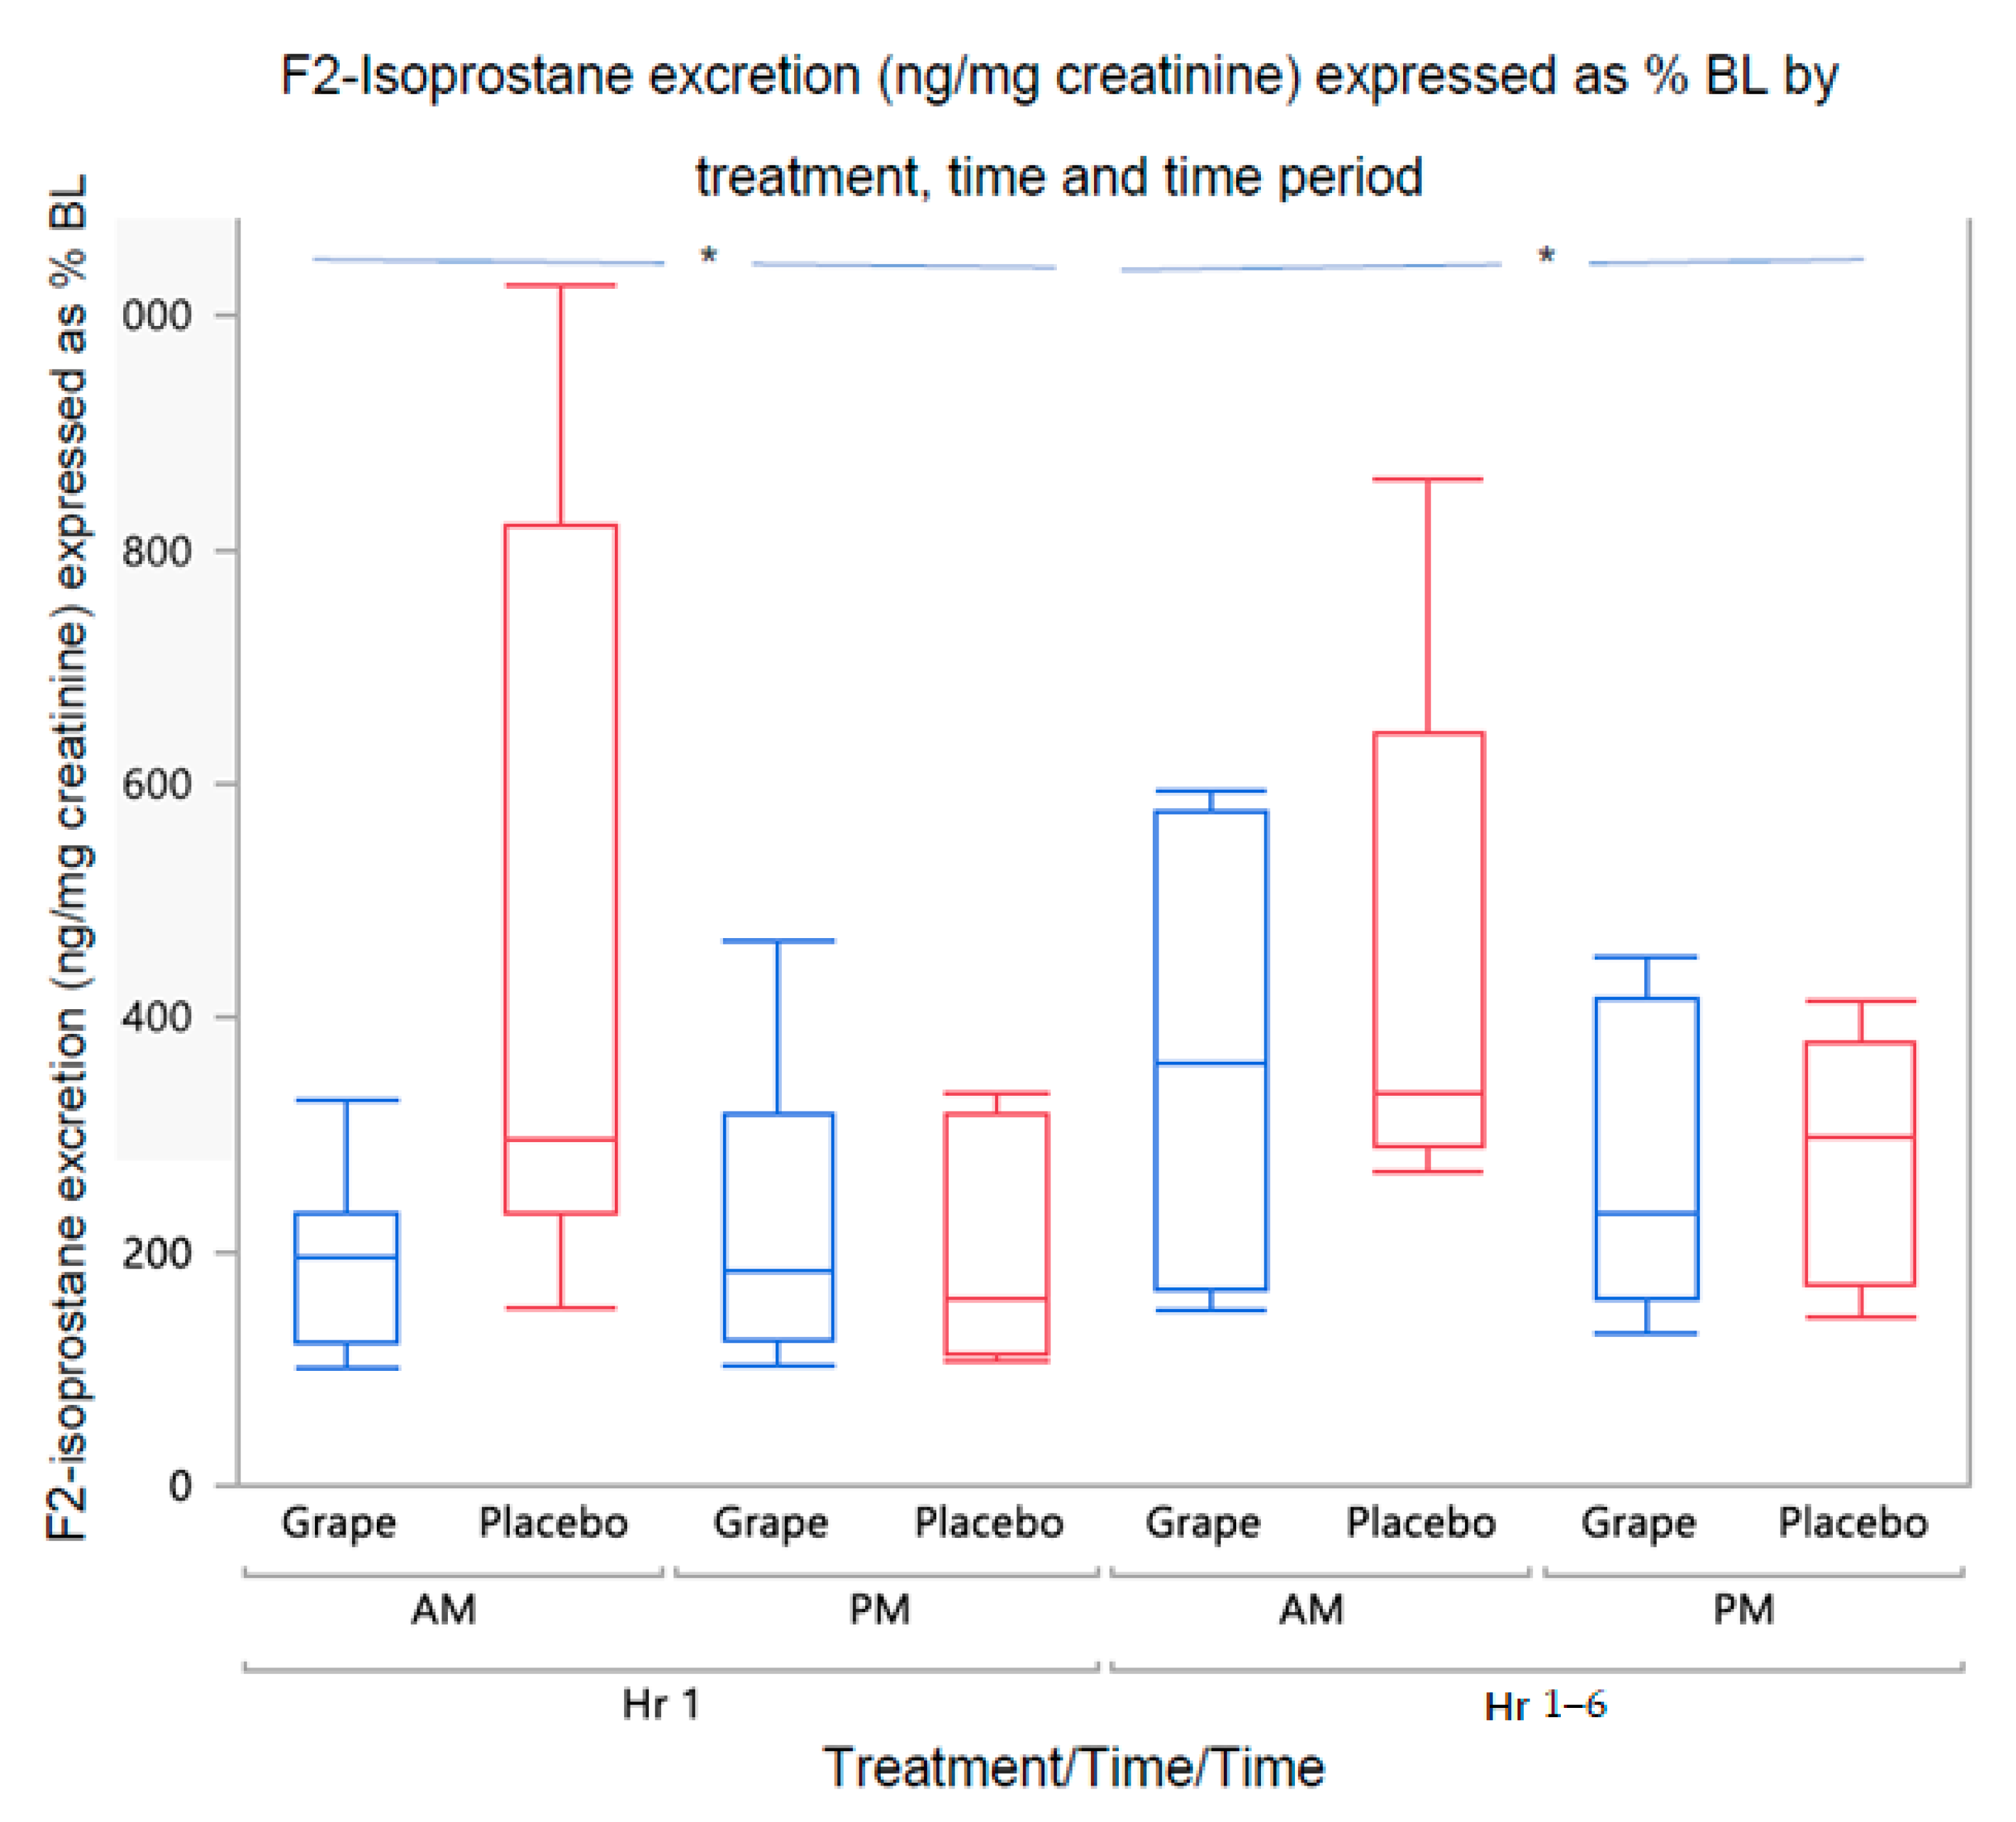
3.2.1. Urine F2-Isoprostane Concentration
3.2.2. Urine Grape Metabolite Concentrations
Grape Metabolite Excretion by Treatment and Time
Relationship of F2-Isoprostane to Grape Metabolites
3.3. Dietary Assessment
4. Discussion
5. Conclusions
Supplementary Materials
Author Contributions
Funding
Institutional Review Board Statement
Informed Consent Statement
Data Availability Statement
Conflicts of Interest
References
- Curtis, A.M.; Bellet, M.M.; Sassone-Corsi, P.; O’Neill, L.A. Circadian Clock Proteins and Immunity. Immunity 2014, 40, 178–186. [Google Scholar] [CrossRef] [PubMed] [Green Version]
- Stenvers, D.; Scheer, F.; Schrauwen, P.; la Fleur, S.E.; Kalsbeek, A. Circadian Clocks and Insulin Resistance. Nat. Rev. Endocrinol. 2019, 15, 75–89. [Google Scholar] [CrossRef] [PubMed] [Green Version]
- Manoogian, E.; Panda, S. Circadian Clock, Nutrient Quality, and Eating Pattern Tune Diurnal Rhythms in the Mitochondrial Proteome. Proc. Natl. Acad. Sci. USA 2016, 113, 3127–3129. [Google Scholar] [CrossRef]
- Panda, S. Circadian Physiology of Metabolism. Science 2016, 354, 1008–1015. [Google Scholar] [CrossRef]
- Adafer, R.; Messaadi, W.; Meddahi, M.; Patey, A.; Haderbache, A.; Bayen, S.; Messaadi, N. Food Timing, Circadian Rhythm and Chrononutrition: A Systematic Review of Time-Restricted Eating’s Effects on Human Health. Nutrients 2020, 12, 3770. [Google Scholar] [CrossRef]
- Katsi, V.; Papakonstantinou, I.P.; Soulaidopoulos, S.; Katsiki, N.; Tsioufis, K. Chrononutrition in Cardiometabolic Health. J. Clin. Med. 2022, 11, 296. [Google Scholar] [CrossRef]
- Praticò, D. The Neurobiology of Isoprostanes and Alzheimer’s Disease. Biochim. Biophys. Acta 2010, 1801, 930–933. [Google Scholar] [CrossRef] [PubMed]
- Roberts, L.J.; Morrow, J.D. Measurement of F(2)-Isoprostanes as an Index of Oxidative Stress in Vivo. Free Radic. Biol. Med. 2000, 28, 505–513. [Google Scholar] [CrossRef] [PubMed]
- Basu, S. F2-Isoprostanes in Human Health and Diseases: From Molecular Mechanisms to Clinical Implications. Antioxid. Redox Signal. 2008, 10, 1405–1434. [Google Scholar] [CrossRef] [PubMed]
- Seet, R.C.S.; Lee, C.-Y.J.; Lim, E.C.H.; Tan, J.J.H.; Quek, A.M.L.; Chong, W.-L.; Looi, W.-F.; Huang, S.-H.; Wang, H.; Chan, Y.-H.; et al. Oxidative Damage in Parkinson Disease: Measurement Using Accurate Biomarkers. Free Radic. Biol. Med. 2010, 48, 560–566. [Google Scholar] [CrossRef] [PubMed]
- Greco, A.; Minghetti, L.; Levi, G. Isoprostanes, Novel Markers of Oxidative Injury, Help Understanding the Pathogenesis of Neurodegenerative Diseases. Neurochem. Res. 2000, 25, 1357–1364. [Google Scholar] [CrossRef]
- Miller, S.A.; White, J.A.; Chowdhury, R.; Gales, D.N.; Tameru, B.; Tiwari, A.K.; Samuel, T. Effects of Consumption of Whole Grape Powder on Basal NF-ΚB Signaling and Inflammatory Cytokine Secretion in a Mouse Model of Inflammation. J. Nutr. Intermed. Metab. 2018, 11, 1–8. [Google Scholar] [CrossRef]
- Chuang, C.C.; McIntosh, M.K. Potential Mechanisms by Which Polyphenol-Rich Grapes Prevent Obesity-Mediated Inflammation and Metabolic Diseases. Annu. Rev. Nutr. 2011, 31, 155–176. [Google Scholar] [CrossRef] [PubMed]
- Stamer, D.; Nizami, S. Whole Grape Alleviates Inflammatory Arthritis through Inhibition of Tumor Necrosis Factor. J. Funct. Foods 2017, 35, 458–465. [Google Scholar] [CrossRef]
- Seymour, E.M.; Singer, A.A.; Bennink, M.R.; Parikh, R.V.; Kirakosyan, A.; Kaufman, P.B.; Bolling, S.F. Chronic Intake of a Phytochemical-Enriched Diet Reduces Cardiac Fibrosis and Diastolic Dysfunction Caused by Prolonged Salt-Sensitive Hypertension. J. Gerontol. A Biol. Sci. Med. Sci. 2008, 63, 1034–1042. [Google Scholar] [CrossRef] [PubMed] [Green Version]
- Zern, T.L.; Wood, R.J.; Greene, C.; West, K.L.; Liu, Y.; Aggarwal, D.; Shachter, N.S.; Fernandez, M.L. Grape Polyphenols Exert a Cardioprotective Effect in Pre- and Postmenopausal Women by Lowering Plasma Lipids and Reducing Oxidative Stress. J. Nutr. 2005, 135, 1911–1917. [Google Scholar] [CrossRef] [Green Version]
- Das, S.; Das, D.K. Resveratrol: A Therapeutic Promise for Cardiovascular Diseases. Recent Pat. Cardiovasc. Drug Discov. 2007, 2, 133–138. [Google Scholar] [CrossRef]
- Choy, K.W.; Murugan, D.; Leong, X.-F.; Abas, R.; Alias, A.; Mustafa, M.R. Flavonoids as Natural Anti-Inflammatory Agents Targeting Nuclear Factor-Kappa B (NFκB) Signaling in Cardiovascular Diseases: A Mini Review. Front. Pharmacol. 2019, 10, 1295. [Google Scholar]
- Costa, E.; Cosme, F.; Jordão, A.M.; Mendes-Faia, A. Anthocyanin Profile and Antioxidant Activity from 24 Grape Varieties Cultivated in Two Portuguese Wine Regions. OENO One 2014, 48, 51–62. [Google Scholar] [CrossRef]
- Silva, M.M.; Lidon, F.C. An Overview on Applications and Side Effects of Antioxidant Food Additives. Emir. J. Food Agric. 2016, 28, 823–832. [Google Scholar] [CrossRef]
- Zhang, H.; Xu, Z.; Zhao, H.; Wang, X.; Pang, J.; Li, Q.; Yang, Y.; Ling, W. Anthocyanin Supplementation Improves Anti-Oxidative and Anti-Inflammatory Capacity in a Dose-Response Manner in Subjects with Dyslipidemia. Redox Biol. 2020, 32, 101474. [Google Scholar] [CrossRef]
- Li, D.; Zhang, Y.; Liu, Y.; Sun, R.; Xia, M. Purified Anthocyanin Supplementation Reduces Dyslipidemia, Enhances Antioxidant Capacity, and Prevents Insulin Resistance in Diabetic Patients. J. Nutr. 2015, 145, 742–748. [Google Scholar] [CrossRef] [PubMed] [Green Version]
- Herieka, M.; Erridge, C. High-Fat Meal Induced Postprandial Inflammation. Mol. Nutr. Food Res. 2014, 58, 136–146. [Google Scholar] [CrossRef] [PubMed]
- Roehrs, M.; Conte, L.; da Silva, D.T.; Duarte, T.; Maurer, L.H.; de Carvalho, J.A.M.; Moresco, R.N.; Somacal, S.; Emanuelli, T. Annatto Carotenoids Attenuate Oxidative Stress and Inflammatory Response after High-Calorie Meal in Healthy Subjects. Food Res. Int. 2017, 100, 771–779. [Google Scholar] [CrossRef]
- Ozdal, T.; Sela, D.A.; Xiao, J.; Boyacioglu, D.; Chen, F.; Capanoglu, E. The Reciprocal Interactions between Polyphenols and Gut Microbiota and Effects on Bioaccessibility. Nutrients 2016, 8, 78. [Google Scholar] [CrossRef] [Green Version]
- Meng, X.; Maliakal, P.; Lu, H.; Lee, M.J.; Yang, C.S. Urinary and Plasma Levels of Resveratrol and Quercetin in Humans, Mice, and Rats after Ingestion of Pure Compounds and Grape Juice. J. Agric. Food Chem. 2004, 52, 935–942. [Google Scholar] [CrossRef]
- Garcia-Perez, I.; Posma, J.M.; Chambers, E.S.; Nicholson, J.K.; Mathers, J.C.; Beckmann, M.; Draper, J.; Holmes, E.; Frost, G. An Analytical Pipeline for Quantitative Characterization of Dietary Intake: Application To Assess Grape Intake. J. Agric. Food Chem. 2016, 64, 2423–2431. [Google Scholar] [CrossRef] [PubMed] [Green Version]
- Ulaszewska, M.; Garcia-Aloy, M.; Vázquez-Manjarrez, N.; Soria-Florido, M.T.; Llorach, R.; Mattivi, F.; Manach, C. Food Intake Biomarkers for Berries and Grapes. Genes Nutr. 2020, 15, 17. [Google Scholar] [CrossRef]
- Lord, R.S.; Burdette, C.K.; Bralley, J.A. Significance of Urinary Tartaric Acid. Clin. Chem. 2005, 51, 672–673. [Google Scholar] [CrossRef]
- Donovan, J.L.; Bell, J.R.; Kasim-Karakas, S.; German, J.B.; Walzem, R.L.; Hansen, R.J.; Waterhouse, A.L. Catechin Is Present as Metabolites in Human Plasma after Consumption of Red Wine. J. Nutr. 1999, 129, 1662–1668. [Google Scholar] [CrossRef] [Green Version]
- Tsang, C.; Auger, C.; Mullen, W.; Bornet, A.; Rouanet, J.M.; Crozier, A.; Teissedre, P.L. The Absorption, Metabolism and Excretion of Flavan-3-Ols and Procyanidins Following the Ingestion of a Grape Seed Extract by Rats. Br. J. Nutr. 2005, 94, 170–181. [Google Scholar] [CrossRef] [PubMed]
- Fisher, D.; Lombardi, D.; Marucci-Wellman, H.; Roenneberg, T. Chronotypes in the US—Influence of Age and Sex. PLoS ONE 2017, 12, e0178782. [Google Scholar] [CrossRef] [Green Version]
- Turco, M.; Corrias, F.; Chiaromanni, M.; Bano, M.; Salamanca, M. The Self-Morningness/Eveningness (Self-ME): An Extremely Concise and Totally Subjective Assessment of Diurnal Preference. Chronobiol. Int. 2015, 32, 1192–1200. [Google Scholar]
- Hurtado-Barroso, S.; Quifer-Rada, P.; Rinaldi de Alvarenga, J.F.; Pérez-Fernández, S.; Tresserra-Rimbau, A.; Lamuela-Raventos, R.M. Changing to a Low-Polyphenol Diet Alters Vascular Biomarkers in Healthy Men after Only Two Weeks. Nutrients 2018, 10, 1766. [Google Scholar] [CrossRef] [PubMed] [Green Version]
- Chun, O.K.; Chung, S.J.; Song, W.O. Estimated Dietary Flavonoid Intake and Major Food Sources of U.S. Adults. J. Nutr. 2007, 137, 1244–1252. [Google Scholar] [CrossRef] [Green Version]
- Chun, O.K.; Floegel, A.; Chung, S.J.; Chung, C.E.; Song, W.O.; Koo, S.I. Estimation of Antioxidant Intakes from Diet and Supplements in U.S. Adults. J. Nutr. 2010, 140, 317–324. [Google Scholar] [CrossRef] [PubMed] [Green Version]
- Kim, K.; Vance, T.M.; Chun, O.K. Estimated Intake and Major Food Sources of Flavonoids among US Adults: Changes between 1999-2002 and 2007-2010 in NHANES. Eur. J. Nutr. 2016, 55, 833–843. [Google Scholar] [CrossRef]
- National Cancer Institute, Surveillance Research Branch. Available online: http://riskfactor.cancer.gov/DHQ/index.html (accessed on 1 December 2020).
- Automated Self-Administered 24-Hour (ASA24®®) Dietary Assessment Tool. Available online: https://epi.grants.cancer.gov/asa24/ (accessed on 1 December 2020).
- Agricultural Research Service, Food Surveys Research Group. USDA Food and Nutrient Database for Dietary Studies, 1.0 2004. Available online: https://data.nal.usda.gov/dataset/food-and-nutrient-database-dietary-studies-fndds (accessed on 1 December 2020).
- Miglio, C.; Peluso, I.; Raguzzini, A.; Villan, D.; Cesqui, E.; Catasta, G.; Toti, E.; Serafini, M. Antioxidant and Inflammatory Response Following High-Fat Meal Consumption in Overweight Subjects. Eur. J. Nutr. 2013, 52, 1107–1114. [Google Scholar] [CrossRef] [PubMed]
- Devaraj, S.; Wang-Polagruto, J.; Polagruto, J.; Keen, C.L.; Jialal, I. High-Fat, Energy-Dense, Fast-Food-Style Breakfast Results in an Increase in Oxidative Stress in Metabolic Syndrome. Metabolism 2008, 57, 867–870. [Google Scholar] [CrossRef] [Green Version]
- Zaheer, K. Hen Egg Carotenoids (Lutein and Zeaxanthin) and Nutritional Impacts on Human Health: A Review. CyTA—J. Food 2017, 15, 474–487. [Google Scholar] [CrossRef] [Green Version]
- Andersen, C.J. Bioactive Egg Components and Inflammation. Nutrients 2015, 7, 7889–7913. [Google Scholar] [CrossRef] [Green Version]
- Dorjgochoo, T.; Gao, Y.T.; Chow, W.H.; Shu, X.O.; Yang, G.; Cai, Q.; Rothman, N.; Cai, H.; Li, H.; Deng, X.; et al. Major Metabolite of F2-Isoprostane in Urine May Be a More Sensitive Biomarker of Oxidative Stress than Isoprostane Itself. Am. J. Clin. Nutr. 2012, 96, 405–414. [Google Scholar] [CrossRef] [Green Version]
- Chaix, A.; Zarrinpar, A.; Miu, P.; Panda, S. Time-Restricted Feeding Is a Preventative and Therapeutic Intervention against Diverse Nutritional Challenges. Cell Metab. 2014, 20, 991–1005. [Google Scholar] [CrossRef] [Green Version]
- Flanagan, A.; Bechtold, D.A.; Pot, G.K.; Johnston, J.D. Chrono-Nutrition: From Molecular and Neuronal Mechanisms to Human Epidemiology and Timed Feeding Patterns. J. Neurochem. 2020, 157, 53–72. [Google Scholar] [CrossRef]
- St-Onge, M.-P.; Ard, J.; Baskin, M.L.; Chiuve, S.E.; Johnson, H.M.; Kris-Etherton, P.; Varady, K.; on behalf of the American Heart Association Obesity Committee of the Council on Lifestyle and Cardiometabolic Health; Council on Cardiovascular Disease in the Young; Council on Clinical Cardiology; et al. Meal Timing and Frequency: Implications for Cardiovascular Disease Prevention: A Scientific Statement From the American Heart Association. Circulation 2017, 135, e96–e121. [Google Scholar] [CrossRef] [PubMed]
- Mattson, M.P.; Allison, D.B.; Fontana, L.; Harvie, M.; Longo, V.D.; Malaisse, W.J.; Mosley, M.; Notterpek, L.; Ravussin, E.; Scheer, F.A.; et al. Meal Frequency and Timing in Health and Disease. Proc. Natl. Acad. Sci. USA 2014, 111, 16647–16653. [Google Scholar] [CrossRef] [PubMed]
- Blanton, C.; Gordon, B. Effect of Morning vs. Evening Turmeric Consumption on Urine Oxidative Stress Biomarkers in Obese, Middle-Aged Adults: A Feasibility Study. Int. J. Environ. Res. Public Health 2020, 17, 4088. [Google Scholar] [CrossRef]
- Li, Z.; Henning, S.M.; Zhang, Y.; Zerlin, A.; Li, L.; Gao, K.; Lee, R.P.; Karp, H.; Thames, G.; Bowerman, S.; et al. Antioxidant-Rich Spice Added to Hamburger Meat during Cooking Results in Reduced Meat, Plasma, and Urine Malondialdehyde Concentrations. Am. J. Clin. Nutr. 2010, 91, 1180–1184. [Google Scholar] [CrossRef] [Green Version]
- Regueiro, J.; Vallverdú-Queralt, A.; Simal-Gándara, J.; Estruch, R.; Lamuela-Raventós, R. Development of a LC-ESI-MS/MS Approach for the Rapid Quantification of Main Wine Organic Acids in Human Urine. J. Agric. Food Chem. 2013, 61, 6763–6768. [Google Scholar] [CrossRef]
- Baba, S.; Osakabe, N.; Natsume, M.; Muto, Y.; Takizawa, T.; Terao, J. In Vivo Comparison of the Bioavailability of (+)-Catechin, (-)-Epicatechin and Their Mixture in Orally Administered Rats. J. Nutr. 2001, 131, 2885–2891. [Google Scholar] [CrossRef] [Green Version]
- Brose, S.A.; Thuen, B.T.; Golovko, M.Y. LC/MS/MS Method for Analysis of E₂ Series Prostaglandins and Isoprostanes. J. Lipid Res. 2011, 52, 850–859. [Google Scholar] [CrossRef] [PubMed] [Green Version]
- Wang, L.; Morris, M.E. Liquid Chromatography-Tandem Mass Spectroscopy Assay for Quercetin and Conjugated Quercetin Metabolites in Human Plasma and Urine. J. Chromatogr. B Analyt. Technol. Biomed. Life Sci. 2005, 821, 194–201. [Google Scholar] [CrossRef] [PubMed]
- National Center for Health Statistics; U.S. Department of Agriculture, Center for Nutrition Policy and Promotion. What We Eat in America/National Health and Nutrition Examination Survey, 2015–2016. Healthy Eating Index—2015 Scores; National Center for Health Statistics; U.S. Department of Agriculture, Center for Nutrition Policy and Promotion: Washington, DC, USA, 2016.
- Buttgereit, F.; Doering, G.; Schaeffler, A.; Witte, S.; Sierakowski, S.; Gromnica-Ihle, E.; Jeka, S.; Krueger, K.; Szechinski, J.; Alten, R. Targeting Pathophysiological Rhythms: Prednisone Chronotherapy Shows Sustained Efficacy in Rheumatoid Arthritis. Ann. Rheum. Dis. 2010, 69, 1275–1280. [Google Scholar] [CrossRef] [PubMed]
- Buttgereit, F.; Mehta, D.; Kirwan, J.; Szechinski, J.; Boers, M.; Alten, R.E.; Supronik, J.; Szombati, I.; Romer, U.; Witte, S.; et al. Low-Dose Prednisone Chronotherapy for Rheumatoid Arthritis: A Randomised Clinical Trial (CAPRA-2). Ann. Rheum. Dis. 2013, 72, 204–210. [Google Scholar] [CrossRef]
- Cutolo, M. Glucocorticoids and Chronotherapy in Rheumatoid Arthritis. RMD Open 2016, 2, e000203. [Google Scholar] [CrossRef] [Green Version]
- Bonten, T.N.; Snoep, J.D.; Assendelft, W.J.J.; Zwaginga, J.J.; Eikenboom, J.; Huisman, M.V.; Rosendaal, F.R.; van der Bom, J.G. Time-Dependent Effects of Aspirin on Blood Pressure and Morning Platelet Reactivity: A Randomized Cross-over Trial. Hypertension 2015, 65, 743–750. [Google Scholar] [CrossRef]
- Hermida, R.C.; Ayala, D.E.; Fernández, J.R.; Mojón, A.; Smolensky, M.H.; Fabbian, F.; Portaluppi, F. Administration-Time Differences in Effects of Hypertension Medications on Ambulatory Blood Pressure Regulation. Chronobiol. Int. 2013, 30, 280–314. [Google Scholar] [CrossRef]
- Ince, L.M.; Barnoud, C.; Lutes, L.K.; Pick, R.; Wang, C.; Sinturel, F.; Chen, C.-S.; de Juan, A.; Weber, J.; Holtkamp, S.J.; et al. Influence of Circadian Clocks on Adaptive Immunity and Vaccination Responses. Nat. Commun. 2023, 14, 476. [Google Scholar] [CrossRef]
- Vassalle, C.; Bianchi, S.; Battaglia, D.; Landi, P.; Bianchi, F.; Carpeggiani, C. Elevated Levels of Oxidative Stress as a Prognostic Predictor of Major Adverse Cardiovascular Events in Patients with Coronary Artery Disease. J. Atheroscler. Thromb. 2012, 19, 712–717. [Google Scholar] [CrossRef] [Green Version]
- Pigazzani, F.; Gorni, D.; Dyar, K.A.; Pedrelli, M.; Kennedy, G.; Costantino, G.; Bruno, A.; Mackenzie, I.; MacDonald, T.M.; Tietge, U.J.F.; et al. The Prognostic Value of Derivatives-Reactive Oxygen Metabolites (d-ROMs) for Cardiovascular Disease Events and Mortality: A Review. Antioxidants 2022, 11, 1514. [Google Scholar] [CrossRef]
- Arfin, S.; Jha, N.K.; Jha, S.K.; Kesari, K.K.; Ruokolainen, J.; Roychoudhury, S.; Rathi, B.; Kumar, D. Oxidative Stress in Cancer Cell Metabolism. Antioxidants 2021, 10, 642. [Google Scholar] [CrossRef]
- Ding, Y.; Li, H.; Li, Y.; Liu, D.; Zhang, L.; Wang, T.; Liu, T.; Ma, L. Protective Effects of Grape Seed Proanthocyanidins on the Kidneys of Diabetic Rats through the Nrf2 Signalling Pathway. Evid. Based Complement. Altern. Med. 2020, 2020, 5205903. [Google Scholar] [CrossRef]
- Kode, A.; Rajendrasozhan, S.; Caito, S.; Yang, S.-R.; Megson, I.L.; Rahman, I. Resveratrol Induces Glutathione Synthesis by Activation of Nrf2 and Protects against Cigarette Smoke-Mediated Oxidative Stress in Human Lung Epithelial Cells. Am. J. Physiol. Lung Cell. Mol. Physiol. 2008, 294, L478–L488. [Google Scholar] [CrossRef] [PubMed] [Green Version]
- Cutolo, M. Circadian Rhythms and Rheumatoid Arthritis. Jt. Bone Spine 2018, 86, 327–333. [Google Scholar] [CrossRef] [PubMed]
- Ursini, F.; De Giorgi, A.; D’Onghia, M.; De Giorgio, R.; Fabbian, F.; Manfredini, R. Chronobiology and Chronotherapy in Inflammatory Joint Diseases. Pharmaceutics 2021, 13, 1832. [Google Scholar] [CrossRef] [PubMed]
- Bowles, N.P.; Thosar, S.S.; Herzig, M.X.; Shea, S.A. Correction to: Chronotherapy for Hypertension. Curr. Hypertens. Rep. 2018, 21, 1. [Google Scholar] [CrossRef] [PubMed] [Green Version]
- Smolensky, M.H.; Hermida, R.C.; Geng, Y.J. Chronotherapy of Cardiac and Vascular Disease: Timing Medications to Circadian Rhythms to Optimize Treatment Effects and Outcomes. Curr. Opin. Pharmacol. 2020, 57, 41–48. [Google Scholar] [CrossRef]
- Lee, S.H.; Wan, Q.; Wentworth, A.; Ballinger, I.; Ishida, K.; Collins, J.E.; Tamang, S.; Huang, H.-W.; Li, C.; Hess, K.; et al. Implantable System for Chronotherapy. Sci. Adv. 2021, 7, eabj4624. [Google Scholar] [CrossRef]
- Gadacha, W.; Ben-Attia, M.; Bonnefont-Rousselot, D.; Aouani, E.; Ghanem-Boughanmi, N.; Touitou, Y. Resveratrol Opposite Effects on Rat Tissue Lipoperoxidation: Pro-Oxidant during Day-Time and Antioxidant at Night. Redox Rep. 2009, 14, 154–158. [Google Scholar] [CrossRef] [PubMed] [Green Version]
- Helmersson, J.; Basu, S. F2-Isoprostane Excretion Rate and Diurnal Variation in Human Urine. Prostaglandins Leukot. Essent. Fat. Acids 1999, 61, 203–205. [Google Scholar] [CrossRef]
- Savage, K.; Gogarty, L.; Lea, A.; Deleuil, S.; Nolidin, K.; Croft, K.; Stough, C. The Relationship between F(2)-Isoprostanes Plasma Levels and Depression Symptoms in Healthy Older Adults. Antioxidants 2022, 11, 822. [Google Scholar] [CrossRef] [PubMed]
- Wiener, C.; Rassier, G.T.; Kaster, M.P.; Jansen, K.; Pinheiro, R.T.; Klamt, F.; Magalhães, P.V.; Kapczinski, F.; Ghisleni, G.; da Silva, R.A. Gender-Based Differences in Oxidative Stress Parameters Do Not Underlie the Differences in Mood Disorders Susceptibility between Sexes. Eur. Psychiatry 2014, 29, 58–63. [Google Scholar] [CrossRef] [PubMed]
- Brunelli, E.; Domanico, F.; La Russa, D.; Pellegrino, D. Sex Differences in Oxidative Stress Biomarkers. Curr. Drug Targets 2014, 15, 811–815. [Google Scholar] [CrossRef] [PubMed]
- Forman, H.J.; Zhang, H. Targeting Oxidative Stress in Disease: Promise and Limitations of Antioxidant Therapy. Nat. Rev. Drug Discov. 2021, 20, 689–709. [Google Scholar] [CrossRef]
- Klawitter, J.; Haschke, M.; Shokati, T.; Klawitter, J.; Christians, U. Quantification of 15-F2t-Isoprostane in Human Plasma and Urine: Results from Enzyme-Linked Immunoassay and Liquid Chromatography/Tandem Mass Spectrometry Cannot Be Compared. Rapid Commun. Mass Spectrom. 2011, 25, 463–468. [Google Scholar] [CrossRef] [PubMed]


| Activity | 2 Days before the Lab Visit | 12 h before the Lab Visit | Lab Visit | 1–6 h Period Post-Meal |
|---|---|---|---|---|
| Low-antioxidant diet | x | |||
| Food records | x | |||
| Water-only fast | x | x | ||
| Urine sample * | x | x | ||
| Treatment administered | x | |||
| Diet assessment | x |
| Ingredient | kJ | Fat (g) | Carbohydrate (g) | Protein (g) | (% Total Energy) | ||
|---|---|---|---|---|---|---|---|
| Fat | Carb | Protein | |||||
| Biscuit (150 g) | 2196 | 30 | 50 | 12 | |||
| Egg White (150 g) | 347 | 0 | 3 | 15 | |||
| Cheddar Cheese (50 g) | 845 | 18 | 1 | 11 | |||
| Butter (20 g) | 598 | 17 | 0 | 0 | |||
| Total | 3987 | 65 | 54 | 38 | 61% | 23% | 16% |
| Analyte | Q1 | Q3 | DP | CE | CXP |
|---|---|---|---|---|---|
| Catechin | 289.0 | 108.9 | −90 | −90 | −5 |
| Catechin | 289.0 | 205.0 | −90 | −90 | −15 |
| Quercetin | 300.9 | 150.8 | −90 | −90 | −13 |
| Quercetin | 301.1 | 106.8 | −90 | −90 | −13 |
| Resveratrol | 227.0 | 143.0 | −90 | −90 | −13 |
| Resveratrol | 226.9 | 185.1 | −75 | −75 | −13 |
| PGF2α | 353.0 | 193.0 | −90 | −90 | −19 |
| PGF2α | 353.4 | 309.1 | −50 | −50 | −13 |
| Fisetin | 285 | 135 | −90 | −90 | −13 |
| Fisetin | 285 | 121 | −90 | −90 | −13 |
| PGF2α-d4 | 357.0 | 197.0 | −90 | −90 | −19 |
| PGF2α-d4 | 357.0 | 295.0 | −80 | −80 | −13 |
| Tartaric acid | 149 | 87 | −25 | −20 | −10 |
| Tartaric acid | 149 | 73 | −25 | −25 | −10 |
| Tartaric acid-d2 | 151 | 88 | −25 | −20 | −10 |
| Tartaric acid-d2 | 151 | 74 | −25 | −25 | −10 |
| Characteristic | Mean (SD) or Number (%) | |
|---|---|---|
| Females | Males | |
| Sex | 19 (59%) | 13 (41%) |
| Age, y | 31.42 (9.24) | 30.08 (9.57) |
| Height, cm | 164.23 (6.27) | 177.41 (9.04) |
| Weight, kg | 72.42 (18.39) | 78.76 (11.39) |
| BMI, kg/m2 | 26.79 (6.28) | 25.12 (3.93) |
| Time Period | Grape, a.m. | Grape, p.m. | ||
|---|---|---|---|---|
| Mean (SD) ng/mg Cr | Median (IQR) ng/mg Cr | Mean (SD) ng/mg Cr | Median (IQR) ng/mg Cr | |
| 0 h (baseline) | 3.49 (2.39) | 2.73 (3.93) | 2.84 (1.58) | 2.56 (1.41) |
| 0–1 h | 6.28 (4.62) * | 5.11 (4.86) | 6.15 (3.84) | 5.98 (5.27) |
| 1–6 h | 9.25 (1.86) # | 9.27 (1.69) | 7.01 (3.71) | 5.32 (6.57) |
| Placebo, a.m. | Placebo, p.m. | |||
| 0 h (baseline) | 2.61 (1.30) | 2.90 (2.46) | 3.10 (1.95) | 2.42 (2.26) |
| 0–1 h | 9.08 (2.58) ## | 9.03 (4.08) | 5.43 (3.27) | 4.49 (5.73) |
| 1–6 h | 9.92 (2.62) | 9.78.(4.12) | 7.73 (3.89) | 6.77 (4.10) |
| HEI-2015 Output | Mean (SD) | Median (IQR) |
|---|---|---|
| Total HEI-2015 score (maximum = 100) | 64.77 (11.79) | 63.43 (13.51) |
| Food Group (Component score maximum) | ||
| Total Vegetables (5) | 3.84 (1.05) | 4.13 (2.15) |
| Greens and Beans (5) | 4.10 (1.33) | 5.00 (1.69) |
| Total Fruits (5) | 3.49 (1.49) | 3.83 (2.83) |
| Whole Fruits (5) | 4.11 (1.39) | 5.00 (1.69) |
| Whole Grains (10) | 3.88 (2.77) | 2.97 (3.00) |
| Dairy (10) | 7.51 (2.33) | 7.34 (4.61) |
| Total Protein Foods (5) | 4.74 (0.59) | 5.00 (0) |
| Seafood and Plant Proteins (5) | 4.54 (1.07) | 5.00 (0) |
| Fatty Acids (10) | 4.38 (2.29) | 4.37 (3.01) |
| Sodium (10) | 3.29 (2.11) | 3.24 (2.41) |
| Refined Grains (10) | 7.69 (2.69) | 9.08 (4.83) |
| Saturated Fats (10) | 4.93 (2.69) | 4.8 (3.88) |
| Added Sugars (10) | 8.24 (2.04) | 8.57 (2.28) |
| Low-Antioxidant Days | Usual Diet | p Value | RDA *, Age 19–50 Years | |||
|---|---|---|---|---|---|---|
| Mean (SD) | Median (IQR) | Mean (SD) | Median (IQR) | |||
| Total vitamin A activity (RAE), mcg | 362.57 (280.43) | 321.61 (338.89) | 1243.26 (787.36) | 1015.70 (651.27) | <0.001 | 900 (males), 700 (females) |
| Vitamin C, mg | 32.84 (35.92) | 20.09 (35.06) | 98.90 (67.62) | 95.50 (73.19) | <0.001 | 90 (males), 75 (females) |
| Vitamin E (alpha-tocopherol), mg | 5.99 (3.89) | 5.04 (4.52) | 14.62 (10.96) | 10.96 (7.7) | <0.001 | 15 (males and females) |
| Selenium, mcg | 86.61 (47.24) | 85.49 (56.24) | 116.99 (88.70) | 81.25 (68.75) | 0.31 | 55 (males and females) |
Disclaimer/Publisher’s Note: The statements, opinions and data contained in all publications are solely those of the individual author(s) and contributor(s) and not of MDPI and/or the editor(s). MDPI and/or the editor(s) disclaim responsibility for any injury to people or property resulting from any ideas, methods, instructions or products referred to in the content. |
© 2023 by the authors. Licensee MDPI, Basel, Switzerland. This article is an open access article distributed under the terms and conditions of the Creative Commons Attribution (CC BY) license (https://creativecommons.org/licenses/by/4.0/).
Share and Cite
Blanton, C.; Ghimire, B.; Khajeh Pour, S.; Aghazadeh-Habashi, A. Circadian Modulation of the Antioxidant Effect of Grape Consumption: A Randomized Controlled Trial. Int. J. Environ. Res. Public Health 2023, 20, 6502. https://doi.org/10.3390/ijerph20156502
Blanton C, Ghimire B, Khajeh Pour S, Aghazadeh-Habashi A. Circadian Modulation of the Antioxidant Effect of Grape Consumption: A Randomized Controlled Trial. International Journal of Environmental Research and Public Health. 2023; 20(15):6502. https://doi.org/10.3390/ijerph20156502
Chicago/Turabian StyleBlanton, Cynthia, Biwash Ghimire, Sana Khajeh Pour, and Ali Aghazadeh-Habashi. 2023. "Circadian Modulation of the Antioxidant Effect of Grape Consumption: A Randomized Controlled Trial" International Journal of Environmental Research and Public Health 20, no. 15: 6502. https://doi.org/10.3390/ijerph20156502