
Design and Application of an Early Warning and Emergency Response System in the Transboundary Area of the Taihu Lake Basin

Abstract
:1. Introduction
2. Materials and Methods
2.1. Overview of the Study Area
2.2. System Architecture and Key Technologies
2.2.1. System Design Objectives
2.2.2. System Structure Design
- (i)
- Presentation layer
- (ii)
- Business operation layer
- (iii)
- Business technical support layer
2.2.3. Key Technologies
- (i)
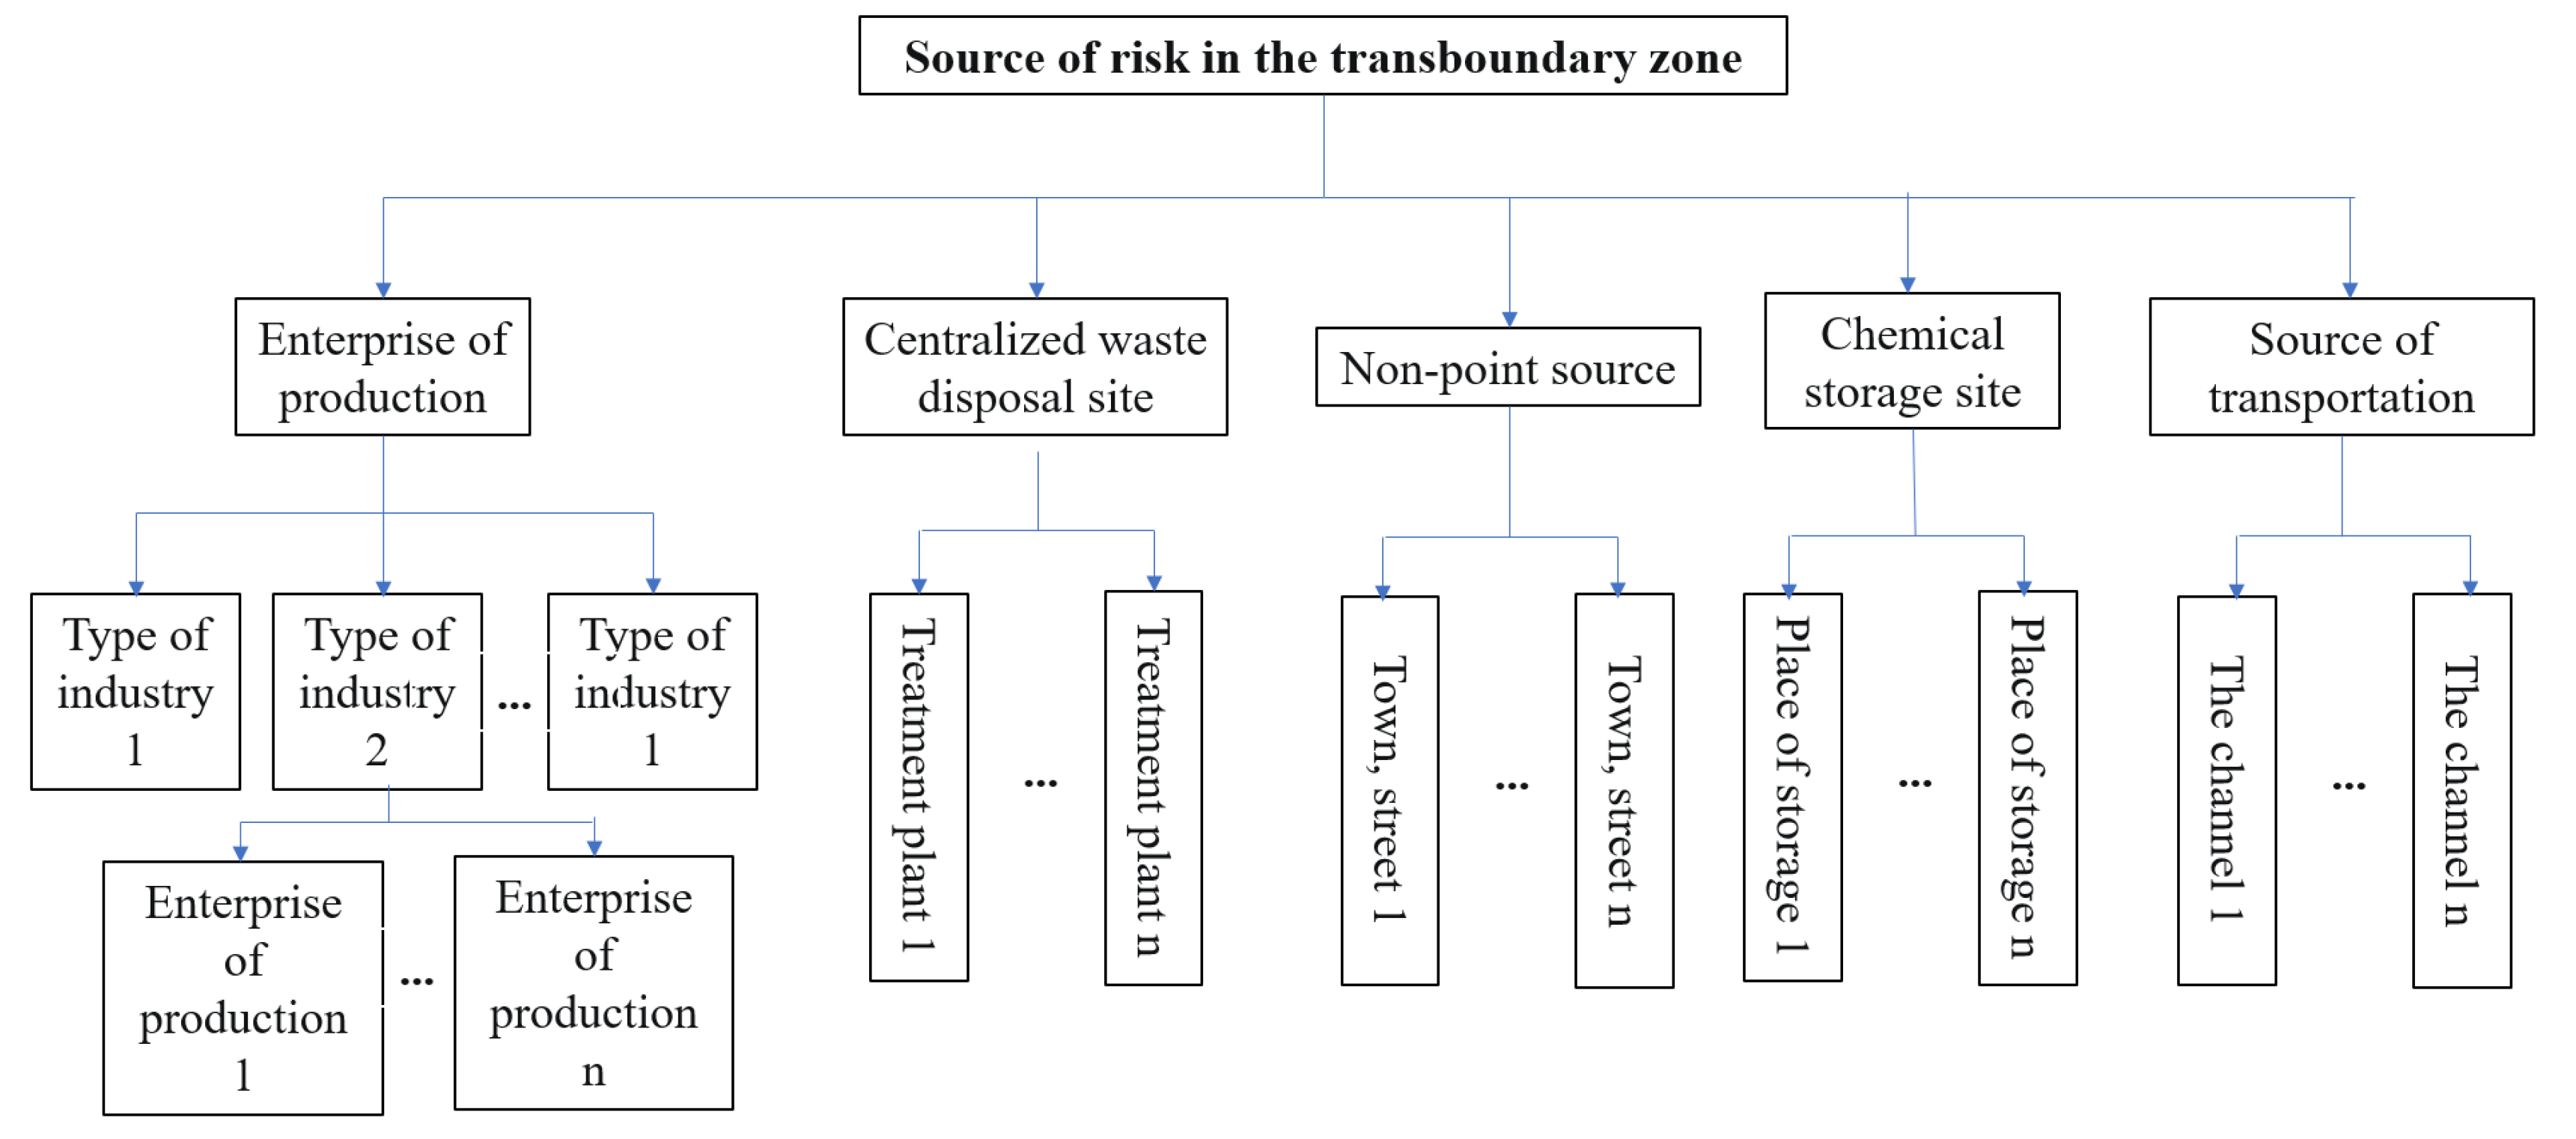
- Assessment of risk sources in cross-border areas
- (ii)
- Water pollution accident warning system in the cross-border area
- (iii)
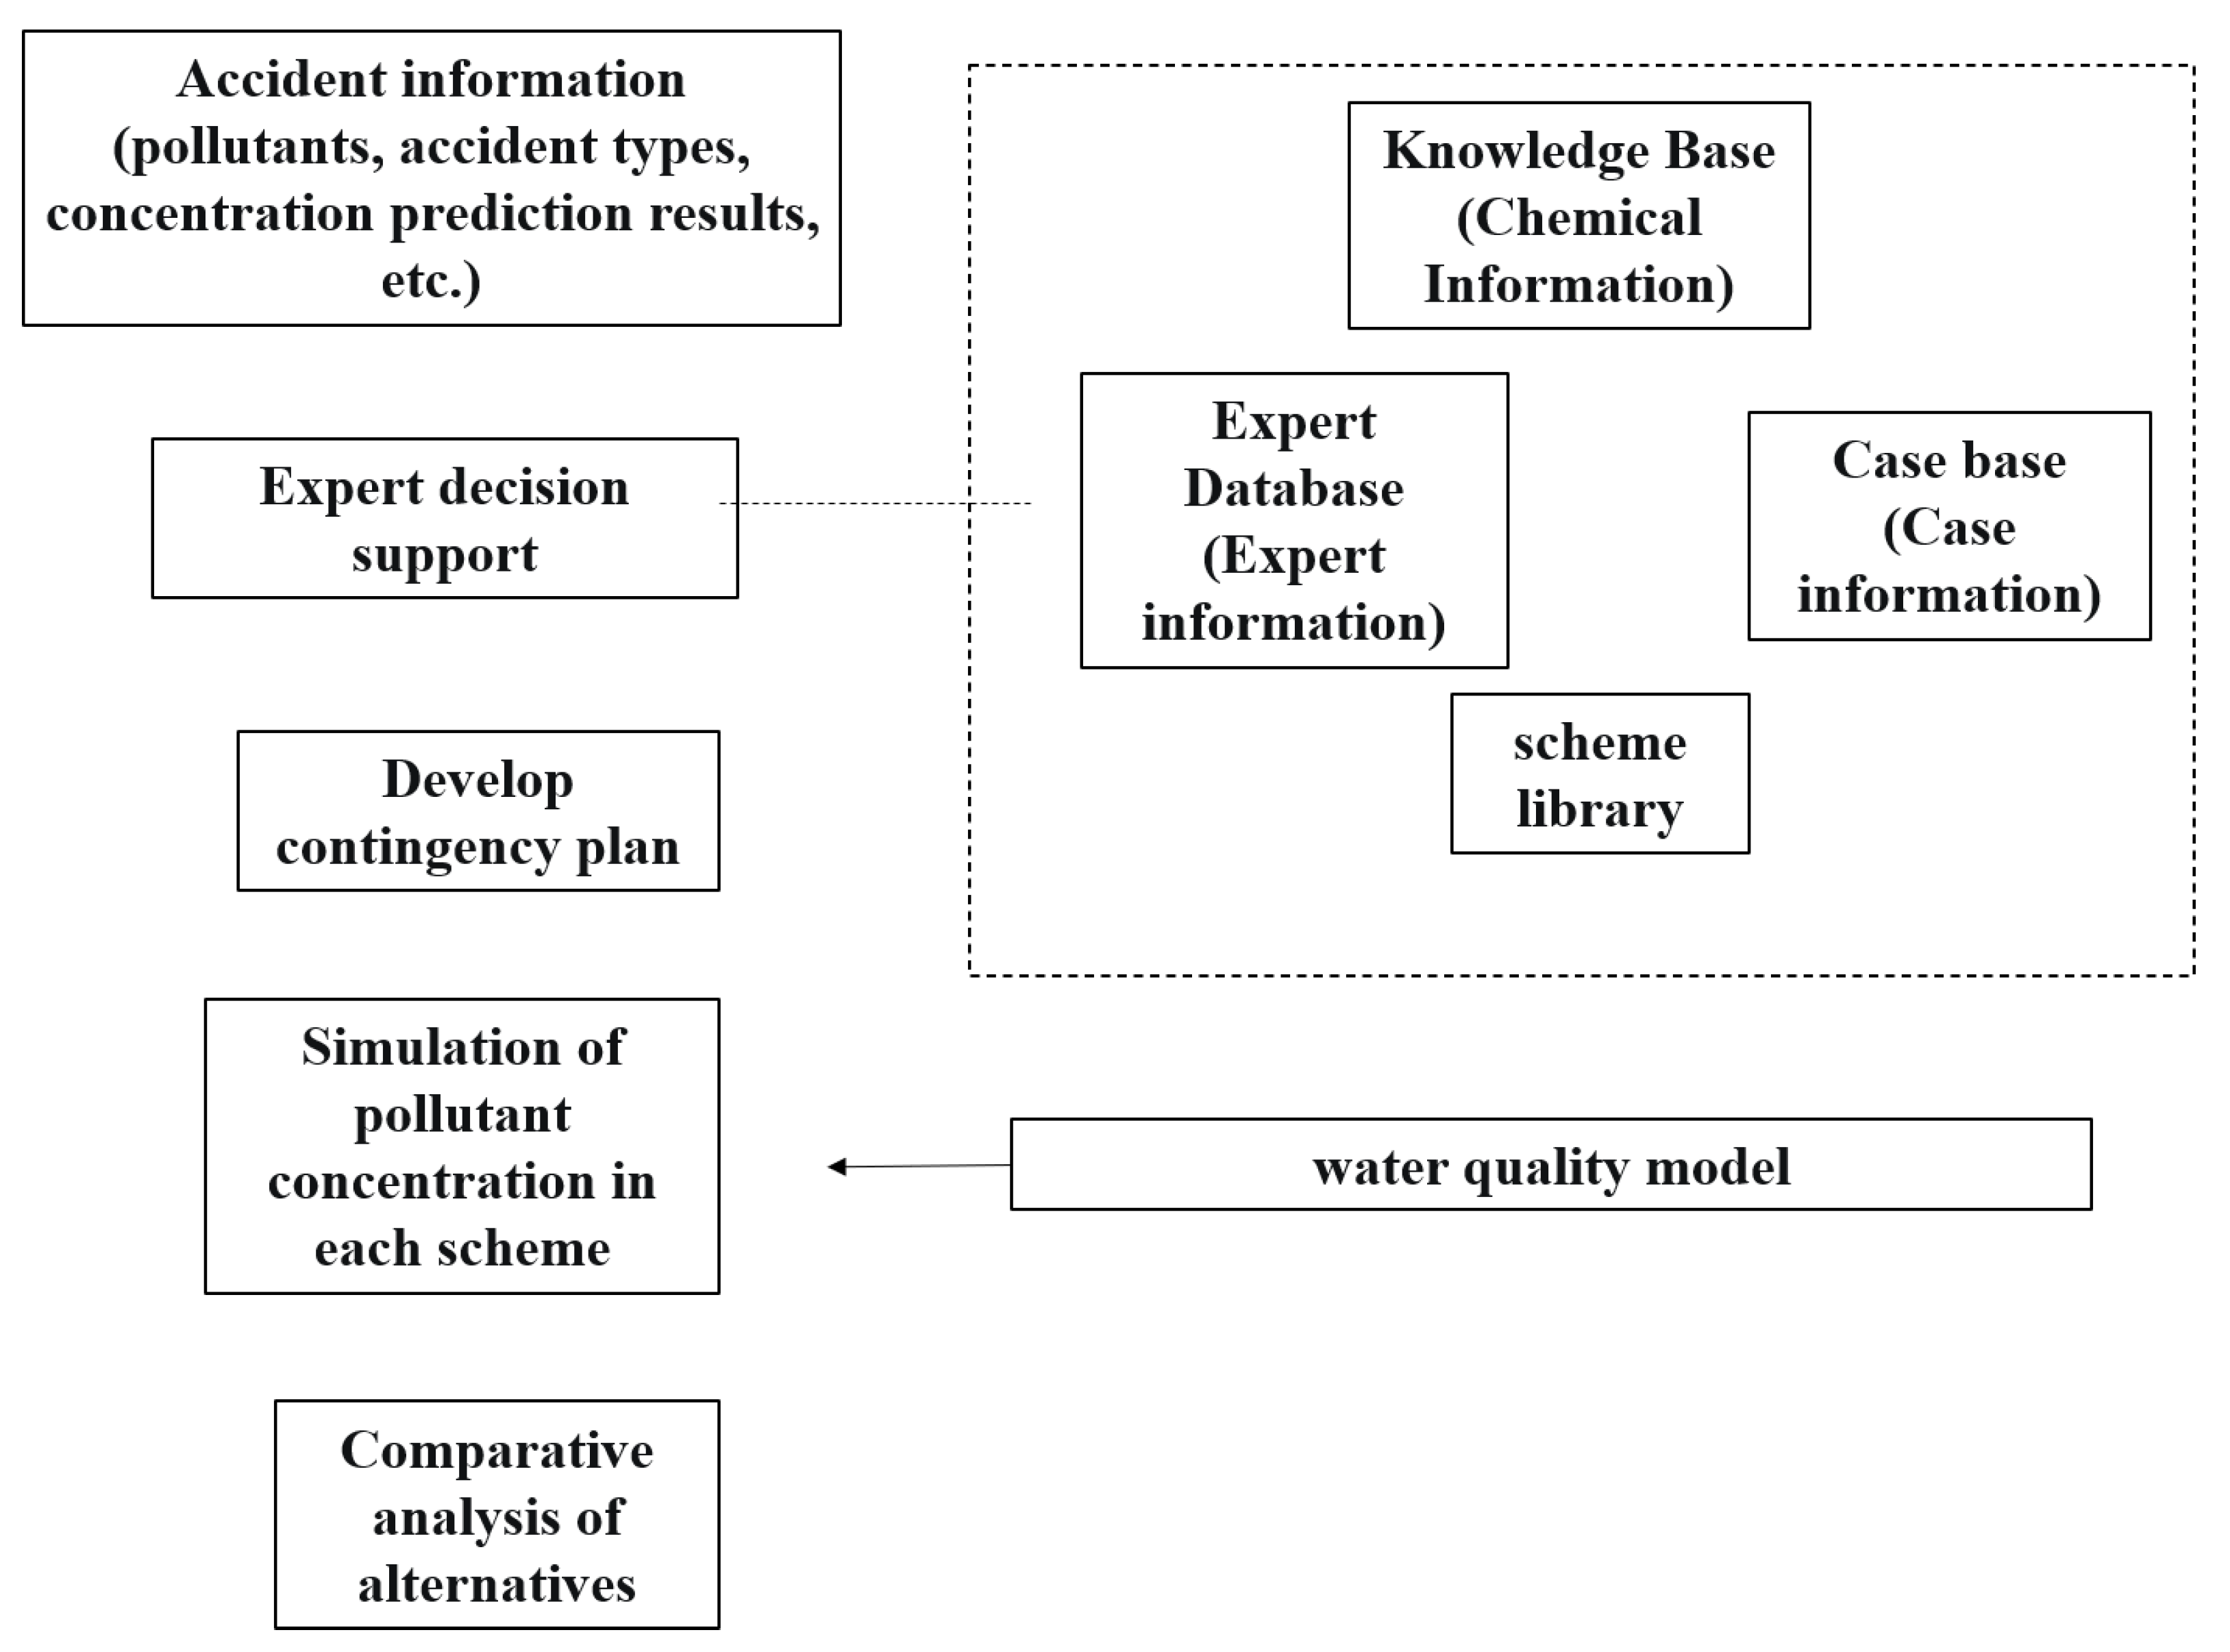
- Emergency response for water pollution accidents in the transboundary areas
- (iv)
- Release of alerts of water pollution accidents in transboundary areas
3. Results
3.1. Risk Assessment of the Transboundary Area in Taihu Lake Basin
3.2. Risk Reduction and Emergency Response in the Suhu Taipu River Cross-Border Area
- (i)
- Risk mitigation and emergency response after nitrogen and phosphorus pollution
- (ii)
- Risk reduction and emergency response to abnormal discharge events in tributaries
- (iii)
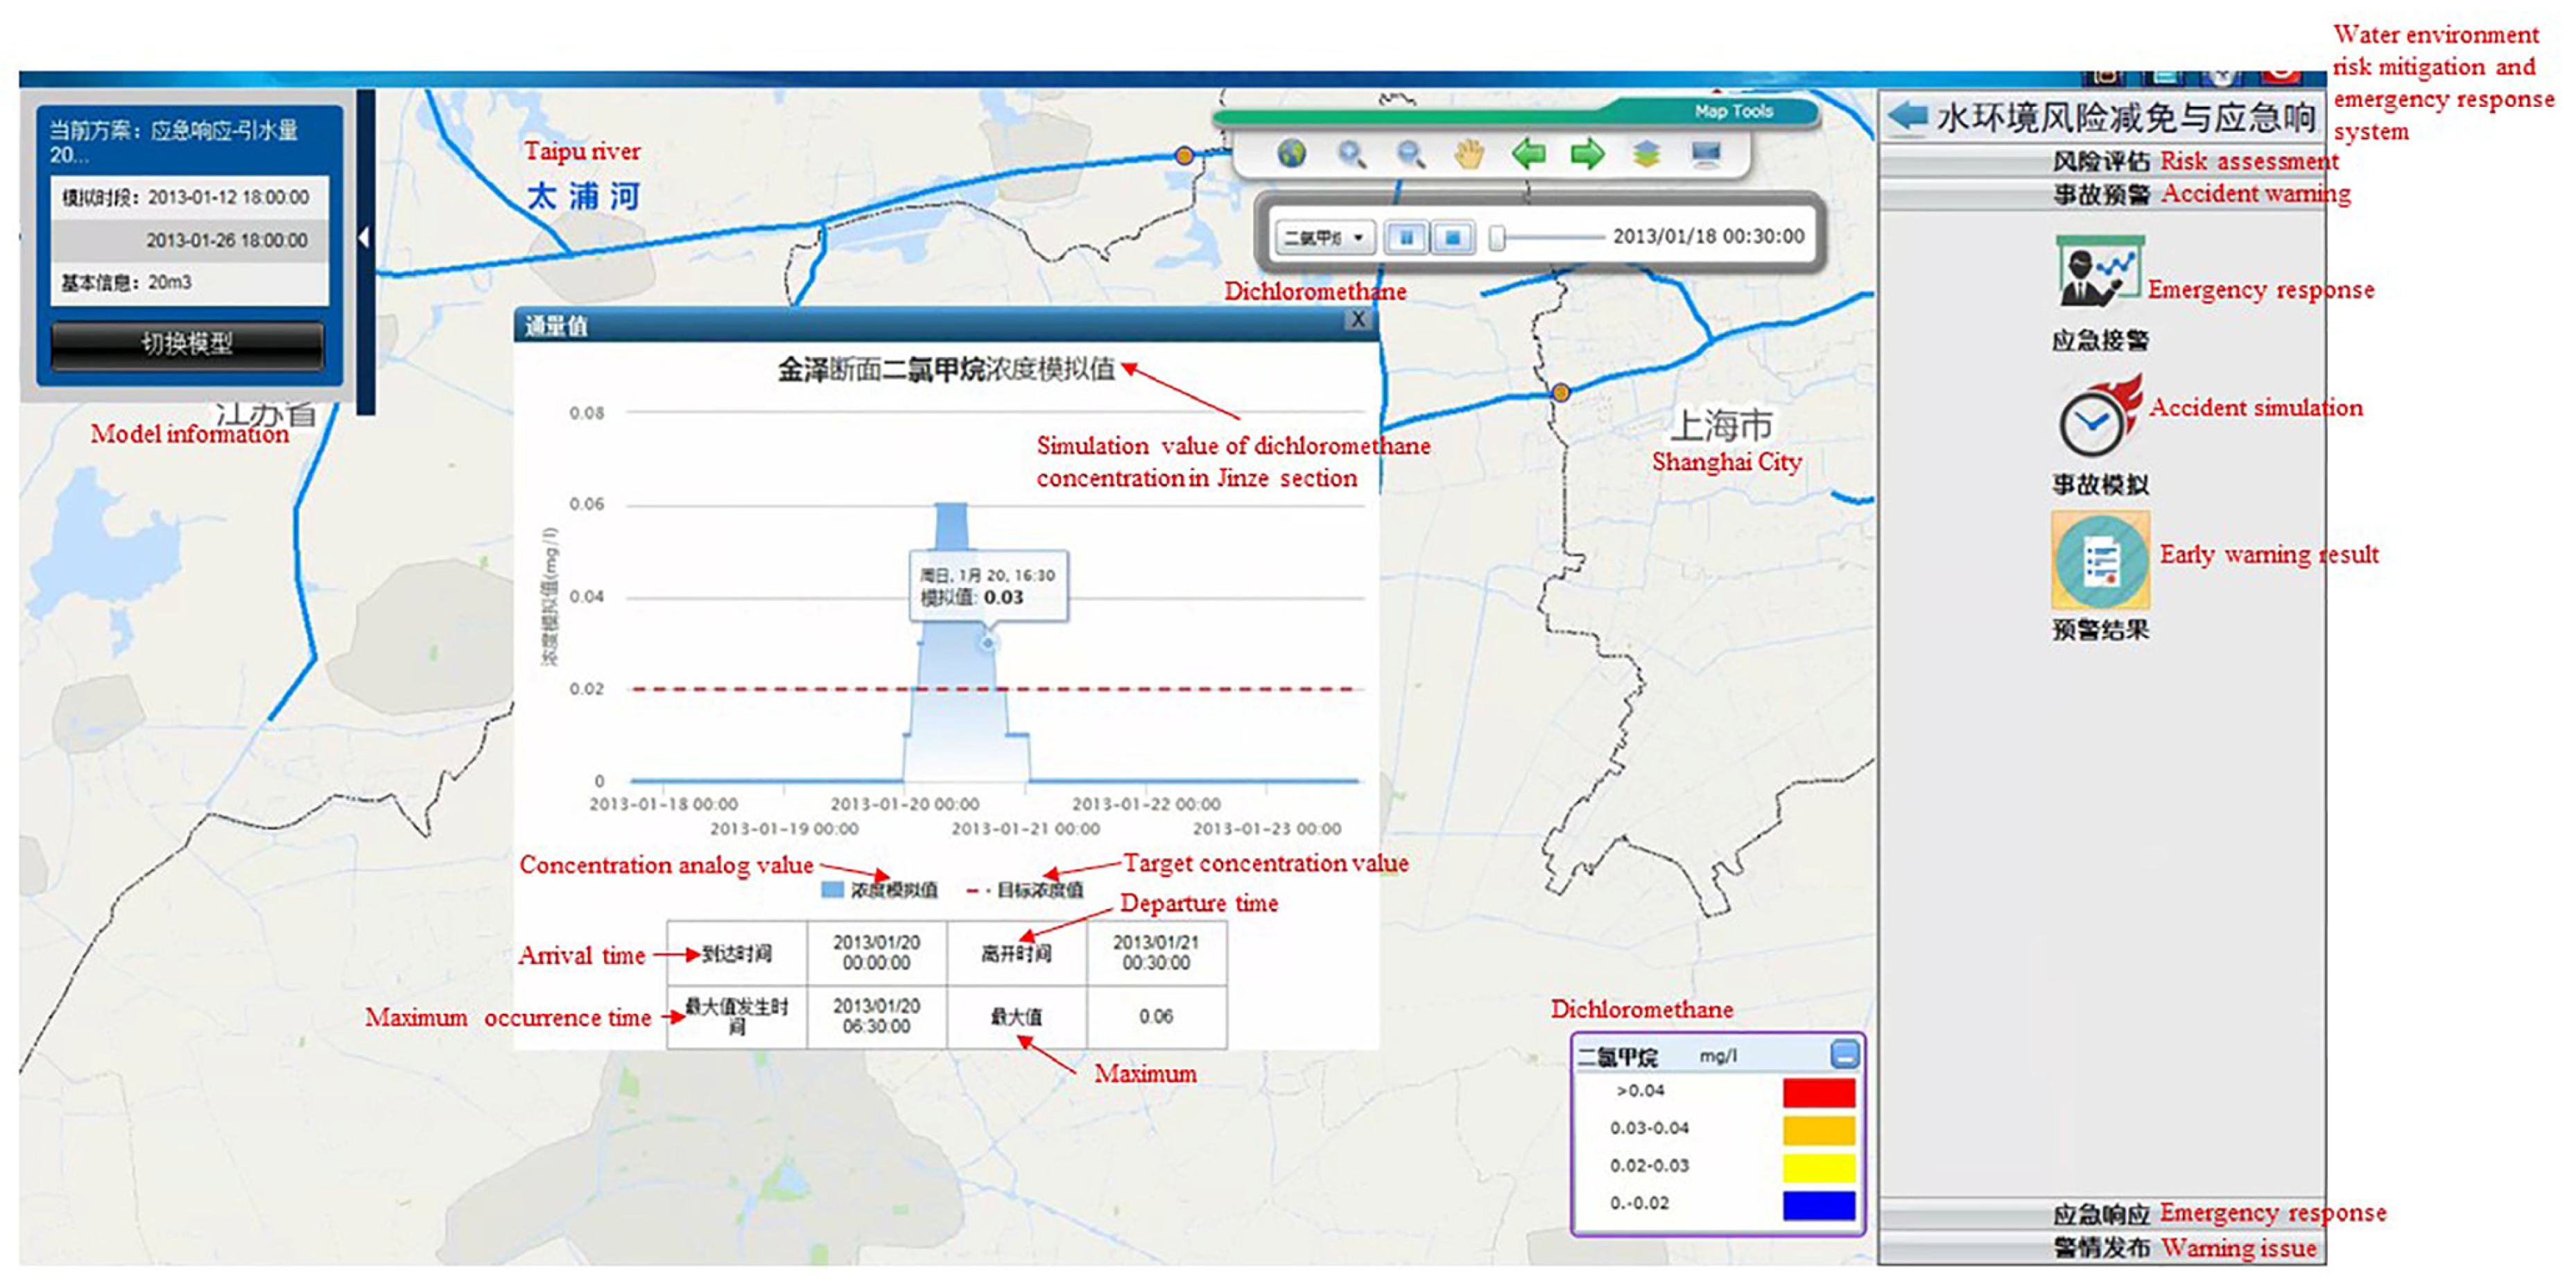
- Accident warning
- (iv)
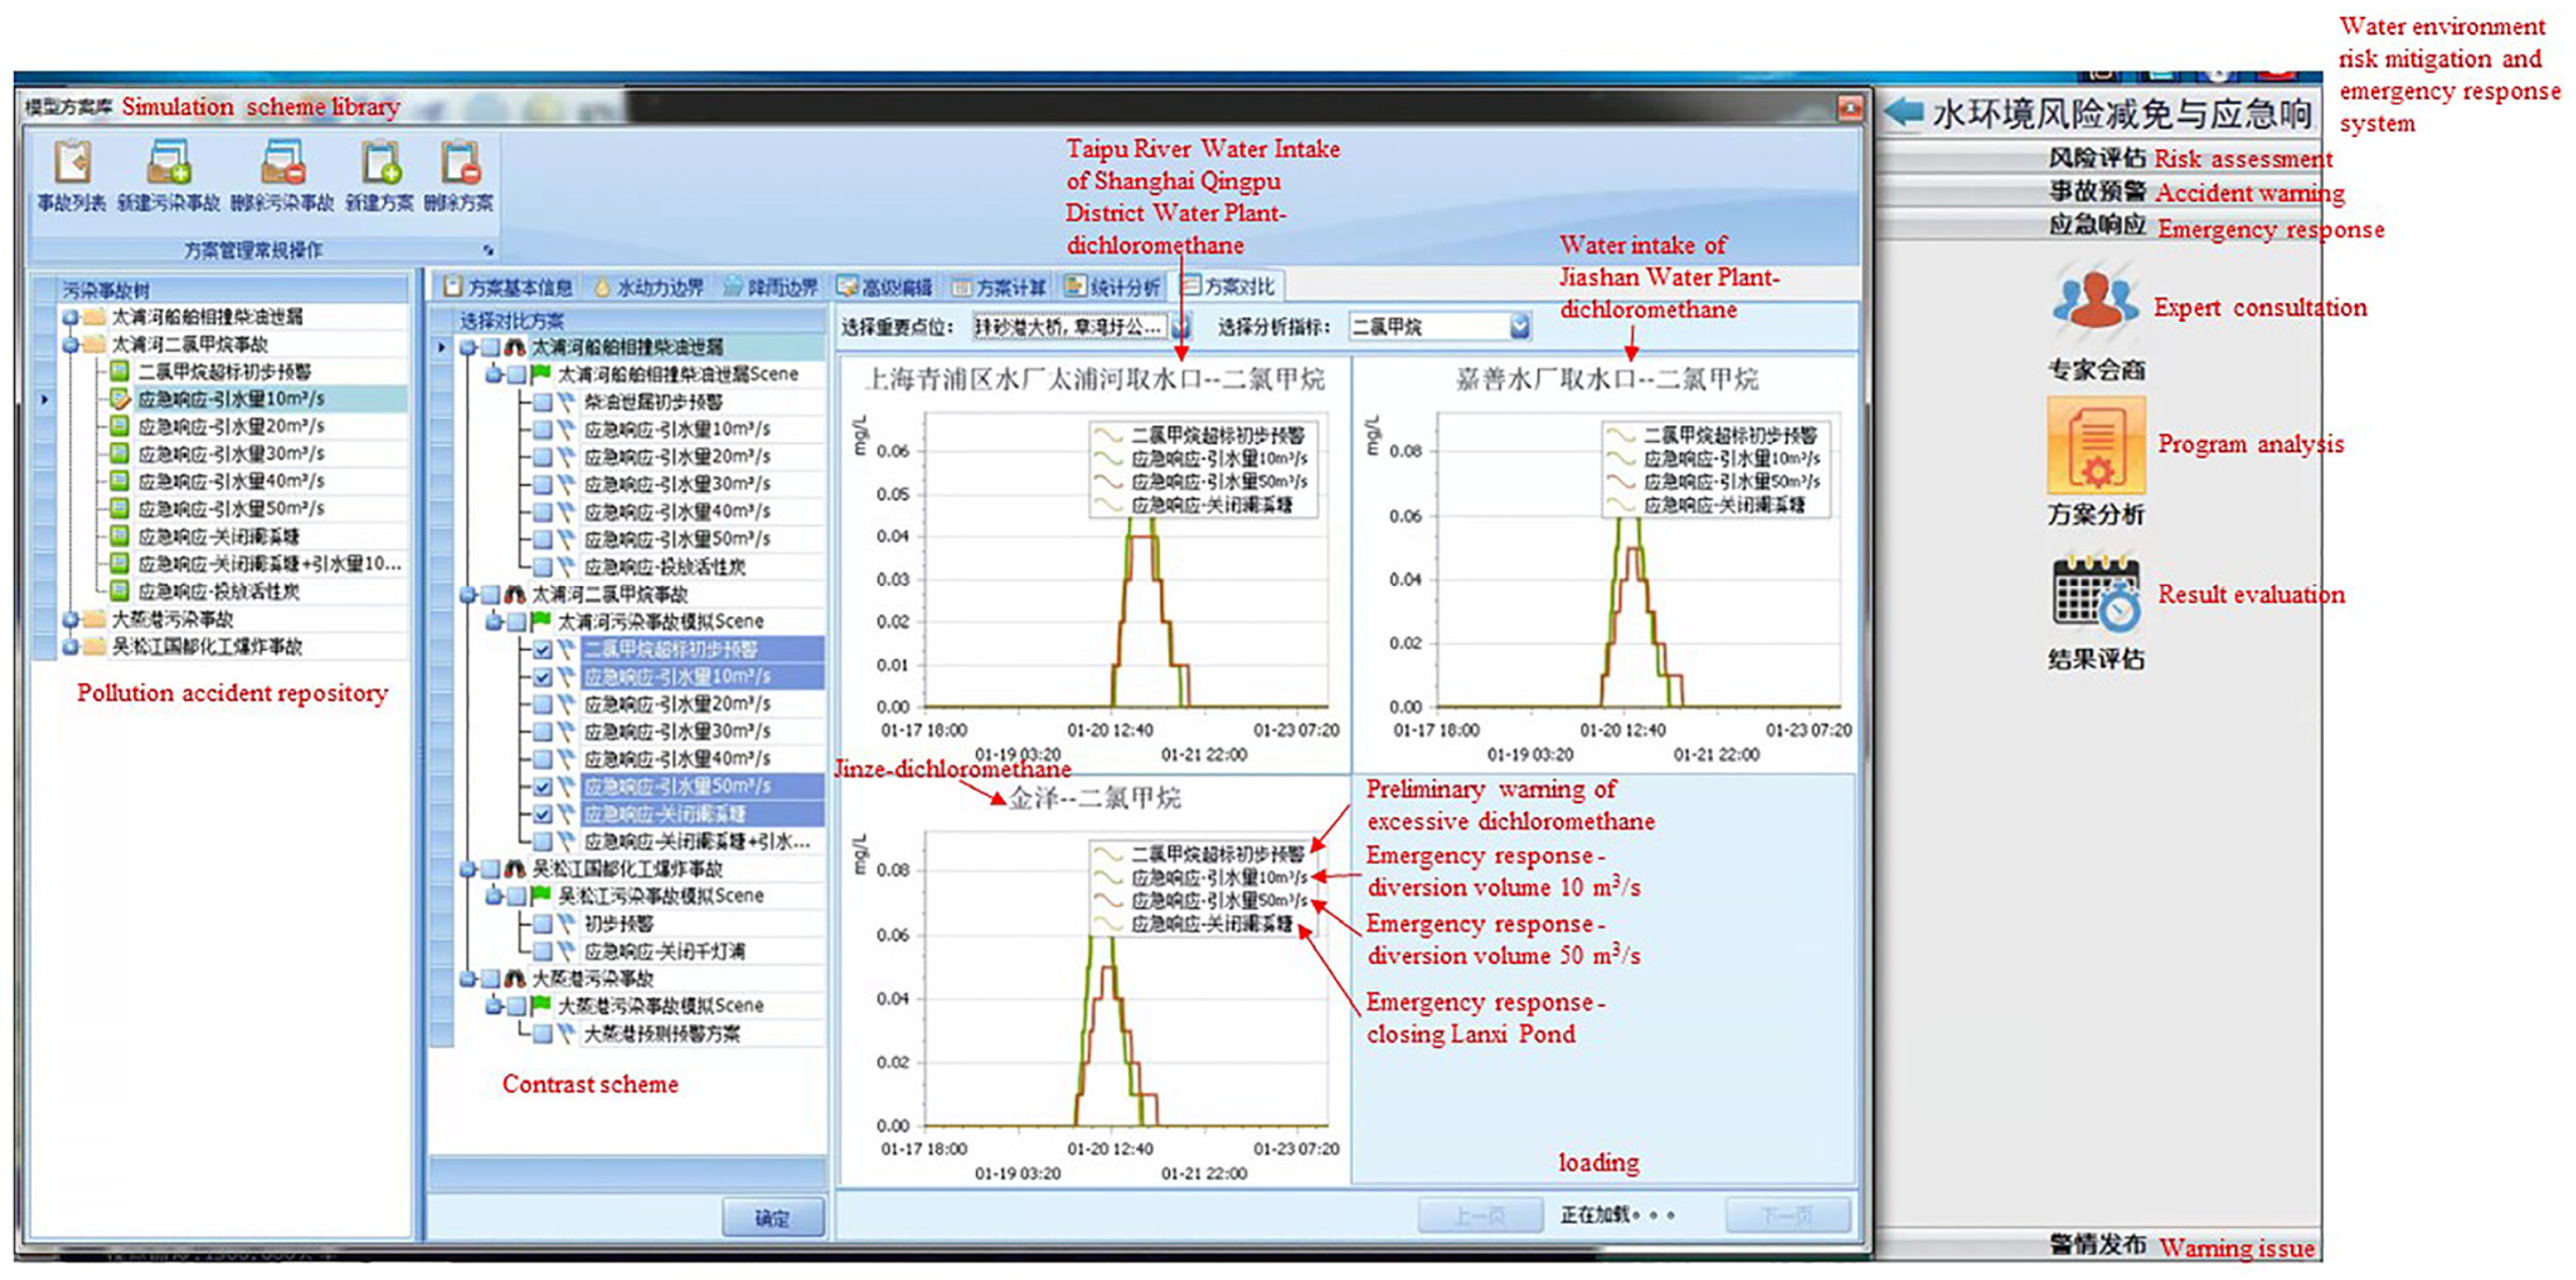
- Emergency response
4. Discussion
5. Conclusions
- (i)
- The proposed early warning and emergency response system consists of a presentation layer, a business layer, and a business and technical support layer. The modular system performs cross-border risk assessment, provides early warning for transboundary water pollution in the Taihu Lake Basin, and implements emergency response plans. We performed simulations of environmental risk prevention and emergency management.
- (ii)
- The proposed system is preliminary. In future applications, additional data should be incorporated to calibrate and validate the model to improve its precision.
Author Contributions
Funding
Institutional Review Board Statement
Informed Consent Statement
Data Availability Statement
Conflicts of Interest
References
- Zhao, Q.; Wang, Q. Water ecosystem service quality evaluation and value assessment of Taihu Lake in China. Water 2021, 13, 618. [Google Scholar] [CrossRef]
- Yan, L.; Xu, Z.; Hu, Y.; Wang, Y.; Zhou, F.; Gao, X.; Zhu, Y.; Chen, D. Cyanobacteria bloom hazard function and preliminary application in lake taihu, China. Chemosphere 2022, 307, 136122. [Google Scholar] [CrossRef] [PubMed]
- Du, L.; Wang, H.; Xu, H. Analysis of spatial-temporal association and factors influencing environmental pollution incidents in China. Environ. Impact Assess. Rev. 2020, 82, 106384. [Google Scholar] [CrossRef]
- Li, L.; Sun, Y.; Cao, J.; Guo, Y. Study on Emergency mechanism of sudden environmental pollution events in Danjiangkou section. Fresenius Environ. Bull. 2019, 28, 9359–9365. [Google Scholar]
- Wu, R.; Li, H.; Tian, S. Research on emergency mechanism of sudden environmental pollution events in the context of big data. Fresenius Environ. Bull. 2022, 31, 1085–1092. [Google Scholar]
- Xu, J.; Xu, M.; Zhao, Y.; Wang, S.; Tao, M.; Wang, Y. Spatial-temporal distribution and evolutionary characteristics of water environment sudden pollution incidents in China from 2006 to 2018. Sci. Total Environ. 2021, 801, 149677. [Google Scholar] [CrossRef]
- Tian, P.; Wu, H.; Yang, T.; Zhang, W.; Jiang, F.; Zhang, Z.; Wu, T. Environmental risk assessment of accidental pollution incidents in drinking water source areas: A case study of the Hongfeng Lake Watershed, China. Sustainability 2019, 11, 5403. [Google Scholar] [CrossRef] [Green Version]
- Zhao, Y.; Pan, Y.; Wang, W.; Guo, L. A Brain-inspired dynamic environmental emergency response framework for sudden water pollution accidents. Water 2021, 13, 3097. [Google Scholar] [CrossRef]
- Yang, J.; Sun, F.; Su, H.; Tao, Y.; Chang, H. Multiple risk assessment of heavy metals in surface water and sediment in Taihu Lake, China. Int. J. Environ. Res. Public Health 2022, 19, 13120. [Google Scholar] [CrossRef]
- Hu, J.; Liu, Y.; Sang, Y. Precipitation complexity and its spatial difference in the Taihu Lake Basin, China. Entropy 2019, 21, 48. [Google Scholar] [CrossRef] [Green Version]
- Wu, J.; Wu, Z.; Lin, H.; Ji, H.; Liu, M. Hydrological response to climate change and human activities: A case study of Taihu Basin, China. Water Sci. Eng. 2020, 13, 83–94. [Google Scholar] [CrossRef]
- Zhu, W.; Liu, J.; Li, Q.; Gu, P.; Gu, X.; Wu, L.; Gao, Y.; Shan, J.; Zheng, Z.; Zhang, W. Effects of nutrient levels on microbial diversity in sediments of a eutrophic shallow lake. Front. Ecol. Evol. 2022, 10. [Google Scholar] [CrossRef]
- Hu, Z.; Yong, P.; Ruichen, X.; Yuan, L. Study on the proportion and flow path of Yangtze River water diversion into Taihu Lake. Water Supply 2022, 22, 1820–1834. [Google Scholar] [CrossRef]
- Wang, Y.; Wu, W.; Boelens, L. City profile: Suzhou, China-the interaction of water and city. Cities 2021, 112, 103119. [Google Scholar] [CrossRef]
- Lin, W.; Hong, C.; Zho, Y. Multi-scale evaluation of suzhou city’s sustainable development level based on the sustainable development goals framework. Sustainability 2020, 12, 976. [Google Scholar] [CrossRef] [Green Version]
- She, J.; Du, P. Research on the coordinated development of shanghai’s regional development and low-carbon economy based on the coordination degree model of composite systems. Fresenius Environ. Bull. 2021, 30, 12439–12445. [Google Scholar]
- Wang, H.; Cheng, Z.; Zhu, D. Striving for global cities with governance approach in transitional China: Case study of Shanghai. Land Use Pol. 2020, 90, 104288. [Google Scholar] [CrossRef]
- Zhang, X.; Liu, Y.; Tleubergenova, A.; Liu, J.; Fan, R.; Tang, Y.; Meng, X. Evaluation of urban sustainability based on development structures and economic aggregates: A case study of Jiaxing, China. Sustainability 2022, 14, 976. [Google Scholar] [CrossRef]
- Xu, C.; Qian, C.; Yang, W.; Li, B.; Kong, L.; Kong, F. Spatiotemporal pattern of urban-rural integration development and its driving mechanism analysis in Hangzhou bay urban agglomeration. Int. J. Environ. Res. Public Health 2022, 19, 8390. [Google Scholar] [CrossRef]
- Wang, T.; Zhong, M.; Lu, M.; Xu, D.; Xue, Y.; Huang, J.; Blaney, L.; Yu, G. Occurrence, spatiotemporal distribution, and risk assessment of current-use pesticides in surface water: A case study Near Taihu Lake, China. Sci. Total Environ. 2021, 782, 146826. [Google Scholar] [CrossRef]
- Wang, L.; Ren, X.; Wang, X.; Ye, P.; Wang, F.; Cheng, J.; Chen, Y.; Yu, A.; Zhang, L.; Qiu, Y. Polycyclic aromatic hydrocarbons (pahs) in the upstream rivers of Taihu lake basin, China: Spatial distribution, sources and environmental risk. Environ. Sci. Pollut. Res. 2022, 29, 23690–23699. [Google Scholar] [CrossRef] [PubMed]
- Xu, R.; Pang, Y.; Hu, Z.; Zhu, T.; Kaisam, J.P. Influence of water diversion on spatial and temporal distribution of flow field and total phosphorus (TP) concentration field in Taihu Lake. Water Supply 2020, 20, 1059–1071. [Google Scholar] [CrossRef] [Green Version]
- Gao, Y.; Yu, J.; Song, Y.; Zhu, G.; Paerl, H.W.; Qin, B. Spatial and temporal distribution characteristics of different forms of inorganic nitrogen in three types of rivers around Lake Taihu, China. Environ. Sci. Pollut. Res. 2019, 26, 6898–6910. [Google Scholar] [CrossRef] [PubMed]
- Huang, X.; Hua, W.; Dai, X. Performance evaluation of watershed environment governance-a case study of Taihu Basin. Water 2022, 14, 158. [Google Scholar] [CrossRef]
- Huang, Y.; Sui, Q.; Lyu, S.; Wang, J.; Huang, S.; Zhao, W.; Wang, B.; Xu, D.; Kong, M.; Zhang, Y.; et al. Tracking emission sources of pahs in a region with pollution-intensive industries, Taihu Basin: From potential pollution sources to surface water. Environ. Pollut. 2020, 264, 114674. [Google Scholar] [CrossRef]
- Wang, X.; Zhang, M.; Liu, L.; Wang, Z.; Lin, K. Using EEM-PARAFAC to identify and trace the pollution sources of surface water with receptor models in Taihu Lake Basin, China. J. Environ. Manage. 2022, 321, 115925. [Google Scholar] [CrossRef]
- GB 3838-2002; Environmental Quality Standards for Surface Wate. Ministry of Environmental Protection of the People’s Republic of China: Beijing, China, 2002.
- Li, F.; Wang, Y.; Mao, L.; Tao, H.; Chen, M. Molybdenum background and pollution levels in the Taipu River, China. Environ. Chem. Lett. 2022, 20, 1009–1015. [Google Scholar] [CrossRef]
- Yao, Q.; Chen, L.; Mao, L.; Ma, Y.; Tian, F.; Wang, R.; Meng, X.; Li, F. Co-effects of hydrological conditions and industrial activities on the distribution of heavy metal pollution in Taipu River, China. Int. J. Environ. Res. Public Health 2022, 19, 10116. [Google Scholar] [CrossRef]
- Wang, Y.; Li, F.; Mao, L.; Chen, M.; Tao, H.; Li, J. Spatial distribution and pollution assessment of potentially toxic elements (PTEs) in surface sediments at the drinking water source channel of Taipu River in China. Minerals 2021, 11, 1202. [Google Scholar] [CrossRef]
- Xu, Y.; Lin, J.; Zhao, J.; Zhu, X. New method improves extraction accuracy of lake water bodies in Central Asia. J. Hydrol. 2021, 603, 127180. [Google Scholar] [CrossRef]
- Zheng, L.; Hu, B.; Ding, A. A multi-factor data-driven prediction model for cyanobacteria blooms in lakes and reservoirs. Desalin. Water Treat. 2020, 189, 207–216. [Google Scholar] [CrossRef]
- Wang, Y.; Chen, H.; Wang, L.; Hua, Z.; He, C.; Cheng, J. A combination method for multicriteria uncertainty analysis and parameter estimation: A case study of Chaohu Lake in Eastern China. Environ. Sci. Pollut. Res. 2020, 27, 20934–20949. [Google Scholar] [CrossRef] [PubMed]
- Peng, Z.; Hu, Y.; Liu, G.; Hu, W.; Zhang, H.; Gao, R. Calibration and quantifying uncertainty of daily water quality forecasts for large lakes with a Bayesian joint probability modelling approach. Water Res. 2020, 185, 116162. [Google Scholar] [CrossRef] [PubMed]


| Level Indicators | Secondary Indicator (Unit) | Grading Criteria and Standardized Scores | |||
|---|---|---|---|---|---|
| High Risk (1) | Medium Risk (0.6) | Low Risk (0.2) | |||
| T: Risk index (RI) | X: Hazard of risk source (HI) | x1: Industry type | Chemical engineering, electroplating, leather, printing and dyeing, paper making | Textile, food processing, etc. | Machinery manufacturing and others |
| x2: Annual sewage discharge (tons) | 500 | 100 | 20 | ||
| x3: Annual COD discharge (tons) | 1000 | 200 | 20 | ||
| x4: Annual ammonia nitrogen emissions (tons) | 5 | 2 | 1 | ||
| x5: Records of illegal emissions in the last 5 years (times) | 3 | 2 | 0 | ||
| Y: Self-purification of environmental media (EI) | y1: Proportion of sewage water quality reaching the standard (%) | 10 | 50 | 80 | |
| y2: Sewage volume flow (m3/s) | 20 | 60 | 100 | ||
| Z:Vulnerability of risk receptors (VI) | z1: Distance between corporate outfall and cross-boundary section (km) | 5 | 20 | 30 | |
| z2: Distance between enterprise sewage outlet and drinking water source protection area (km) | 5 | 20 | 30 | ||
| z3: Presence of rare aquatic species in sewage bodies | 3 | 2 | 0 | ||
| z4: Population density (people/km2) in the transboundary area | 1500 | 1100 | 500 | ||
| Level Indicators | Secondary Indicator (Unit) | Grading Criteria and Standardized Scores | |||
|---|---|---|---|---|---|
| High Risk (1) | Medium Risk (0.6) | Low Risk (0.2) | |||
| T: Risk index (RI) | X: Hazard of risk source (HI) | x1: Type of waste disposed of | Hazardous waste | Other industrial waste | Other |
| x2: Annual sewage production (tons) | 1000 | 200 | 100 | ||
| x3: Years of operation as a percentage of years of design (%) | 80 | 60 | 30 | ||
| x4: Number of pollution accidents in recent 5 years (per) | 3 | 2 | 0 | ||
| x5: Number of recorded illegal emissions in the last 5 years (times) | 3 | 2 | 0 | ||
| Y: Self-purification of environmental media (EI) | y1: Proportion of sewage water quality reaching the standard (%) | 10 | 50 | 80 | |
| y2: Sewage volume flow (m3/s) | 20 | 60 | 100 | ||
| Z: Vulnerability of risk receptors (VI) | z1: Distance between site and transboundary section (km) | 5 | 20 | 30 | |
| z2: Distance between site and drinking water source protection area (km) | 5 | 20 | 30 | ||
| z3: Rare aquatic species (species) in sewage body | 3 | 2 | 0 | ||
| z4: Population density (people/km2) in the transboundary area | 1500 | 1100 | 500 | ||
| Level Indicators | Secondary Indicator (Unit) | Grading Criteria and Standardized Scores | |||
|---|---|---|---|---|---|
| High Risk (1) | Medium Risk (0.6) | Low Risk (0.2) | |||
| T: Risk index (RI) | X: Hazard of risk source (HI) | x1: COD inflow from non-point source (kg/d) | 8000 | 4000 | 1000 |
| x2: non-point source TN into the river (kg/d) | 1000 | 600 | 200 | ||
| x3: non-point source TP into the river (kg/d) | 250 | 150 | 50 | ||
| Y: Self-purification of environmental media (EI) | y1: Water quality compliance rate in the region (%) | 10 | 50 | 80 | |
| y2: Transboundary water body discharge (m3/s) | 20 | 60 | 100 | ||
| Z: Vulnerability of risk receptors (VI) | z1: Distance between point source center and transboundary section (km) | 5 | 20 | 30 | |
| z2: Proportion of the length of the protected drinking water source to the length of the transboundary River Channel (%) | 2 | 1.2 | 0 | ||
| z3: Number of rare aquatic species in transboundary area (species) | 3 | 2 | 0 | ||
| z4: Population density (people/km2) in the transboundary area | 1500 | 1100 | 500 | ||
| Level Indicators | Secondary Indicator (unit) | Grading Criteria and Standardized Scores | |||
|---|---|---|---|---|---|
| High Risk (1) | Medium Risk (0.6) | Low Risk (0.2) | |||
| T: Risk index (RI) | X: Hazard of risk source (HI) | x1: Chemical type | Highly hazardous | Moderate risk | Mild Risk |
| x2: Years of operation as a percentage of years of design (%) | 80 | 60 | 30 | ||
| x3: Number of leakage accidents in recent 5 years (per) | 3 | 2 | 0 | ||
| x4: Location of warehouse | The city | On the outskirts of | rural | ||
| Y: Self-purification of environmental media (EI) | y1: Proportion of sewage water quality reaching the standard (%) | 10 | 50 | 80 | |
| y2: Sewage volume flow (m3/s) | 20 | 60 | 100 | ||
| Z: Vulnerability of risk receptors (VI) | z1: Distance between warehouse and transboundary section (km) | 5 | 20 | 30 | |
| z2: Distance between warehouse and drinking water source protection area (km) | 5 | 20 | 30 | ||
| z3: Rare aquatic species (species) in sewage body | 3 | 2 | 0 | ||
| z4: Population density (people/km2) in the transboundary area | 1500 | 1100 | 500 | ||
| Level Indicators | Secondary Indicator (unit) | Grading Criteria and Standardized Scores | |||
|---|---|---|---|---|---|
| High Risk (1) | Medium Risk (0.6) | Low Risk (0.2) | |||
| T: Risk index (RI) | X: Hazard of risk source (HI) | x1: Route traffic (vessel/day) | 2000 | 1200 | 200 |
| x2: Volume of dangerous goods transported by sea route (vessel/day) | 100 | 60 | 20 | ||
| x3: Number of refueling points on the air route (number) | 10 | 6 | 2 | ||
| x4: Number of shipping line loading and unloading terminals | 10 | 6 | 2 | ||
| Y: Self-purification of environmental media (EI) | y1: Proportion of navigable water quality reaching the standard (%) | 10 | 50 | 80 | |
| y2: Flow of navigable water bodies (m3/s) | 20 | 60 | 100 | ||
| Z: Vulnerability of risk receptors (VI) | z1: Nearest distance between cross-boundary section and refueling point (km) | 5 | 20 | 30 | |
| z2: Nearest distance between the cross-boundary section and the pier (km) | 5 | 20 | 30 | ||
| z3: Percentage of the protected area of drinking water sources in navigable watercourses in the entire watercourse area (%) | 2 | 1.2 | 0 | ||
| z4: Rare aquatic species (species) in sewage body | 3 | 2 | 0 | ||
| z5: Population density (people/km2) in the transboundary area | 1500 | 1100 | 500 | ||
| Level of Risk Source | High-Risk | Second-Highest Risk | Medium Risk |
|---|---|---|---|
| Quantity | 320 | 517 | 649 |
| Information Database Composition | Industrial Point Source | River Information | Accident Case Information | Emergency Resource Baseinformation | Expert’s Information |
|---|---|---|---|---|---|
| Quantity | 2203 | 31 | 661 | 200 | 130 |
| Scenario | Control Measures | Details |
|---|---|---|
| The ammonia nitrogen concentration at the Suhu boundary of the Taipu River exceeds the standard of class Ⅲ surface water in the dry season | Scheme 1: Water is diverted from Taihu Lake via the Taipu Sluice | 1. The water diversion flow is 10 m3/s (the inflow from upstream is 60 mL3/s) |
| 2. The diversion water flow is 20 m3/s (the inflow from upstream is 70 m3/s) | ||
| 3. Water is diverted at a flow rate of 30 m3/s (the inflow from upstream is 80 m3/s) | ||
| 4. The diversion flow rate is 40 m3/s (the inflow from upstream is 90 m3/s) | ||
| 5. The diversion flow rate is 50 m3/s (the inflow from upstream is 100 m3/s) | ||
| Scheme 2: Close tributary gates during the dry period | 6. Close the Shijia Harbor tributary | |
| 7. Close the Lanxitang tributary | ||
| 8. Close the Post Changdang tributary | ||
| 9. Close the Xihudang branch | ||
| 10. Close the branch of Maxie Lake |
| Scenario | Control Measures | Details |
|---|---|---|
| Discharge of methylene chloride into the Pingwang Tributary of the Taipu River | Plan 1: Divert water from Taihu Lake via the Taipu Gate | 1. Divert water at a flow rate of 10 m3/s |
| 2. Divert water at a flow rate of 20 m3/s | ||
| 3. Divert water at a flow rate of 30 m3/s | ||
| 4. Divert water at a flow rate of 40 m3/s | ||
| 5. Divert water at a flow rate of 50 m3/s | ||
| Option 2: Close the Lanxitang tributary | 6. Close the Lanxitang tributary | |
| Plan 3: Divert water from Taihu Lake and close the Lanxitang tributary | 7. Close the gate and divert water at a flow rate of 10 m3/s | |
| 8. Close the gate and divert water at a flow rate of 20 m3/s | ||
| 9. Close the gate and divert water at a flow rate of 30 m3/s | ||
| 10. Close the gate and divert water at a flow rate of 40 m3/s | ||
| 11. Lock divert water at a flow rate of 50 m3/s |
Disclaimer/Publisher’s Note: The statements, opinions and data contained in all publications are solely those of the individual author(s) and contributor(s) and not of MDPI and/or the editor(s). MDPI and/or the editor(s) disclaim responsibility for any injury to people or property resulting from any ideas, methods, instructions or products referred to in the content. |
© 2023 by the authors. Licensee MDPI, Basel, Switzerland. This article is an open access article distributed under the terms and conditions of the Creative Commons Attribution (CC BY) license (https://creativecommons.org/licenses/by/4.0/).
Share and Cite
He, F.; Lai, Q.; Ma, J.; Wei, G.; Li, W. Design and Application of an Early Warning and Emergency Response System in the Transboundary Area of the Taihu Lake Basin. Int. J. Environ. Res. Public Health 2023, 20, 1340. https://doi.org/10.3390/ijerph20021340
He F, Lai Q, Ma J, Wei G, Li W. Design and Application of an Early Warning and Emergency Response System in the Transboundary Area of the Taihu Lake Basin. International Journal of Environmental Research and Public Health. 2023; 20(2):1340. https://doi.org/10.3390/ijerph20021340
Chicago/Turabian StyleHe, Fei, Qiuying Lai, Jie Ma, Geng Wei, and Weixin Li. 2023. "Design and Application of an Early Warning and Emergency Response System in the Transboundary Area of the Taihu Lake Basin" International Journal of Environmental Research and Public Health 20, no. 2: 1340. https://doi.org/10.3390/ijerph20021340