Article

Arsenic and Heavy Metals in Sediments Affected by Typical Gold Mining Areas in Southwest China: Accumulation, Sources and Ecological Risks

1
College of Resources and Environmental Engineering, Guizhou University, Guiyang 550025, China
2
College Key Laboratory of Karst Geological Resources and Environment of Ministry of Education, Guiyang 550025, China
*
Author to whom correspondence should be addressed.
Int. J. Environ. Res. Public Health 2023, 20(2), 1432; https://doi.org/10.3390/ijerph20021432
Submission received: 20 December 2022 / Revised: 9 January 2023 / Accepted: 10 January 2023 / Published: 12 January 2023
(This article belongs to the Special Issue Environmental Geochemistry of Toxic Elements in the Environment)

Abstract

:
Gold mining is associated with serious heavy metal pollution problems. However, the studies on such pollution caused by gold mining in specific geological environments and extraction processes remain insufficient. This study investigated the accumulation, fractions, sources and influencing factors of arsenic and heavy metals in the sediments from a gold mine area in Southwest China and also assessed their pollution and ecological risks. During gold mining, As, Sb, Zn, and Cd in the sediments were affected, and their accumulation and chemical activity were relatively high. Gold mining is the main source of As, Sb, Zn and Cd accumulation in sediments (over 40.6%). Some influential factors cannot be ignored, i.e., water transport, local lithology, proportion of mild acido-soluble fraction (F1) and pH value. In addition, arsenic and most tested heavy metals have different pollution and ecological risks, especially As and Sb. Compared with the other gold mining areas, the arsenic and the heavy metal sediments in the area of this study have higher pollution and ecological risks. The results of this study show that the local government must monitor potential environmental hazards from As and Sb pollution to prevent their adverse effects on human beings. This study also provides suggestions on water protection in the same type of gold-mining areas.

1. Introduction

Non-ferrous metal mining causes severe contamination of As and heavy metals (HMs). Due to the increasing activity and mobility in water [1,2], sediments are one of the major destinations for As and HMs migration and diffusion in the water [2,3]. As and HMs accumulated in sediments are often tens or even hundreds of times the amount in water [3,4,5]. The relatively stable and conducive sedimentary environment transforms them into more harmful pollutants or chemical fractions [6]. Once the sedimentary environment is changed by external interference, As and HMs that are accumulated in sediments will be resuspended, which will cause secondary pollution to the water environment [6,7], especially the As and HMs with high mobility that have been affected by the mining area. Therefore, focusing on the accumulation and contamination of As and HMs in sediments around the non-ferrous metal mining area is necessary. Notably, many factors often affect the migration, diffusion, accumulation and release of As and HMs from water to sediment [8,9,10,11].
The heavy metal pollution caused by gold ore should also be paid attention to because of its low grade, and large amount of waste rock and tailings [12]. However, due to the acceleration of industrialization and urban process, extensive mining activities are one of the main reasons for China’s serious environmental problems [13,14]. At present, heavy metal mining pollution and ecological risks are the focus of China’s water and soil protection, especially in the southwest [15,16,17], where special action needs to be urgently conducted due to its large-scale development and utilization of mineral resources, fragile ecological environment and difficulty in recovering after pollution [18,19,20].
Therefore, this study selected a gold mine northeast of Guizhou Province to investigate the arsenic and heavy metals (Sb, Zn, Cd, Cr, Co, Ni, Cu and Pb) in the sediments around the mining area. This gold mine is located in Southwest China, one of the typical gold-mine clusters. It has a mining history of more than 30 years and has affected the local residents to varying degrees [21,22]. It is crucial to identify the source and assess the pollution and risk levels of heavy metals [23,24]. Several receptor models have been proposed over the past decades, such as positive matrix factorization (PMF) that was used in this study, principal component analysis (PCA), and cluster analysis (CA) [25,26]. Metals in the same group are considered to originate from similar sources [25,27,28].
Some key assessment indicators, e.g., the geo-accumulation index (Igeo), potential ecological risk index (RI), and ecological risk factor (Eir), have been confirmed to make important contributions to the ecological risk control of heavy metals. They were also used in this study [29,30]. In addition, some research showed that the fractions of heavy metals in sediments are important for their analysis and evaluation [31]. Hence, this study aimed to (1) clarify the pollution sources of arsenic and heavy metals in sediments, (2) analyze their influencing factors, and (3) assess their pollution and ecological risks to provide a scientific basis and data support for the environmental protection research of the same type of water.

2. Materials and Methods

2.1. Study Area

The study area is northeast of Southwest Guizhou Province [22]; it has a subtropical monsoon climate, humid and rainy, flat terrain, with an altitude of 1400–1726 m. The annual average temperature is 15.2 °C, and the average precipitation is 1320.5 mm. This area is a typical karst hilly landform, mainly composed of limestone (consisting mainly of calcium carbonate) mixed with a small amount of sandstone and mudstone (in the middle of the study area) and clay rock (in the northeast of the study area).
The surface water and groundwater in this area are intertwined, and there are four relatively independent karst rivers, Xiaozichong (SZ), Huashiban (HS), Taiping Cave (TC), and Shamba (SB), flowing from southwest to northeast (Figure 1). Gold-bearing minerals are usually pyrite (FeS2) and arsenopyrite (AsFeS) [32]. According to the survey, the gold extraction process in this area is mainly Charcoal Immersion Leaching (CIL). In addition to gold mining, cultivation and animal husbandry are the other major activities.

2.2. Sample Collection and Analysis

In March 2021, 25 sediment sample points were selected from four karst rivers (SZ, HS, TC and SB), an abandoned mine pit (M1), and a mine drainage collection pond (M2) in the study area. All samples were collected and uniformly mixed in a single sample point in a polyethylene sealed bag to obtain the final sample of this sample point, which were then sealed and stored at 4 °C and sent for laboratory analysis.
Before testing, the sample was dried in a freeze-dryer (10N-50A, Jingfei Technology, Shenzhen, China) and then screened and impurities were removed. The 1:5 mixed solution of sediment: water (m (g)/V (mL)) was shaken and allowed to stand for 30 min to detect the pH of the sample (phs-3c, Rex instruments, Hangzhou, China). HNO3-HF digestion system was selected for hermetic digestion at 180 °C until As and HMs in the sample were completely released, and their concentration was detected. BCR sequential extraction method (GB/T 25282-2010) was selected to extract four chemical forms of As and HMs. An inductively coupled plasma mass spectrometer (ICP-MS, iris intrepid II XSP, Agilent) was used to detect all steps, and the grades of all chemical reagents used were excellent purity.

2.3. Quality Control and Statistical Analysis

In this study, the national standard sediment sample (GBW07382 (GSD-31)) and 20% parallel samples were used to ensure the precision and accuracy of the analytical procedure. The results showed that the recoveries of samples were 94.10–113.83%, and the repeatability of parallel samples was 91.10–109.49%. The data were statistically analysed and plotted using Origin 2021 and ArcGIS 10.6 software, and Pearson correlation analysis and source identification were performed using SPSS 20.0 and EPA PMF 5.0.

2.4. Background Value of As and HMs, Contamination Assessment Index, and Source Analysis Model

Considering that the regional background value is more appropriate than the average crust or average shale data, the local HMs soil background value of Guizhou Province was adopted as the background value (BV) [33] of the study area. A positive matrix factorization analysis model (PMF) [34] was used to identify the sources of As and HMs accumulation; Assessment of arsenic and HMs pollution and ecological risk based on the geo-accumulation Index (Igeo) [35], single ecological risk factor (Eir) and potential ecological risk index (RI) [36].

3. Results

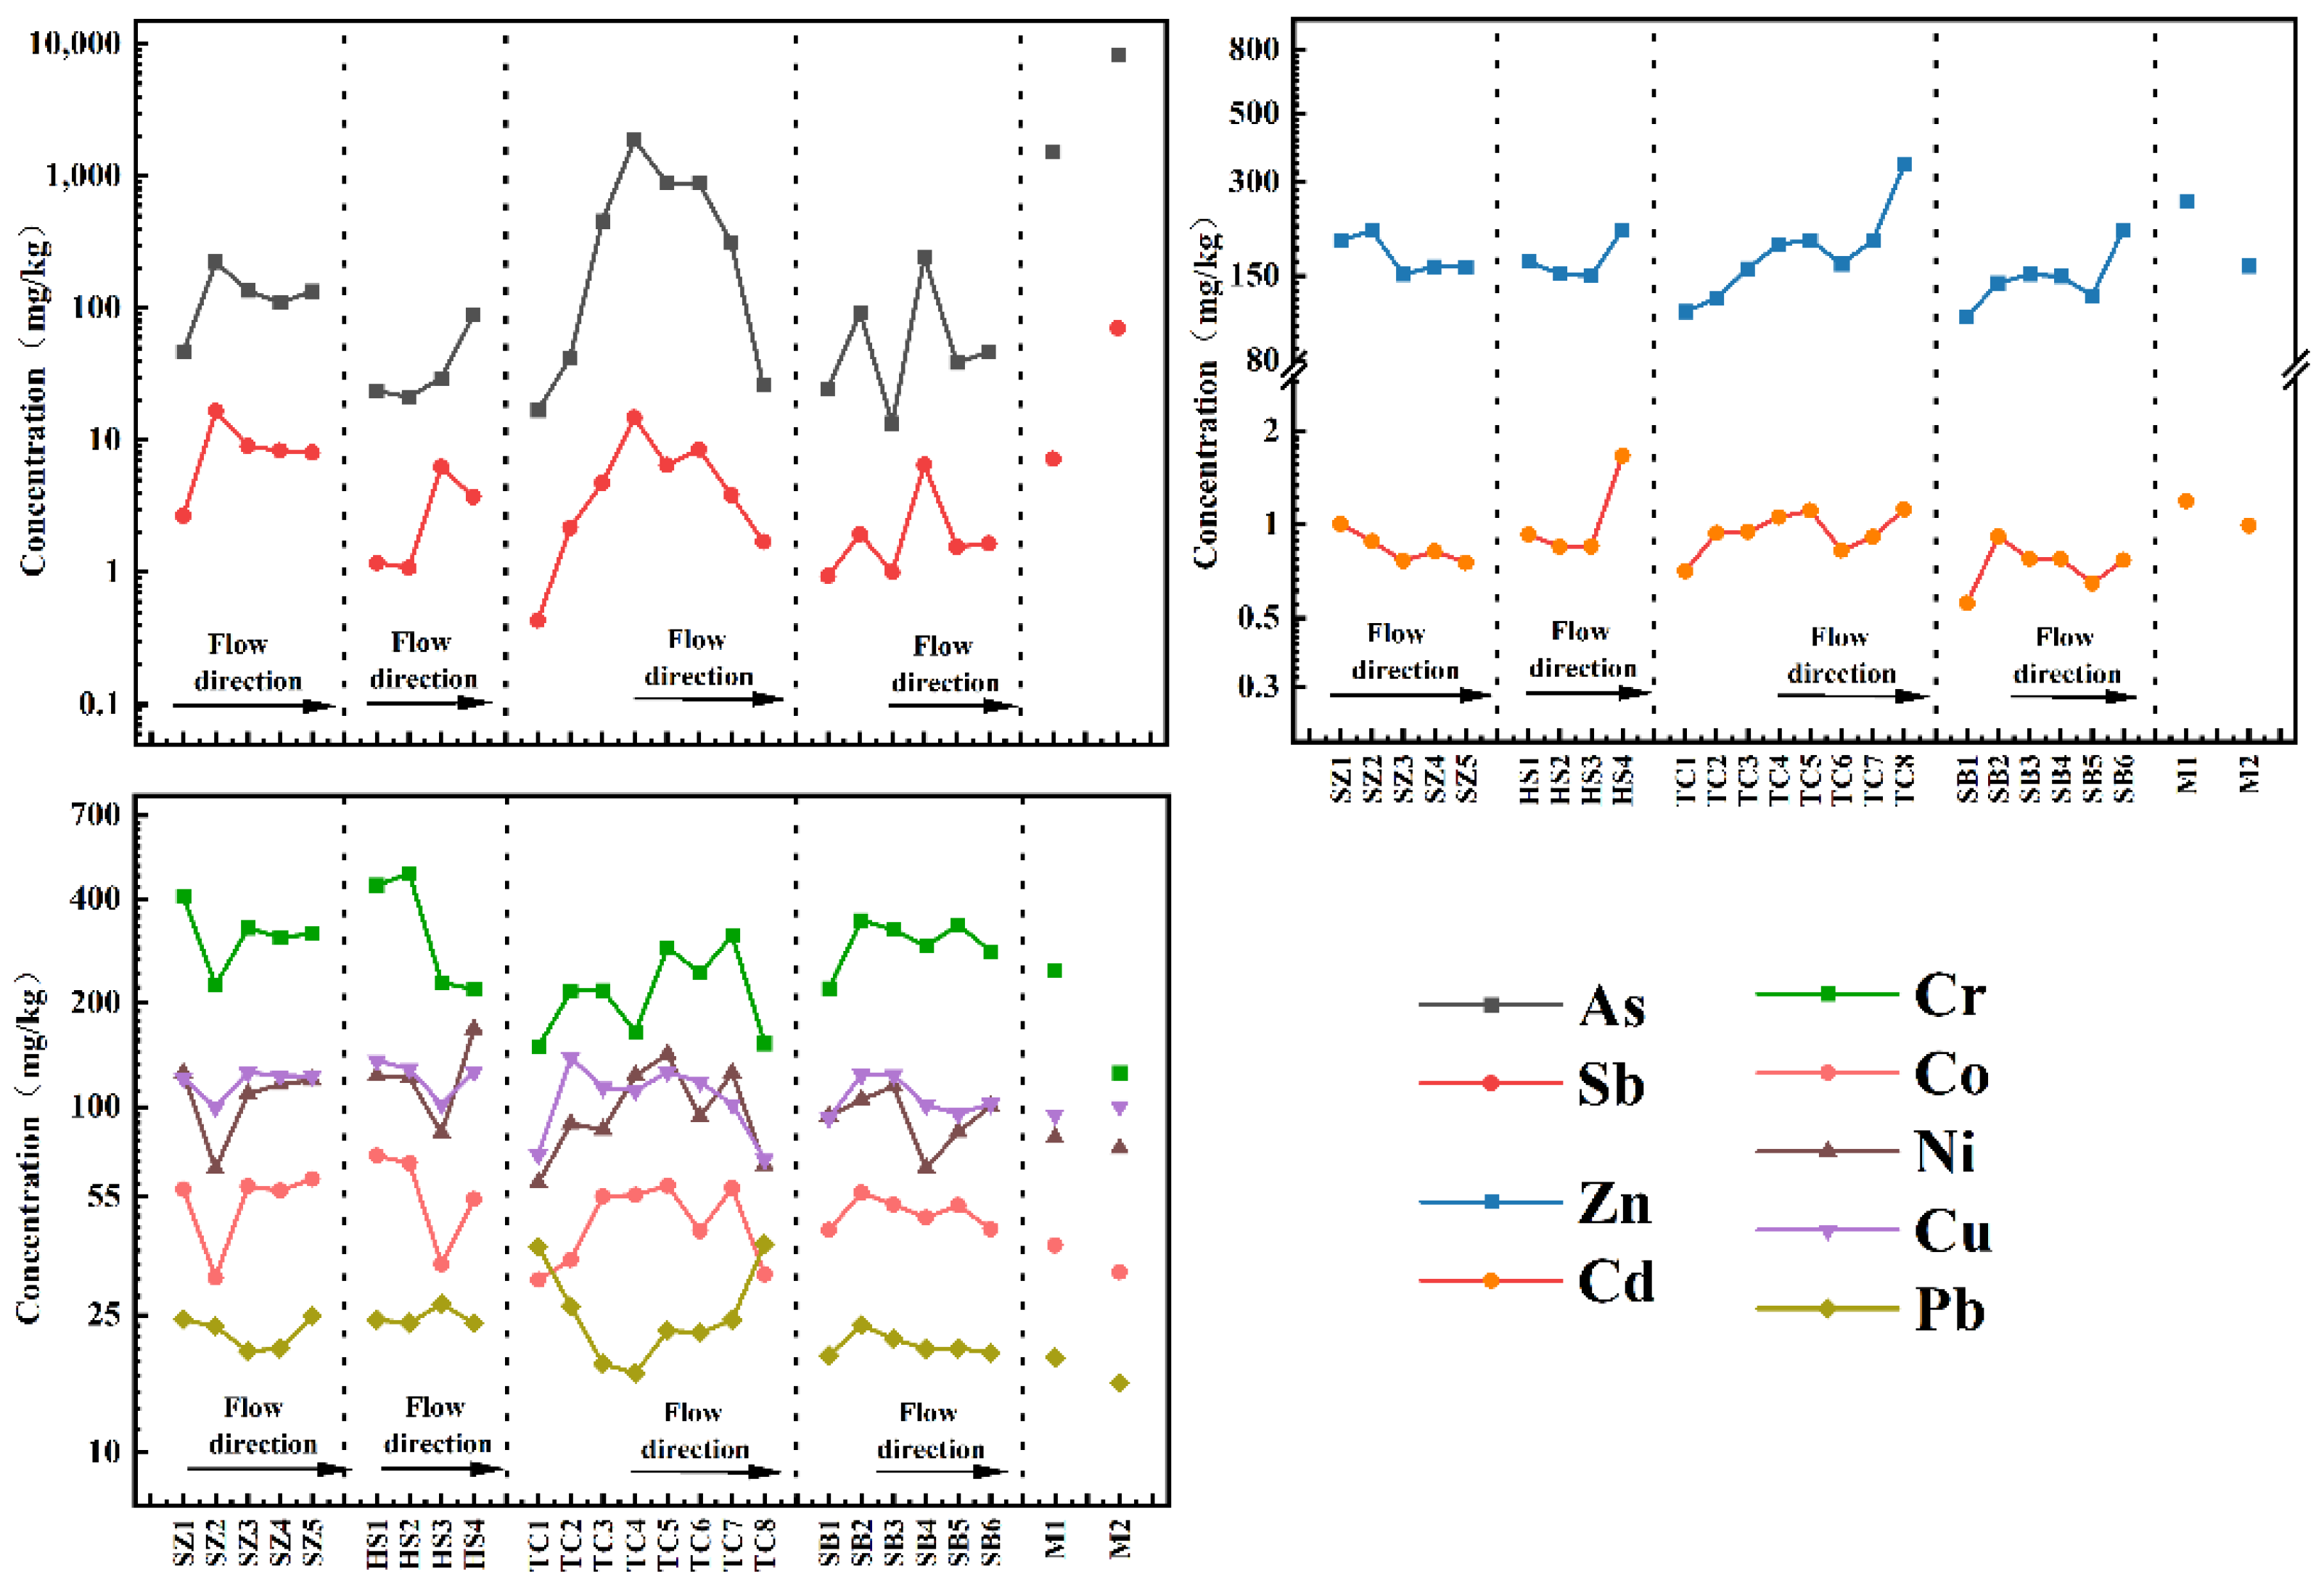
3.1. Concentration and Accumulation Changes of As and HMs in Sediments

Tables S1 and S2 (Supplementary Materials) show the concentration and statistical results of As and HMs in sediment samples. In general, except for Pb, the average concentration of As and other HMs was higher than or even much higher than their BV. In contrast, the average concentration of As and HMs in the sediments of the SB karst water system farthest from the mining area was the lowest compared with others, indicating that their input was affected by external activities, among which mining activities in the mining area cannot be ignored.
Figure 2 shows the cumulative changes of As and HMs in sediment samples with the flow direction. The accumulation changes of ① As and Sb, ② Zn and Cd and ③ Cr, Co, Ni, and Cu in the sediments were similar, indicating that these three groups may have similar accumulation rules and the same accumulation source, respectively. The cumulative degree of As, Sb, Zn and Cd in the mining area (M) and its surrounding sediments (SZ2, TC2–TC4) was very significant, especially the cumulative concentration of As and Sb in M1 and M2 sediments, which was 93.54 and 6.60 times of BV and 408.51 and 31.58 times of BV respectively. Simultaneously, the accumulation of As and Sb in the sediments downstream of the confluence, that is, the intersection of the mining wastewater treatment plant outlet and TC karst river (TC4), was also very high, reaching the peak of the TC karst river. This indicates that gold mining seriously impacts the accumulation of As, Sb, Zn and Cd in the sediments, especially As and Sb [37,38,39], similar to the study of other gold deposits [40,41,42,43]. In addition, the As and HMs background in the gold mining area may also be another reason [44].
Overall, there are two phenomena: First, the cumulative concentrations of As, Sb, Zn and Cd in the sediments of the four karst rivers gradually increase with the flow direction. Secondly, the cumulative As and HM concentrations in the sediments at the confluence of all main streams and tributaries (TC2 and SB2) also increased sharply, indicating that they were affected by water transport because aqueous transport is one of the main ways of migration and diffusion of As and HMs in the dissolved phase [45]. In addition, the accumulation of As, Sb, Zn and Cd in Figure 2 presents a non-unimodal pattern with several prominent concentration turning points, such as TC5, TC6, SB4 and SB5, indicating that their accumulation may also be affected by other factors. Compared with As, Sb, Zn and Cd, only part of Cr, Co, Ni and Cu of the sediments slightly decreased around the mining area (SZ2 and TC4); however, the cumulative characteristics related to the mining area were not evident, which needs further analysis.

3.2. Chemical Forms of As and HMs in Sediments

Figure 3 shows the percentage of the sediment’s four chemical forms of As and HMs. A significant difference in the percentage between As and a single HM was observed. In the non-residual fraction, (1) the percentage of the F1 fraction of As, Cd and Co was relatively high, approximately 0–1/3, followed by Sb, Zn and Ni, approximately 0–1/6. However, owing to the strong correlation between the first two HMs, Sb and Zn and aluminum, manganese and iron particles, their fluidity was generally lower than that of other HMs, consistent with this study [46]. On the contrary, Cr, Pb and Cu had almost no F1 fraction. Specifically, the F1 percentage of As, Sb, Zn and Cd in the sediment was significantly higher than Cr, Co, Ni and Cu; they have higher mobility. Therefore, they can be easily used by aquatic organisms for gold mining, especially since the gold-carrying minerals and associated minerals of this type of gold deposit are rich in a large number of As and Sb [37,38,39], consistent with our previous analysis. (2) Almost all the F2 and F3 fractions of As and HMs have a certain proportion. Both fractions are vulnerable to the impact of redox fluctuations. They have unstable characteristics, indicating that they have high weak retention in the sediment [47] and are likely to be highly sensitive to some influencing factors that can control or adjust redox conditions. For the residual fractions, (3) the proportion of the F4 fraction in the sediment sample was the highest among all fractions, with Cu and Sb being the most prominent (the F4 fraction proportion in 98.2% of the sediments exceeded 75%), followed by Ni and As, indicating that the geological background was their non-negligible source, and their solubility reduces to a certain extent [47].

3.3. Cumulative Sources of As and HMs in Sediments

Table S3 (Supplementary Materials) shows Pearson correlation coefficients of As and HMs in sediments. There is a significant correlation between these elements (ρ < 0.01), consistent with the analysed results. In the PMF model, the estimated factors are set to 2, 3, 4 and 5, and the predicted and the measured values are fitted, respectively. The fitting results show that it is best when the factor number is 3 because its Qrobust (326.4) is closest to Qture (419.9). Figure 4. respectively show the source contribution and contribution rate of As and HMs in sediments and the percentage of each source when the factor number is 3.
In factor 3, the As, Sb, Zn and Cd had the highest contribution rate (both greater than 40.6%). From the analysis, mining of gold mines has a significant impact on them; therefore, factor 3 is regarded as the source related to it, and the proportion of this part of the source is nearly half in the two groups.
In factor 2, As and HMs have a certain proportion (26.4–56.6%). Therefore, from the percentage of their chemical forms, the geological background is the source of As and all HMs in sediments that cannot be ignored. Concurrently, it is also considered that southwestern China has a background of high concentrations of metalloids and HMs [47,48,49]. Therefore, factor 2 is regarded as a source related to geological background.
In factor 1, the contribution rates of Cr, Co, Ni, Cu and Pb were higher (both greater than 34.8%), while the contribution rates of As, Sb, Zn and Cd were lower (both less than 26.3%). First, we did not observe the cumulative characteristics of Cr, Co, Ni, Cu and Pb related to the mining area. Secondly, compared with As, Sb, Zn and Cd, their chemical activity was lower. Considering that the local villages are evenly distributed (i.e., the area of human activities, Figure 1), these all indicate that they may be more affected by the continuous input of other man-made sources than the gold mining sources, such as domestic sewage. In addition, according to the survey, the local cultivation and animal husbandry are well developed, and some studies show that organic and compound fertilizers contain specific concentrations of Cr, Co, Ni and Cu, especially Cu, which can stimulate plant growth and improve crop yield [50,51,52,53]; thus, agricultural activities may also pollute it. In conclusion, factor 1 is another source mainly based on other human activities. (Because they are not closely related to gold mining, they will not be explained in detail in the following analysis).

3.4. Influencing Factors of As and HMs Accumulation in Sediments

In addition to the two factors of gold mining and water transportation, we further discussed the two factors of pH and F1 fraction. Concurrently, considering the geological characteristics of karst areas, we also discuss the lithology of this area.
Table S1 and Figure 1 show the lithology of the corresponding area for each sediment. Interestingly, the cumulative changes of As and HMs are very similar to the lithological changes of the sediment’s area. For example, the sediments of several karst rivers (SZ2, TC2–TC4, TC7–TC8, SB4, SB6) located in clay rock and sand mudstone areas also show the characteristics of “piecewise” accumulation. Previous studies have shown that colloid flow is the main migration and diffusion of As and HMs besides aqueous transport [11,54,55]. This flow mode is sensitive to the redox state and changes the stability of solid iron (oxygen) oxides, leading to the decomposition of organic matter, thus affecting the migration and diffusion of As and HMs [56]. Notably, As and HMs in almost all sediments in this study showed weak retention and were vulnerable to redox fluctuations (with a high proportion of F2 and F3 fractions). Studies have shown that lithology can adjust redox fluctuations by influencing soil particle size, mineral composition, and clay content and can indirectly affect the migration and diffusion of As and HMs. In particular, media with high clay content or rich reducible iron (hydroxide) oxides are more easily affected, making As and HMs in the aquatic environment re-accumulate and re-fix [56,57,58].
Therefore, once the As, Sb, Zn and Cd in the water system pass through areas with high clay content (sand mudstone and clay rock in this study), they are very easy to be adsorbed or fixed and finally present high cumulative concentration in the sediments, even in the sediments of non-gold mining areas (SB4). This mechanism may also play a role in strengthening the accumulation of As, Sb, Zn and Cd in the sediments of gold mining areas. Considering some As, Sb, Zn and Cd in the upstream are adsorbed or fixed, the cumulative concentration of As and HMs in the downstream sediments (SB3, TC5 and SB5) will be significantly reduced because they have moved from the area with high clay content. In addition, owing to the characteristics of limestone, which can hardly hinder their migration in water, they will continue accumulating to the next area with higher clay content (TC7–TC8, SB5–SB6).
Generally, As and HMs, mainly composed of residue fraction (F4), are more stable in the water environment [59,60,61]. However, in this study, the relationship between the percentage change of the F1 fraction in As, Sb, Zn and Cd and the total concentration (Figure 5) shows that there is still a significant negative correlation between them, especially in As and Sb. Furthermore, it shows that As, Sb, Zn and Cd with high mobility can quickly be released from the sediment [62,63], reducing cumulative concentration, even in the sediment of high clay areas (TC7–TC8).
In addition, limestone (mainly carbonate) also has a certain buffer effect. These stable weak acids, weak alkalis, or neutral pH values can reduce the concentration of soluble As and HMs in karst areas [10]. Most sediment samples in the study may also be affected by this phenomenon because their pH values are neutral or weakly alkaline (7.13–8.86), and only a few sediment samples (SZ1, SZ4, TB3 and M1) are weakly acidic (6.23–6.94).

3.5. Contamination and Ecological Risk of As and HMs in Sediments

3.5.1. Contamination and Risk Assessment Based on Igeo, Eir and RI Indexes

Figure 6 shows the comparison of Igeo, Eir and RI of As and HMs in the sediments of the gold mine area and four karst rivers. Igeo and Eir indexes show that the pollution degree of As and other HMs is between grade I and grade II, and the risk level is slight to medium in most sediments except Pb. The contamination degree and risk value of As and Sb were the highest in the sediments; 64% and 4% of the sediments above grade III were polluted, and 24% and 12% of the sediments above high risk were polluted. Notably, as high as 20% of the sediments reached Grade V (severe) pollution, and As and Sb of the extremely high-risk sediments reached 20% and 4%, respectively, and most of them were from the mining area (M) and the TC karst rivers. Especially in the mining area (M2), their Eir values were up to 4085.13 and 947.41, respectively, which far exceeded the extremely high-risk standard of the Eir index (Eir > 320). Therefore, we must be alert to their excessive input.
Generally, the average RI index is arranged in descending order: M > CA > SZ ≈ TB > SR, consistent with the previous analysis. Except for Pb, arsenic and other heavy metals are mostly in the range of slight risk to medium risk (12~20%), and 20% and 16.7% of the sediments in SZ and SB rivers were at high risk. However, the sediments above high risk all appeared in TC River and the mining area (M), accounting for 37.5% and 100% of the sediments in their respective water systems, respectively.

3.5.2. Comparison between This Study and Sediments around Other Gold Mining Areas

The average concentration, Igeo and RI values of As, Sb, Zn and Cd in the sediments of this study were compared with the surface sediments around other gold mining areas (Figure 7).
The average concentrations of As and HMs in the sediments of most references are lower than those in our study. Individual average values, including As, are extremely low relative to local A, possibly owing to their different gold ore types or mining methods because the high concentration of As in this area is concentrated near the mining area. Sb is lower than local K. Zn is lower than local K and E, and the reason for Zn being lower than local E is the same as above. Cd is lower than local E, I and J. For Igeo and RI values, Zn in other studies is lower than that in our study. On the contrary, Cd is mostly higher than that in our research. However, there are two evaluation criteria in these cities: (1) A, B, D, K and M were evaluated by statistical methods or local background values. (2) C, F, G, H and L were evaluated by the geochemical background value of the crust (UCC). Most of the Igeo and RI values higher than those in our study were evaluated using UCC as the background value, except for area D. Notably, the background value of UCC was far lower than that of this study. This means that the pollution and ecological risks of arsenic and heavy metals in the study area are still relatively serious and must be paid significant attention.

4. Conclusions

This study analyzed the accumulation, sources and impact factors and assessed their pollution and ecological risks of As and HMs in the river sediments around a gold mine in southwest China, and obtained some important results: (1) Compared with Cr, Co, Ni, Cu and Pb, As, Sb, Zn and Cd were affected by gold mining, and their accumulation degree and chemical activity were relatively high. Among them, the sediments with high As and Sb accumulation were mainly concentrated in the gold mine area (M). The cumulative concentrations of As, Sb, Zn and Cd in the sediments of the SZ, HS and TC karst rivers were higher than those of the SB karst rivers. (2) Gold mining is the primary source of As, Sb, Zn and Cd accumulation in sediments, accounting for 40.6%, 47.3%, 41.2% and 44.2%, respectively. In addition, water flow transport, local lithology, the proportion of F1 fraction of elements, and pH are influencing factors that cannot be ignored. (3) In addition to Pb, arsenic and other heavy metals have reached a slight to medium level of pollution and risk. However, As and Sb are the most serious. Their Igeo and Eir values are above serious pollution and medium pollution, respectively, and both meet extremely high-risk standards, mainly the sediments from the mining area (M) and TC River. The research result is of great significance for preventing and controlling the sediment pollution of arsenic and heavy metals near the same type of gold mining area. In addition, other influencing factors, such as local lithology and weak acid distillate, should be noted.

Supplementary Materials

The following supporting information can be downloaded at: https://www.mdpi.com/article/10.3390/ijerph20021432/s1, Table S1. As and HMs concentration (mg/kg), pH value in sediment samples, and lithology of the area. Table S2. Statistical results of concentration (mg/kg) and pH of As and HMs in sediment samples and their corresponding BV. Table S3. Pearson correlation matrix of As and HMs in sediments.

Author Contributions

S.C.: Conceptualization, Data Curation, Formal Analysis, Investigation, Methodology, Resources, Software, Visualization, Writing—Original Draft. P.W.: Conceptualization, Funding Acquisition, Supervision, Writing—Review and Editing. X.Z.: Formal Analysis, Investigation, Resources. B.Z.: Data Curation, Formal Analysis, Software, Visualization. J.L.: Formal Analysis, Resources. E.L.: Software, Visualization. All authors have read and agreed to the published version of the manuscript.

Funding

This work was financially supported by the National Key R&D Projects (2019YFC1805300), Guizhou Science and Technology Plan Project (Qiankeheji ZK [2021] General 234) and Guizhou Science and Technology Plan Project (Technical system of prevention and control to mine groundwater pollution in karst area).

Institutional Review Board Statement

This work does not involve any hazards, such as the use of animal or human subjects. There is no plagiarism in our research or any data, articles or theories of others.

Informed Consent Statement

This paper has not been and will not be submitted simultaneously to other journals. The paper is an entirely original work conducted by us without copying or plagiarism issues. The information reported in the paper is accurate to the best of our knowledge. A single study was not split into several parts to increase the number of submissions and be submitted to various journals or one journal over time. We consent to publish.

Data Availability Statement

Some or all data, models, or code that supports the findings of this study is available from the corresponding author upon reasonable request.

Conflicts of Interest

The authors declare no conflict of interest.

References

  1. Besada, V.; Bellas, J.; Sánchez-Marín, P.; Bernárdez, P.; Schultze, F. Metal and metalloid pollution in shelf sediments from the Gulf of Cádiz (Southwest Spain): Long-lasting effects of a historical mining area. Environ. Pollut. 2022, 295, 118675. [Google Scholar] [CrossRef] [PubMed]
  2. Gutierrez, M.; Mickus, K.; Camacho, L.M. Abandoned PbZn mining wastes and their mobility as proxy to toxicity: A review. Sci. Total Environ. 2016, 565, 392–400. [Google Scholar] [CrossRef] [PubMed]
  3. Miranda, L.S.; Wijesiri, B.; Ayoko, G.A.; Egodawatta, P.; Goonetilleke, A. Water-sediment interactions and mobility of heavy metals in aquatic environments. Water Res. 2021, 202, 117386. [Google Scholar] [CrossRef] [PubMed]
  4. Zhang, H.; Liu, S.; Ai, L.; Cao, P.; Wu, K.; Cui, J.; Wang, H.; Mohamed, C.A.R.; Shi, X. Distribution and assessment of heavy metal in sediments of Malacca Strait. Mar. Pollut. Bull. 2022, 178, 113575. [Google Scholar] [CrossRef] [PubMed]
  5. Zhang, J.; Li, X.; Guo, L.; Deng, Z.; Wang, D.; Liu, L. Assessment of heavy metal pollution and water quality characteristics of the reservoir control reaches in the middle Han River, China. Sci. Total Environ. 2021, 799, 149472. [Google Scholar] [CrossRef] [PubMed]
  6. Yuan, X.; Zhang, L.; Li, J.; Wang, C.; Ji, J. Sediment properties and heavy metal pollution assessment in the river, estuary and lake environments of a fluvial plain, China. Catena 2014, 119, 52–60. [Google Scholar] [CrossRef]
  7. Cantwell, M.G.; Burgess, R.M.; King, J.W. Resuspension of contaminated field and formulated reference sediments Part I: Evaluation of metal release under controlled laboratory conditions. Chemosphere 2008, 73, 1824–1831. [Google Scholar] [CrossRef]
  8. Kretzschmar, R.; Borkovec, M.; Grolimund, D.; Elimelech, M. Mobile Subsurface Colloids and Their Role in Contaminant Transport. Adv. Agron. 1999, 66, 121–193. [Google Scholar]
  9. Nabuyanda, M.M.; Kelderman, P.; Sankura, M.G.; Rousseau, D.; Irvine, K. Investigating the effect of Eh and pH on binding forms of Co, Cu, and Pb in wetland sediments from Zambia. J. Environ. Manag. 2022, 319, 115543. [Google Scholar] [CrossRef]
  10. Qin, W.; Han, D.; Song, X.; Liu, S. Sources and migration of heavy metals in a karst water system under the threats of an abandoned Pb-Zn mine, Southwest China. Environ. Pollut. 2021, 277, 116774. [Google Scholar] [CrossRef]
  11. Thompson, A.; Chadwick, O.A.; Boman, S.; Chorover, J. Colloid Mobilization During Soil Iron Redox Oscillations. Environ. Sci. Technol. 2006, 40, 5743–5749. [Google Scholar] [CrossRef]
  12. Yongnian, Z.; Taiyi, L.; Kaikai, G.; Tianzhu, X.; Qihou, Z.; Jianqiang, M.; Shangyi, G. Environmental effects in the mining process of Zimudang Gold Mine: 1. Comparison of pollution status. Geogeochemistry 1999, 1999, 1–8. [Google Scholar]
  13. Chen, M.; Li, F.; Tao, M.; Hu, L.; Shi, Y.; Liu, Y. Distribution and ecological risks of heavy metals in river sediments and overlying water in typical mining areas of China. Mar. Pollut. Bull. 2019, 146, 893–899. [Google Scholar] [CrossRef]
  14. Lin, C.Y.; Ali, B.N.M.; Tair, R.; Musta, B.; Abdullah, M.H.; Cleophas, F.; Isidore, F.; Nadzir, M.S.M.; Roselee, M.H.; Yusoff, I. Distance impacts toxic metals pollution in mining affected river sediments. Environ. Res. 2022, 214 Pt 1, 113757. [Google Scholar] [CrossRef]
  15. Jiang, F.; Ren, B.; Hursthouse, A.; Deng, R.; Wang, Z. Distribution, source identification, and ecological-health risks of potentially toxic elements (PTEs) in soil of thallium mine area (southwestern Guizhou, China). Environ. Sci. Pollut. Res. 2019, 26, 16556–16567. [Google Scholar] [CrossRef] [Green Version]
  16. Cai, S.; Zhou, S.; Cheng, J.; Wang, Q.; Dai, Y. Heavy metals speciation and distribution of microbial communities in sediments from the abandoned Mo-Ni polymetallic mines, southwest of China. Environ. Sci. Pollut. Res. 2022, 29, 35350–35364. [Google Scholar] [CrossRef]
  17. Liu, L.; Xu, X.; Han, J.; Zhu, J.-M.; Li, S.; Liang, L.; Wu, P.; Wu, Q.; Qiu, G. Heavy metal(loid)s in agricultural soils in the world’s largest barium-mining area: Pollution characteristics, source apportionment, and health risks using PMF model and Cd isotopes. Process Saf. Environ. Prot. 2022, 166, 669–681. [Google Scholar] [CrossRef]
  18. Goldscheider, N.; Drew, D. Methods in Karst Hydrogeology. In International Contributions to Hydrogeology; Crc Press: Boca Raton, FL, USA, 2007; Volume 26. [Google Scholar]
  19. Liu, Z.; Dreybrodt, W.; Liu, H. Atmospheric CO2 sink: Silicate weathering or carbonate weathering? Appl. Geochem. 2011, 26, S292–S294. [Google Scholar] [CrossRef]
  20. Jiang, Z.; Lian, Y.; Qin, X. Rocky desertification in Southwest China: Impacts, causes, and restoration. Earth-Sci. Rev. 2014, 132, 1–12. [Google Scholar] [CrossRef]
  21. Arehart, G.B. Characteristics and origin of sediment-hosted disseminated gold deposits: A review. Ore Geol. Rev. 1996, 11, 383–403. [Google Scholar] [CrossRef]
  22. Hofstra, A.H.; Cline, J.S. Characteristics and models for carlin-type gold deposits. Rev. Econ. Geol. 2000, 163–220. [Google Scholar] [CrossRef]
  23. Hu, Y.; Cheng, H. Application of Stochastic Models in Identification and Apportionment of Heavy Metal Pollution Sources in the Surface Soils of a Large-Scale Region. Environ. Sci. Technol. 2013, 47, 3752–3760. [Google Scholar] [CrossRef] [PubMed]
  24. Li, Y.; Duan, Z.; Liu, G.; Kalla, P.; Scheidt, D.; Cai, Y. Evaluation of the Possible Sources and Controlling Factors of Toxic Metals/Metalloids in the Florida Everglades and Their Potential Risk of Exposure. Environ. Sci. Technol. 2015, 49, 9714–9723. [Google Scholar] [CrossRef] [PubMed]
  25. Loska, K.; Wiechuła, D. Application of principal component analysis for the estimation of source of heavy metal contamination in surface sediments from the Rybnik Reservoir. Chemosphere 2003, 51, 723–733. [Google Scholar] [CrossRef] [PubMed]
  26. Chen, H.; Chen, R.; Teng, Y.; Wu, J. Contamination characteristics, ecological risk and source identification of trace metals in sediments of the Le’an River (China). Ecotoxicol. Environ. Saf. 2016, 125, 85–92. [Google Scholar] [CrossRef]
  27. Tang, W.; Shan, B.; Zhang, H.; Mao, Z. Heavy metal sources and associated risk in response to agricultural intensification in the estuarine sediments of Chaohu Lake Valley, East China. J. Hazard Mater. 2010, 176, 945–951. [Google Scholar] [CrossRef]
  28. Chandrasekaran, A.; Ravisankar, R.; Harikrishnan, N.; Satapathy, K.K.; Prasad, M.V.; Kanagasabapathy, K.V. Multivariate statistical analysis of heavy metal concentration in soils of Yelagiri Hills, Tamilnadu, India-speatroscopical approach. Spectrochim. Acta A Mol. Biomol. Spectrosc. 2015, 137, 589–600. [Google Scholar] [CrossRef]
  29. Zahra, A.; Hashmi, M.Z.; Malik, R.N.; Ahmed, Z. Enrichment and geo-accumulation of heavy metals and risk assessment of sediments of the Kurang Nallah—Feeding tributary of the Rawal Lake Reservoir, Pakistan. Sci. Total. Environ. 2014, 470–471, 925–933. [Google Scholar] [CrossRef]
  30. Li, Y.; Zhou, H.; Gao, B.; Xu, D. Improved enrichment factor model for correcting and predicting the evaluation of heavy metals in sediments. Sci. Total. Environ. 2021, 755 Pt 1, 142437. [Google Scholar] [CrossRef]
  31. He, L.-P.; Liu, D.; Lin, J.-J.; Yu, Z.-G.; Yang, X.-X.; Fu, C.; Liu, Z.-X.; Zhao, Q.-H. Total nitrogen and pH-controlled chemical speciation, bioavailability and ecological risk from Cd, Cr, Cu, Pb and Zn in the water level-fluctuating zone sediments of the Three Gorges Reservoir. Chem. Speciat. Bioavailab. 2017, 29, 89–96. [Google Scholar] [CrossRef] [Green Version]
  32. Li, X.; Bai, L.; Yue, Z.; Pang, B.; Wei, D. Mineralization processes involved in the formation of the Jinya Carlin-type Au deposit, northwestern Guangxi, China: Evidence from in situ trace element and S isotope geochemistry of Au-bearing zoned pyrite. Ore Geol. Rev. 2021, 138, 104376. [Google Scholar] [CrossRef]
  33. China, Environmental Protection Administration. Environmental Monitoring Station. Background Values of Soil Elements in China; Environmental Science Press: Beijing, China, 1990. [Google Scholar]
  34. Paatero, P.; Tapper, U. Positive matrix factorization: A non-negative factor model with optimal utilization of error estimates of data values. Environmetrics 1994, 5, 111–126. [Google Scholar] [CrossRef]
  35. Muller, G. Index of Geoaccumulation in Sediments of the Rhine River. GeoJournal 1969, 2, 109–118. [Google Scholar]
  36. Hakanson, L. An ecological risk index for aquatic pollution control: A sedimentological approach. Water Res. 1980, 14, 975–1001. [Google Scholar] [CrossRef]
  37. Pereira, W.; RTeixeira, A.; Souza, E.S.; Moraes, A.L.F.; Campos, W.E.O.; Amarante, C.B.D.; Martins, G.C.; Fernandes, A.R. Chemical fractionation and bioaccessibility of potentially toxic elements in area of artisanal gold mining in the Amazon. J. Environ. Manag. 2020, 267, 110644. [Google Scholar] [CrossRef]
  38. Chen, M.H.; Yu, X.Z.; Feng, Y.X. Tracing the pollution and human risks of potentially toxic elements in agricultural area nearby the cyanide baths from an active private gold mine in Hainan Province, China. Environ. Geochem. Health 2021, 44, 3279–3296. [Google Scholar] [CrossRef]
  39. Wongsasuluk, P.; Tun, A.Z.; Chotpantarat, S.; Siriwong, W. Related health risk assessment of exposure to arsenic and some heavy metals in gold mines in Banmauk Township, Myanmar. Sci. Rep. 2021, 11, 22843. [Google Scholar] [CrossRef]
  40. Gao, Z. Evaluation of heavy metal pollution and its ecological risk in one river reach of a gold mine in Inner Mongolia, Northern China. Int. Biodeterior. Biodegrad. 2018, 128, 94–99. [Google Scholar] [CrossRef]
  41. Kinimo, K.C.; Yao, K.M.; Marcotte, S.; Kouassi, N.L.B.; Trokourey, A. Distribution trends and ecological risks of arsenic and trace metals in wetland sediments around gold mining activities in central-southern and southeastern Côte d’Ivoire. J. Geochem. Explor. 2018, 190, 265–280. [Google Scholar] [CrossRef]
  42. Adewumi, A.; Laniyan, T. Contamination, sources and risk assessments of metals in media from Anka artisanal gold mining area, Northwest Nigeria. Sci. Total Environ. 2020, 718, 137235. [Google Scholar] [CrossRef]
  43. Delplace, G.; Viers, J.; Schreck, E.; Oliva, P.; Behra, P. Pedo-geochemical background and sediment contamination of metal(loid)s in the old mining-district of Salsigne (Orbiel valley, France). Chemosphere 2021, 287 Pt 2, 132111. [Google Scholar] [CrossRef] [PubMed]
  44. Kerrich, R.; Goldfarb, R.; Groves, D.; Garwin, S.; Jia, Y. The characteristics, origins, and geodynamic settings of supergiant gold metallogenic provinces. Sci. China Ser. D Earth Sci. 2000, 43, 1–68. [Google Scholar] [CrossRef]
  45. Lead, J.; Wilkinson, K. Environmental colloids: Current knowledge and future developments. Environ. Colloids Behav. Struct. Charact. 2006, 1–15. [Google Scholar]
  46. Kabata-Pendias, H.A.; Mukherjee, A.B. Trace Elements from Soil to Human; Springer: Berlin/Heidelberg, Germany, 2007; pp. 193–220. [Google Scholar]
  47. Miao, X.; Song, M.; Xu, G.; Hao, Y.; Zhang, H. The Accumulation and Transformation of Heavy Metals in Sediments of Liujiang River Basin in Southern China and Their Threatening on Water Security. Int. J. Environ. Res. Public Health 2002, 19, 1619. [Google Scholar] [CrossRef] [PubMed]
  48. Kong, X.; Liu, T.; Yu, Z.; Chen, Z.; Lei, D.; Wang, Z.; Zhang, H.; Li, Q.; Zhang, S. Heavy Metal Bioaccumulation in Rice from a High Geological Background Area in Guizhou Province, China. Int. J. Environ. Res. Public Health 2018, 15, 2281. [Google Scholar] [CrossRef] [Green Version]
  49. Gao, Y.; Li, F.; Mao, L.; Gu, B.; Peng, C.; Yang, Q.; Lu, L.; Chen, X.; Zhang, D.; Tao, H. Potential Loss of Toxic Elements from Slope Arable Soil Erosion into Watershed in Southwest China: Effect of Spatial Distribution and Land-Uses. Minerals 2021, 11, 1422. [Google Scholar] [CrossRef]
  50. Mo, Z.; Liu, Q.; Xie, W.; Ashraf, U.; Abrar, M.; Pan, S.; Duan, M.; Tian, H.; Wang, S.; Tang, X. Ultrasonic seed treatment and Cu application modulate photosynthesis, grain quality, and Cu concentrations in aromatic rice. Photosynthetica 2020, 58, 682–691. [Google Scholar] [CrossRef]
  51. Yuan, W.-L.; Xu, B.; Ran, G.-C.; Chen, H.-P.; Zhao, P.-Y.; Huang, Q.-L. Application of imidacloprid controlled-release granules to enhance the utilization rate and control wheat aphid on winter wheat. J. Integr. Agric. 2020, 19, 3045–3053. [Google Scholar] [CrossRef]
  52. Oliveira, L.M.; Araújo, M.U.P.; Silva, B.N.; Chaves, J.A.A.; Pinto, L.F.C.C.; Silveira, P.R.; Ribeiro, D.M.; Rodrigues, F. Maize resistance to northern corn leaf blight is potentiated by nickel. Plant Pathol. 2021, 71, 262–278. [Google Scholar] [CrossRef]
  53. Saudy, H.S.; El-Metwally, I.M.; Shahin, M.G. Co–application effect of herbicides and micronutrients on weeds and nutrient uptake in flooded irrigated rice: Does it have a synergistic or an antagonistic effect? Crop Prot. 2021, 149, 105755. [Google Scholar] [CrossRef]
  54. Amrhein, C.; Mosher, P.A.; Strong, J.E. Colloid-Assisted Transport of Trace Metals in Roadside Soils Receiving Deicing Salts. Soil Sci. Soc. Am. J. 1993, 57, 1212–1217. [Google Scholar] [CrossRef]
  55. Bern, C.R.; Thompson, A.; Chadwick, O.A. Quantification of colloidal and aqueous element transfer in soils: The dual-phase mass balance model. Geochim. Et Cosmochim. Acta J. Geochem. Soc. Meteorit. Soc. 2015, 151, 1–18. [Google Scholar] [CrossRef] [Green Version]
  56. King, E.; Thompson, A.; Pett-Ridge, J. Underlying lithology controls trace metal mobilization during redox fluctuations. Sci. Total. Environ. 2019, 665, 1147–1157. [Google Scholar] [CrossRef]
  57. Ingri, J.; Widerlund, A.; Land, M.; Gustafsson, Ö.; Andersson, P.; Öhlander, B. Temporal variations in the fractionation of the rare earth elements in a boreal river; the role of colloidal particles. Chem. Geol. 2000, 166, 23–45. [Google Scholar] [CrossRef]
  58. Buffam, I.; Laudon, H.; Seibert, J.; Mörth, C.-M.; Bishop, K. Spatial heterogeneity of the spring flood acid pulse in a boreal stream network. Sci. Total Environ. 2008, 407, 708–722. [Google Scholar] [CrossRef]
  59. Nemati, K.; Abu Bakar, N.K.; Abas, M.R. Investigation of heavy metals mobility in shrimp aquaculture sludge—Comparison of two sequential extraction procedures. Microchem. J. 2009, 91, 227–231. [Google Scholar] [CrossRef]
  60. Palleiro, L.; Patinha, C.; Rodríguez-Blanco, M.L.; Taboada-Castro, M.M.; Taboada-Castro, M.T. Metal fractionation in topsoils and bed sediments in the Mero River rural basin: Bioavailability and relationship with soil and sediment properties. Catena 2016, 144, 34–44. [Google Scholar] [CrossRef]
  61. Lee, P.K.; Kang, M.J.; Yu, S.; Ko, K.S.; Ha, K.; Shin, S.C.; Park, J.H. Enrichment and geochemical mobility of heavy metals in bottom sediment of the Hoedong reservoir, Korea and their source apportionment. Chemosphere 2017, 18, 74–85. [Google Scholar] [CrossRef]
  62. Eiche, E.; Kramar, U.; Berg, M.; Berner, Z.; Norra, S.; Neumann, T. Geochemical changes in individual sediment grains during sequential arsenic extractions. Water Res. 2010, 44, 5545–5555. [Google Scholar] [CrossRef]
  63. Hanebuth, T.J.J.; Lee, K.M.; Isabel, M.; Susana, L.; Lobo, F.J.; Oberle, F.K.; Laura, A.; Alves, F.P.; Isabel, R.M. Hazard potential of widespread but hidden historic offshore heavy metal (Pb, Zn) contamination (Gulf of Cadiz, Spain). Sci. Total Environ. 2018, 637–638, 561–576. [Google Scholar] [CrossRef]
  64. Ayiwouo, M.N.; Mambou, L.L.N.; Kingni, S.T.; Ngounouno, I. Spatio-temporal variation and assessment of trace metal contamination in sediments along the Lom River in the gold mining site of Gankombol (Adamawa Cameroon). Environ. Earth Sci. 2022, 81, 379. [Google Scholar] [CrossRef]
  65. Budianta, W. Heavy metal pollution and mobility of sediment in Tajum River caused by artisanal gold mining in Banyumas, Central Java, Indonesia. Environ. Sci. Pollut. Res. Int. 2021, 28, 8585–8593. [Google Scholar] [CrossRef] [PubMed]
  66. Taiwo, A.M.; Awomeso, J.A. Assessment of trace metal concentration and health risk of artisanal gold mining activities in Ijeshaland, Osun State Nigeria—Part 1. J. Geochem. Explor. 2017, 177, 1–10. [Google Scholar] [CrossRef]
  67. May, T.W.; Wiedmeyer, R.H.; Gober, J.; Larson, S. Influence of mining-related activities on concentrations of metals in water and sediment from streams of the Black Hills, South Dakota. Arch. Environ. Contam. Toxicol. 2001, 40, 1–9. [Google Scholar]
  68. Alonso, D.L.; Pérez, R.; Okio, C.K.; Castillo, E. Assessment of mining activity on arsenic contamination in surface water and sediments in southwestern area of Santurbán paramo, Colombia. J. Environ. Manag. 2020, 264, 110478. [Google Scholar] [CrossRef]
  69. Santos, M.V.S.; da Silva Junior, J.B.; de Carvalho, C.E.V.; Vergilio, C.D.S.; Hadlich, G.M.; de Santana, C.O.; de Jesus, T.B. Geochemical evaluation of potentially toxic elements determined in surface sediment collected in an area under the influence of gold mining. Mar. Pollut. Bull. 2020, 158, 111384. [Google Scholar] [CrossRef]
  70. Pujiwati, A.; Nakamura, K.; Wang, J.; Kawabe, Y.; Watanabe, N.; Komai, T. Potentially toxic elements pose significant and long-term human health risks in river basin districts with abandoned gold mines. Environ. Geochem. Health 2022, 44, 4685–4702. [Google Scholar] [CrossRef]
Figure 1. Location, lithology and sampling points of the study area. Except for “Zimudang, Beijing, Guizhou Province, Southwest Guizhou Autonomous Prefecture”, the other place names in the figure represent villages.
Ijerph 20 01432 g001
Figure 2. Cumulative changes of As and HMs in the water flow direction of sediments.
Ijerph 20 01432 g002
Figure 3. Percentage of four chemical fractions of As and HMs in sediments based on the BCR method.
Ijerph 20 01432 g003
Figure 4. Contribution value, contribution rate and source percentage of As and HMs concentrations in sediments obtained by the PMF model.
Ijerph 20 01432 g004
Figure 5. The changing relationship between the percentage change of F1 form and the total amount of As, Sb, Zn and Cd in sediments.
Ijerph 20 01432 g005
Figure 6. Comparison of Igeo, Eir and RI of As and HMs in sediments of gold mine area and four karst rivers. (1) Igeo index: level 0, representing no pollution; Grade I, representing no to moderate pollution; Grade II, representing medium pollution; Grade III, representing moderate to relatively high pollution; Grade IV, representing relatively high pollution to high pollution; Grade V, representing high pollution to extreme pollution; Grade VI, representing extreme pollution. (2) Eir index: <40, slight risk; 40–80, medium risk; 80–160, relatively high risk; 160–320, high risk; ≥320, extremely high risk.RI index: <150, slight risk; 150–300, medium risk; 300–600, relatively high risk; 600–1200, high risk; ≥1200, extremely high risk.
Ijerph 20 01432 g006
Figure 7. Comparison between the sediments in this study and surface sediments around other gold deposits. Dashed line: represents the value with the largest gap higher than this study’s. Red bold value represents the value exceeding this study. /—Represents missing values in references. A—Orbiel valley (France) [43]. B—Zhaosu River catchment (China) [40]. C—Lom River (Adamawa Cameroon) [64]. D—Anka Gold Mine (Nigeria) [42]. E—Tajum River (Indonesia) [65]. F—Afema Gold Mine (Côte d’Ivoire). G—Agbaou Gold Mine (Côte d’Ivoire). H—Bonikro Gold Mine (Côte d’Ivoire) [41]. I—Gold mine (Gold city, Nigeria) [66]. J—the Black Hills (South Dakota) [67]. K—Santurbán paramo (Colombia) [68]. L—Itapicuru-Mirim River (Brazil) [69]. M—Gold mine (Kesennuma City, Japan) [70].
Ijerph 20 01432 g007
Disclaimer/Publisher’s Note: The statements, opinions and data contained in all publications are solely those of the individual author(s) and contributor(s) and not of MDPI and/or the editor(s). MDPI and/or the editor(s) disclaim responsibility for any injury to people or property resulting from any ideas, methods, instructions or products referred to in the content.

