Article

Efficacy of Three Numerical Presentation Formats on Lay People’s Comprehension and Risk Perception of Fact Boxes—A Randomized Controlled Pilot Study

1
Institute of Health and Nursing Science, Interdisciplinary Center for Health Sciences, Martin Luther University, Halle-Wittenberg, 06112 Halle (Saale), Germany
2
Institute of General Medicine, Interdisciplinary Center for Health Sciences, Martin Luther University, Halle-Wittenberg, 06112 Halle (Saale), Germany
3
Department of Nursing and Health Promotion, Faculty of Health Sciences, Oslo Metropolitan University, 0176 Oslo, Norway
4
Institute of Rehabilitation Medicine, Interdisciplinary Center for Health Sciences, Martin Luther University, Halle-Wittenberg, 06112 Halle (Saale), Germany
5
Institute of Medical Epidemiology, Biometrics and Informatics, Interdisciplinary Center for Health Sciences, Martin Luther University, Halle-Wittenberg, 06112 Halle (Saale), Germany
6
Institute of Medical Sociology, Interdisciplinary Center for Health Sciences, Martin Luther University, Halle-Wittenberg, 06112 Halle (Saale), Germany
7
Institute for History and Ethics of Medicine, Interdisciplinary Center for Health Sciences, Martin Luther University, Halle-Wittenberg, 06112 Halle (Saale), Germany
*
Author to whom correspondence should be addressed.
Int. J. Environ. Res. Public Health 2023, 20(3), 2165; https://doi.org/10.3390/ijerph20032165
Submission received: 30 November 2022 / Revised: 15 January 2023 / Accepted: 18 January 2023 / Published: 25 January 2023
(This article belongs to the Special Issue Mass Media and Health Communication)

Abstract

:
(1) Background: Fact boxes present the benefits and harms of medical interventions in the form of tables. Some studies suggest that people with a lower level of education could profit more from graphic presentations. The objective of the study was to compare three different formats in fact boxes with regard to verbatim and gist knowledge in general and according to the educational background. (2) Methods: In May 2020, recruitment started for this randomized controlled trial. Participants were given one out of three presentation formats: natural frequencies, percentages, and graphic. We used Limesurvey® to assess comprehension/risk perception as the primary outcome. The Kruskal–Wallis test and the Mann–Whitney U test were used in addition to descriptive analyses. (3) Results: A total of 227 people took part in the study. Results of the groups were nearly identical in relation to the primary outcome verbatim knowledge, likewise in gist knowledge. However, participants with lower educational qualifications differed from participants with higher educational qualifications in terms of verbatim knowledge in the group percentages. (4) Conclusions: The results indicate that all three forms of presentation are suitable for conveying the content. Further research should take the individual preferences regarding the format into account.

1. Introduction

In the past, the lack of evidence-based health information has been reported repeatedly [1,2]. However, members of the public have the right to be given evidence-based information [3] as a prerequisite for making informed choices about health-relevant issues. Fact boxes provide evidence-based health information and were also developed to present the benefits and harms of pharmaceutical products in an undistorted and comprehensible way. For this purpose, they are displayed as tables showing the benefits and harms, with or without additional text [4]. In Germany, the Harding Centre for Risk Literacy developed fact boxes on a wide range of health-related topics. They publish fact boxes indicating natural frequencies. Sometimes, the information is supplemented by pictograms [5]. The fact boxes are freely accessible on the internet. Fact boxes can support the patients and doctors in the process of shared decision making [4].
The authors of the guideline evidence-based health information conducted an evidence synthesis to present the effects of the fact boxes in comparison with other formats. The guideline could only include two RCTs that showed a positive effect of the fact boxes regarding the outcomes risk perception and knowledge, and comprehensibility and readability. As only two small studies were included, the guideline did not give a clear recommendation [4,6,7].
For this study, we updated the systematic literature search conducted for the guideline and found two more studies. Aiken et al. reported that readers prefer fact boxes to other formats, and that the recall of the risks of a medication improved in comparison to other formats [8]. Brick et al. showed that, in terms of knowledge and comprehension, the content of a fact box was better understood after six weeks compared to a text format [9].
However, there are differences in the way the tables are presented and in the accompanying texts. Data on the frequencies of benefits and harms are shown numerically (natural frequencies or percentages) or graphically in fact boxes [6,7,10,11]. The benefit of using graphics instead of numerical frequency information could not be shown in the evidence synthesis of the guideline evidence-based health information [4], but there are indications that groups with a low level of education could profit from the use of graphical presentations [4,12]. Other studies have, however, not been able to confirm these findings [4,13,14,15,16]. In a recent study, McDowell et al. showed that, regarding the outcome knowledge and understanding, there is no difference between the presentation in natural frequencies compared to a graphical presentation [17]. Due to the lack of evidence, it also remains questionable whether presentation as a percentage is equivalent in terms of knowledge or understanding compared to presentation as natural frequencies [4]. A preliminary study has shown that the natural frequency presentation was barely understood, and that the percentage presentation was preferred [18]. Users with a low level of education might benefit from the presentation of a bar chart [4,12].
To date, fact boxes have barely been evaluated [19].
The objective of the current pilot study was to compare the three formats natural frequencies, percentages, and bar graphs in fact boxes with regard to comprehension in the general population and in groups with varying educational background. We used antibiotics for acute bronchitis as an example. In addition, this study aimed to determine the feasibility and acceptability of the knowledge test as well as the necessary size of the sample in the planned study and the study procedures for the comprehensive randomized controlled trial (RCT).

2. Materials and Methods

The study is reported according to the Consolidated Standards of Reporting Trials (CONSORT) [20].

2.1. Design

This randomized controlled 3-arm pilot study was conducted as part of the “HeReCa-Online Panel” (Health Related Beliefs and Health Care Experiences in Germany), hosted by the Interdisciplinary Center for Health Sciences of the Martin Luther University Halle-Wittenberg.

2.2. Setting and Study Participants

This study included only people who were at least 18 years old at the time of the pilot study. A subsample was recruited among residents of Berlin, the capital city of Germany.

2.3. Recruitment

The current study recruited participants from the HeReCa panel (Health Related Beliefs and Health Care Experiences in Germany). This panel was initiated in 2019 by the Interdisciplinary Center for Health Sciences of the Martin Luther University Halle-Wittenberg and has already been used in a couple of studies related to health-related beliefs and health-care experiences.
Our study addressed the entire group of 241 new HeReCa panel members gained during the recent recruitment wave in Berlin. For this group, our study was the first study for these new panel members.

2.4. Randomization and Blinding

We used computer-generated random numbers for simple randomization of subjects. This feature was implemented in the Limesurvey® platform, therefore ensuring allocation concealment. The participants were randomly allocated to one of the three groups and were not aware to which group they belonged.

2.5. Intervention and Control Intervention

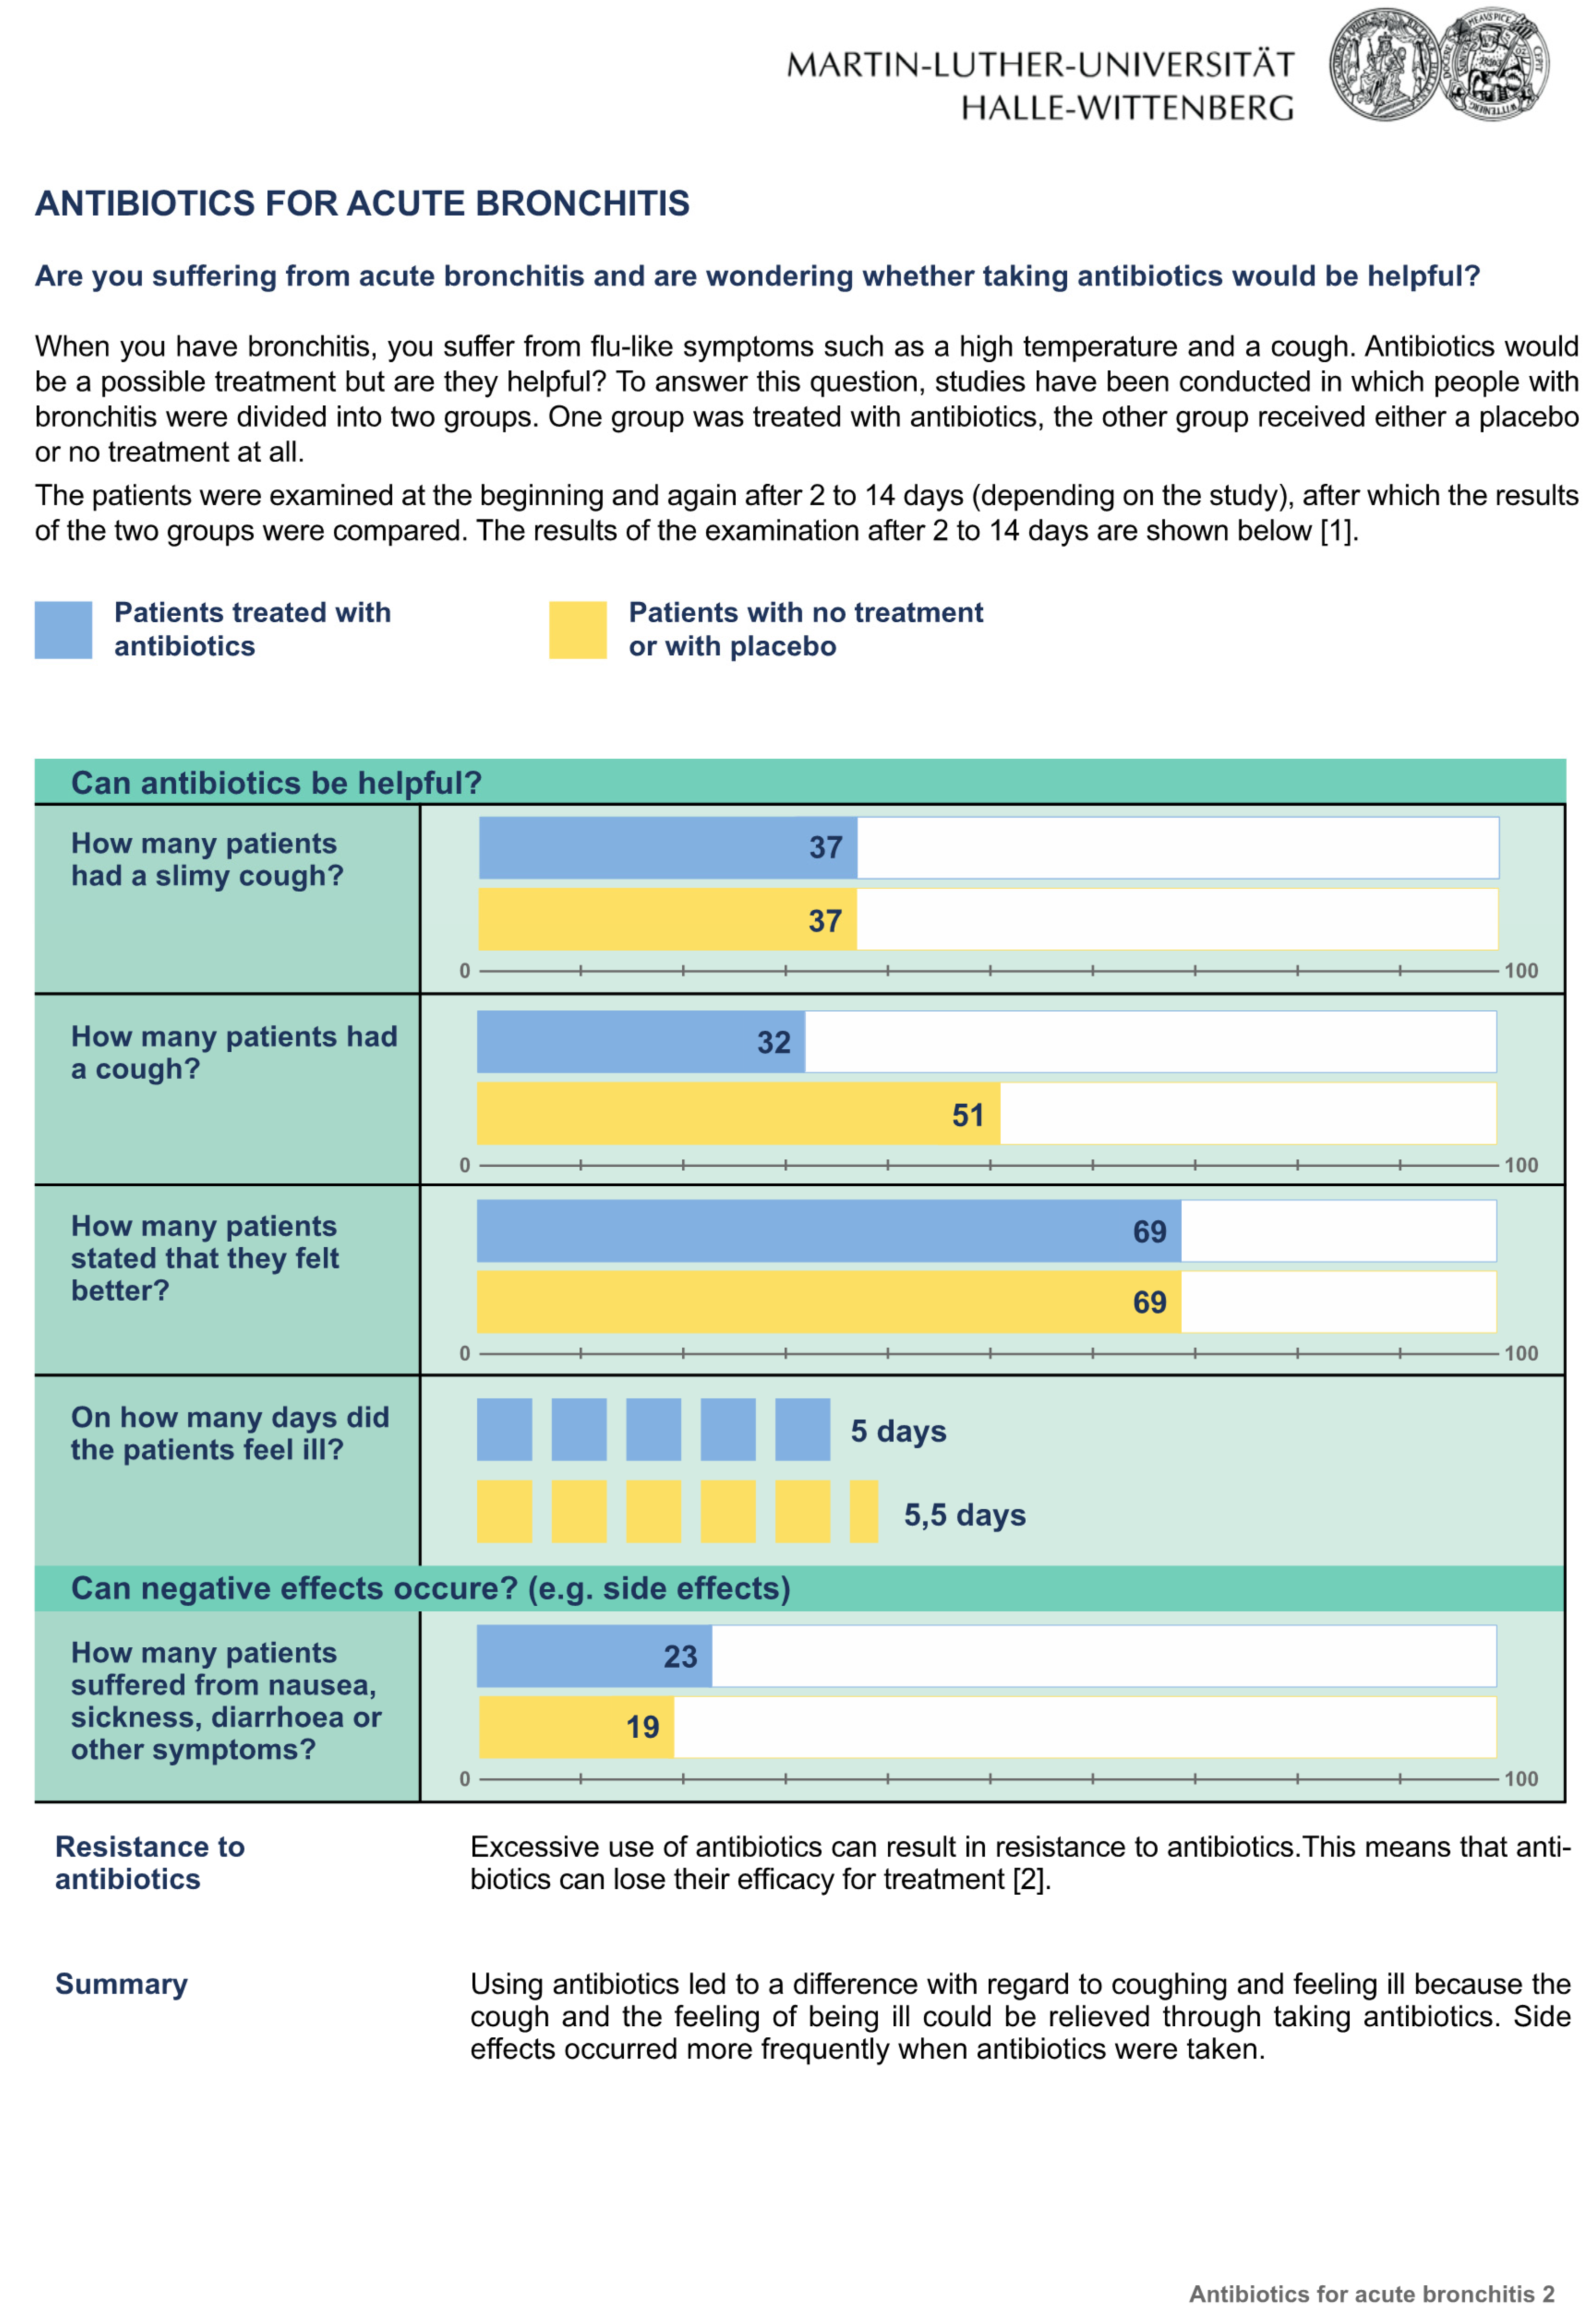
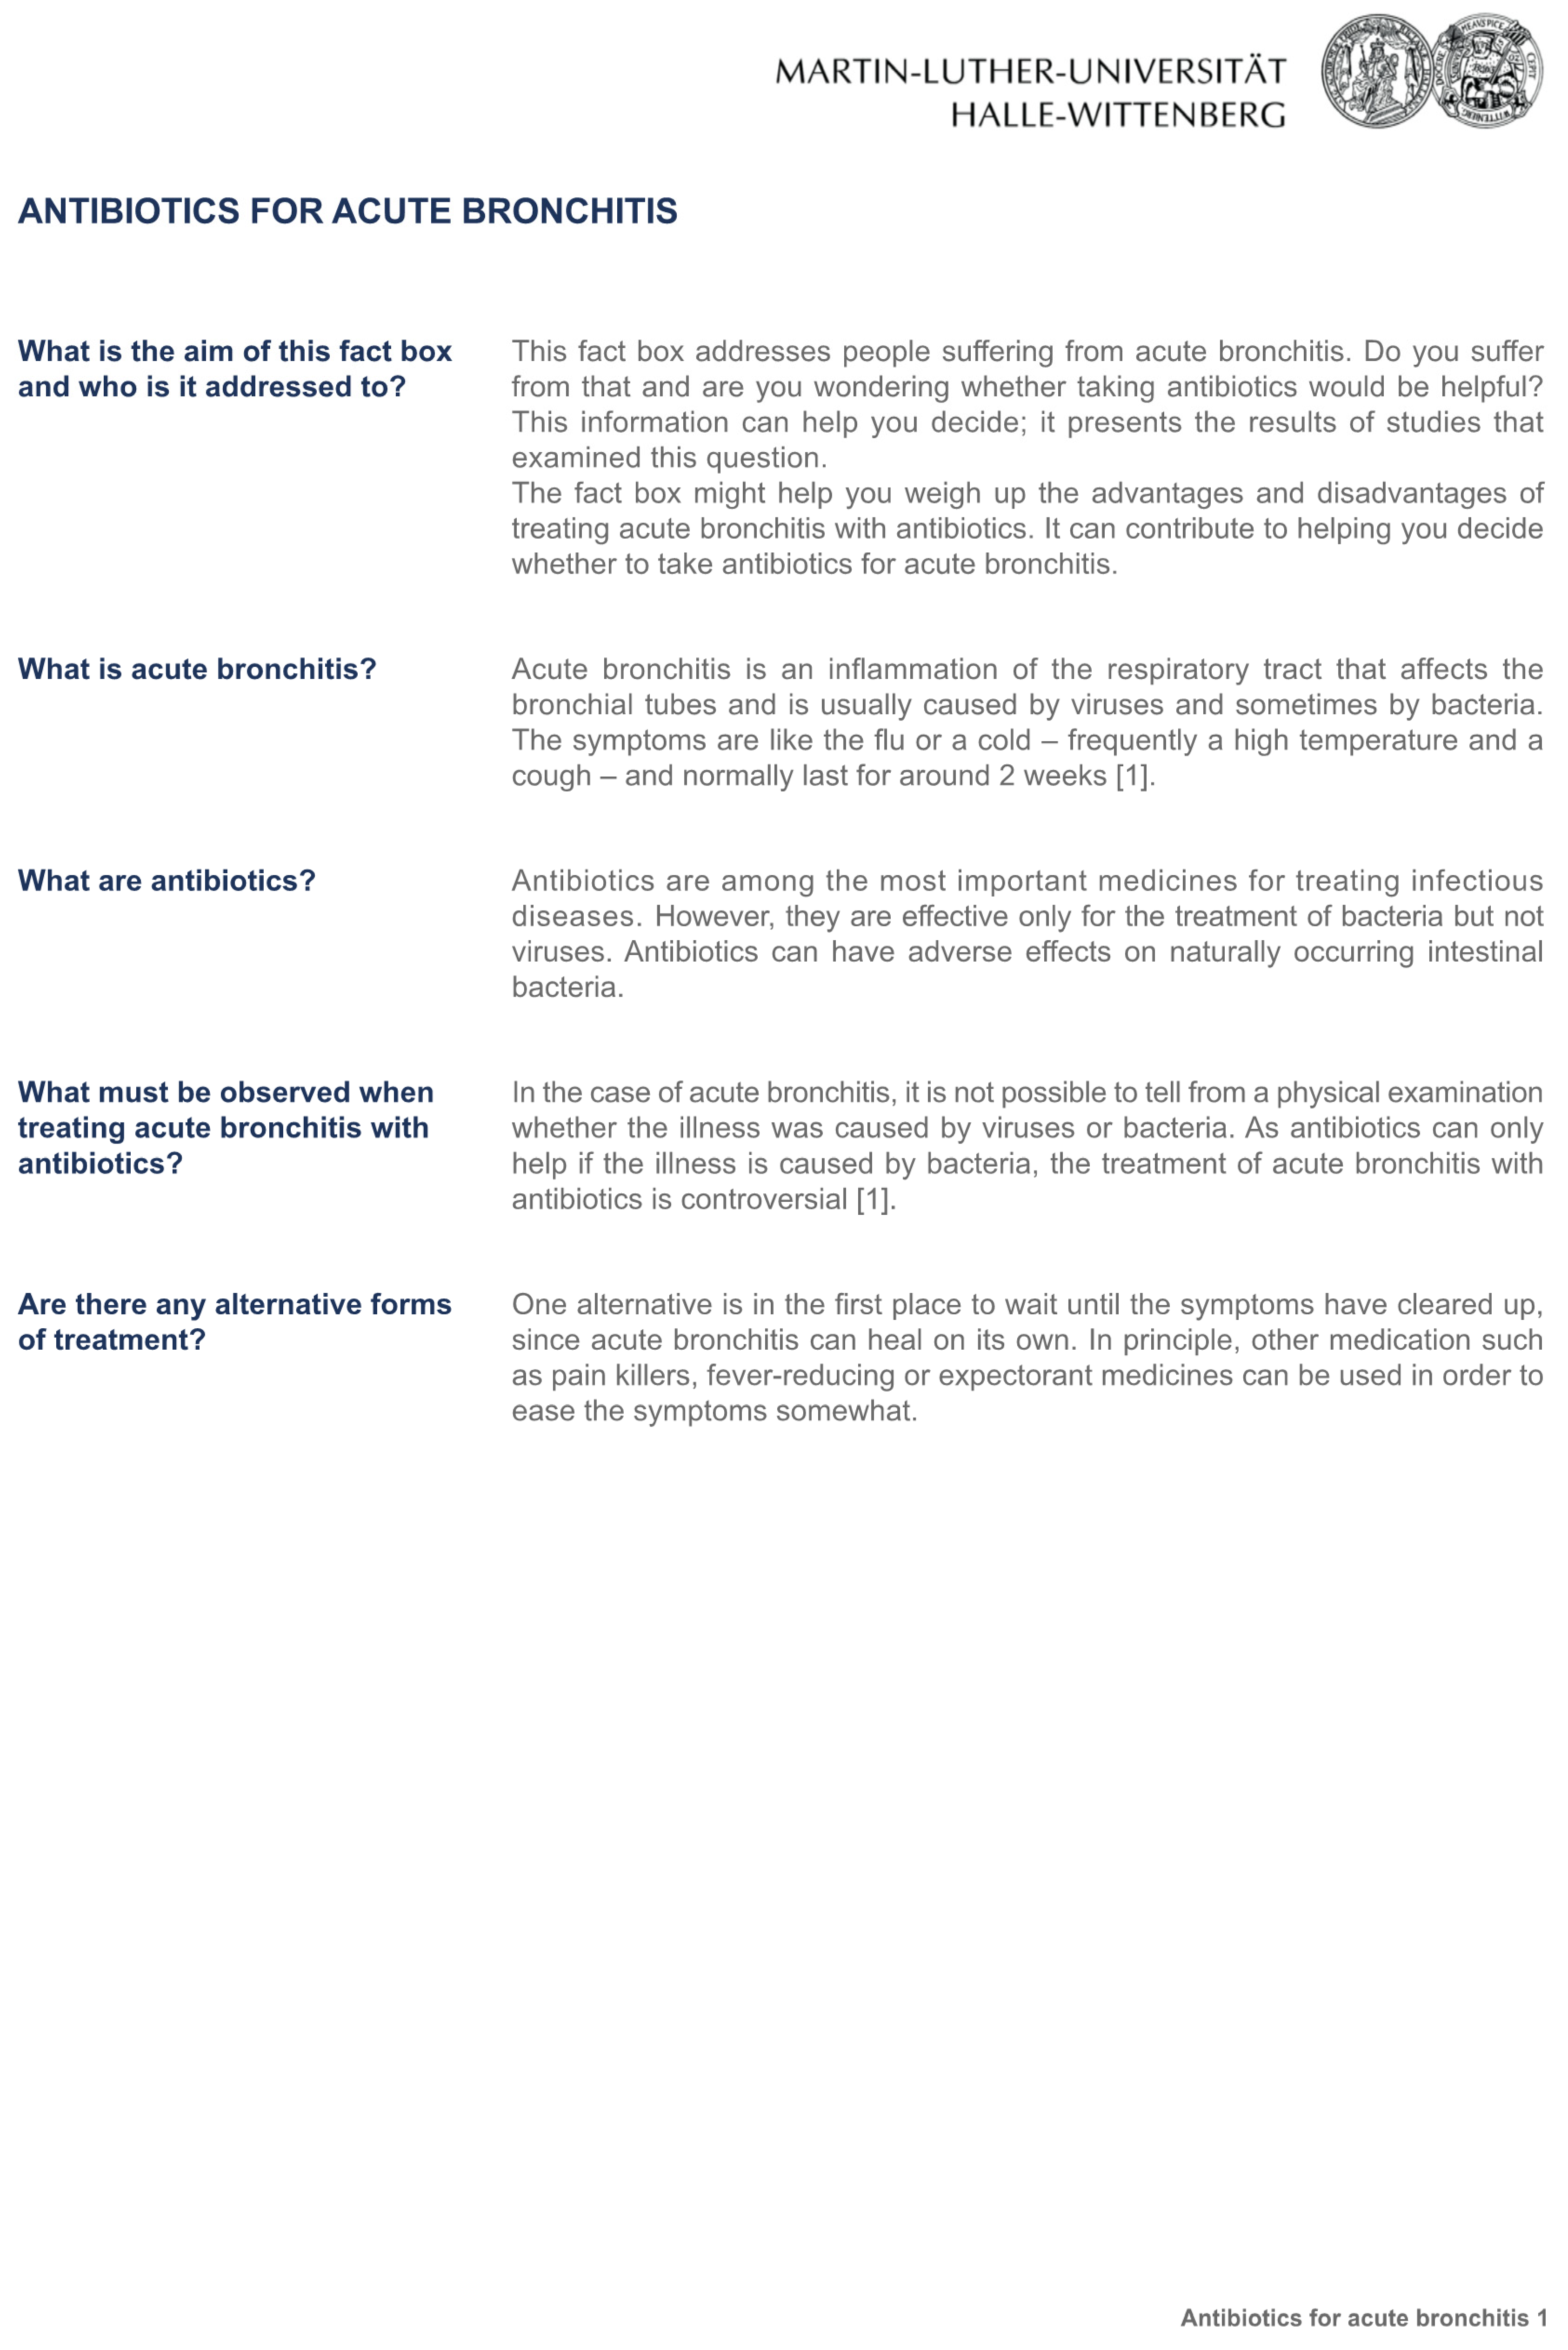
The three fact boxes on the subject “Antibiotics for acute bronchitis” contained information concerning the benefits and harms of antibiotic treatment compared to treatment with a placebo or no treatment at all. The sources of the information were also provided. Participants randomly received one of the three formats: Figure 1: the fact box that presented treatment effects as natural frequencies; Figure 2: the fact box using percentages, and Figure 3: the fact box using a graphical presentation [21]. Bar charts were used for the graphical presentation of the frequencies, as recommended by Lühnen et al. [4]. Each group was given the same additional information as in the fact box (Figure 4).

2.6. Outcomes and Moderating Variables

Within the scope of this study, the outcomes “knowledge (verbatim and gist)”, “readability/comprehensibility”, “acceptance”, and “relevance”, which are established in the field of health communication, were collected using a questionnaire (see Table A1). The development of the questions on the primary outcome questions, as well as the questions on the secondary outcomes, was guided by the literature [6,7]. The knowledge questions and answers had been adapted from previous studies that surveyed knowledge for different topics. All these previous questionnaires were based on the General Medical Council’s ethical guidelines [22,23,24]. The questions to survey readability/comprehensibility, acceptance, and relevance were all taken from studies that were included in the guideline evidence-based health information [25]. The complete questionnaire was pre-tested in a previous focus group study through an iterative process, using the think-aloud method. The process was carried out until all questions were understandable [18].
  • Verbatim and gist knowledge
Verbatim knowledge was assessed using nine items and referred to the ability of the respondents to express correctly the absolute frequencies of the benefits and harms of antibiotic treatment, placebo treatment, or of no treatment at all. Each answer was coded as correct (1) or incorrect (0) and a sum score was calculated (see Table A1).
Furthermore, gist knowledge was surveyed to determine the extent to which respondents understood the importance of the differences between the benefits and harms of antibiotic treatment, placebo, or no treatment at all. Five multiple-choice questions were used here; the correct answers were coded with 1, the incorrect answers were coded with 0, and a sum score was calculated (see Table A1).
  • Readability/Comprehensibility
The readability and comprehensibility referred to how the recipients assessed the plausibility of the contents, texts, and tables [26]. The evaluation comprised four questions, using a four-point Likert scale (e.g., 3 = very understandable, 2 = understandable, 1 = incomprehensible, and 0 = absolutely incomprehensible) as an example (see Table A1).
  • Acceptance
Acceptance was defined as the attitude of the participants to the fact box. The evaluation comprised questions about the attractiveness of the design, the trustworthiness of the information, and the recommendation of the fact box using a four-stage interval scale (see Table A1).
  • Relevance
Relevance was defined as the assessment of whether the information was considered helpful. This outcome was surveyed by a single question, using a four-stage interval scale (3 = extremely helpful, 2 = helpful, 1 = hardly helpful, and 0 = not at all helpful) (see Table A1).
The questionnaire had been piloted in a previous focus group study [18].
  • Moderating variables
Based on the literature, the level of education was chosen as a moderating variable for the purpose of following sensitivity analysis. Participants with a lower secondary and a secondary school certificate were assigned to the group with a lower level of education. Participants with a higher school certificate or an academic degree were assigned to the group with a higher level of education.

2.7. Sample Size

A sample size calculation was not carried out for the pilot RCT [27].

2.8. Procedure of Data Collection

During enrolment into the study, the participants were asked to give written informed consent and to provide their email addresses so that they could be contacted for further surveys. In the next step, the participants were directed to the fact box and the corresponding questionnaire (implemented in Limesurvey®). Having read the fact box, the participants were asked to answer the questions about the outcomes under investigation. The fact box was accessible at all times while answering the questions. In addition, socio-demographic characteristics were collected.
The fact boxes survey was opened on 28 May 2020 and closed on 25 January 2021. No reminder letters were sent. No expense allowances were paid.

2.9. Data Analysis

The evaluation of the results comprised descriptive and inferential analyses. The statistical analyses for the primary outcome and the secondary outcomes were conducted using the Kruskal–Wallis test. The statistical analyses for knowledge according to educational level were conducted using the Mann–Whitney U test. The significance level for p-value was set at <0.05. The analyses were all performed as intention-to-treat. For the analyses, we used the software SPSS® Version 27.0.1.0. In addition, data were split into two groups: a group with lower-level education and a group with higher-level education.

3. Results

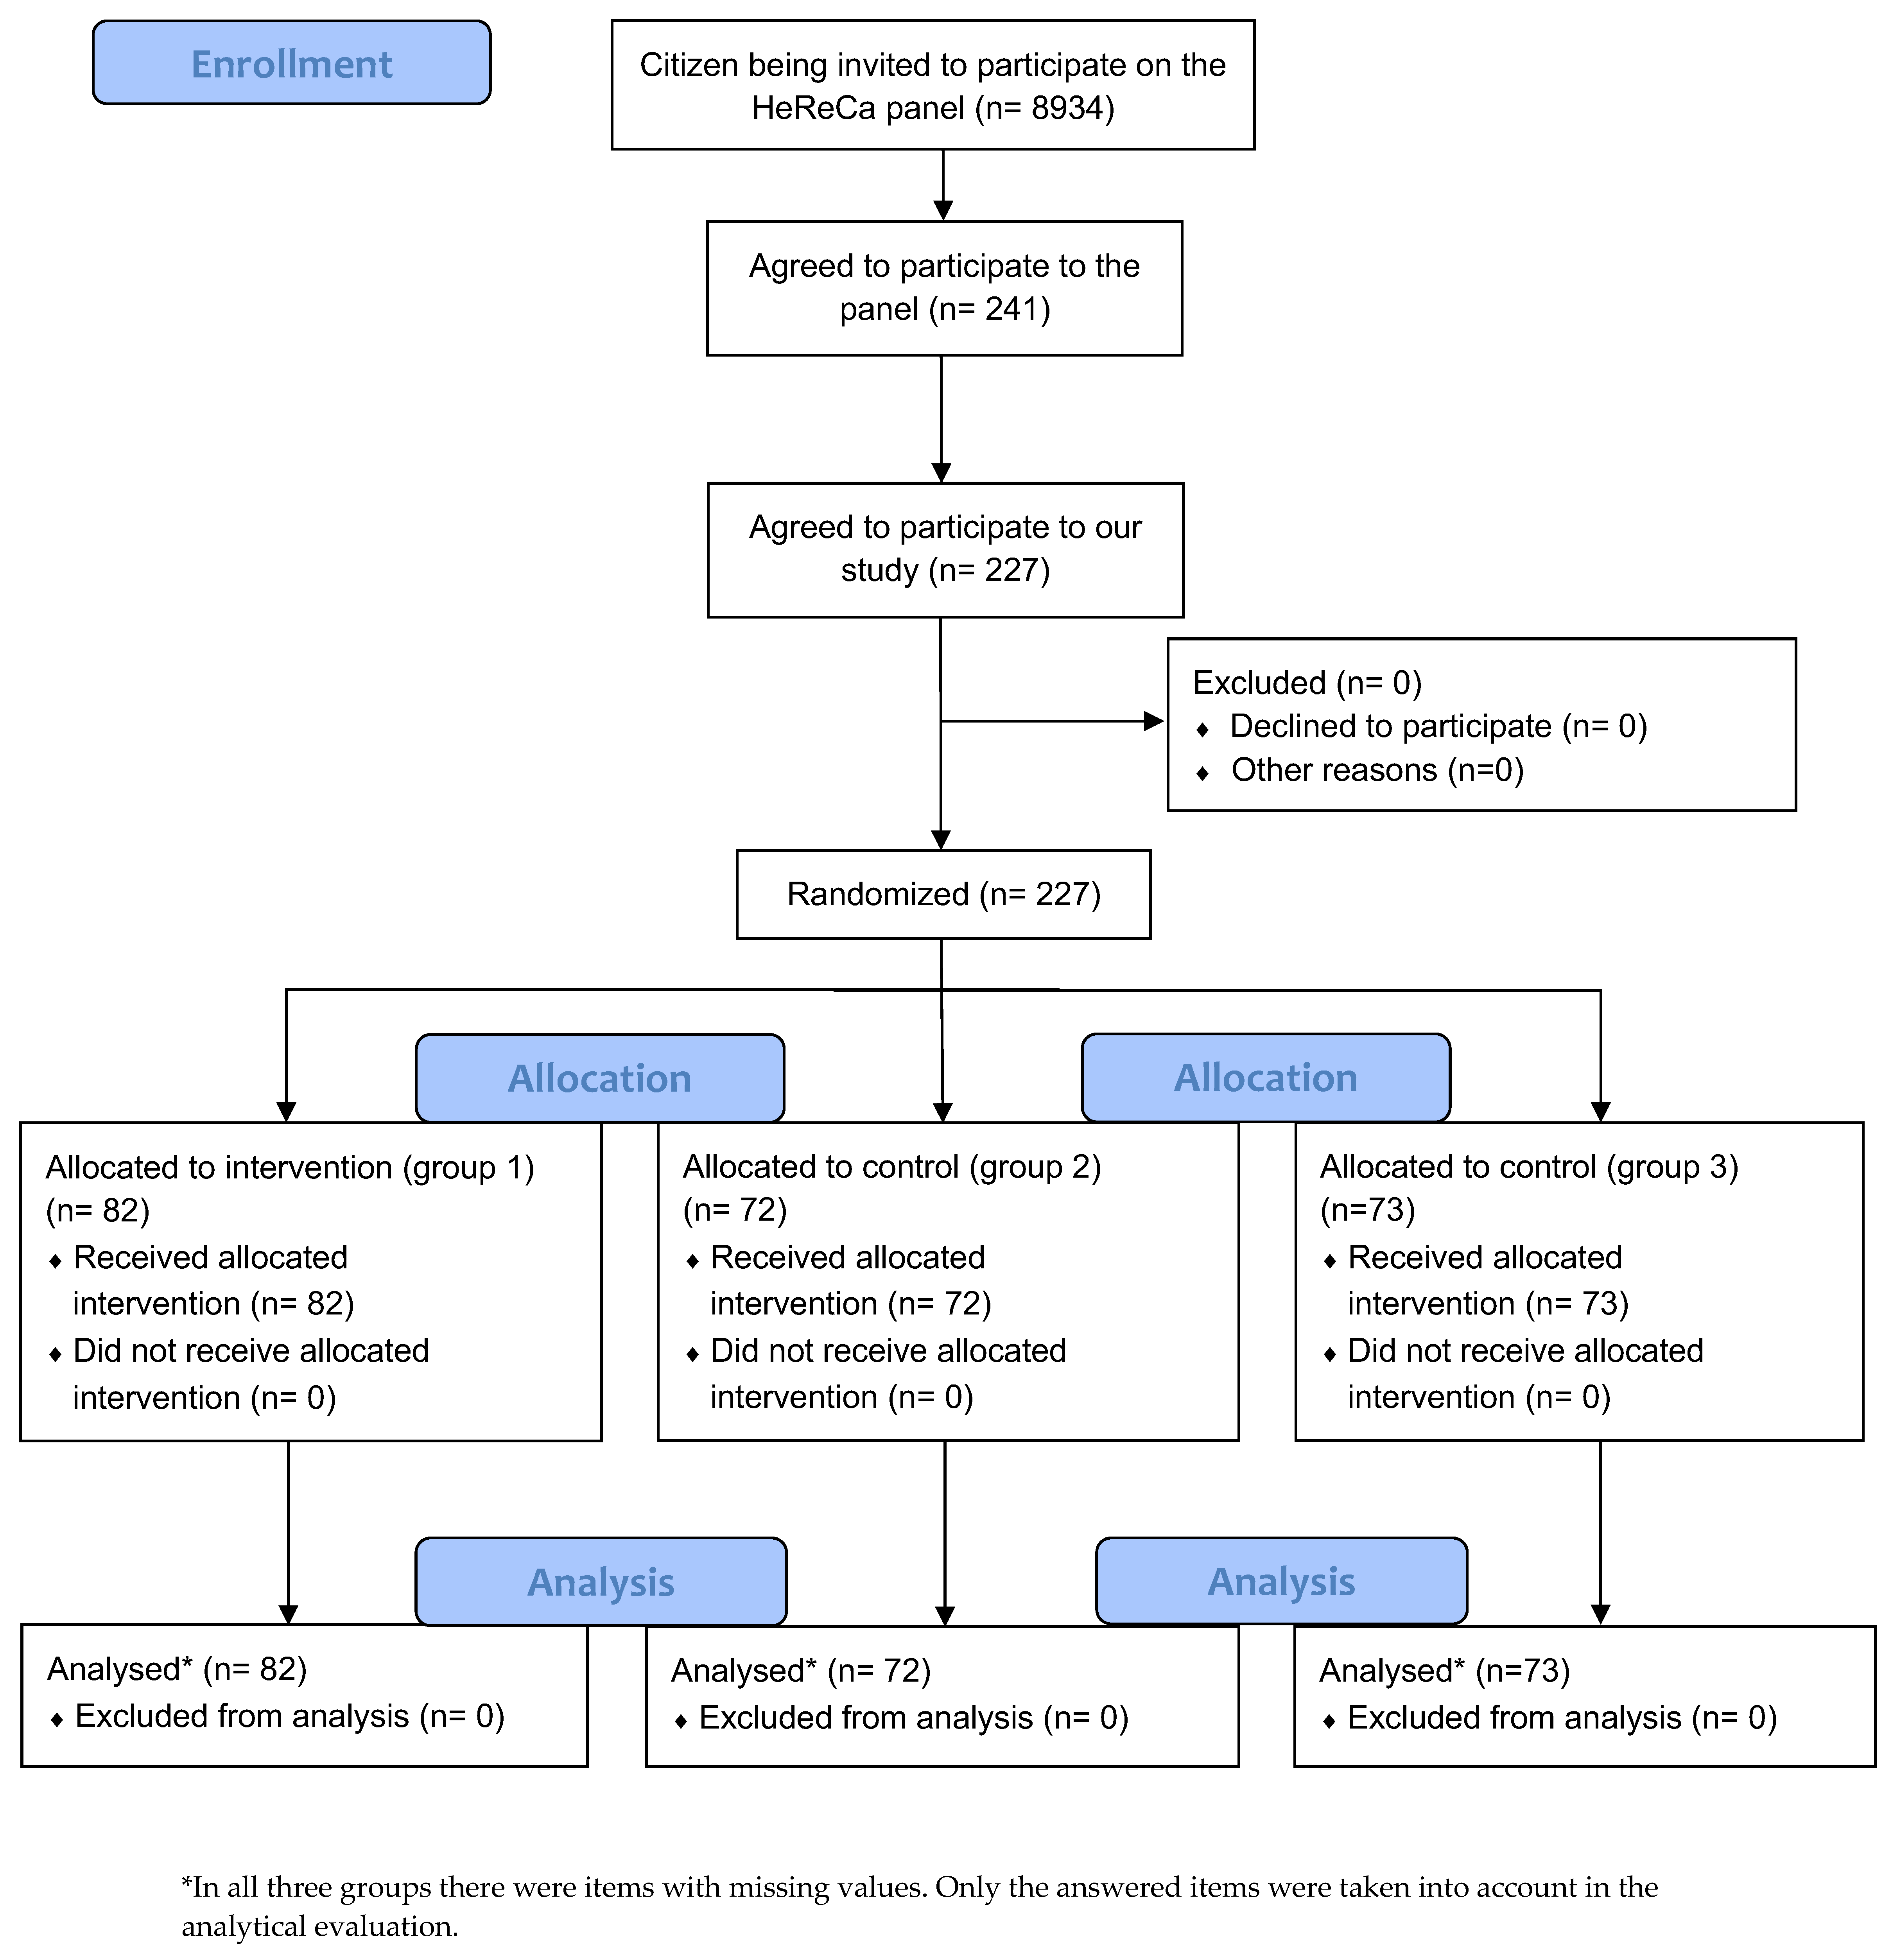
Out of the 8934 people invited, a total of 241 registered for the panel (2.7%) and 227 took part in the study (94.2%). More women than men participated in the study. A smaller number of people with a low level of education took part (secondary school or lower) than people with a high level of education (university admission and academic graduation) (Table 1).
All the participants were included in the evaluation (the details are shown in the CONSORT flow chart) (Figure 5).

3.1. Primary Outcome

Verbatim and Gist Knowledge

Regarding both verbatim knowledge and gist knowledge, the questions were answered correctly by the majority of the participants in each group. The primary outcomes were very similar across the groups (Table 2). With regard to verbatim knowledge, the percentage of missing answers in the groups was 18.3% (natural frequencies), 15.3% (percentages), and 17.8% (graphic chart). In relation to gist knowledge, the percentage of missing answers in the groups was 15.9% (natural frequencies), 12.5% (percentages), and 13.7% (chart).

3.2. Secondary Outcomes

3.2.1. Readability/Comprehensibility

The majority of the participants in all three groups found all the fact boxes to be easily readable and comprehensible (Table 3). No differences were found. However, there were many missing answers on readability (natural frequencies group: 20.7%, percentages group: 18.1%, and graphic chart group: 23.3%).

3.2.2. Acceptance

The acceptance for each of the fact boxes was high (Table 3) and the groups did not differ in their appraisal. With regard to acceptance, there were many missing answers (natural frequencies group: 18.3%, percentages group: 16.7% and graphic chart group: 23.3%).

3.2.3. Relevance

The majority of the participants found the information to be helpful (Table 3). This response did not differ between the study groups. Almost one fifth of the answers on relevance were missing (natural frequencies group: 20.7%, percentages group: 18.1%, and graphic chart group: 23.3%).

3.3. Knowledge by Educational Level

The natural frequencies format showed comparable results between the two educational levels. In contrast, participants with a lower level of education who worked on the formats percentages and graphic chart achieved significantly lower mean scores with regard to verbatim knowledge. There were no differences with respect to gist knowledge (Table 4).

4. Discussion

The content of the fact boxes was well understood by the majority of the participants in all the groups, and the participants’ attitudes to the fact boxes were positive. The information provided by the fact boxes was seen as positive by most of the participants.
McDowell et al. [17] reported comparable results with regard to comprehension, as did the recently published study by Danya et al. [28]. McDowell et al. also showed a general but small long-term effect for improvement over 6 months. Comparable to our results, the sample was also well educated [17]. Danya et al. compared the column charts and pictograms [28].
Compared with other formats, fact boxes can substantially improve knowledge and risk perception [6]. Tait et al. investigated whether people with a lower level of education profit from the graphical presentation of the frequencies [12]. Our results showed that participants who worked on the natural frequencies and the graphic format achieved comparable results regardless of their educational level. There were differences in terms of verbatim knowledge between the format percentages grouped by educational level. However, the differences were rather small and likely not clinically relevant. Comparable results in terms of graphic charts have already been reported in other studies in the past [4,13,14,15,16]. The recommendation that natural frequencies, rather than percentages, should be used in communicating health information [29] particularly refers to conditional probabilities, for example, to estimate the predictive values of diagnostic tests [30]. Conclusiveness of the results of the current study is limited in some respects. Firstly, the current study used the topic “Antibiotics for acute bronchitis” as an example to compare the three fact box formats [21]. It is unclear whether the results are generalizable to other medical topics or fact boxes using alternative graphical presentation formats instead of bar charts. Secondly, the results have been gained on an aggregated level, revealing the lack of advantage of one of the fact box formats presented in mean values over the total group. This approach, however, is not sensitive to preferences and advantages of formats on the level of subgroups; if existing, the latter are likely to disappear in the overall examination. More research is needed to better understand variables and processes allowing for the meaningful tailoring of risk information on the individual or group level. Research to gain this knowledge also needs to consider the role preferences for the choice of respective formats. In the current study, the users did not have any choice. Therefore, we do not know whether the participants had been assigned to a group where their own preferred format was the subject in question. Self-assignment to a risk communication format might lead to better and more divergent results [31]. The redevelopment of the PREDICT tool that has been developed to predict survival in breast cancer now allows users to choose between different formats [32]. However, systematic evaluation regarding the effects on knowledge and decision making is pending. Likewise, publishers of fact boxes should provide the target groups with varying formats of presentation of the frequency information in fact boxes.

Strengths and Limitations

The pilot study was conducted online which had the advantages of reaching the participants quickly and the answers being promptly available in a digital format. A further strength of the study can be seen in blinding, randomization, and intention-to-treat analysis since these criteria demonstrate a high quality of evidence [33]. Among those who registered for the panel, the participation in this study was very high.
In the study, only the example “Antibiotics for acute bronchitis” from the Martin Luther University fact box was used [20]. It is unclear whether the results would be similar if alternative graphical presentations were used instead of bar charts.
All outcomes were obtained immediately after reading the fact boxes. It is not known whether knowledge would decrease in follow-up assessments.
Participants with a low level of education were underrepresented in this study. The breaking point between the two education groups had been defined arbitrarily. Shifting the breaking point could produce different results. In addition, participants were assigned using randomization to presentation formats that were possibly not matching their individual preferences. This could have impacted their performances and might have biased the results.
A limitation of the online survey was the fact that people without an internet connection and/or email address and/or without an internet-enabled device (terminal) were not able to take part in the study. It must also be assumed that older citizens could only be minimally represented by an online survey, as only half of those over 70 use the internet [34].

5. Conclusions

The application of fact boxes around the time when information is needed is beneficial but the knowledge of patients receiving information in the three formats did not seem to differ. However, level of education might make a difference. In addition, further research should keep the individual preferences in mind and offer different formats for choice.

Author Contributions

P.A. wrote the first draft of the paper. P.A., T.F., W.M., G.M., R.M., M.R., J.S. and A.S. developed the concept. R.M. obtained the datasets. P.A. and J.K. generated and analyzed the datasets. J.K. reviewed the analyzed data. P.A., J.K. and A.S. reviewed and edited the manuscript. A.S. supervised the project. All authors have read and agreed to the published version of the manuscript.

Funding

We acknowledge the financial support of the Open Access Publication Fund of the Martin-Luther-University Halle-Wittenberg.

Institutional Review Board Statement

The HeReCa study and the amendment for this fact box study were conducted according to the guidelines of the Declaration of Helsinki and approved by the ethics committee of the Martin Luther University Halle-Wittenberg on 05/04/2020 (Reference 2019–044). Written informed consent to participate in the panel was available online in pdf format and was given by clicking on the option “yes”.

Informed Consent Statement

Informed consent was obtained from all subjects involved in the study.

Data Availability Statement

Conflicts of Interest

The authors declare no conflict of interest.

Appendix A

Table A1. Questionnaire.
Verbatim Knowlege
  • If 100 people take antibiotics: how many of them get a slimy cough?
37 *
  • Compared to the people taking antibiotics, how many more people get a slimy cough if they are given no treatment or are given a placebo?
0 *
  • If 100 people are given no treatment or are given a placebo, how many of them get a slimy cough?
37 *
  • Compared to the people getting antibiotics, how many less people experience nausea, vomiting or diarrhoea if they are not given treatment or are given a placebo?
4 *
  • Please complete the following sentence: Compared to people who are not getting treatment, the people who are taking antibiotics feel better after [...] days.
5 *
  • Compared to the people getting antibiotics, how many more people get a cough when they are not given treatment or are given a placebo?
19 *
  • If 100 people are given antibiotics for acute bronchitis, how many of them feel better compared to those who do not get treatment or are given a placebo?
0 *
  • If 100 people are given antibiotics, how many of them experience i.a. nausea, vomiting or diarrhoea?
23 *
  • If 100 people do not get treatment or are given a placebo, how many of them experience i.a. nausea, vomiting or diarrhoea?
19 *
Gist knowledge
  • Do less people receiving antibiotics get a slimy cough than people who are not given antibiotics?
No, there is no difference (antibiotics/placebo) *Yes, more people receiving antibiotics get a slimy coughNo, less people receiving antibiotics get a slimy cough
  • When taking antibiotics, various side effects can occur. Which of the following side effects can occur when taking antibiotics?
Muscle painDiarrhoea *Hair lossTiredness
  • Which statement is correct? Negative effects occur as a result of taking antibiotics compared to treatment without antibiotics [...].
AlwaysFrequently *Less frequentlyNever
  • What can excessive use of antibiotics lead to?
ObesityAddiction to antibioticsHigh blood pressureResistance to antibiotics *
  • Studies have been conducted to see if antibiotics can shorten the length of illness. Which answer is correct? Antibiotics shorten the length of illness by […].
0 day1/2 days *4 days7 days
Readability/Comprehensibility
  • In your opinion, how easy is it to understand the information?
Very easyEasyHardly easy at allNot at all easy
  • I find the explanation of the technical terms to be …
Very easily understoodEasily understoodHardly comprehensibleCompletely incomprehensible
  • I find the length of the sentences in the health information...
Very easy to readEasy to readLess easy to readDifficult to read
  • How do you feel about the general readability of the text?
Very easy to readEasy to readLess easy to readDifficult to read
Acceptance
  • I find the overall design of this health information to be…
Very attractiveAttractiveLess attractiveDisagreeable
  • How trustworthy do you find this information?
Very trustworthyTrustworthyLess trustworthyNot at all trustworthy
  • What is your opinion on the following statement? I would recommend this information to others.
I agree absolutelyI agreeI tend not to agreeI do not agree at all
Relevance
  • Imagine you had acute bronchitis. How helpful is the information for you?
Extremely helpfulHelpfulSomewhat helpfulNot at all helpful
* = correct answer.

References

  1. Kerschner, B.; Wipplinger, J.; Klerings, I.; Gartlehner, G. How evidence-based are print-and online mass media in Austria? A quantitative analysis. Z. Evidenz Fortbild. Qual. Gesundh. 2015, 109, 341–349. [Google Scholar] [CrossRef] [PubMed]
  2. Mühlhauser, I.; Albrecht, M.; Steckelberg, A. Evidence-based health information and risk competence. GMS Ger. Med. Sci. 2015, 13. [Google Scholar] [CrossRef]
  3. Bundesgesetzblatt. Patients’ Rights Act; Bundesanzeiger: Cologne, Germany, 2013; Volume 9, pp. 277–282. [Google Scholar]
  4. Lühnen, J.; Albrecht, M.; Mühlhauser, I.; Steckelberg, A. Guideline Evidence-Based Health Information. Hamburg 2017. Available online: https://www.leitlinie-gesundheitsinformation.de/?lang=en (accessed on 15 August 2019).
  5. Hinneburg, J.; Wilhelm, C.; Ellermann, C. Methodenpapier für Die Entwicklung von Faktenboxen. Potsdam: Harding-Zentrum für Risikokompetenz. 2020. Available online: https://www.hardingcenter.de/sites/default/files/2021-06/Methodenpapier%20des%20Harding-Zentrums_DE_20210616_final_0.pdf (accessed on 23 December 2022).
  6. Schwartz, L.M.; Woloshin, S.; Welch, H.G. Using a Drug Facts Box to Communicate Drug Benefits and Harms. Ann. Intern. Med. 2009, 150, 516–527. [Google Scholar] [CrossRef] [PubMed] [Green Version]
  7. Schwartz, L.M.; Woloshin, S.; Welch, H.G. The drug facts box: Providing consumers with simple tabular data on drug benefit and harm. Med. Decis. Mak. 2007, 27, 655–662. [Google Scholar] [CrossRef]
  8. Aikin, K.J.; O’Donoghue, A.C.; Swasy, J.L.; Sullivan, H.W. Randomized Trial of Risk Information Formats in Direct-to-Consumer Prescription Drug Advertisements. Med. Decis. Mak. 2011, 31, E23–E33. [Google Scholar] [CrossRef]
  9. Brick, C.; McDowell, M.; Freeman, A.L.J. Risk communication in tables versus text: A registered report randomized trial on ‘fact boxes’. R. Soc. Open Sci. 2020, 7, 190876. [Google Scholar] [CrossRef] [Green Version]
  10. Harding-Zentrum für Risikokompetenz. Antibiotika bei Akuter Bronchitis. 2019. Available online: https://www.harding-center.mpg.de/de/faktenboxen/antibiotika/akute-bronchitis (accessed on 4 August 2019).
  11. ertelsmann Stiftung. Faktenbox Antibiotika bei akuter Bronchitis. Nutzen und Risiken im Überblick. 2019. Available online: https://www.weisseliste.de/export/sites/weisseliste/de/.content/pdf/service/Faktencheck_Antibiotika_Faktenbox_akute_Bronchitis.pdf (accessed on 28 August 2019).
  12. Tait, A.R.; Voepel-Lewis, T.; Zikmund-Fisher, B.; Fagerlin, A. The Effect of Format on Parents’ Understanding of the Risks and Benefits of Clinical Research: A Comparison between Text, Tables, and Graphics. J. Health Commun. 2010, 15, 487–501. [Google Scholar] [CrossRef] [Green Version]
  13. Ruiz, J.G.; Andrade, A.D.; Garcia-Retamero, R.; Anam, R.; Rodriguez, R.; Sharit, J. Communicating global cardiovascular risk: Are icon arrays better than numerical estimates in improving understanding, recall and perception of risk? Patient Educ. Couns. 2013, 93, 394–402. [Google Scholar] [CrossRef]
  14. Brewer, N.T.; Gilkey, M.B.; Lillie, S.; Hesse, B.; Sheridan, S.L. Tables or Bar Graphs? Presenting Test Results in Electronic Medical Records. Med. Decis. Mak. 2012, 32, 545–553. [Google Scholar] [CrossRef] [Green Version]
  15. Tait, A.R.; Voepel-Lewis, T.; Brennan-Martinez, C.; McGonegal, M.; Levine, R. Using Animated Computer-generated Text and Graphics to Depict the Risks and Benefits of Medical Treatment. Am. J. Med. 2012, 125, 1103–1110. [Google Scholar] [CrossRef]
  16. Zikmund-Fisher, B.J.; Ubel, P.A.; Smith, D.M.; Derry, H.A.; McClure, J.B.; Stark, A.; Pitsch, R.K.; Fagerlin, A. Communicating side effect risks in a tamoxifen prophylaxis decision aid: The debiasing influence of pictographs. Patient Educ. Couns. 2008, 73, 209–214. [Google Scholar] [CrossRef] [PubMed] [Green Version]
  17. McDowell, M.; Gigerenzer, G.; Wegwarth, O.; Rebitschek, F.G. Effect of Tabular and Icon Fact Box Formats on Comprehension of Benefits and Harms of Prostate Cancer Screening: A Randomized Trial. Med. Decis. Mak. 2018, 39, 41–56. [Google Scholar] [CrossRef] [PubMed]
  18. Aubertin, P.; Hinneburg, J.; Hille, L.; Steckelberg, A. Fact Boxes: What gets through? A focus group study. Z. Evidenz Fortbild. Qual. Gesundh. 2022, 168, 96–105. [Google Scholar] [CrossRef]
  19. Way, D.; Blazsin, H.; Löfstedt, R.; Bouder, F. Pharmaceutical Benefit–Risk Communication Tools: A Review of the Literature. Drug Saf. 2016, 40, 15–36. [Google Scholar] [CrossRef]
  20. Schulz, K.F.; Altman, D.G.; Moher, D.; CONSORT Group. Consort 2010 Statement: Updated guidelines for reporting parallel group randomized trials. Ann. Int. Med. 2010, 152, 726–732. [Google Scholar] [CrossRef] [Green Version]
  21. Martin Luther University. Drug Fact Box Antibiotics for Acute Bronchitis. Available online: https://www.medizin.uni-halle.de/fileadmin/Dokumente/Dokumente/Institut_GPW/Forschung/Faktenbox_MLU_Bronchitis_englisch_2022.pdf (accessed on 15 June 2019).
  22. Marteau, T.M.; Dormandy, E.; Michie, S. A measure of informed choice. Health Expect. 2001, 4, 99–108. [Google Scholar] [CrossRef] [Green Version]
  23. Steckelberg, A.; Hülfenhaus, C.; Haastert, B.; Mühlhauser, I. Effect of evidence based risk information on “informed choice” in colorectal cancer screening: Randomised controlled trial. BMJ 2011, 342, d3193. [Google Scholar] [CrossRef] [Green Version]
  24. General Medical Council. Consent: Patients and Doctors Making Decisions Together. Available online: http://www.gmc-uk.org/guidance/ethical_guidance/consent_guidance_contents.asp (accessed on 14 January 2023).
  25. Lühnen, J.; Albrecht, M.; Mühlhauser, I.; Steckelberg, A. Leitlinienreport zur “Leitlinie evidenzbasierte Gesundheitsinformation”. Hamburg 2017. Available online: http://www.leitlinie-gesundheitsinformation.de/ (accessed on 24 December 2022).
  26. Sauer, C. Ein Minimalmodell zur Verständlichkeitsanalyse und -optimierung. Spillner Bernd (Hg.) Sprache: Verstehen und Verständlichkeit. Kongressbeiträge zur 1995, 25, 149–171. [Google Scholar]
  27. Thabane, L.; Ma, J.; Chu, R.; Cheng, J.; Ismaila, A.; Rios, L.P.; Robson, R.; Thabane, M.; Giangregorio, L.; Goldsmith, C.H. A tutorial on pilot studies: The what, why and how. BMC Med. Res. Methodol. 2010, 10, 1. [Google Scholar] [CrossRef] [Green Version]
  28. Danya, H.; Yonekura, Y.; Nakayama, K. Effects of graphic presentation on understanding medical risks and benefits among Japanese adults. Cogent Med. 2021, 8, 1907894. [Google Scholar] [CrossRef]
  29. Carmona, C.; Crutwell, J.; Burnham, M.; Polak, L. Shared decision-making: Summary of NICE guidance. BMJ 2021, 373, n1430. [Google Scholar] [CrossRef] [PubMed]
  30. Mata, J.; Dieckmann, A.; Gigerenzer, G. Verständliche Risikokommunikation, leicht gemacht-Oder: Wie man verwirrende Wahrscheinlichkeitsangeben vermeidet. ZFA-Z. Für Allg. 2005, 81, 537–541. [Google Scholar] [CrossRef] [Green Version]
  31. University of Cambridge. Predict Breast Cancer. Available online: https://breast.predict.nhs.uk/tool (accessed on 1 April 2022).
  32. Farmer, G.D.; Pearson, M.; Skylark, W.J.; Freeman, A.L.J.; Spiegelhalter, D.J. Redevelopment of the Predict: Breast Cancer website and recommendations for developing interfaces to support decision-making. Cancer Med. 2021, 10, 5141–5153. [Google Scholar] [CrossRef] [PubMed]
  33. Higgins, J.P.T.; Savović, J.; Page, M.J.; Sterne, J.A.C. Revised Cochrane Risk-of-Bias Tool for Randomized Trials (RoB 2). 2019. Available online: https://drive.google.com/file/d/19R9savfPdCHC8XLz2iiMvL_71lPJERWK/view (accessed on 3 July 2021).
  34. Statista. Proportion of Internet Users According to Age Groups in Germany from 2014 to 2020. 2020. Available online: https://de.statista.com/statistik/daten/studie/3101/umfrage/internetnutzung-in-deutschland-nach-altersgruppen/ (accessed on 24 June 2021).
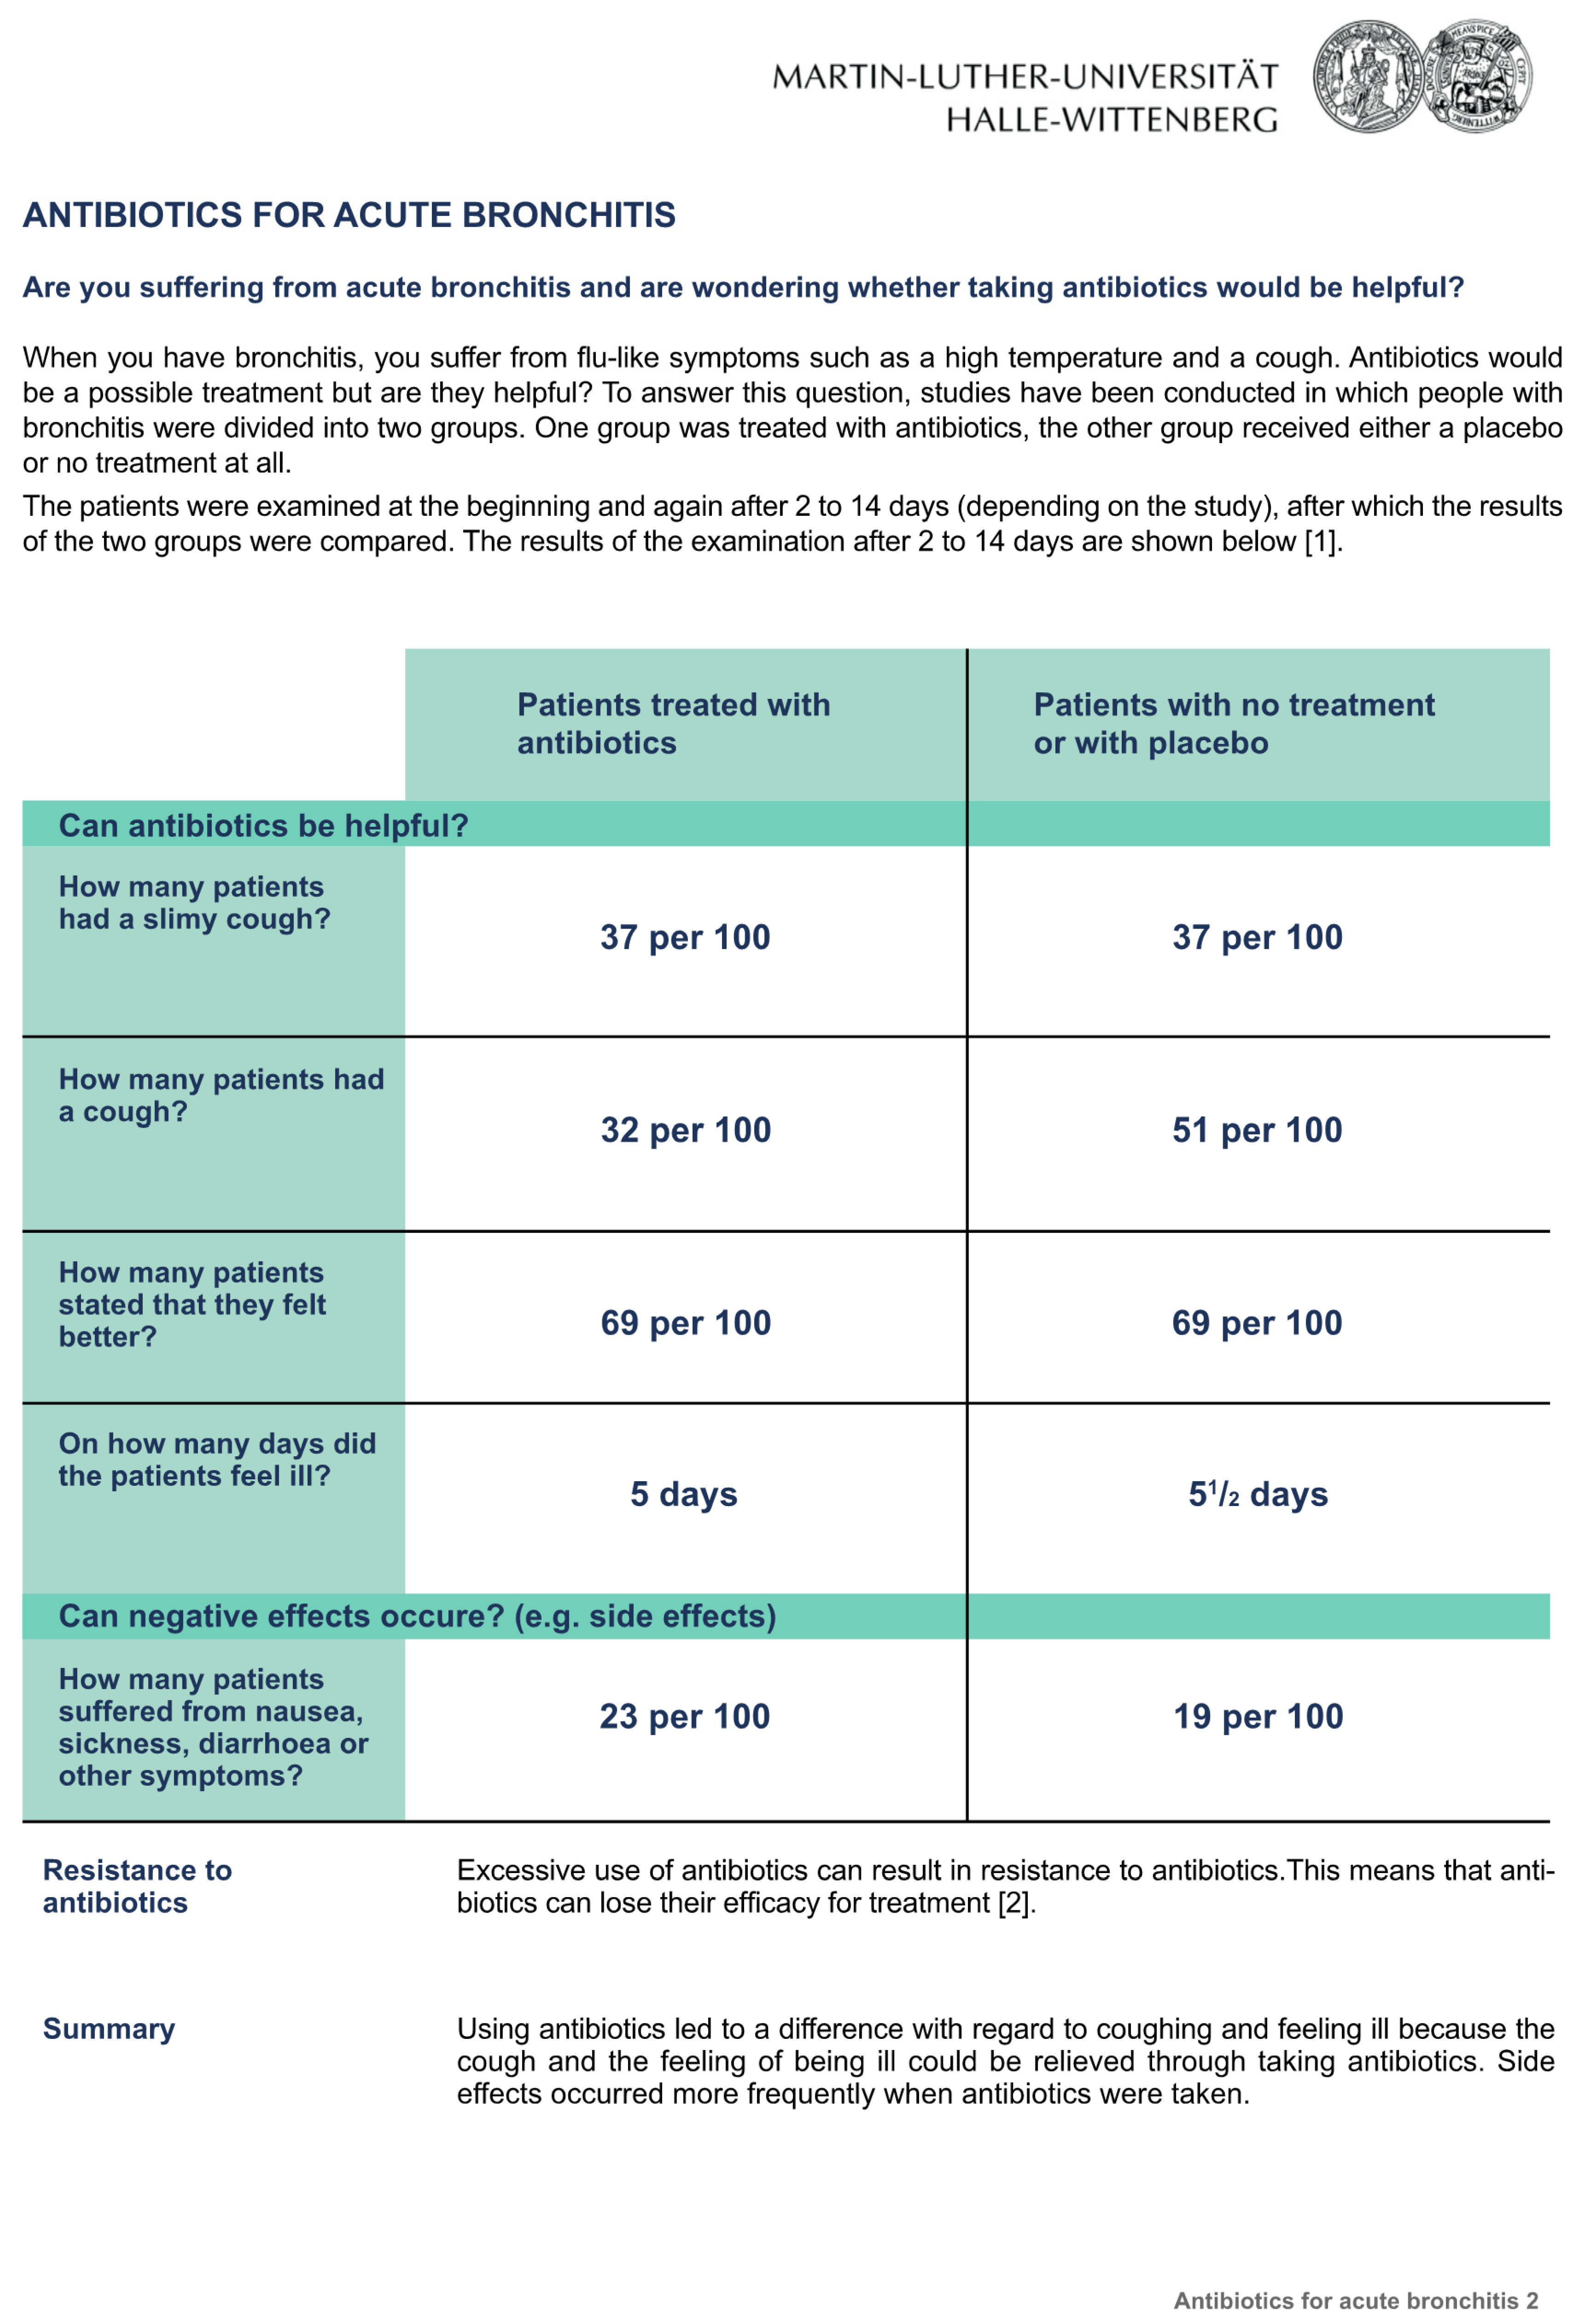
Figure 1. Fact box that presented treatment effects as natural frequencies.
Ijerph 20 02165 g001
Figure 2. The fact box that presented treatment effects as percentages.
Ijerph 20 02165 g002
Figure 3. The fact box that presented treatment effects as a graphical presentation.
Ijerph 20 02165 g003
Figure 4. Fact boxes with additional information.
Ijerph 20 02165 g004aIjerph 20 02165 g004b
Figure 5. CONSORT Flow Diagram [20].
Ijerph 20 02165 g005
Table 1. Baseline characteristics of participants (n = 227).
Fact BoxFact BoxFact Box
Natural Frequencies
n = 82
Percentages
n = 72
Graphic Chart
n = 73
Age, mean (SD)50.8 (16.9)50.1 (16.8)47.7 (13.3)
Sex, n (%) *
Female36 (43.9)37 (51.4)35 (47.9)
Male28 (34.1)24 (33.3)21 (28.8)
Divers1 (1.2)0 (0)0 (0)
Educational level, n (%) *
Graduation **5 (6.1)3 (4.2)4 (5.5)
Master (university) **19 (23.2)15 (20.8)25 (34.2)
Master (university of applied sciences) **11 (13.4)12 (16.7)6 (8.2)
Bachelor (university of applied sciences and university) **7 (8.5)5 (6.9)5 (6.8)
Higher School Certificate (Abitur)42 (51.2)33 (45.8)47 (57.5)
Higher School Certificate (qualification for a university of applied sciences)7 (8.5)9 (12.5)5 (6.8)
Secondary School12 (14.6)12 (16.7)7 (9.6)
Lower Secondary School1 (1.2)4 (5.6)1 (1.4)
Others1 (1.2)2 (2.8)1 (1.4)
Students attending general schools (full-time or part-time)1 (1.2)0 (0)0 (0)
No response18 (22.0)12 (16.7)17 (23.3)
* Due to missing values, numbers do not always sum up to 100%. ** Multiple answers were possible.
Table 2. Primary outcome: verbatim and gist knowledge (sum score).
OutcomeFact BoxMedianMean (±SD a)Min-Max95% CI bp-Value c
Verbatim knowledgeNatural frequencies0.780.63 (0.36)0–1
Verbatim knowledgePercentages0.780.64 (0.36)0–1−0.004; −0.0040.986
Verbatim knowledgeGraphic chart0.780.63 (0.36)0–1
Gist knowledgeNatural frequencies0.800.69 (0.37)0–1
Gist knowledgePercentages0.800.71 (0.35)0–1−0.004; 0.0020.708
Gist knowledgeGraphic chart1.000.72 (0.37)0–1
a SD = standard deviation. b 95% CIs ofdifferences of means calculated based on ANOVA. c Asymptotic significance from two-sided Kruskal–Wallis tests.
Table 3. Participants’ responses regarding readability/comprehensibility, acceptance, and relevance.
OutcomeFact BoxMean (±SD a)Min-Maxp-Value b
Readability/ComprehensibilityNatural frequencies2.19 (0.62)0–3
Readability/ComprehensibilityPercentages2.10 (0.57)0–30.657
Readability/ComprehensibilityGraphic chart2.14 (0.47)1–3
AcceptanceNatural frequencies1.71 (0.70)0–3
AcceptancePercentages1.81 (0.57)0–30.430
AcceptanceGraphic chart1.85 (0.53)0.33–3
RelevanceNatural frequencies1.94 (0.77)0–3
RelevancePercentages1.90 (0.66)0–30.798
RelevanceGraphic chart1.96 (0.74)0–3
a SD = standard deviation. b Asymptotic significance of two-sided Kruskal–Wallis tests of differences of means.
Table 4. Knowledge by educational level.
OutcomeFact BoxEducational LevelnMean (±SD a)MedianDifference of Means (95% CI)p-Value b
Verbatim
knowledge
Natural
frequencies
Lower education
Higher education
14
50
0.69 (0.25)
0.81 (0.22)
0.72
0.89
0.12 (−0.222; 0.000)0.182
Verbatim
knowledge
PercentagesLower education
Higher education
15
45
0.62 (0.31)
0.80 (0.23)
0.67
0.89
0.22 (−0.222; 0.000)0.049
Verbatim
knowledge
Graphic
chart
Lower education
Higher education
8
48
0.57 (0.37)
0.81 (0.21)
0.72
0.89
0.17 (−0.222; 0.000)0.098
Gist
knowledge
Natural
frequencies
Lower education
Higher education
14
50
0.81 (0.20)
0.88 (0.19)
0.80
1.0
0.2 (−0.200; 0.000)0.337
Gist
knowledge
PercentagesLower education
Higher education
15
45
0.77 (0.28)
0.86 (0.22)
0.80
1.0
0.2 (−0.200; 0.000)0.269
Gist
knowledge
Graphic
chart
Lower education
Higher education
8
48
0.80 (0.32)
0.90 (0.18)
1.0
1.0
0 (−0.200; 0.000)0.770
a SD = standard deviation. b Asymptotic significance from two-sided Mann–Whitney U Test of difference of means.
Disclaimer/Publisher’s Note: The statements, opinions and data contained in all publications are solely those of the individual author(s) and contributor(s) and not of MDPI and/or the editor(s). MDPI and/or the editor(s) disclaim responsibility for any injury to people or property resulting from any ideas, methods, instructions or products referred to in the content.