

Degradation of Typical Reverse Sand-Mudstone Interbedded Bank Slope Based on Multi-Source Field Experiments
 ,
,  ,
,
Abstract
:1. Introduction
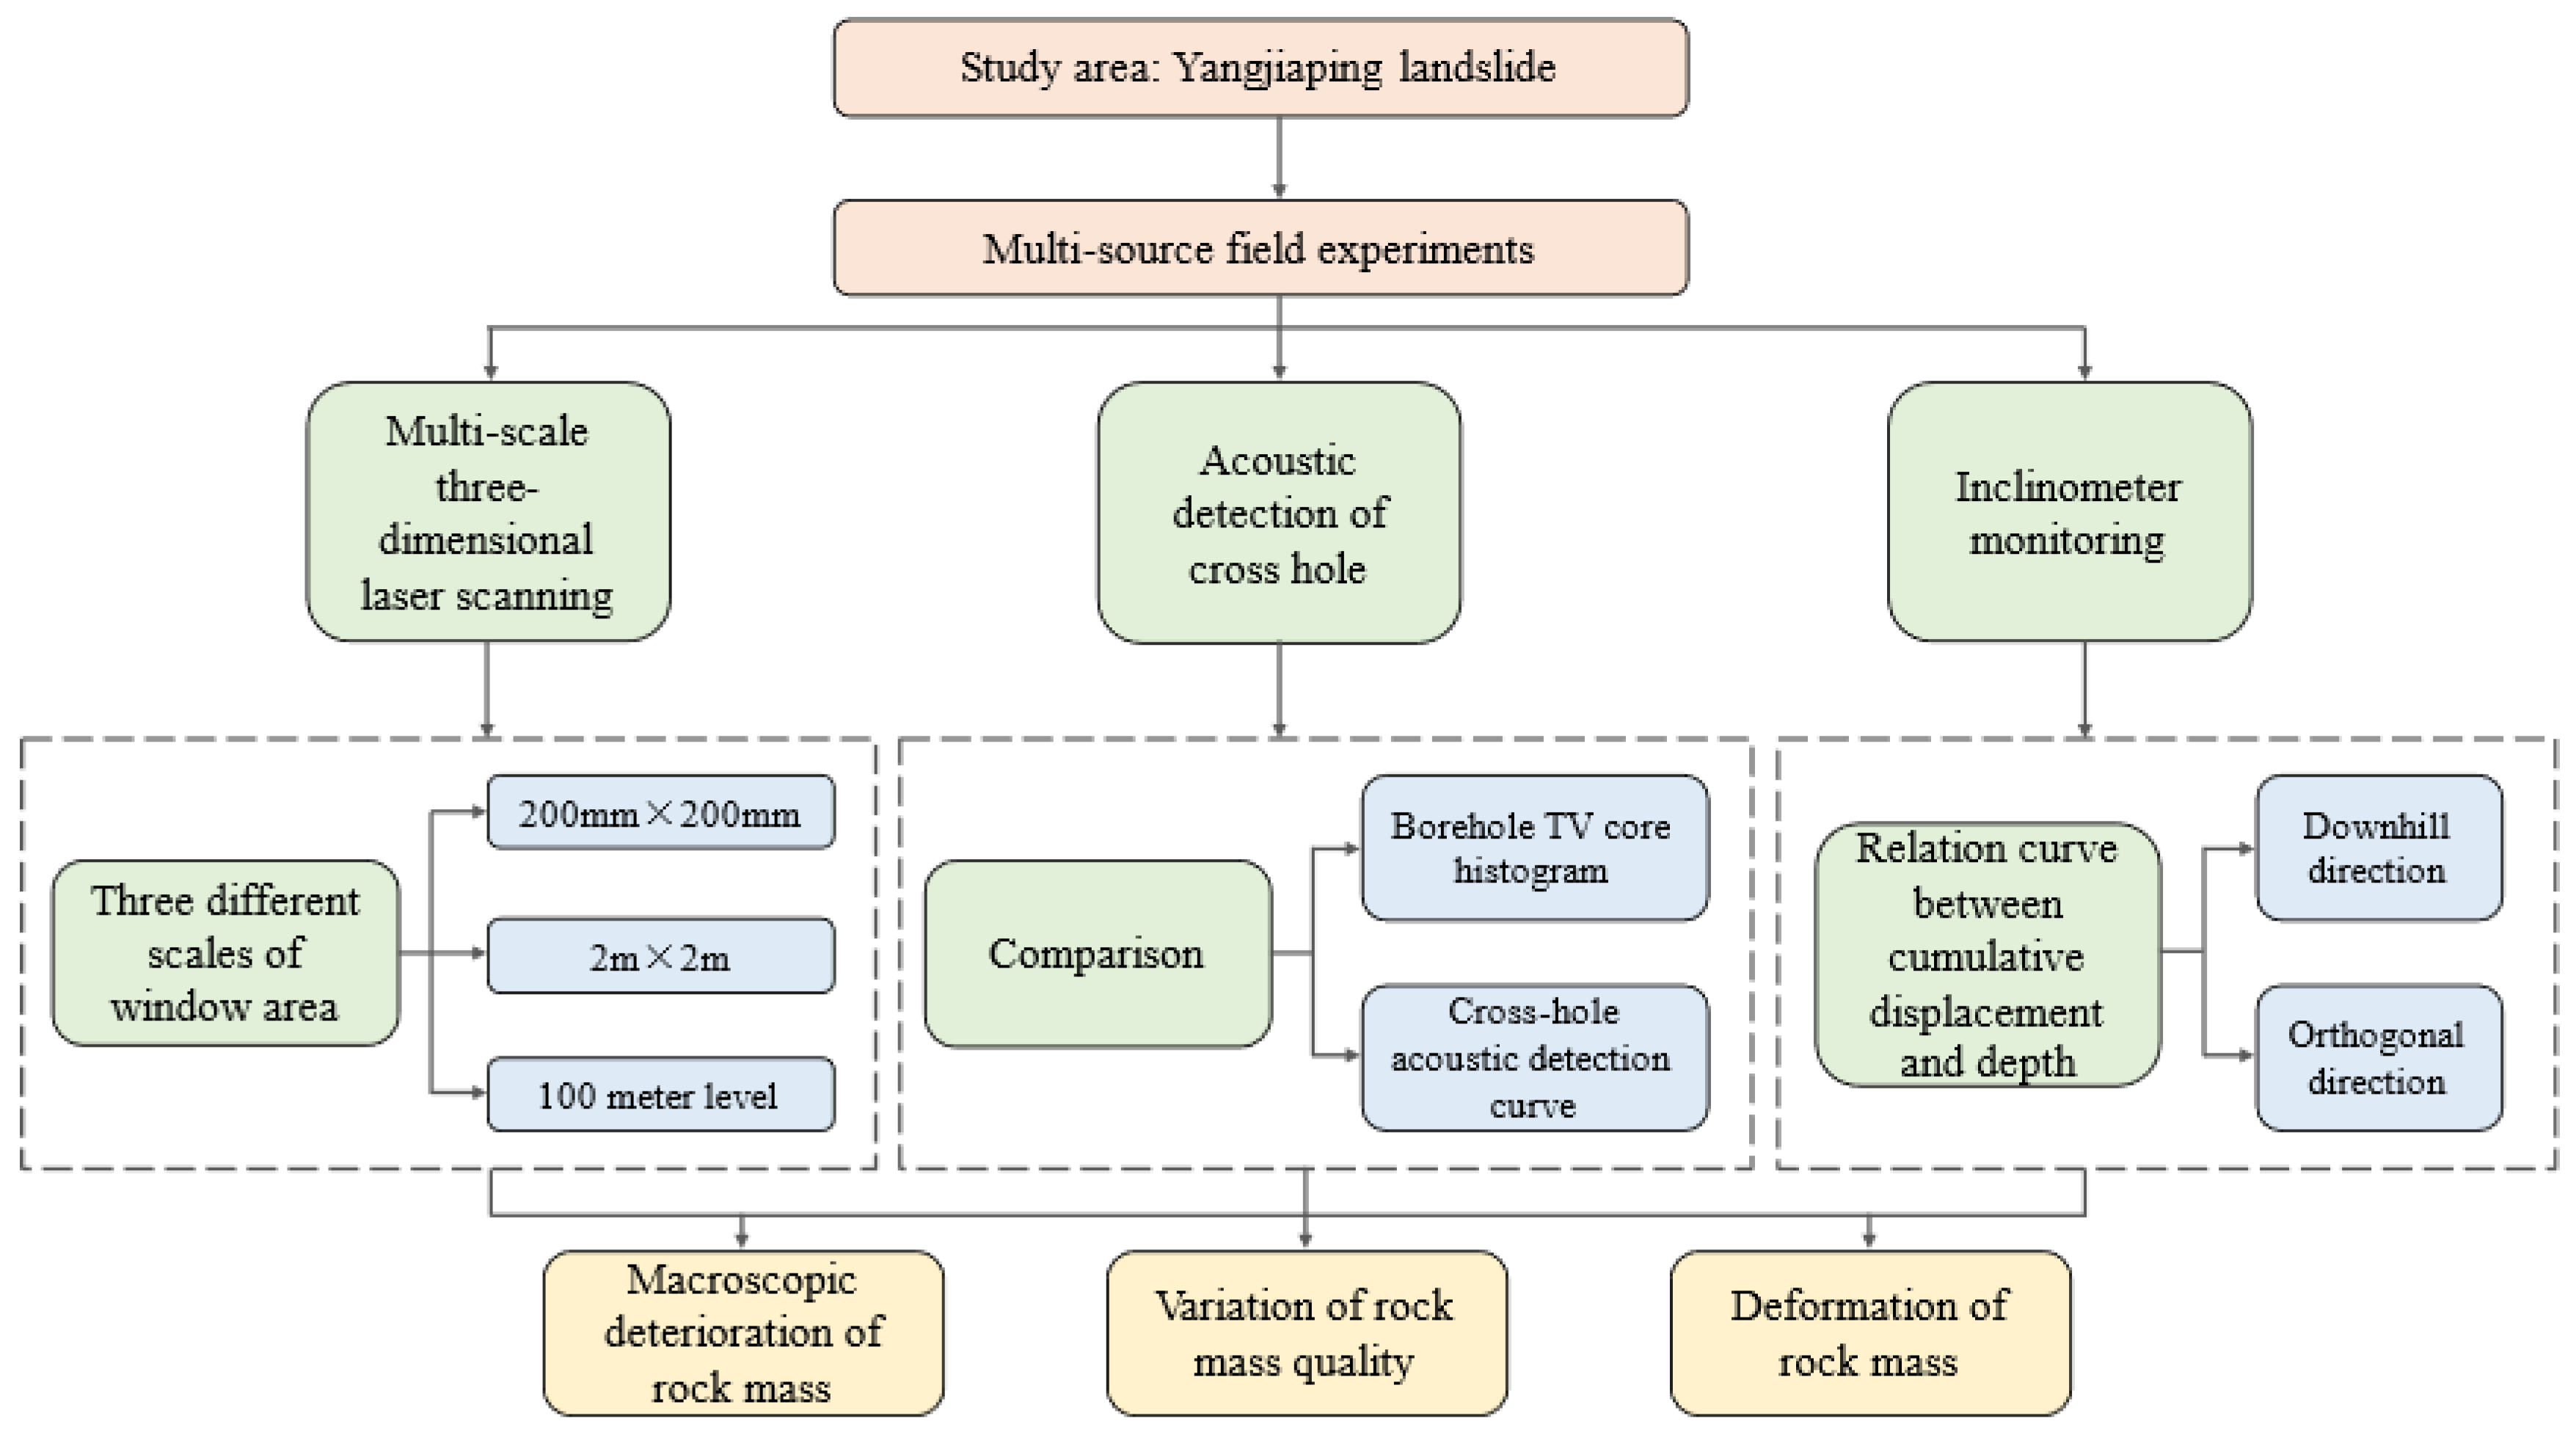
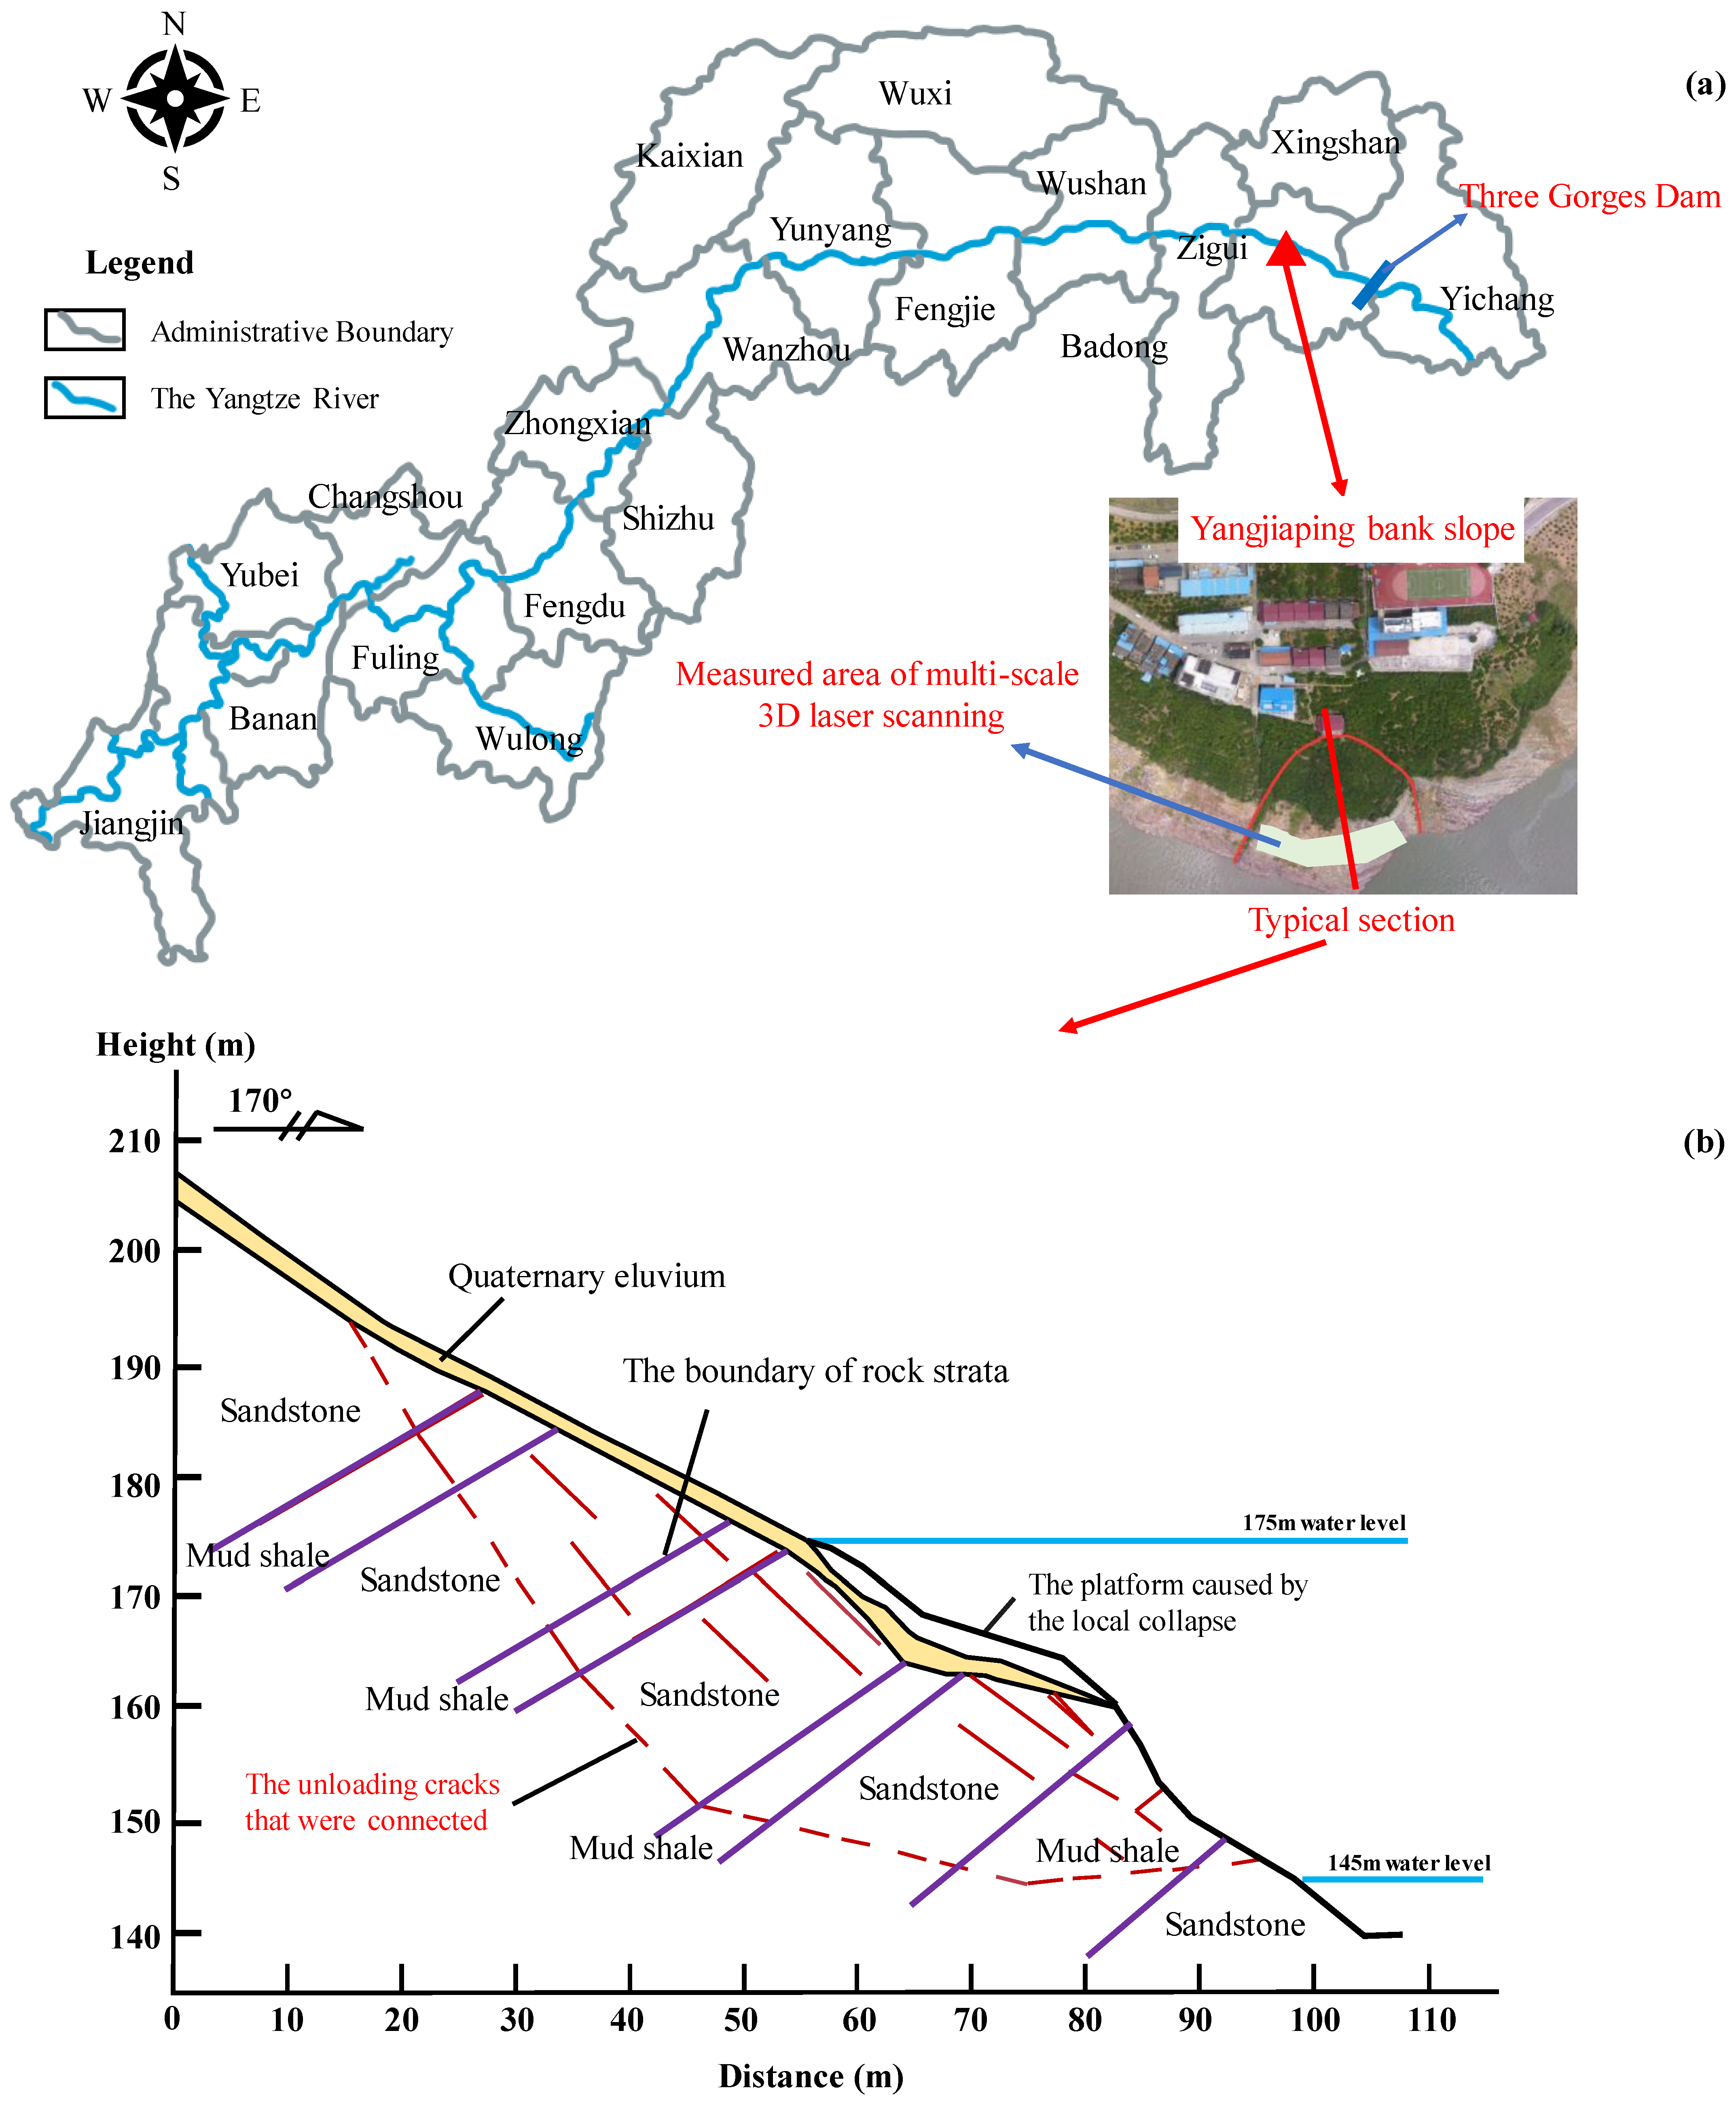
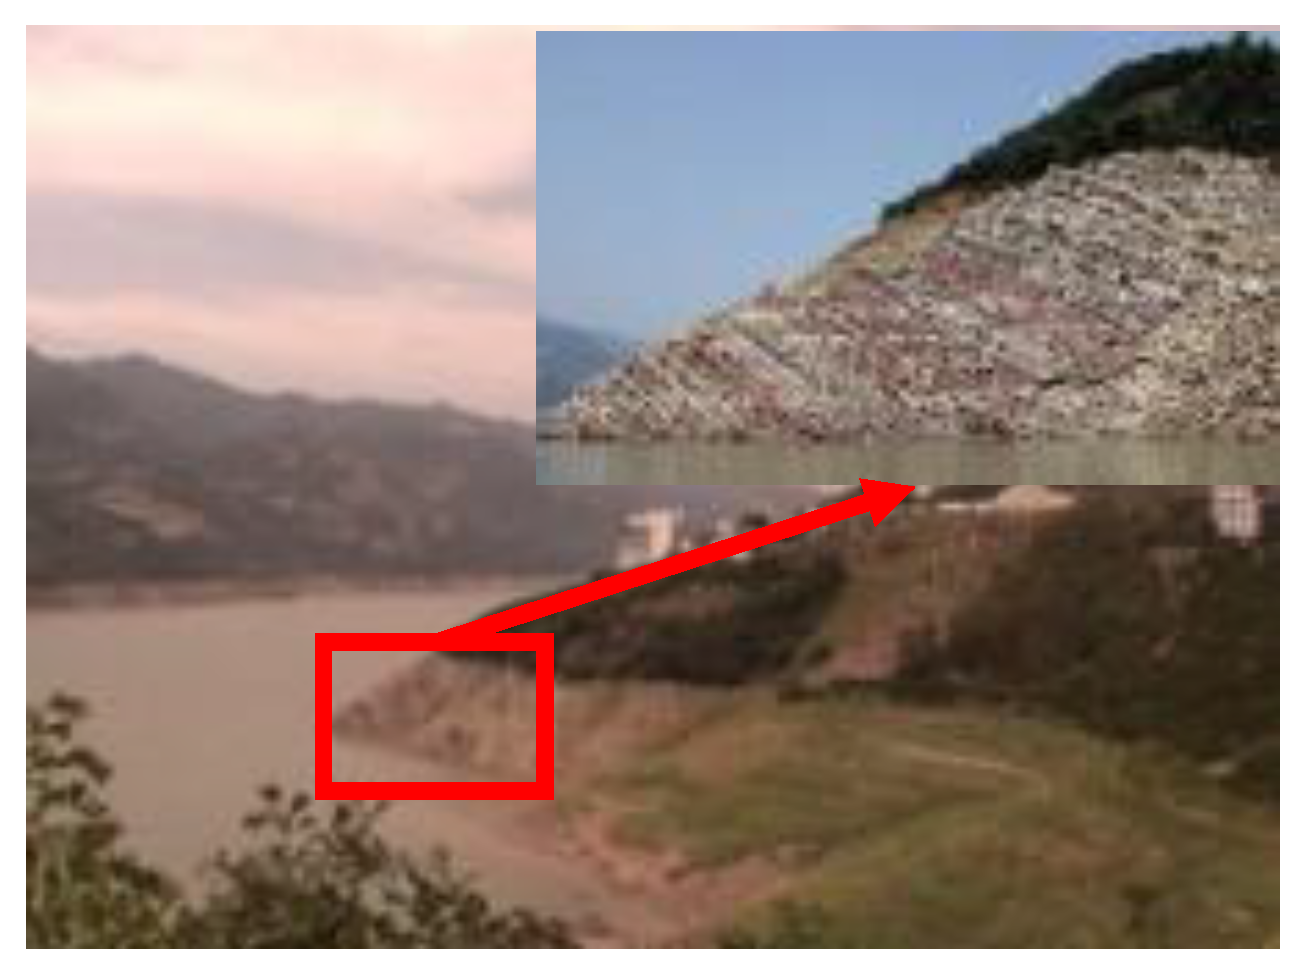
2. Study Area
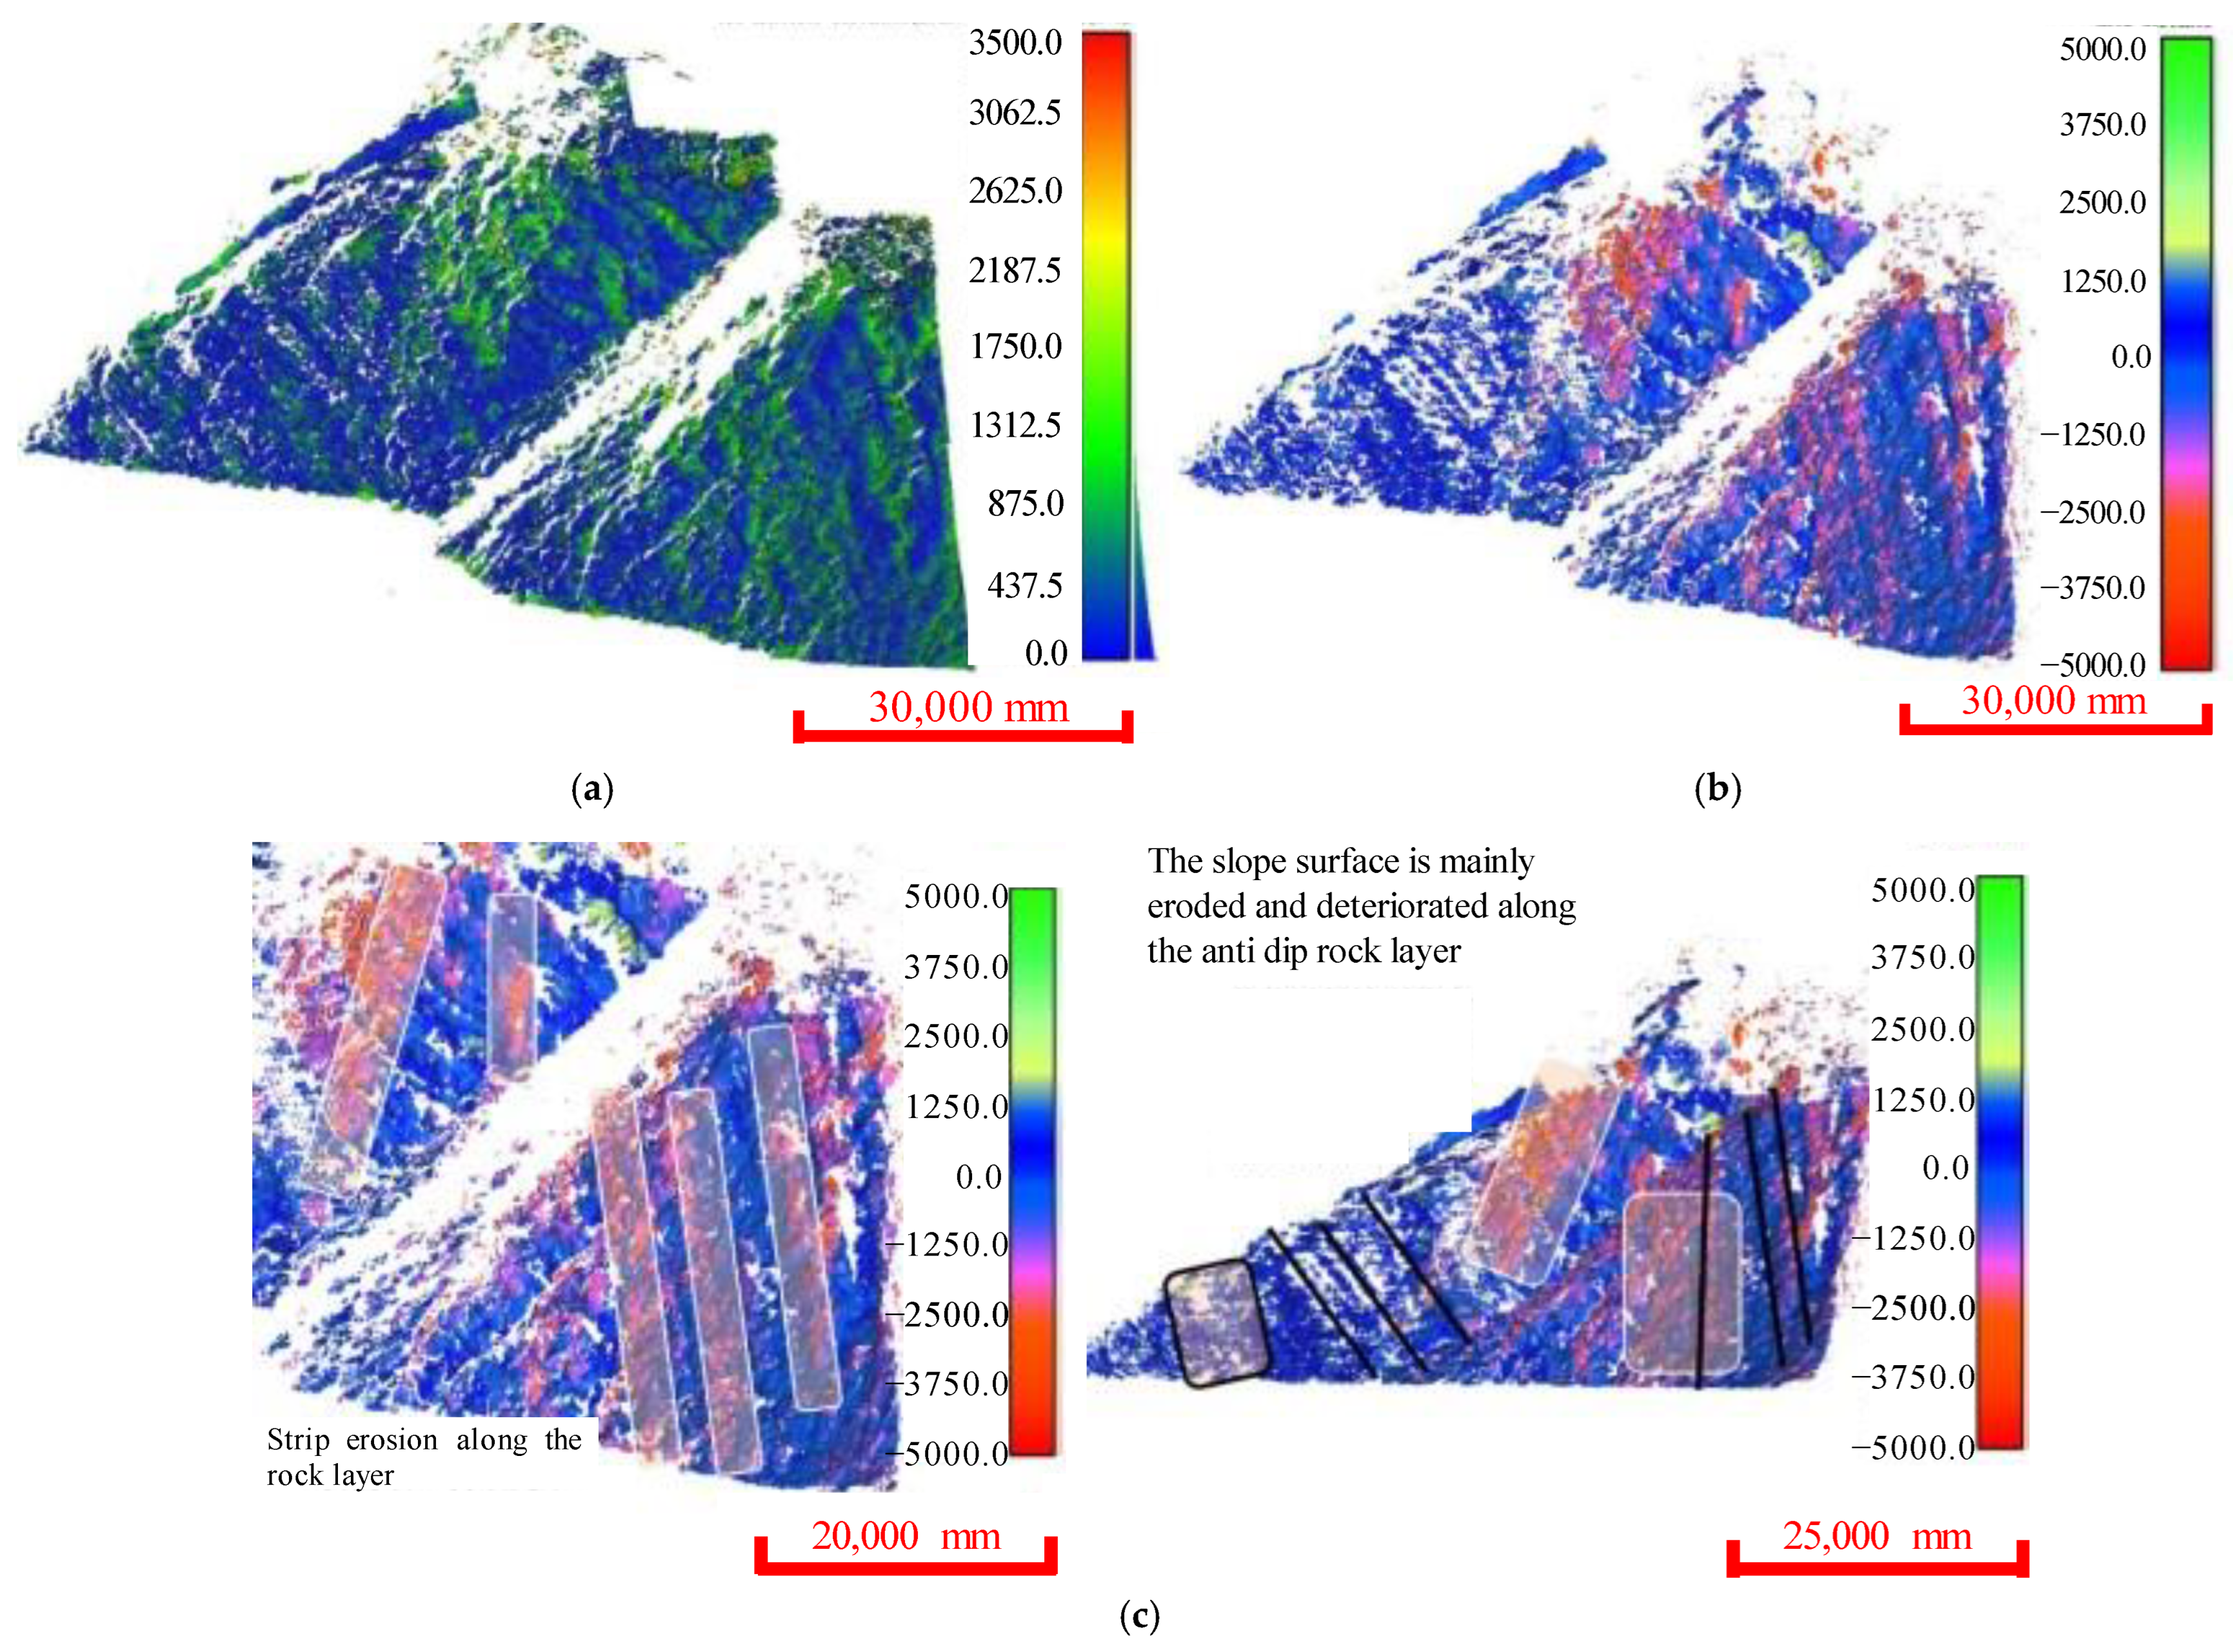
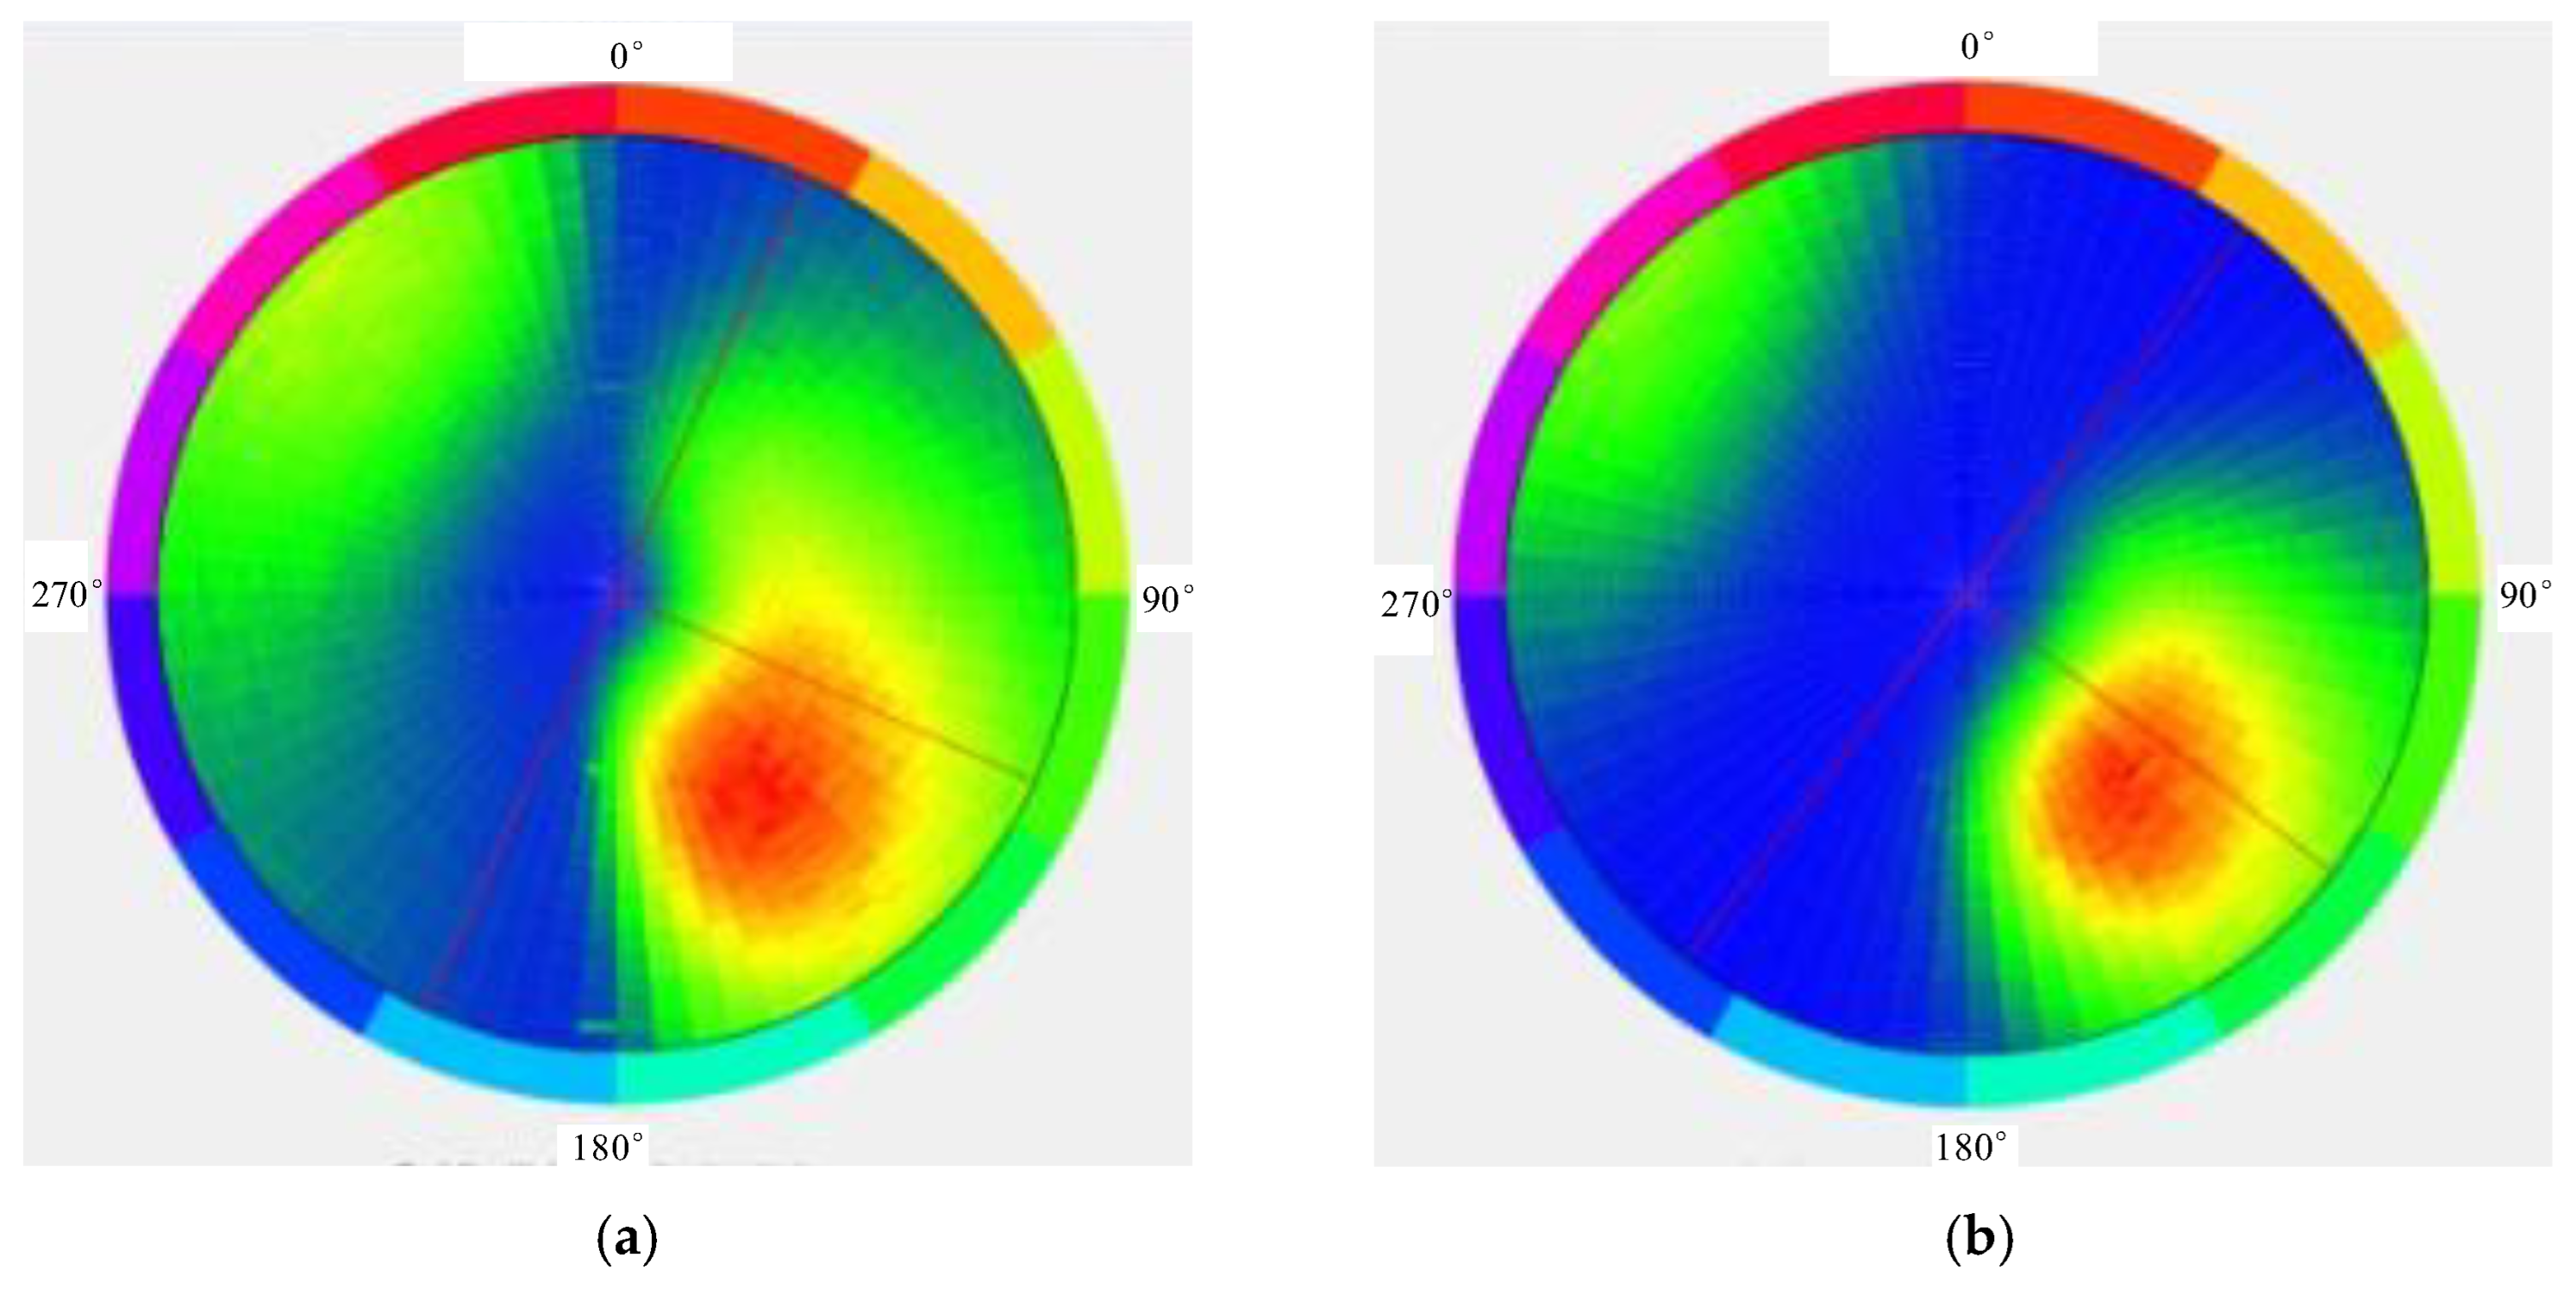
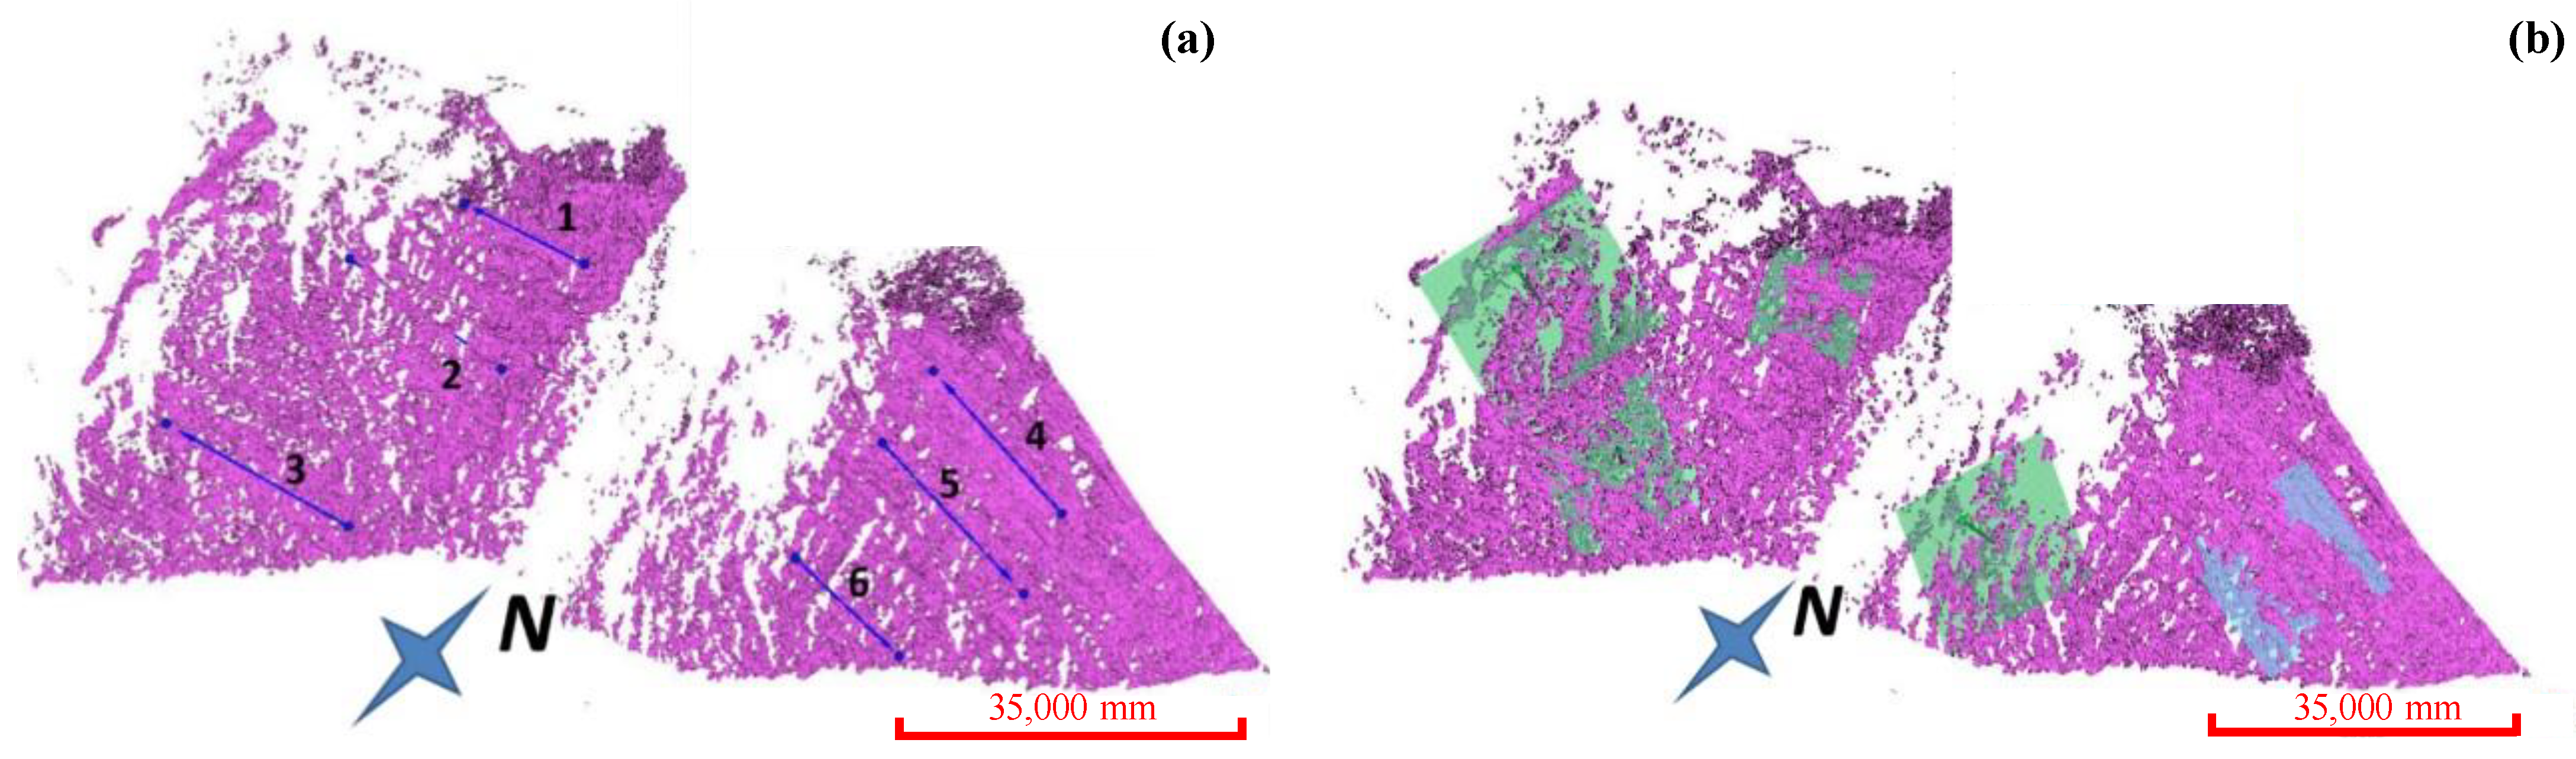
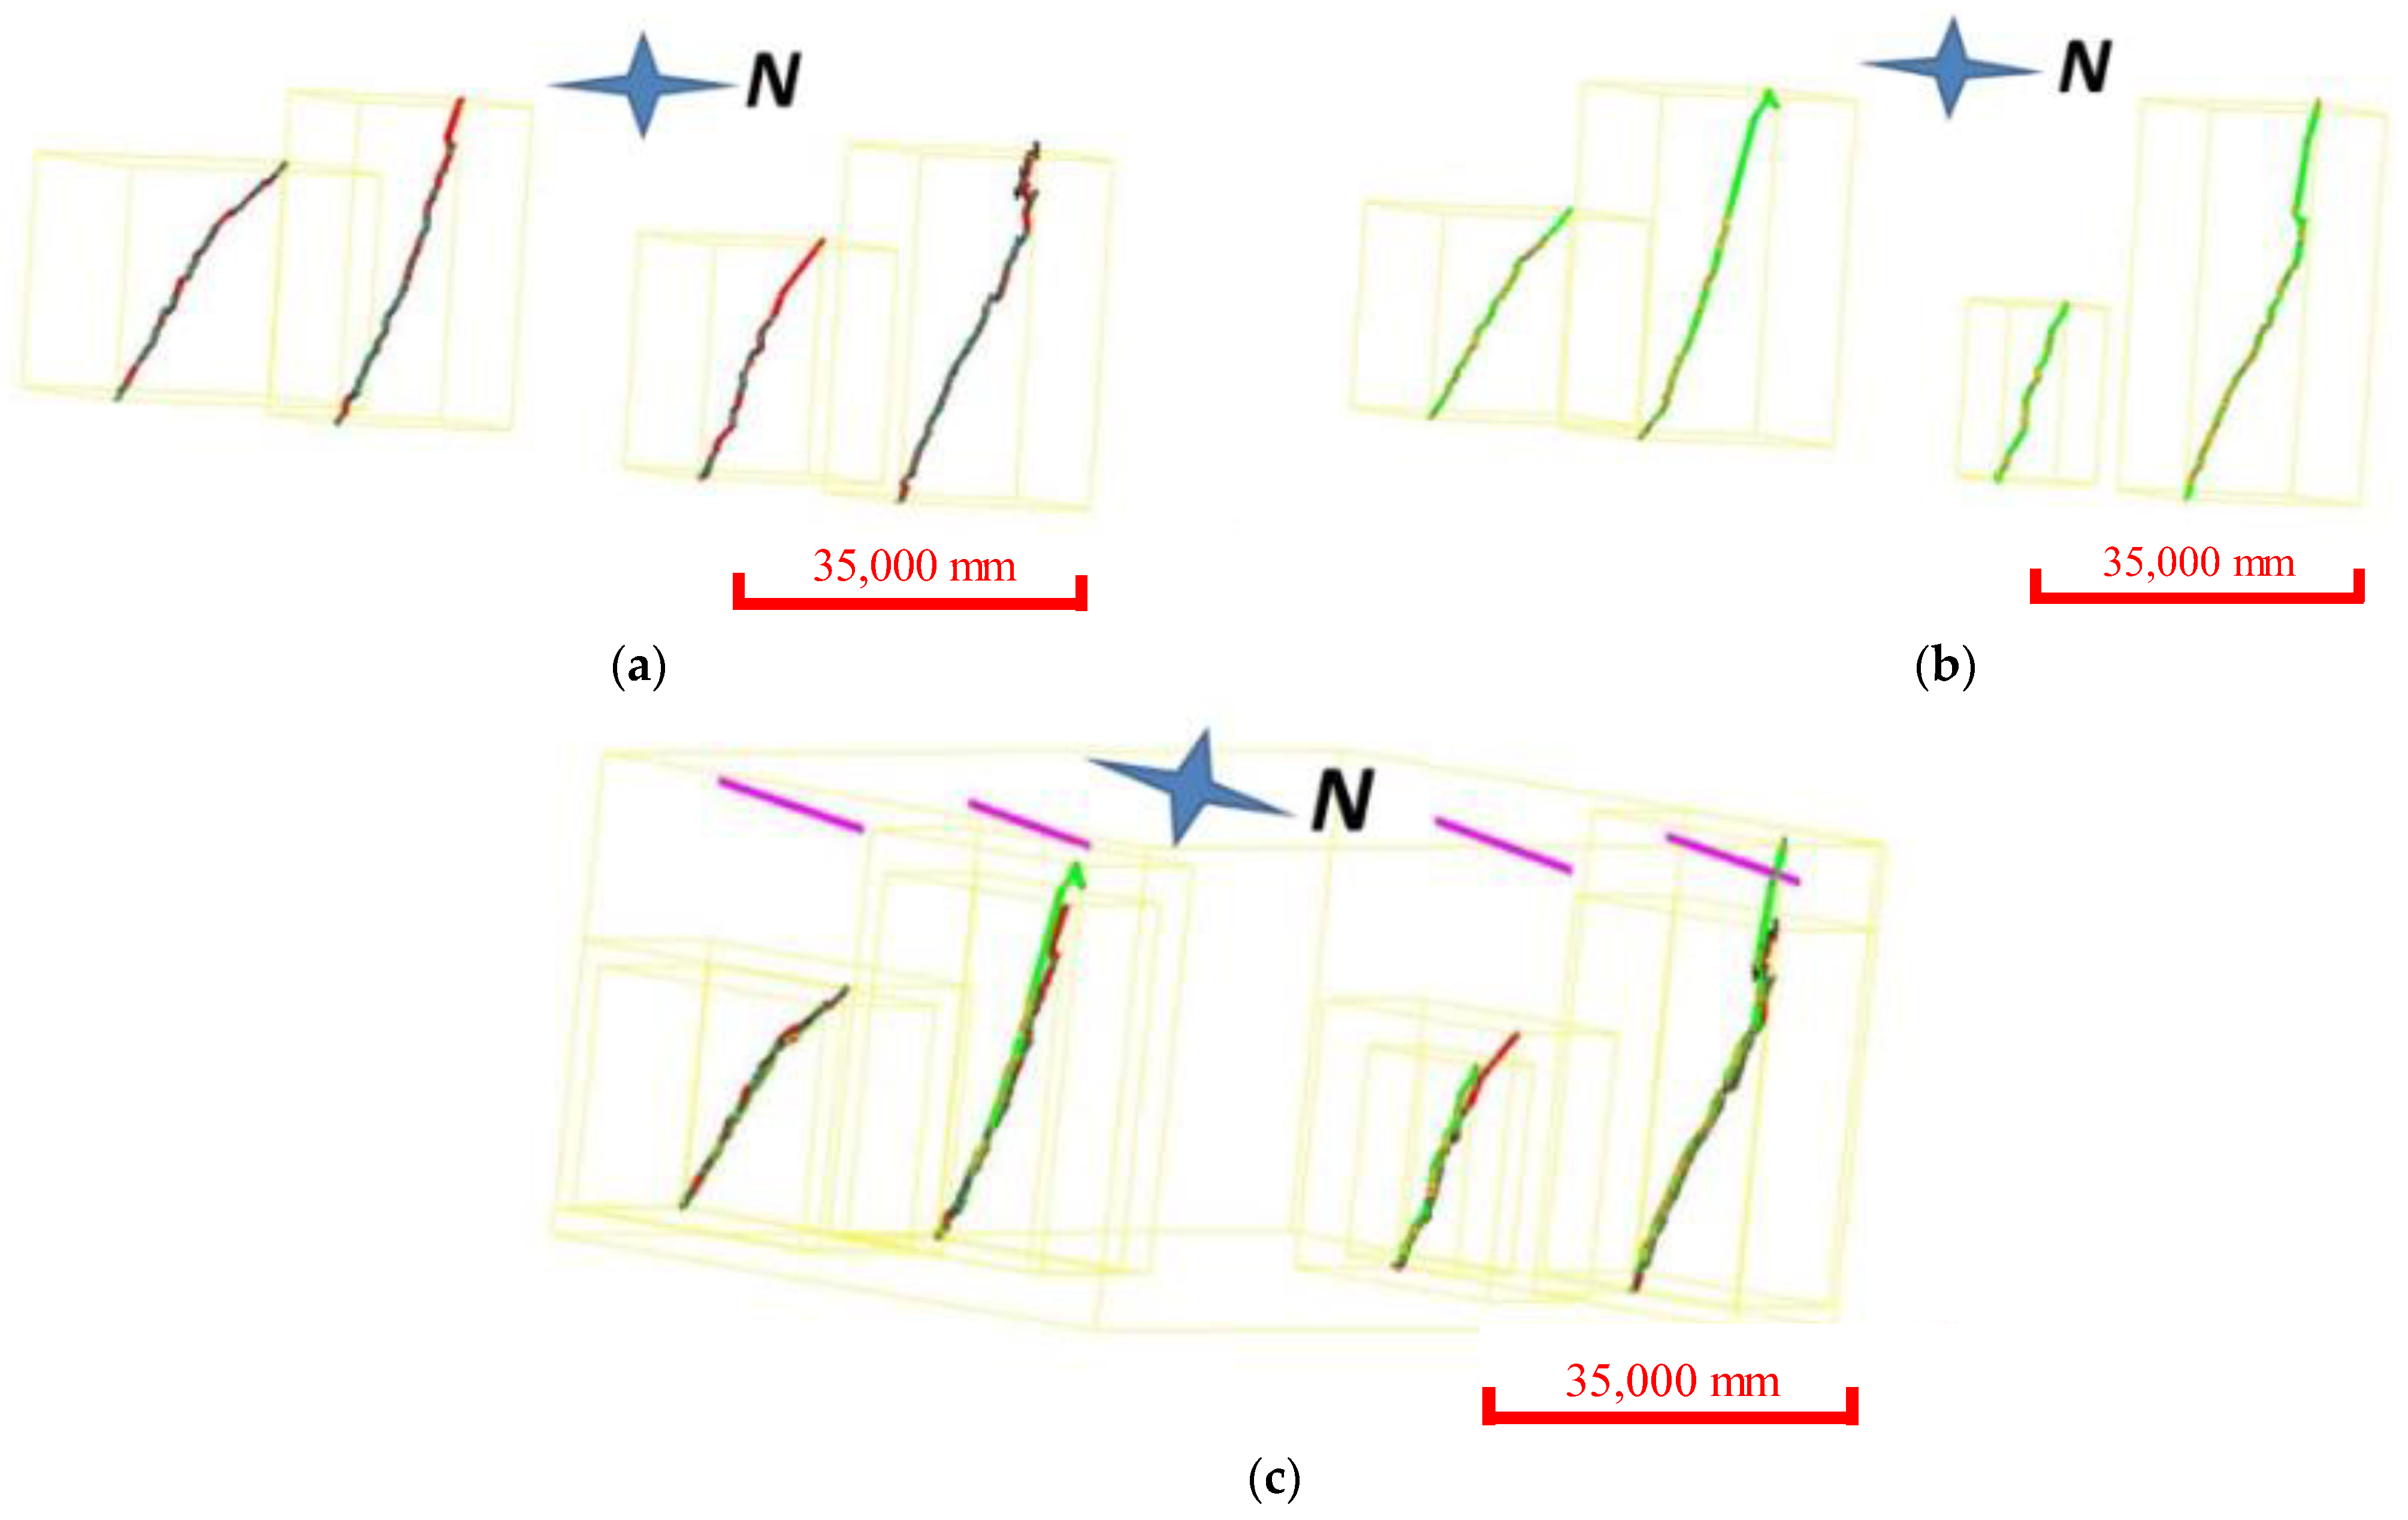
3. Multi-Scale Three-Dimensional (3D) Laser Scanning
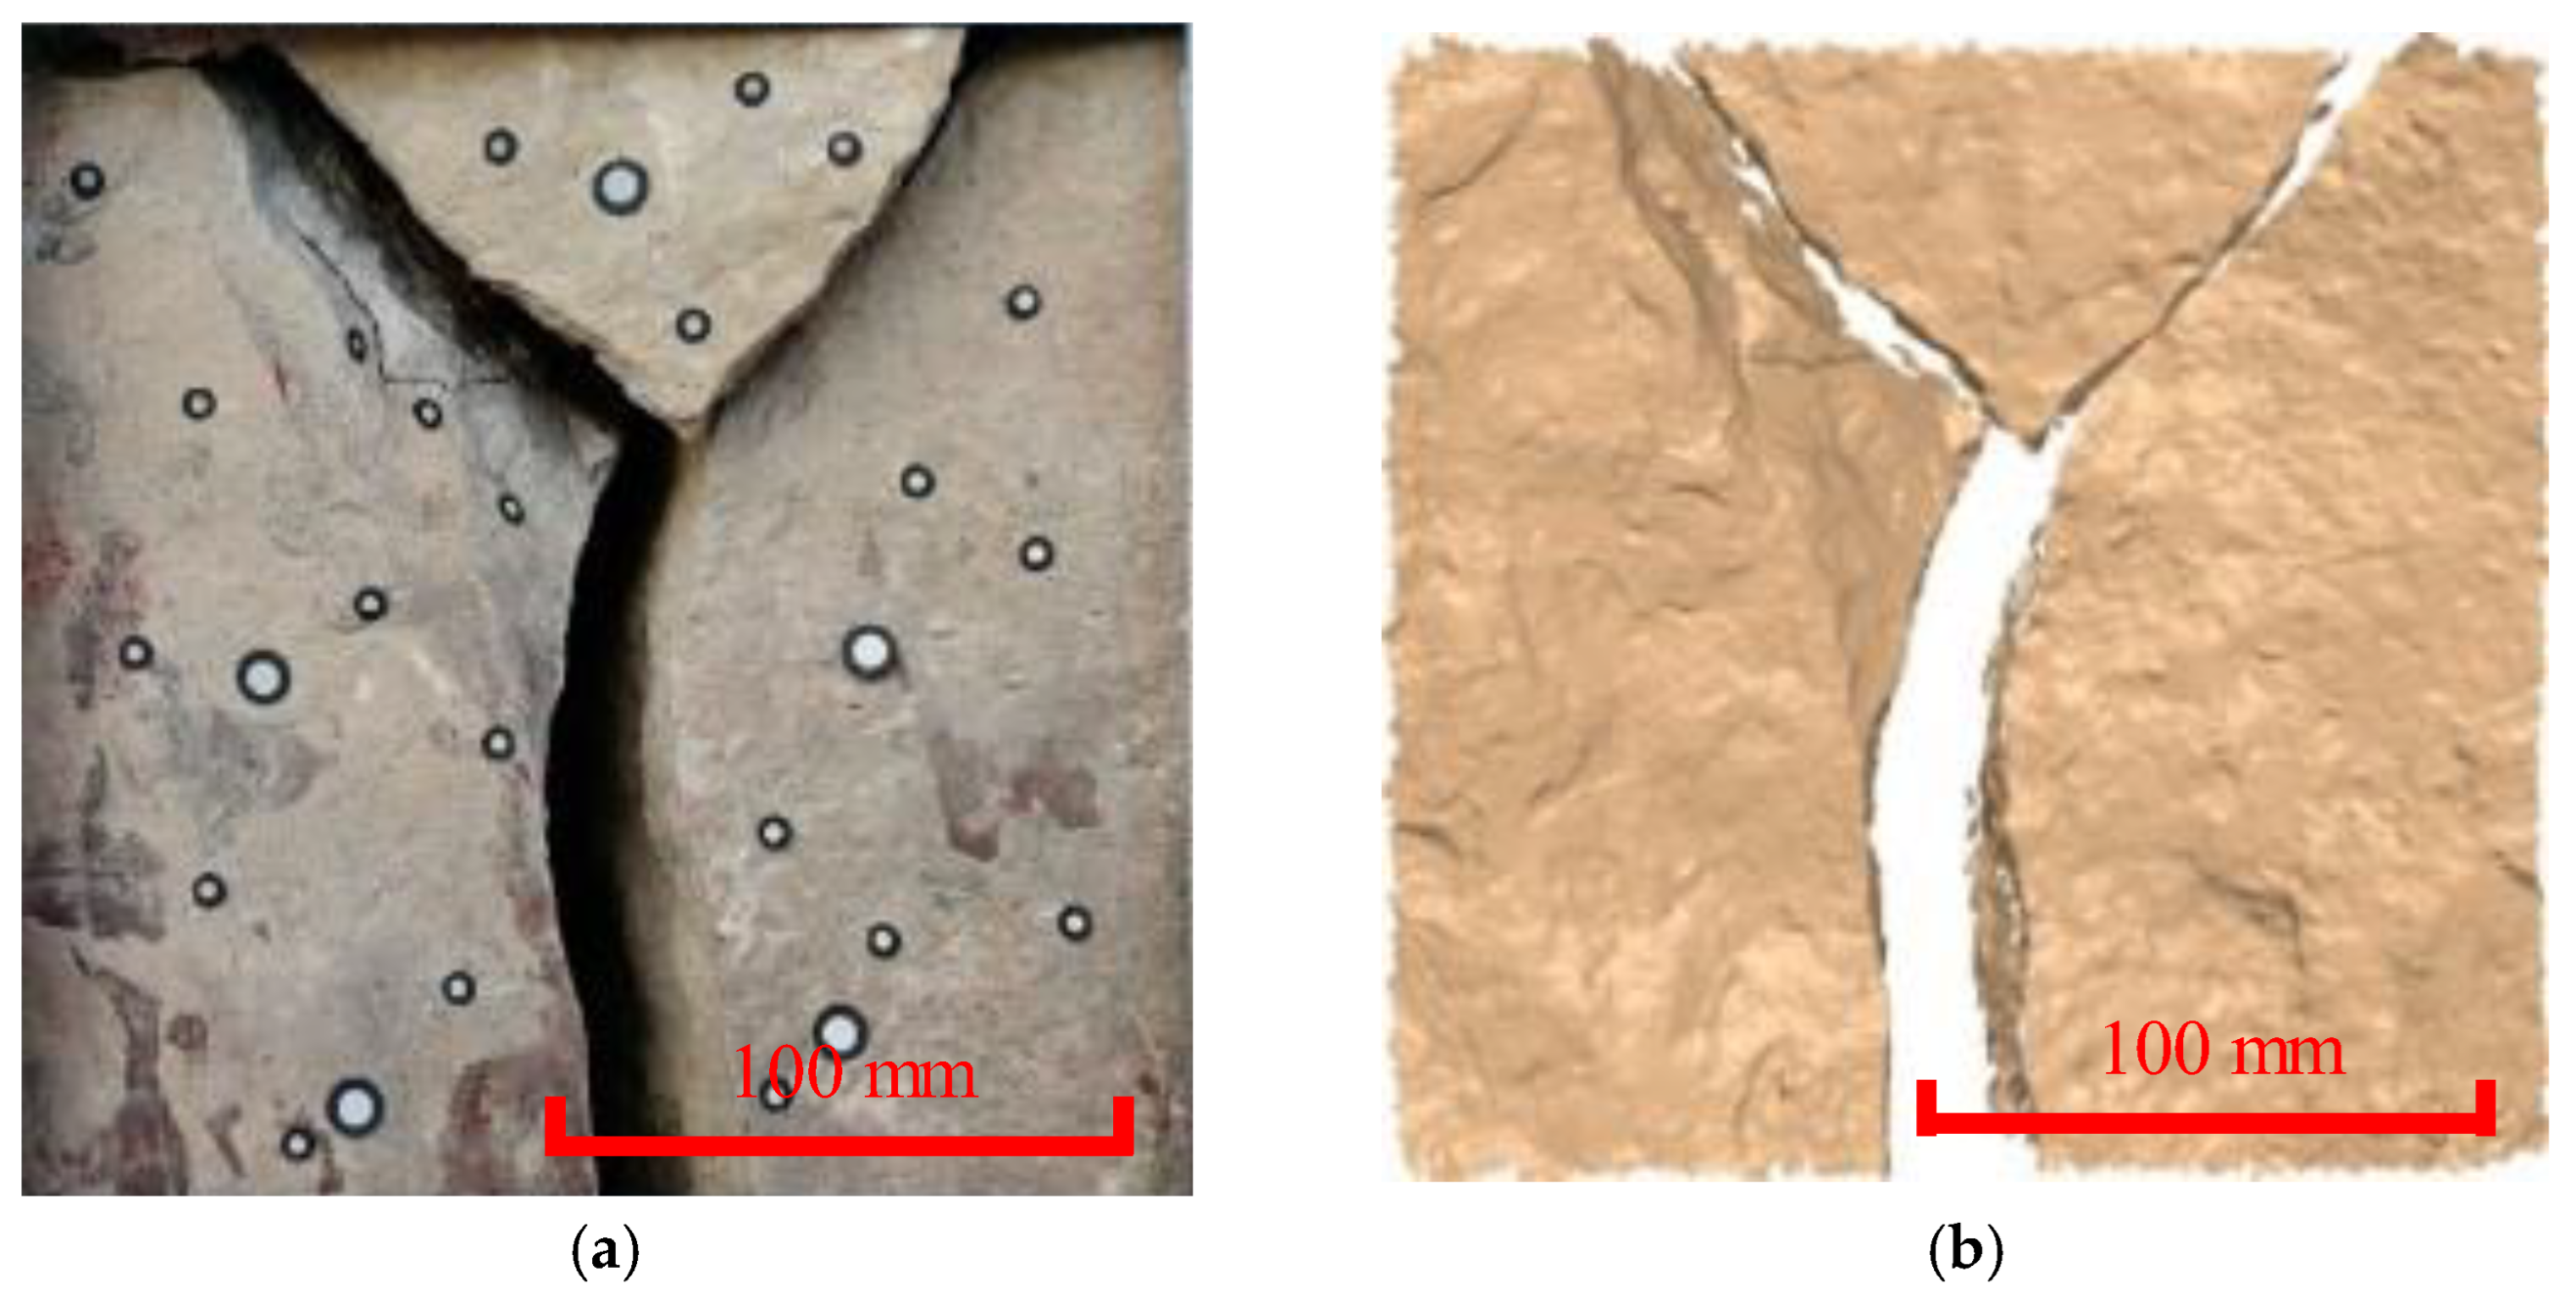
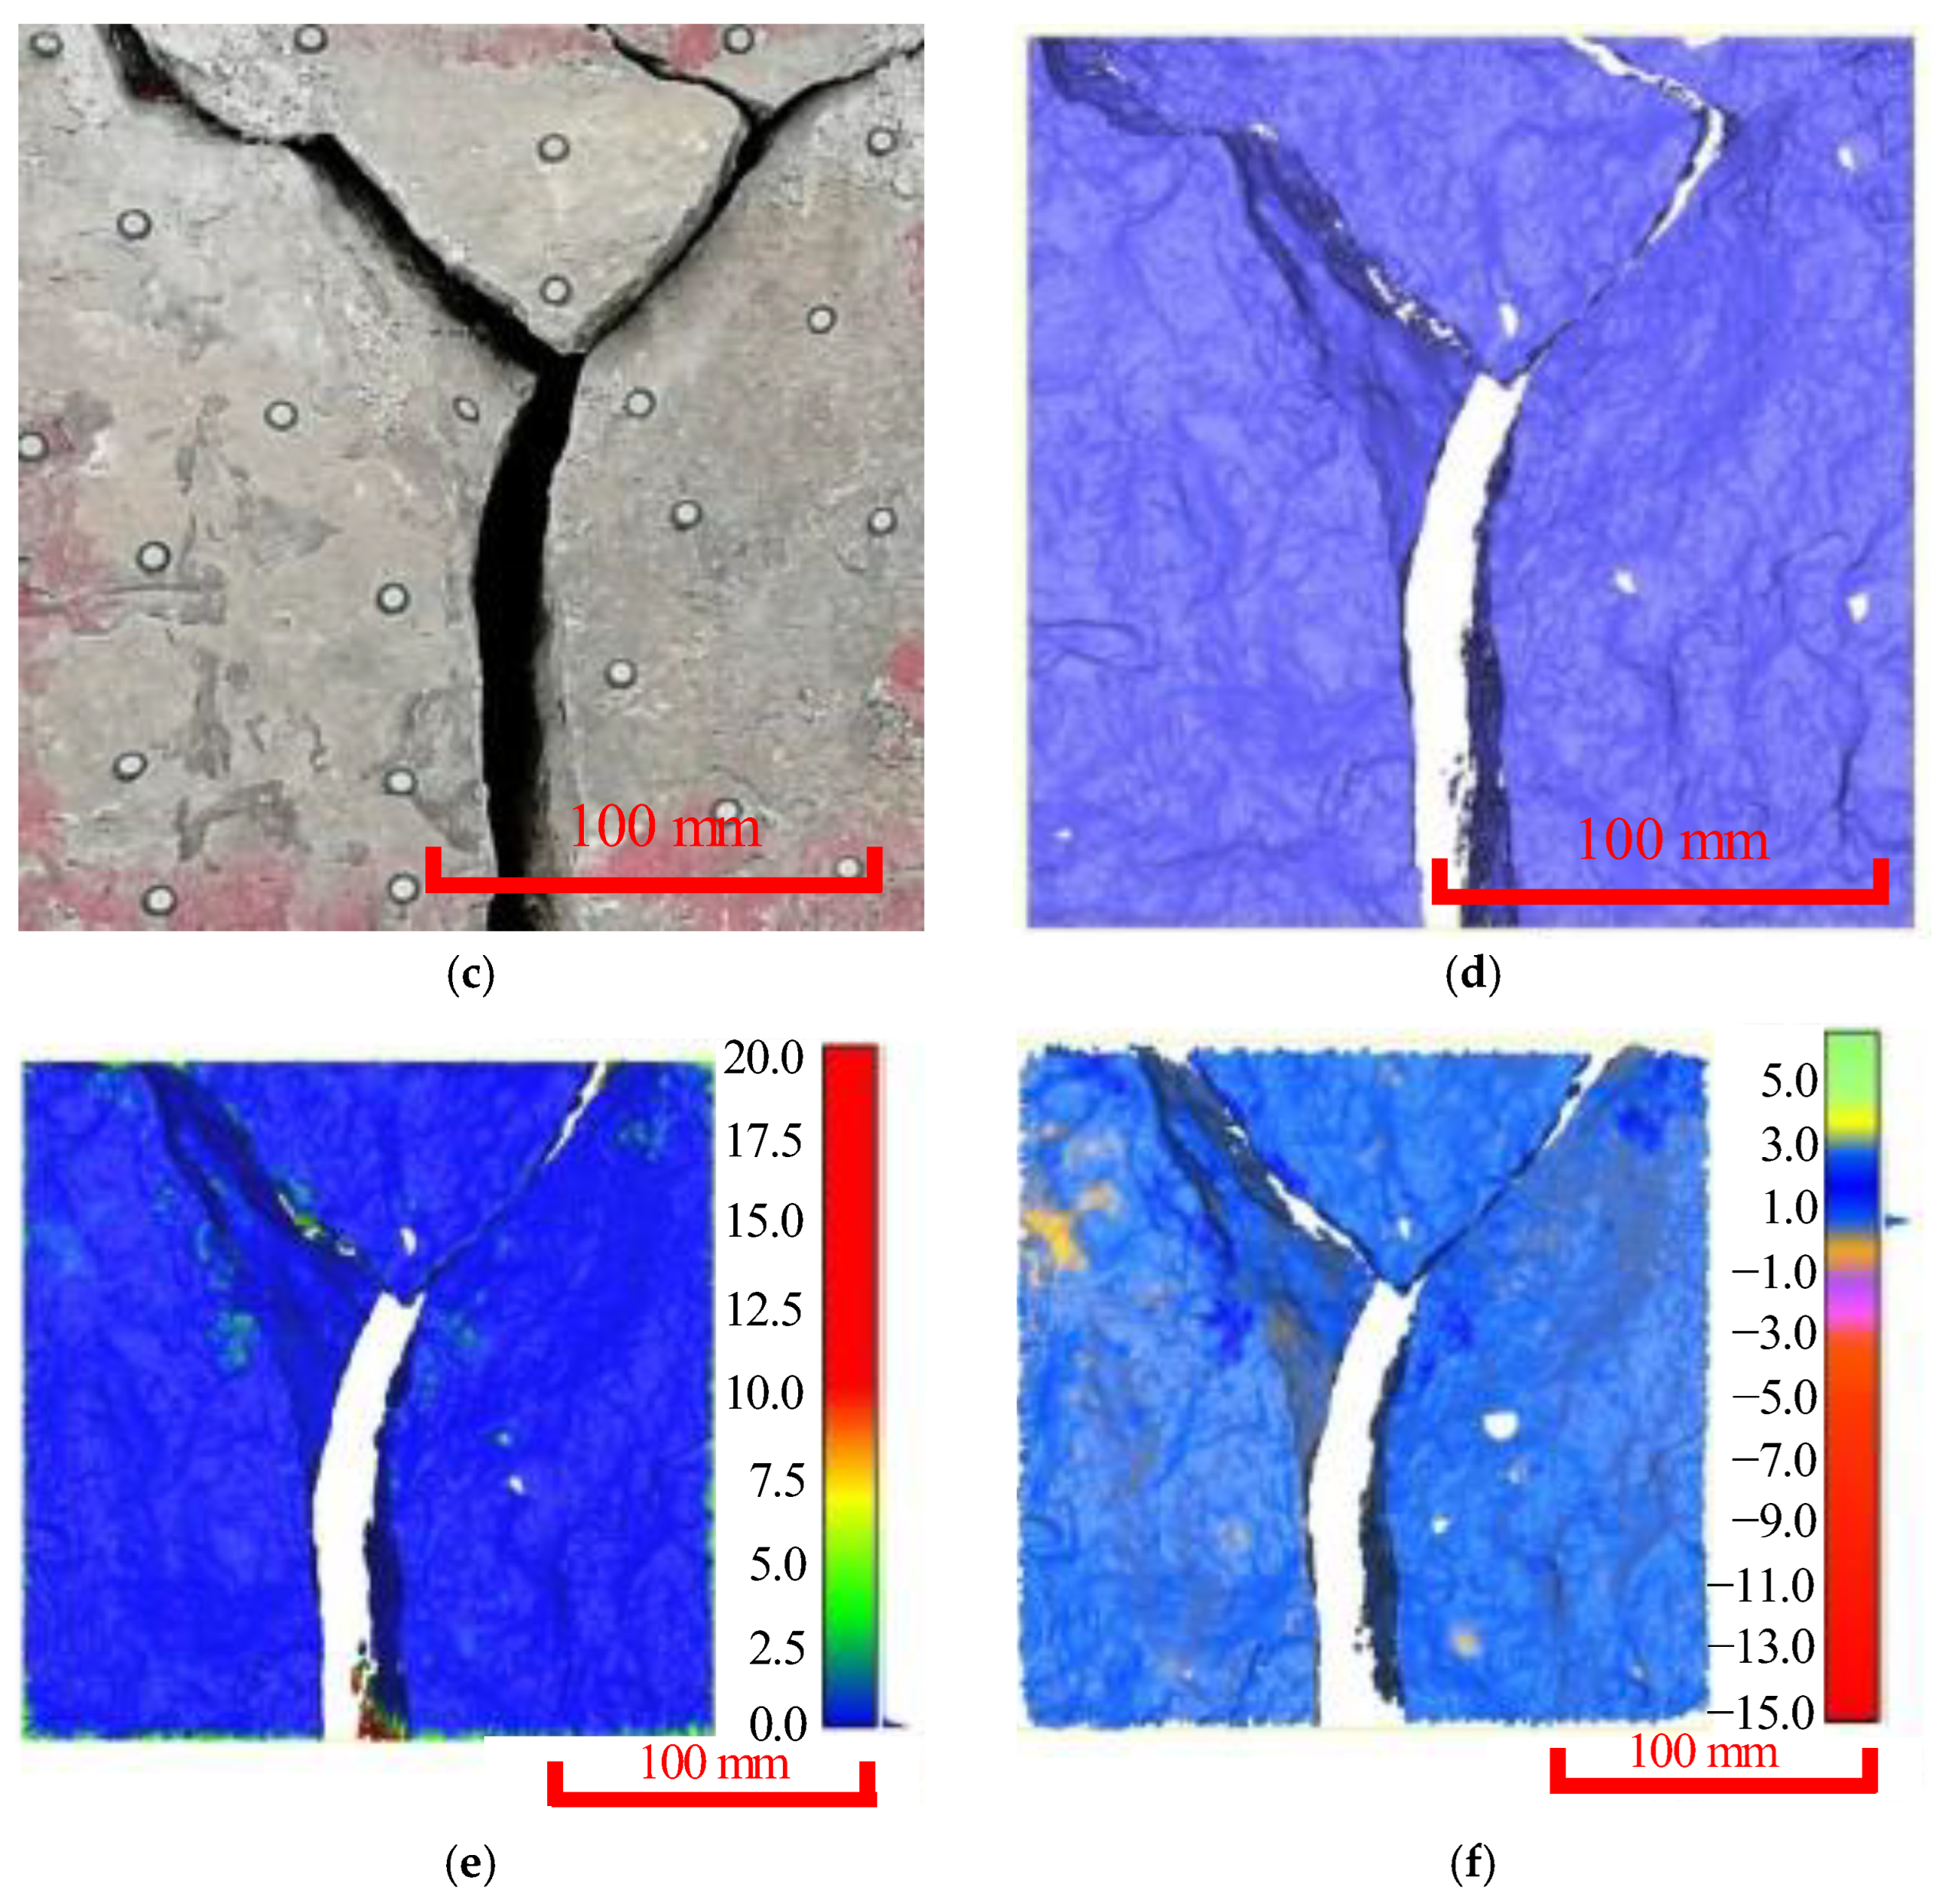
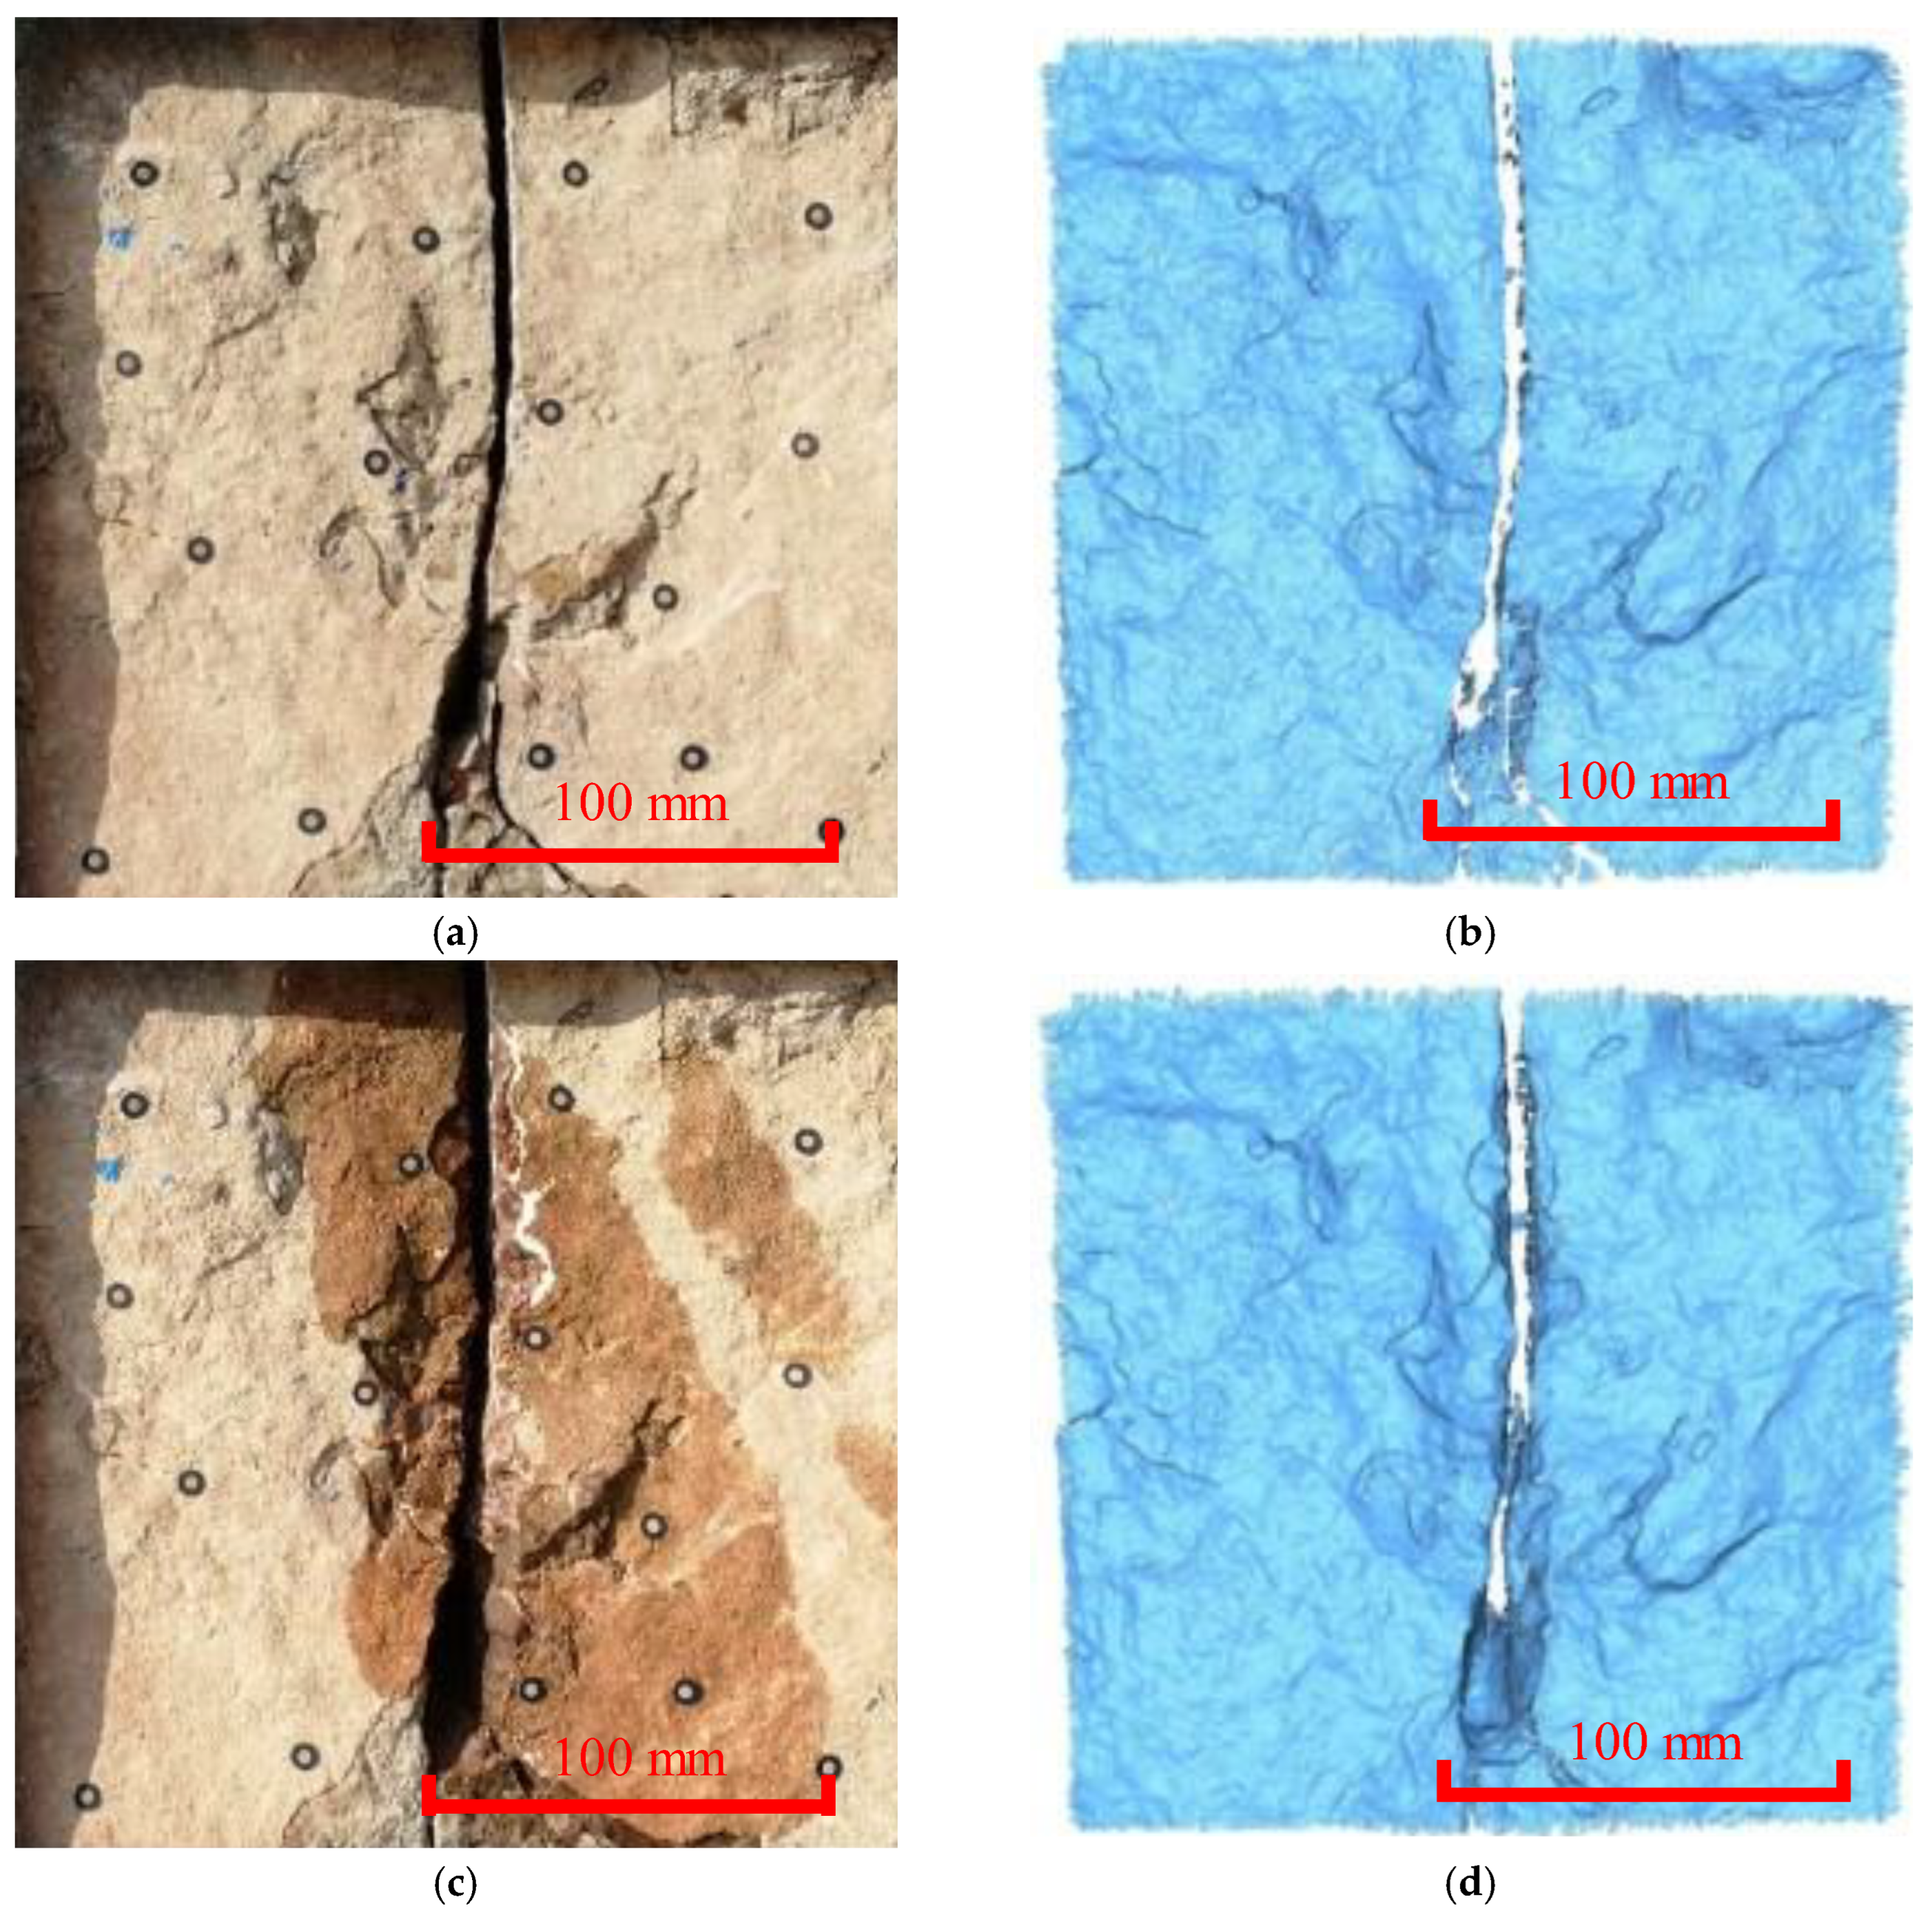
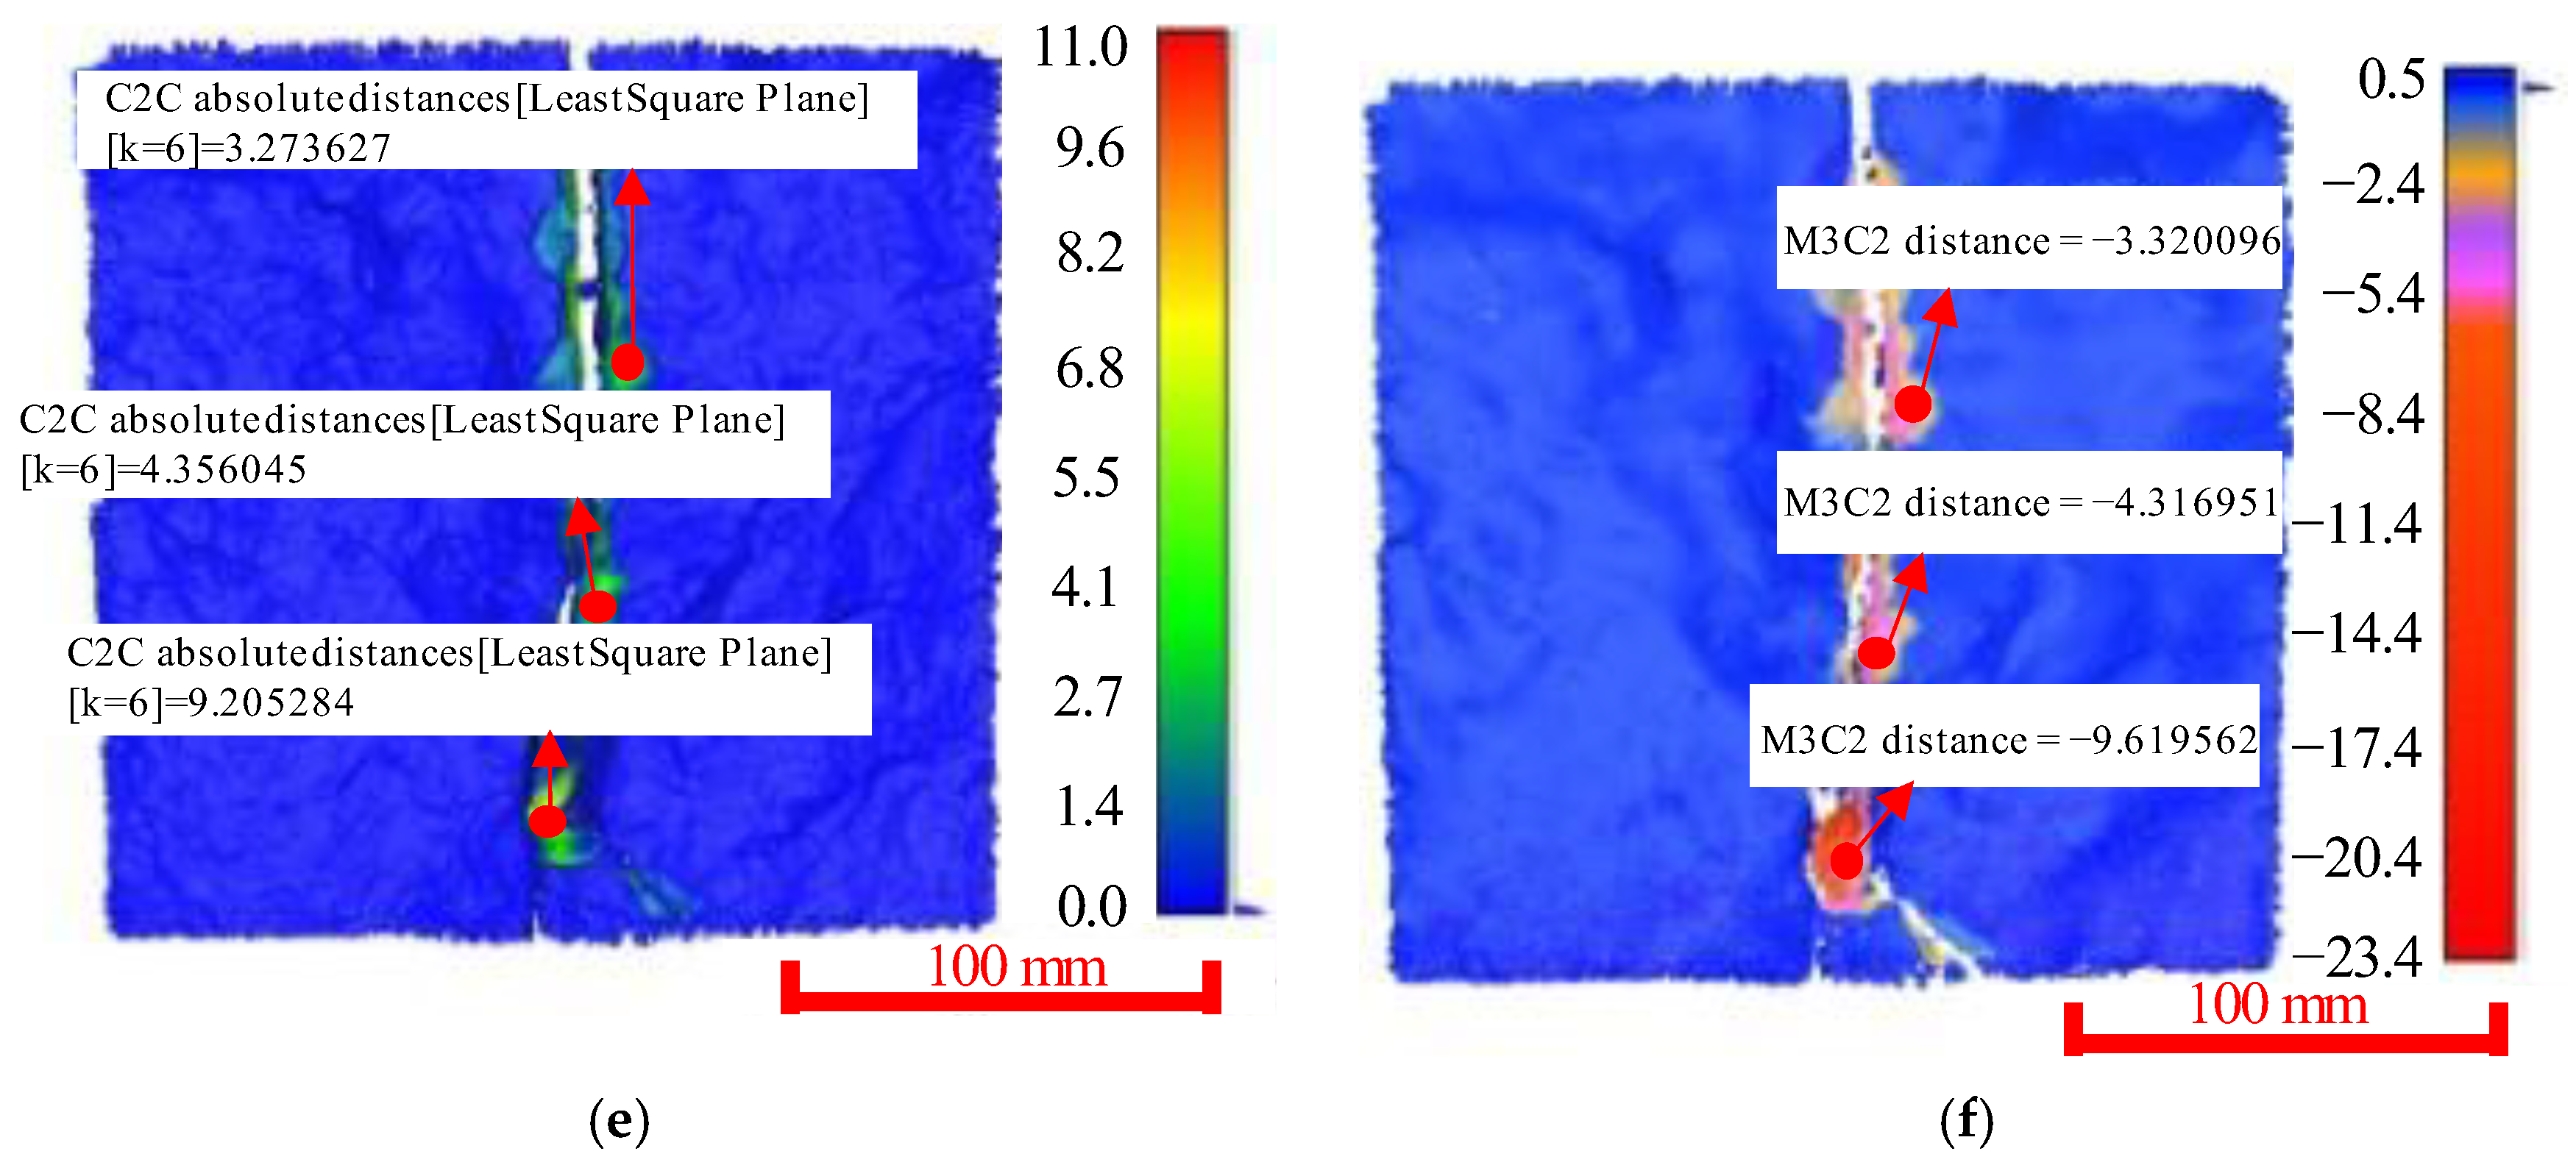
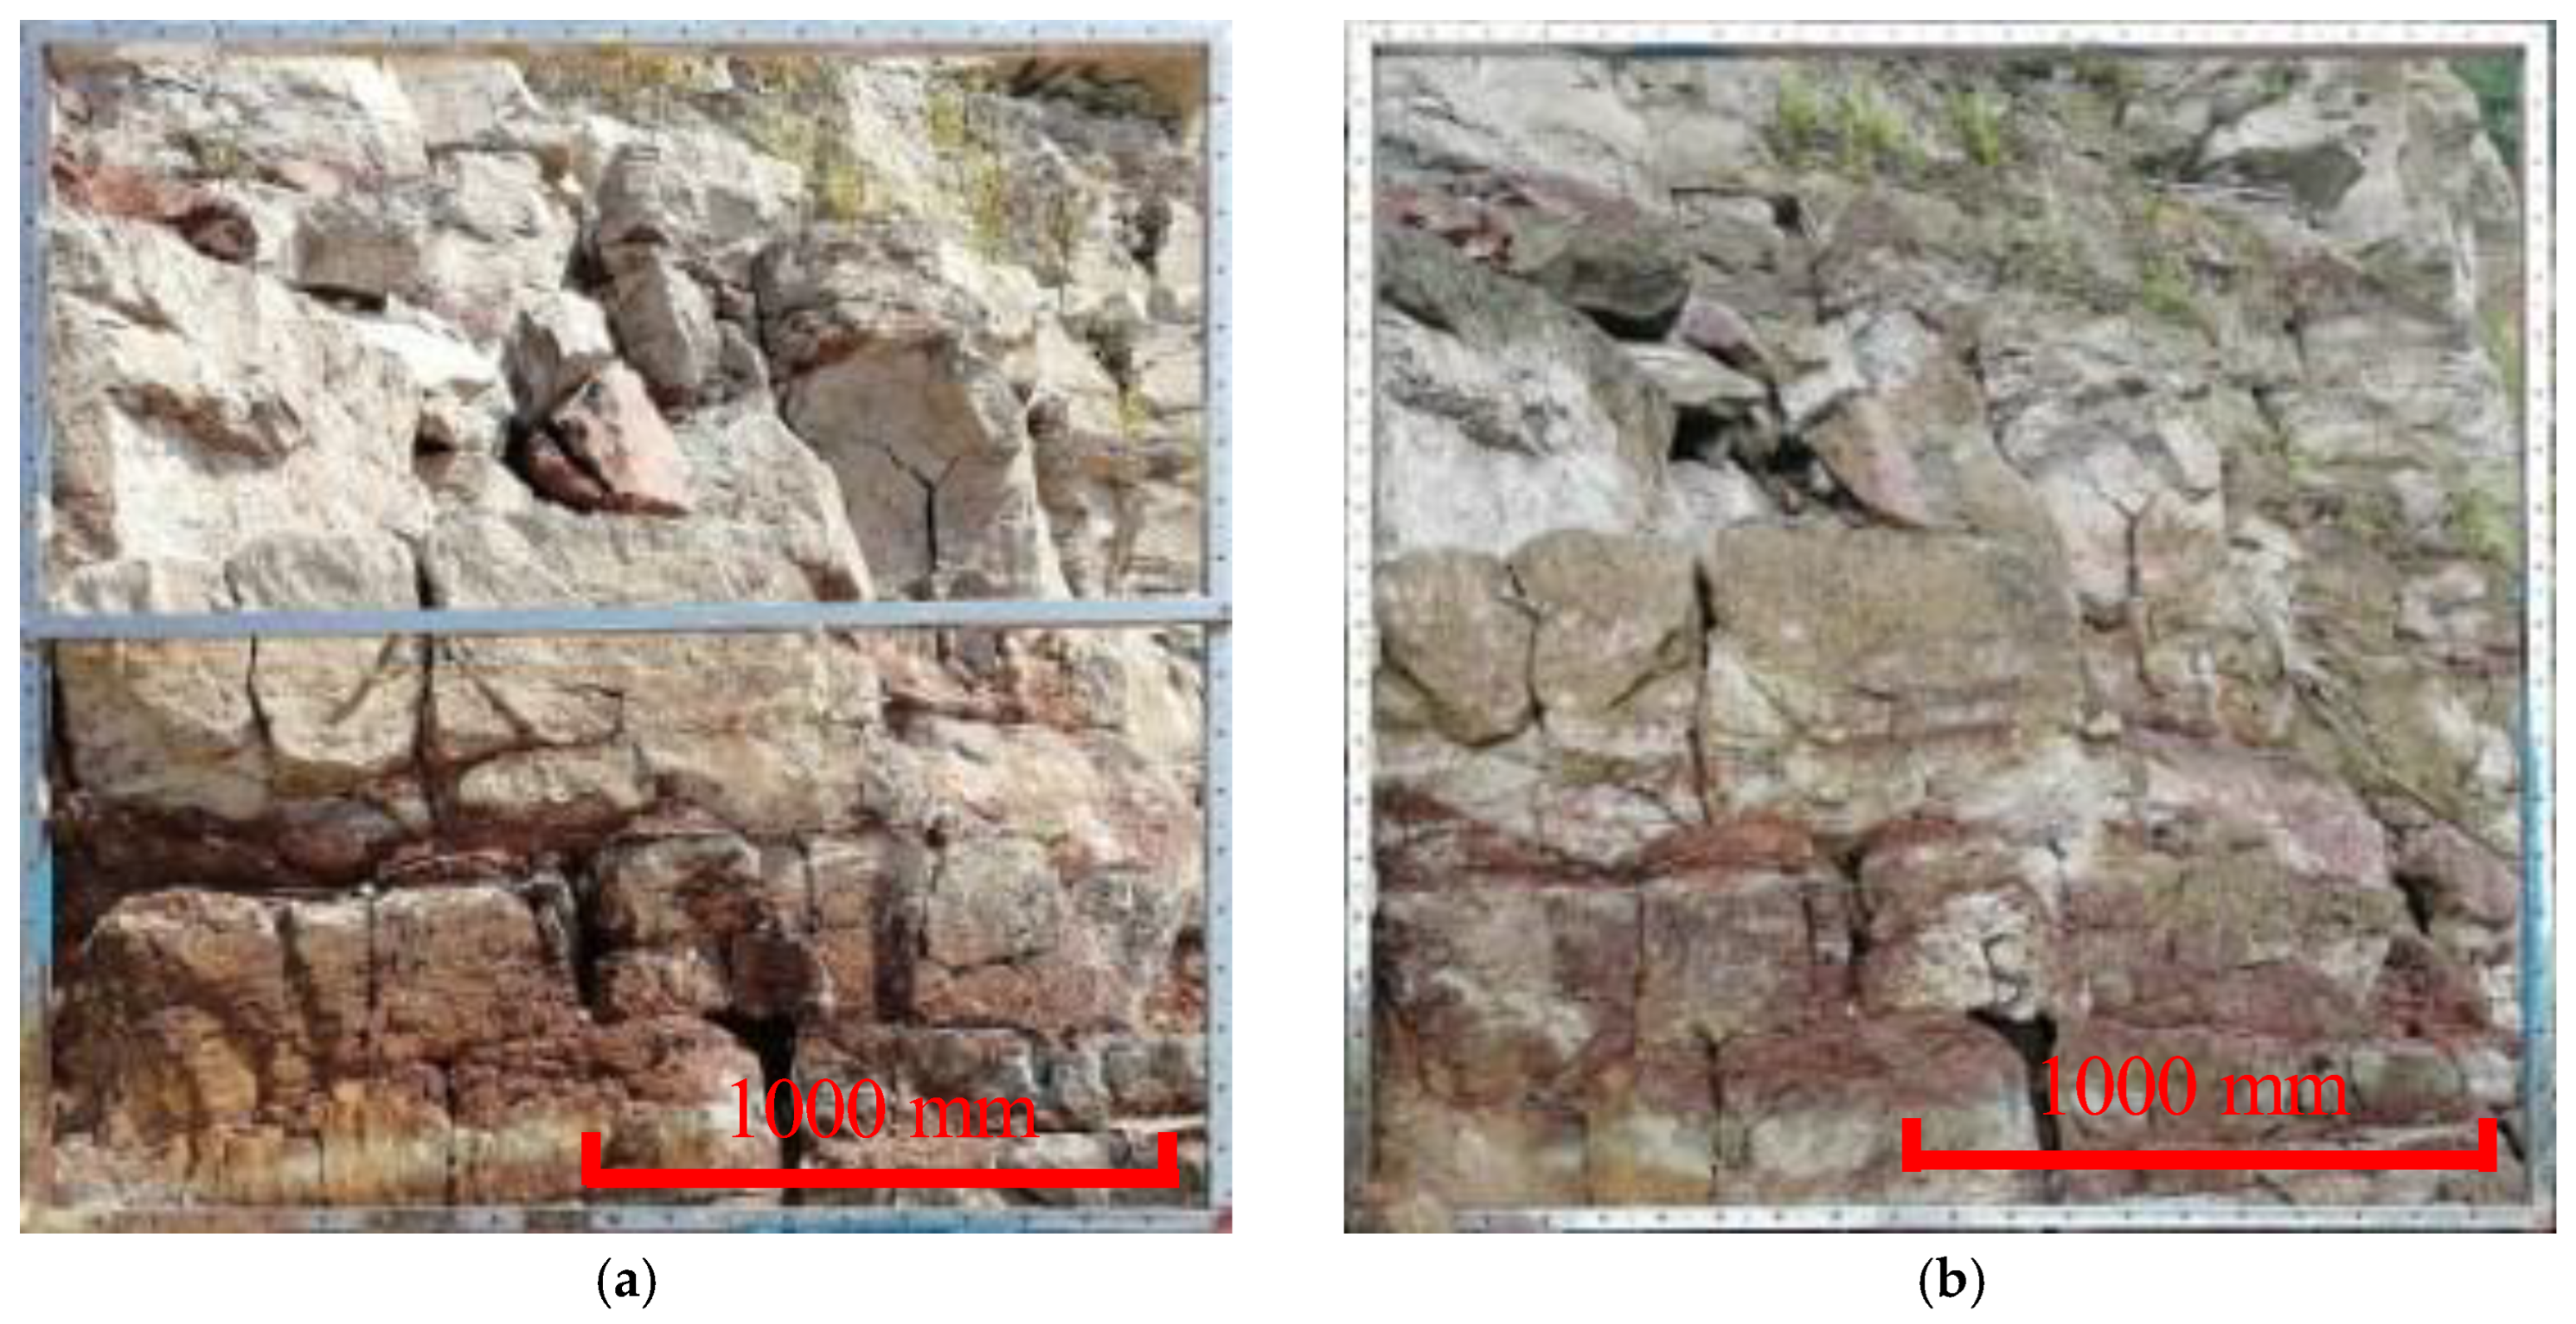
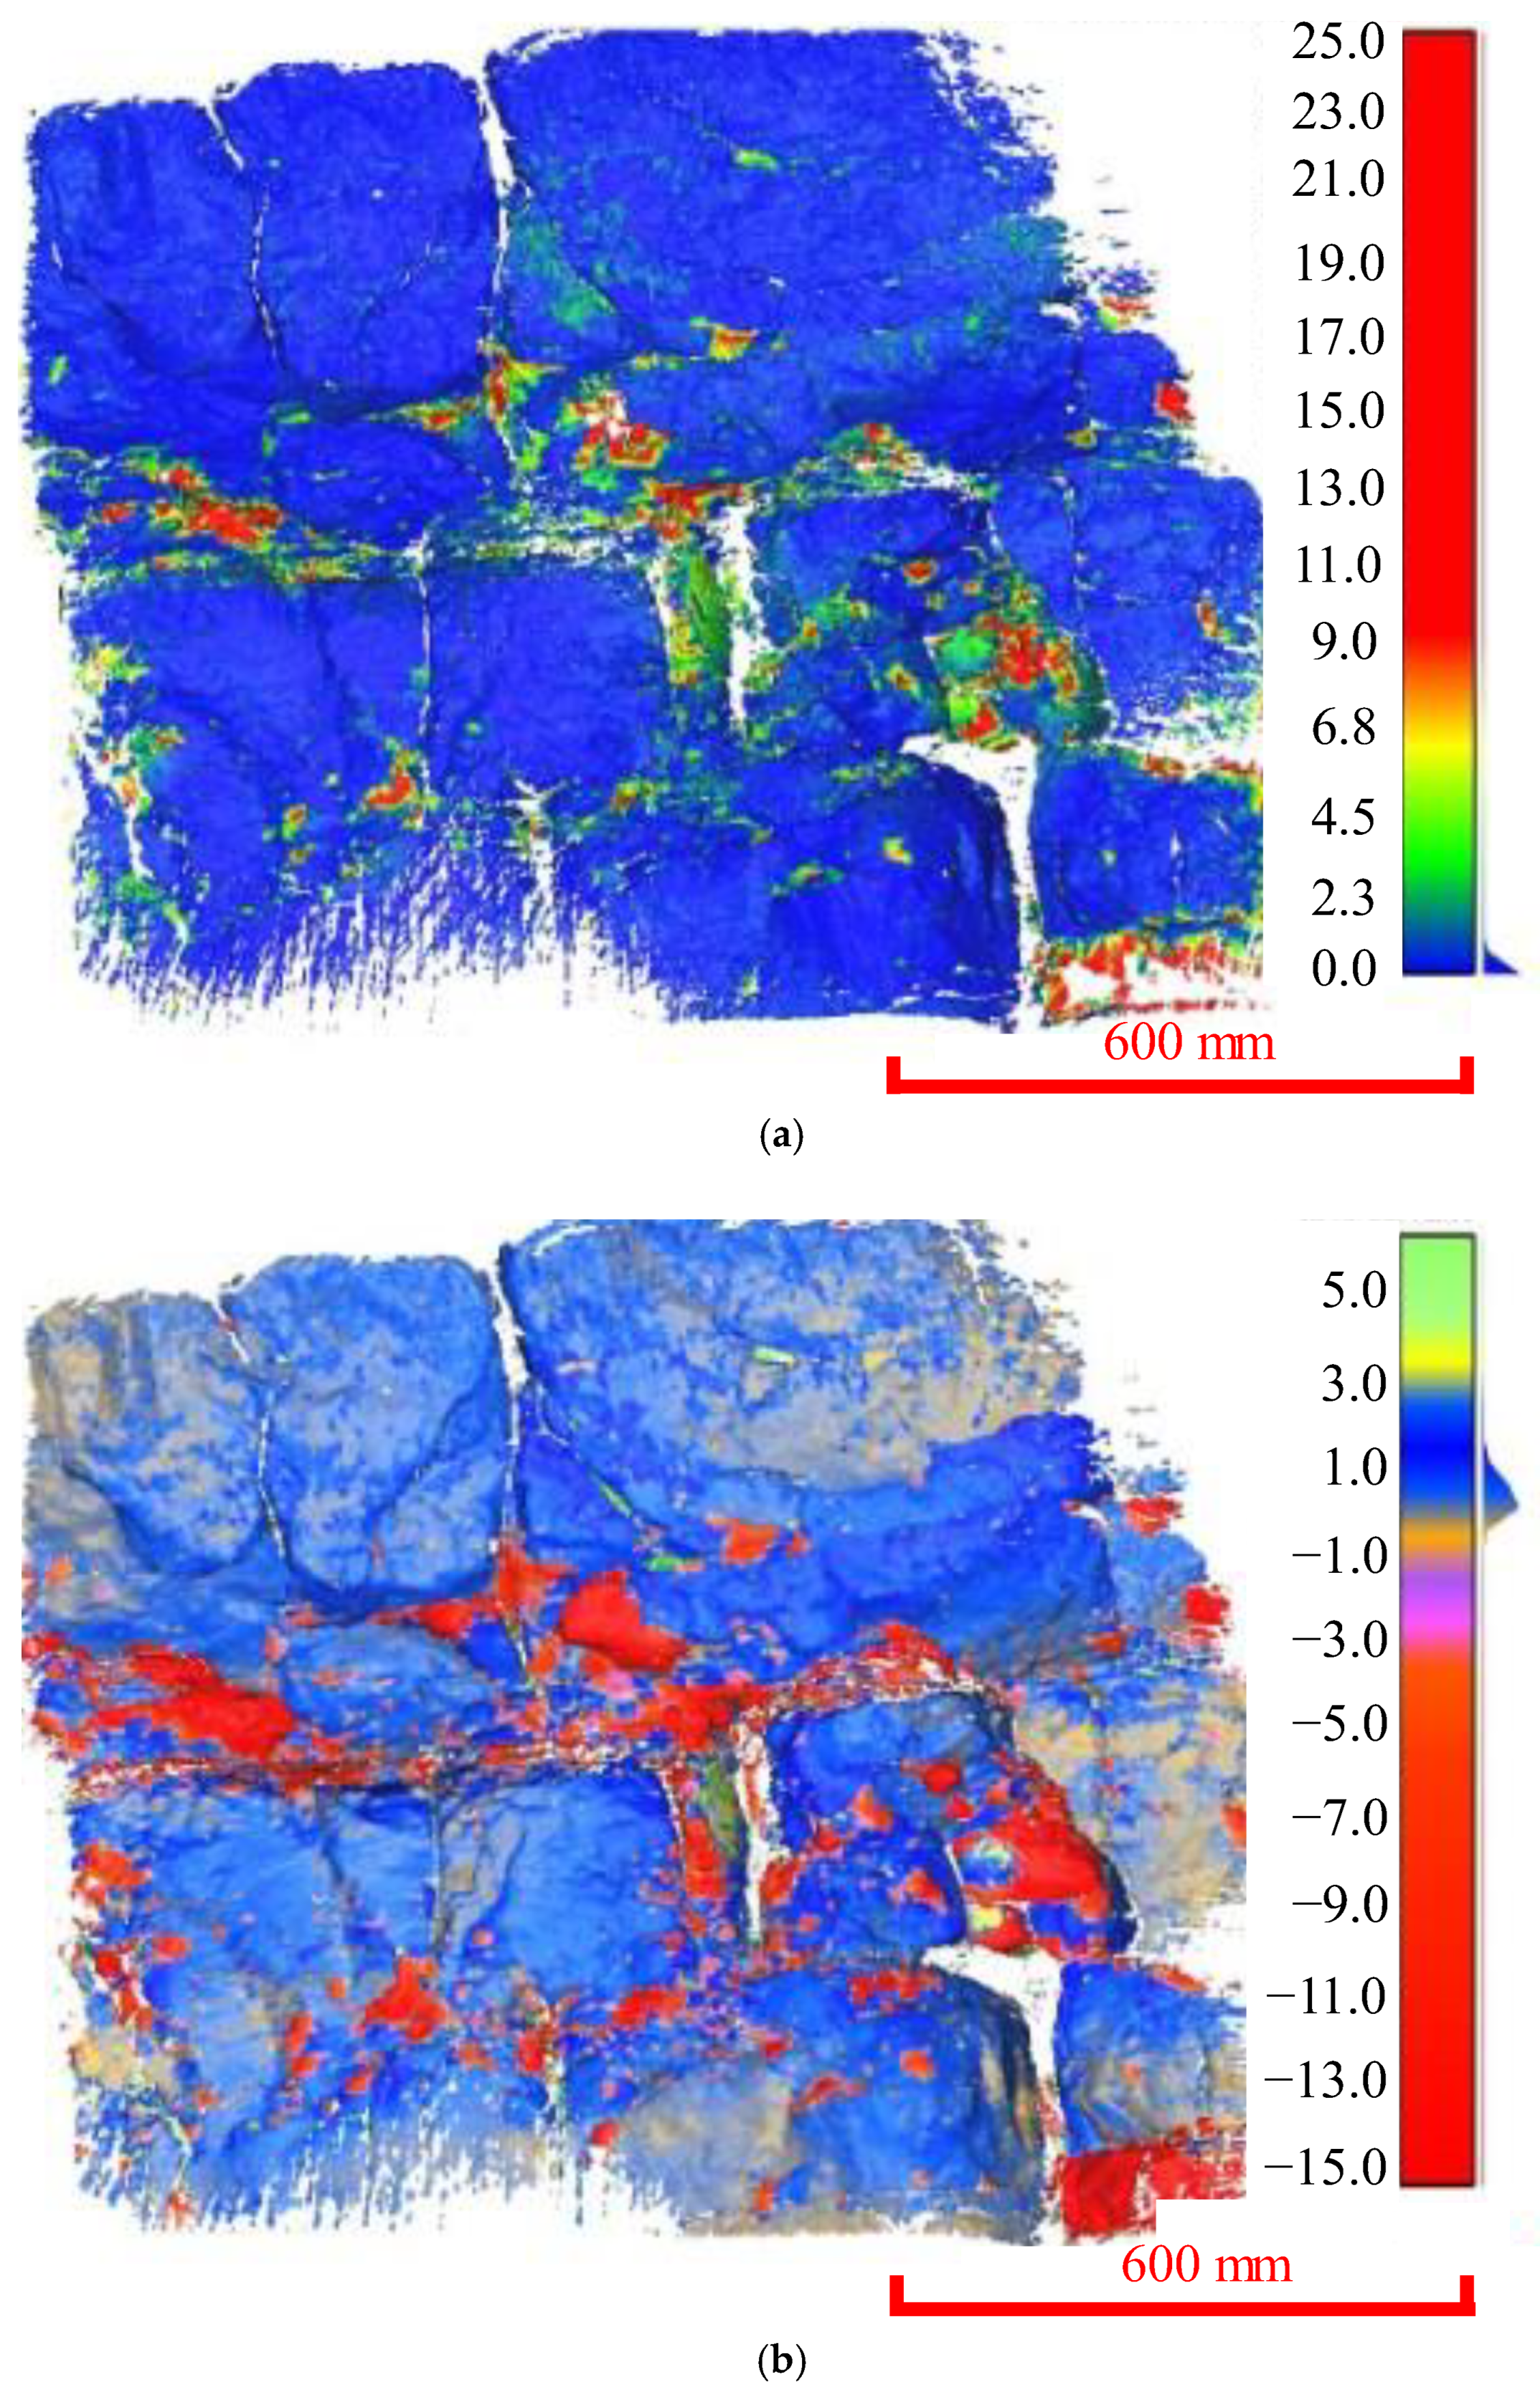
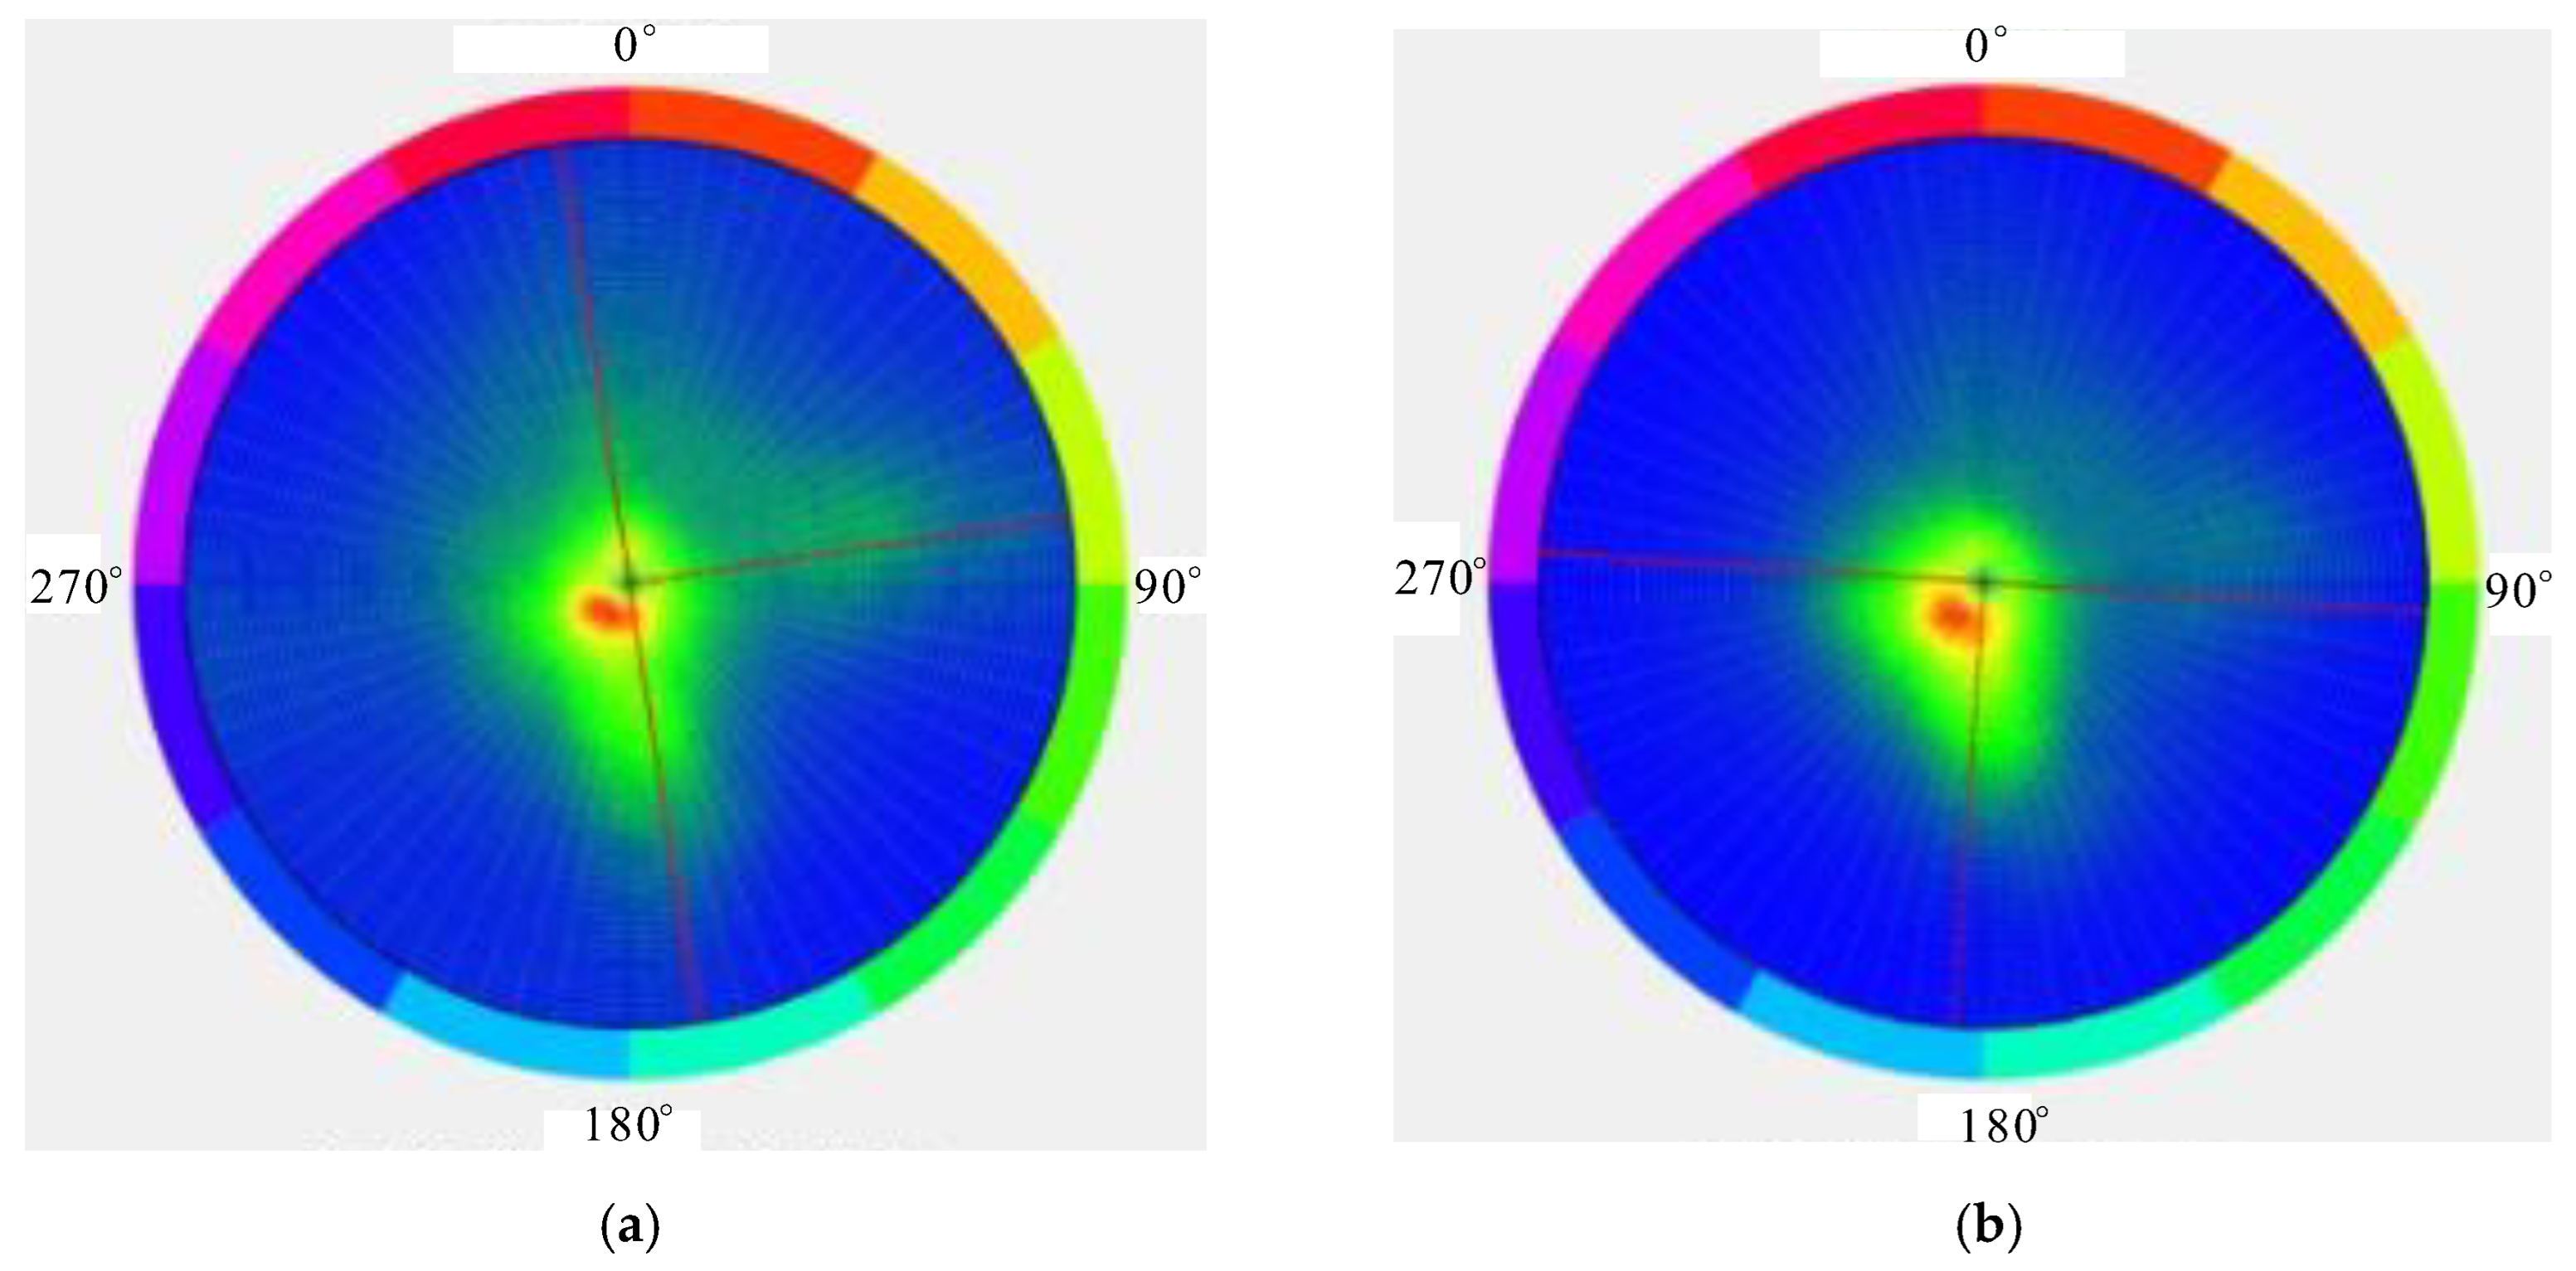
3.1. The Measurement Scale of 0.2 m
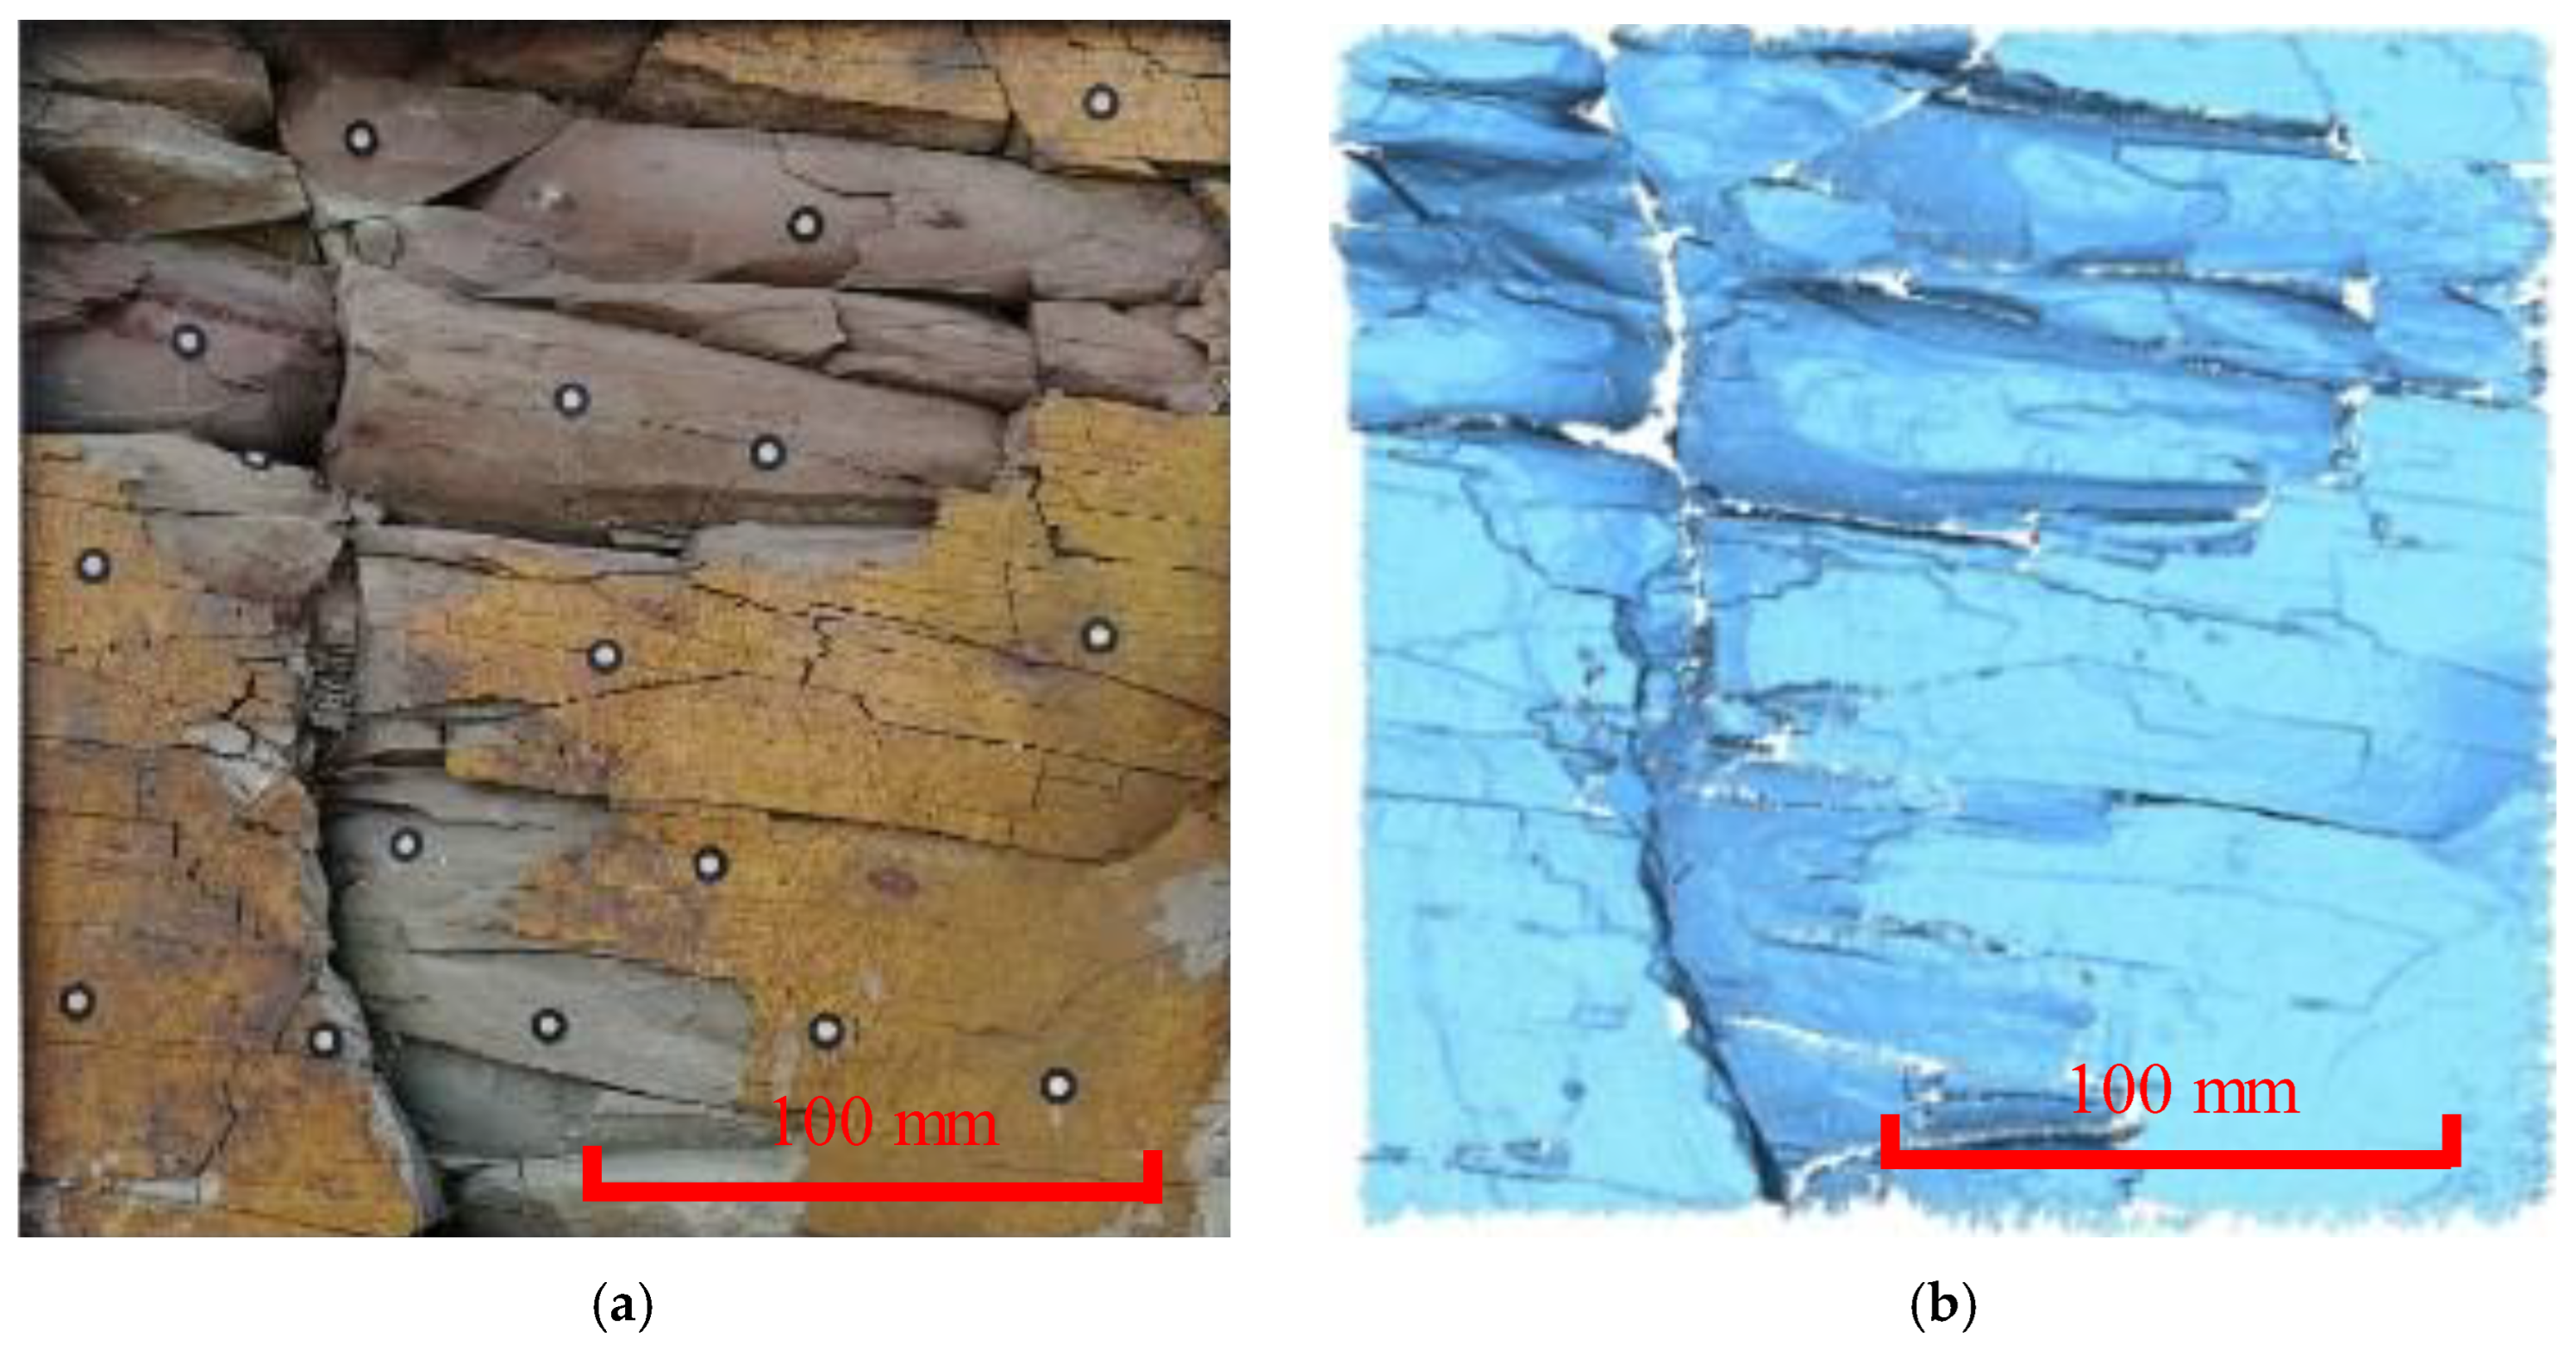
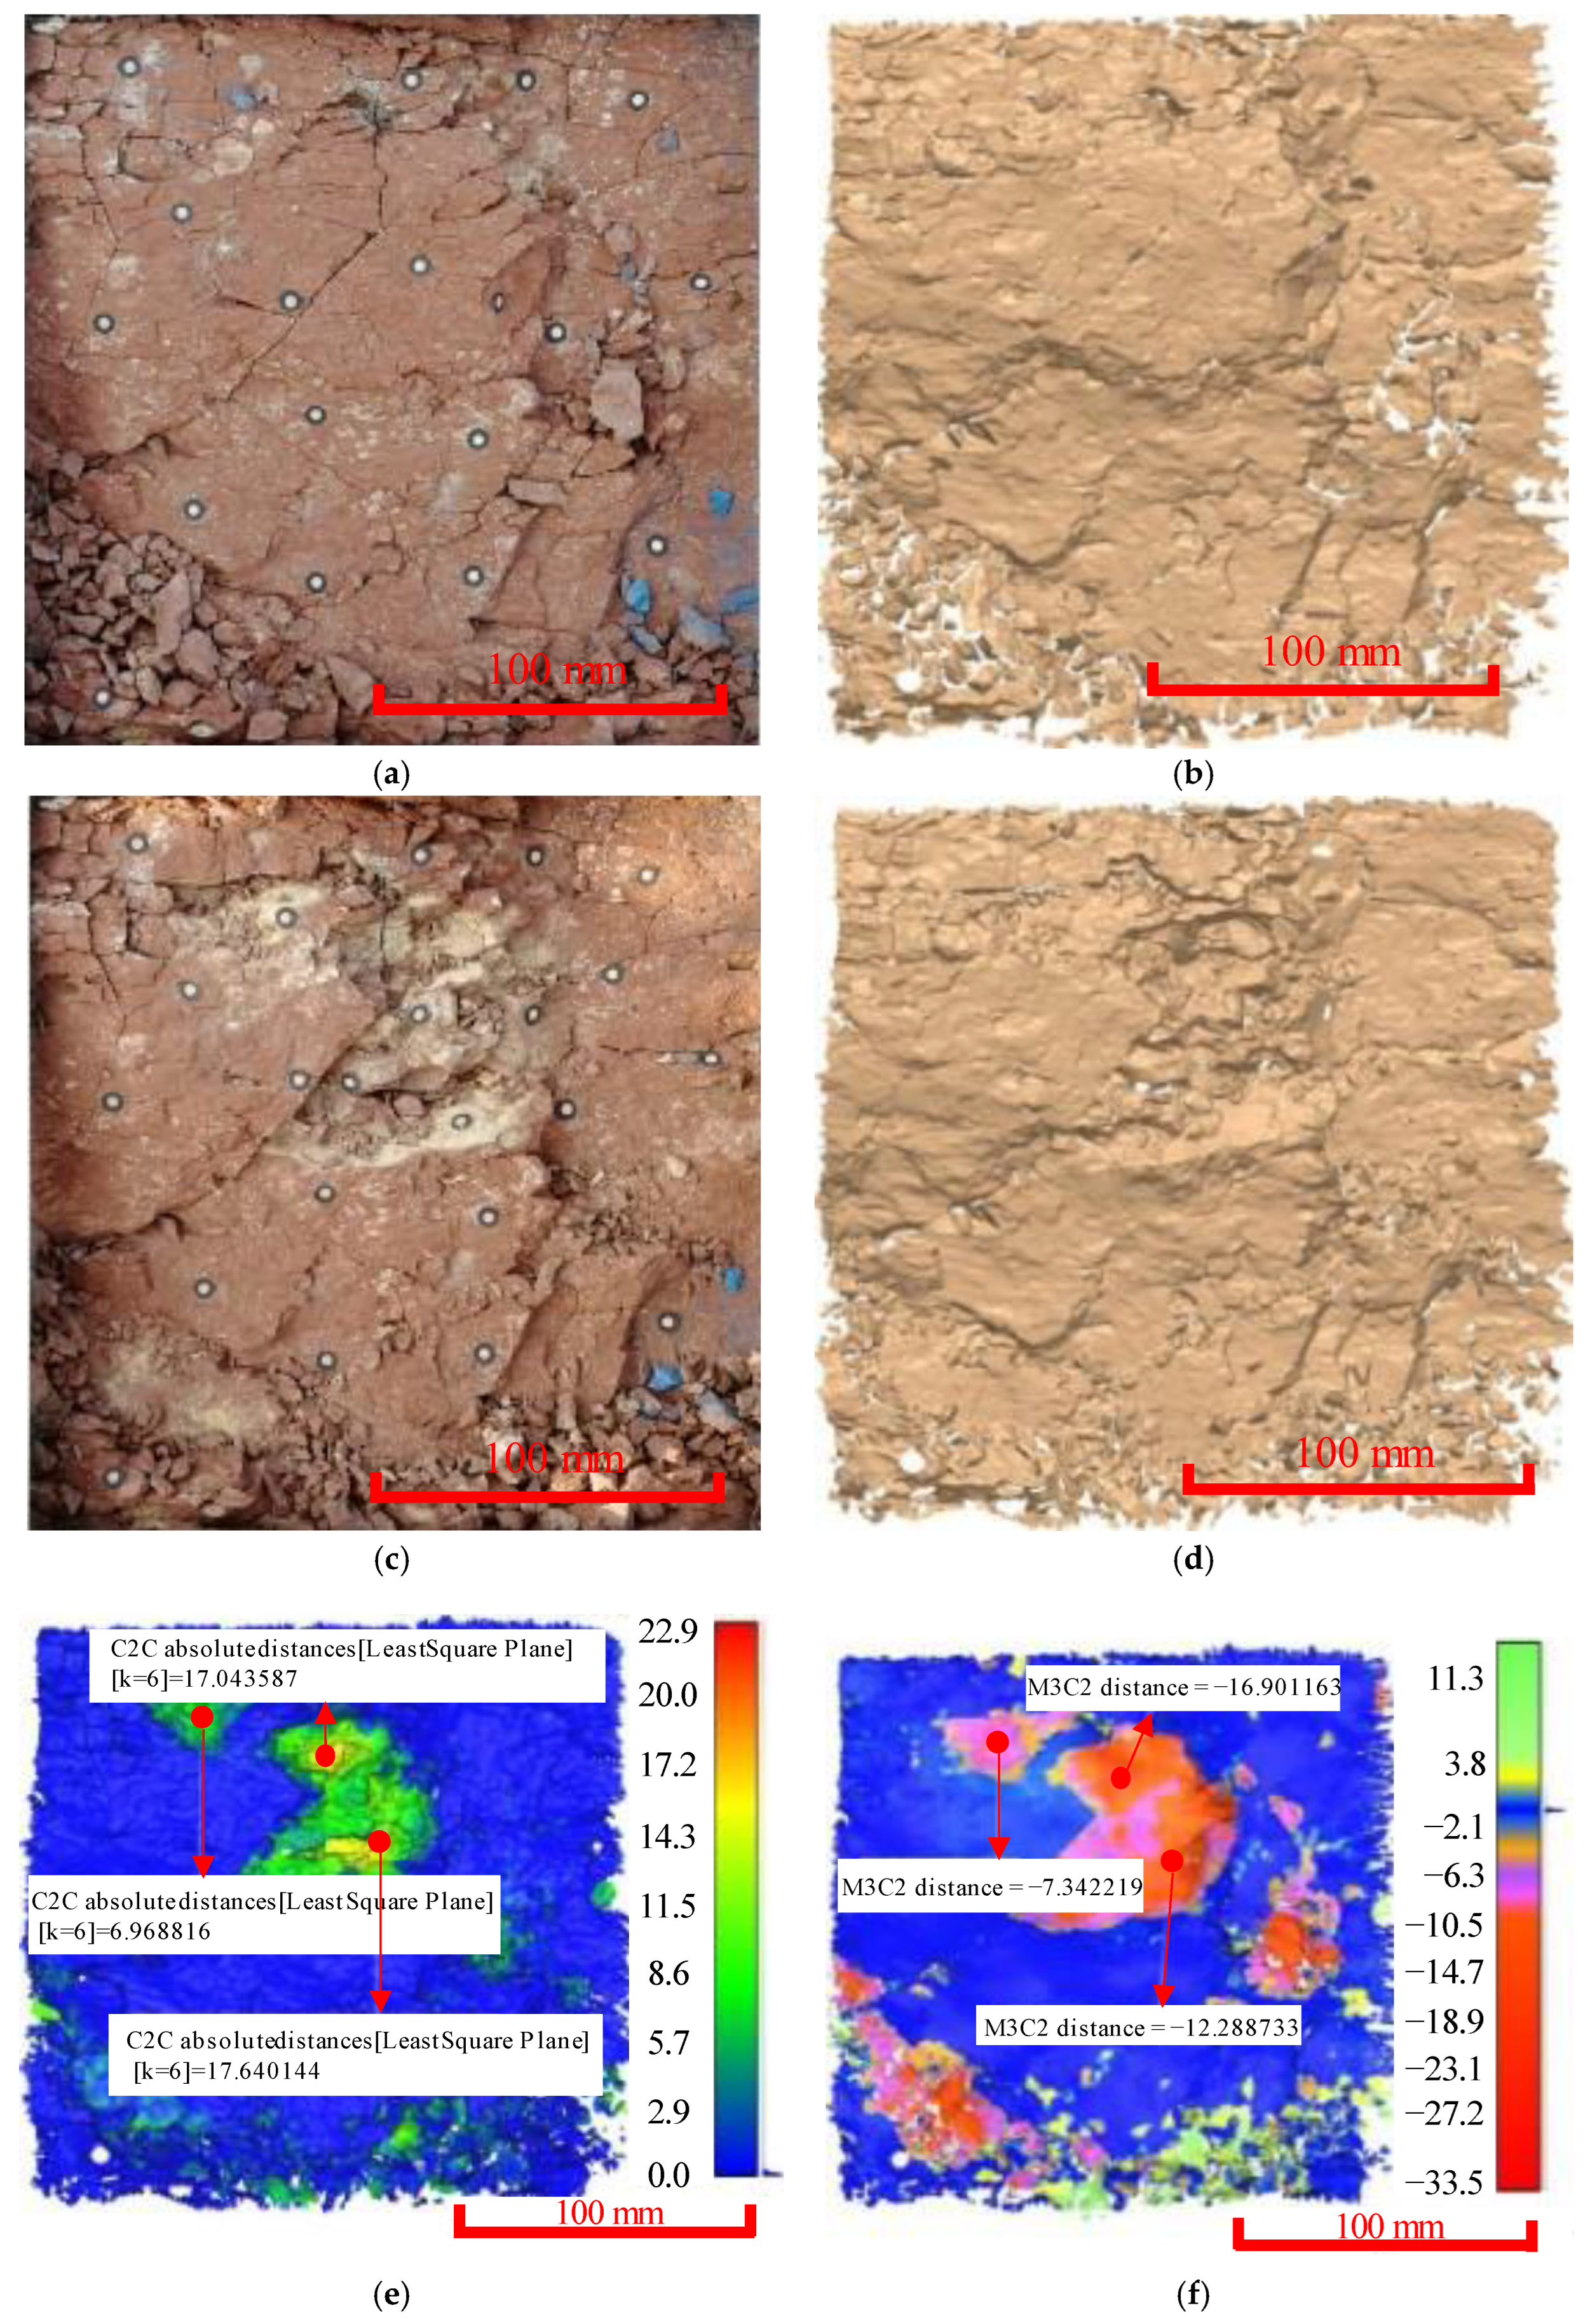
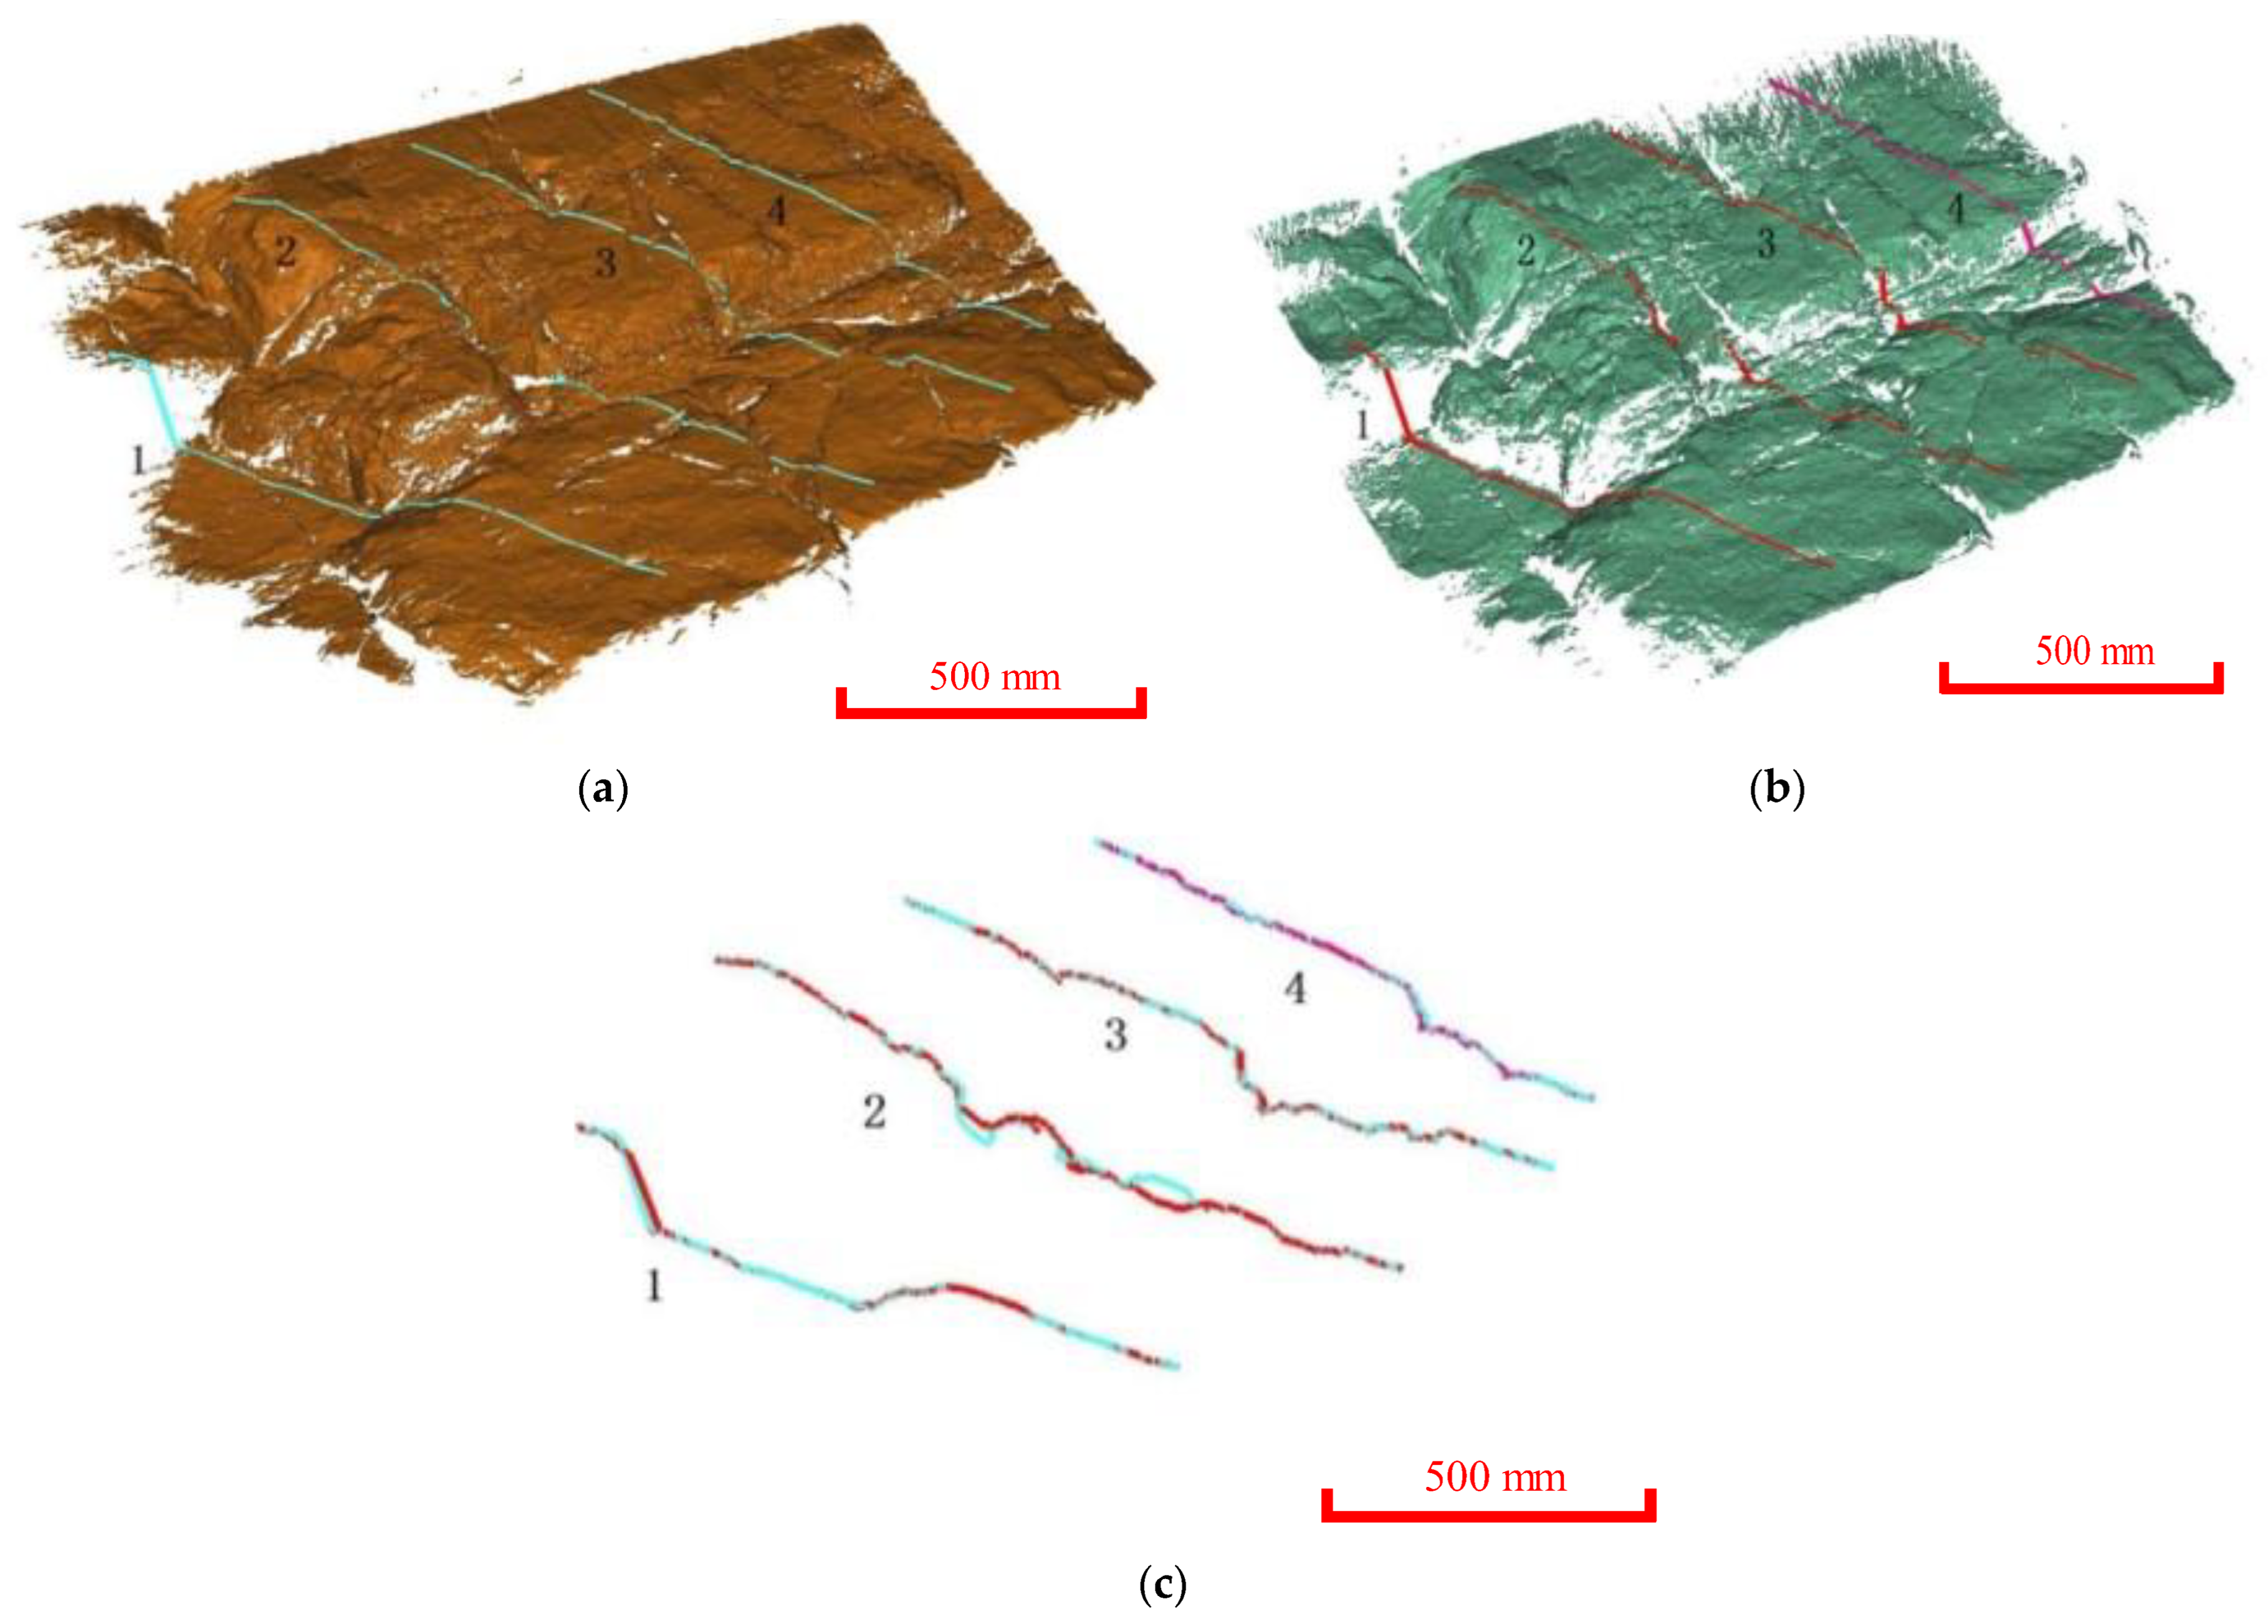
3.2. The Mesurement Scale of 2 m
3.3. The Meaurement Scale of 100 m
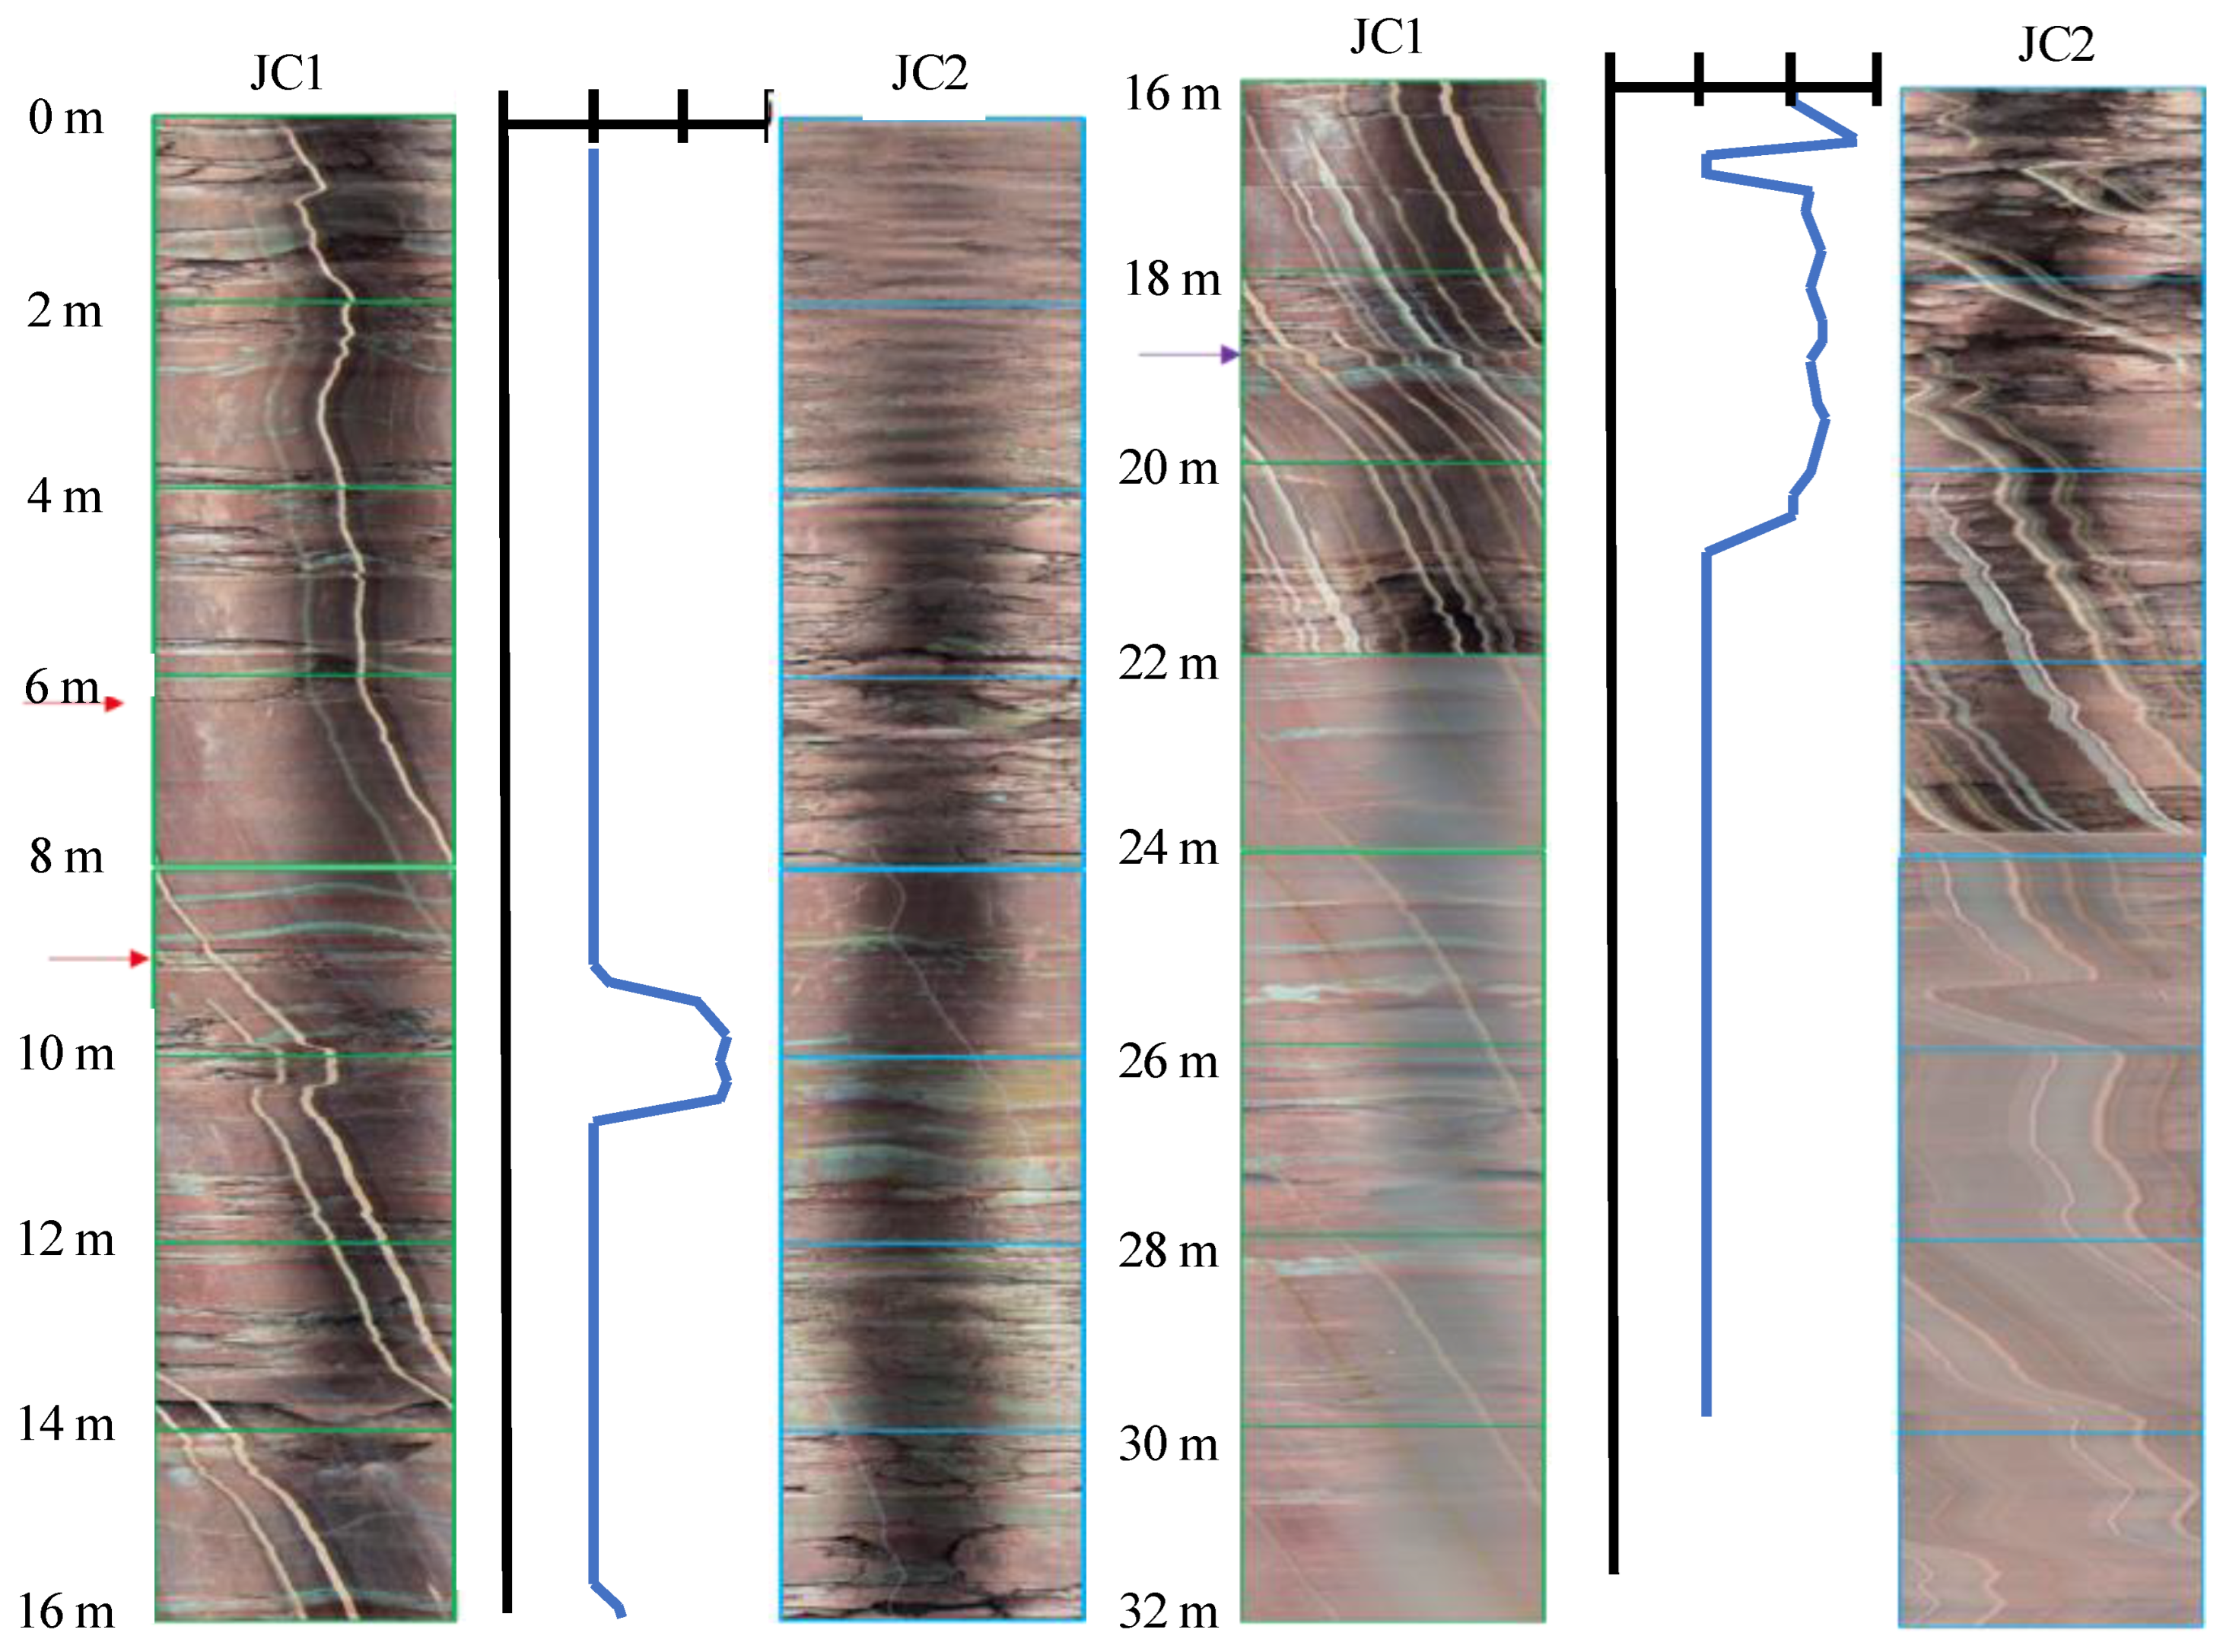
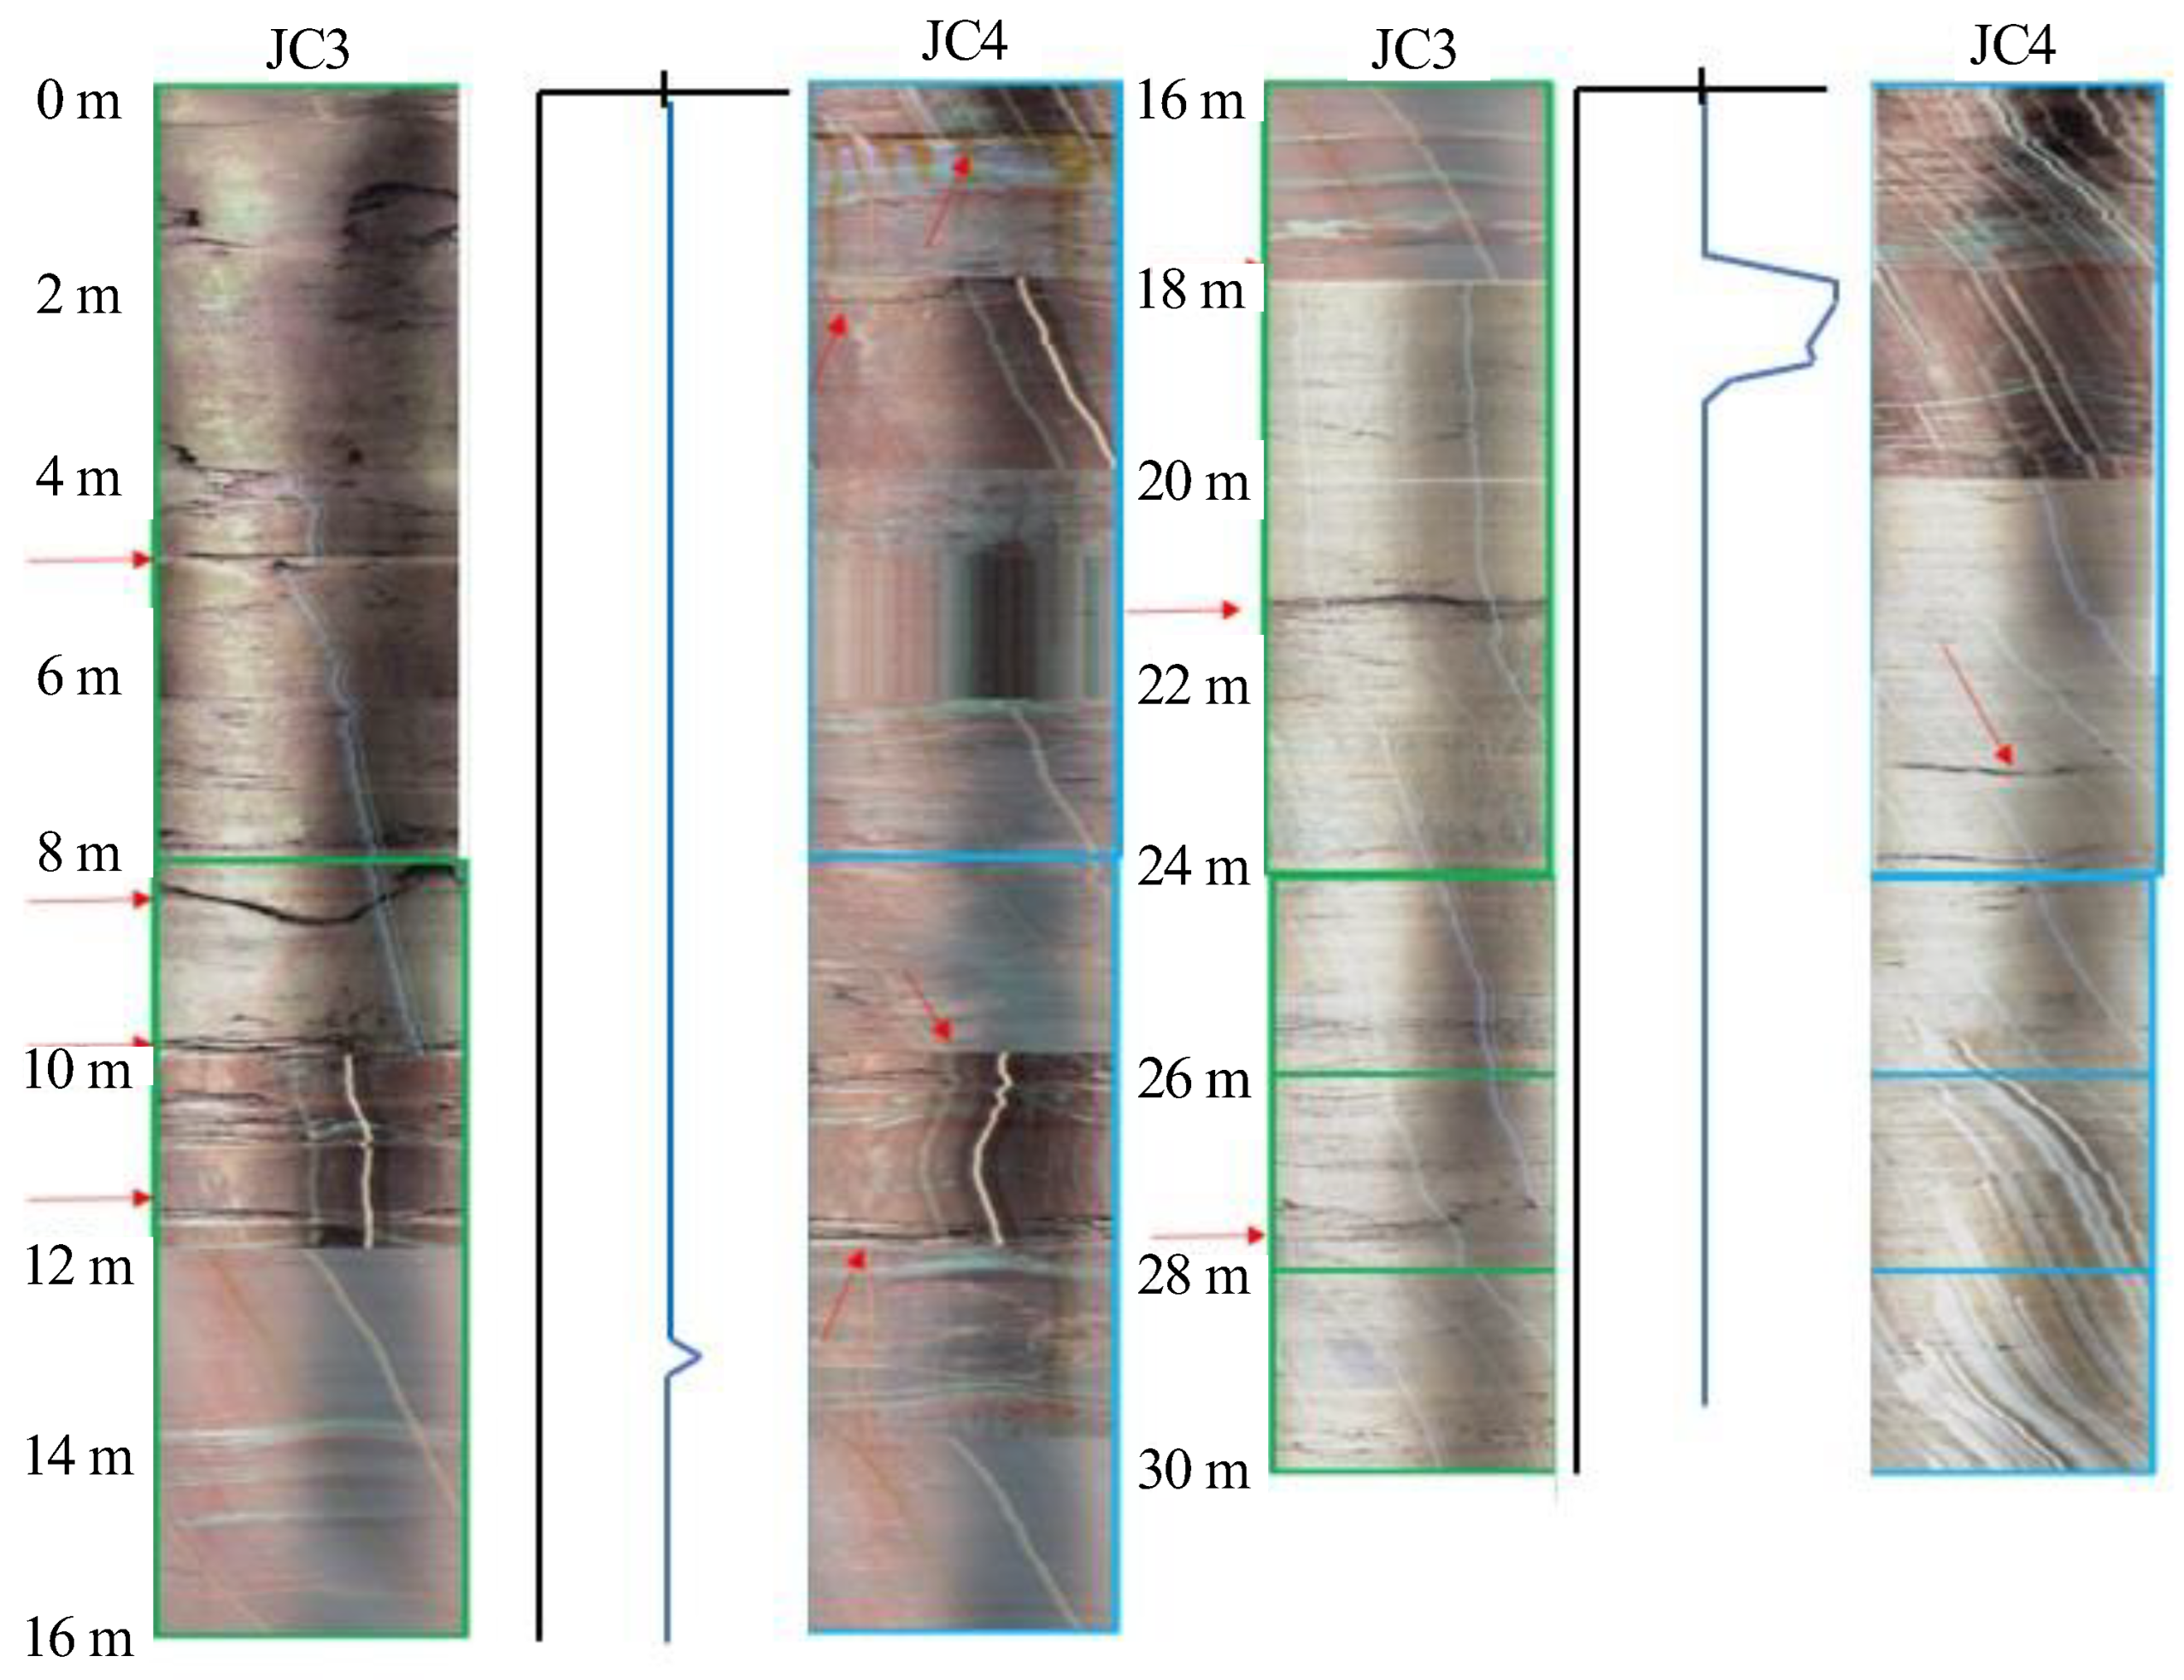
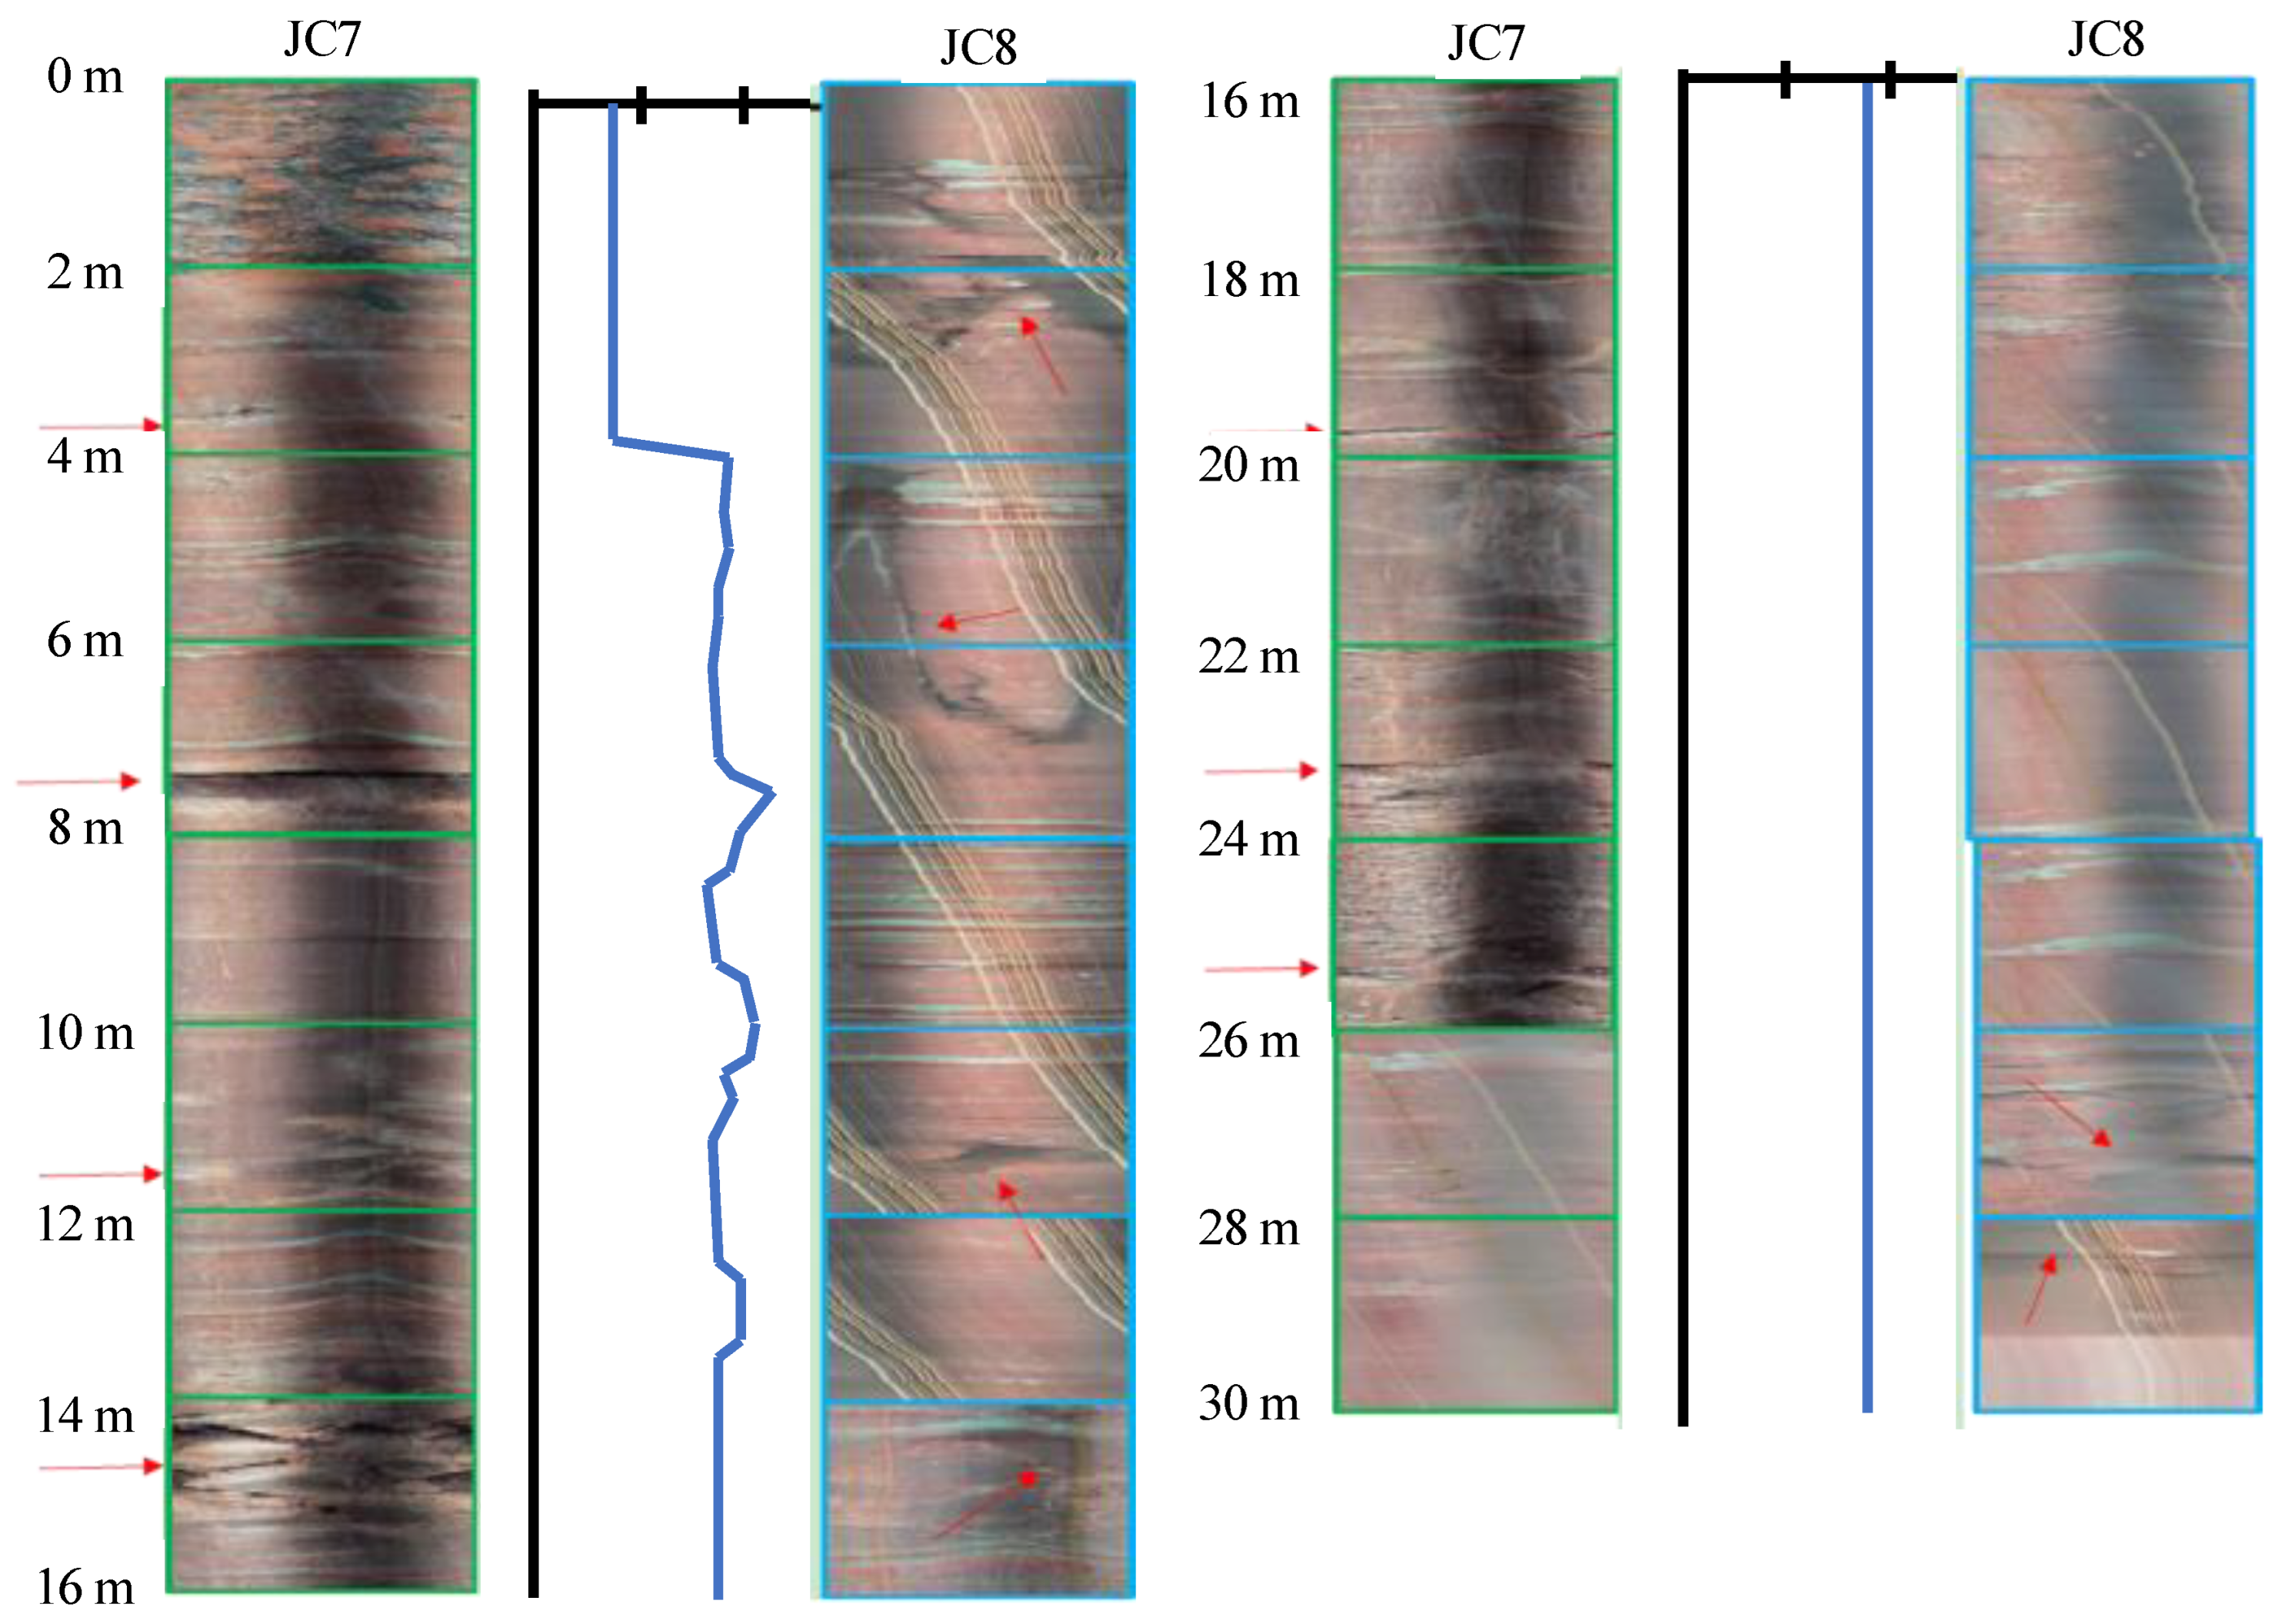
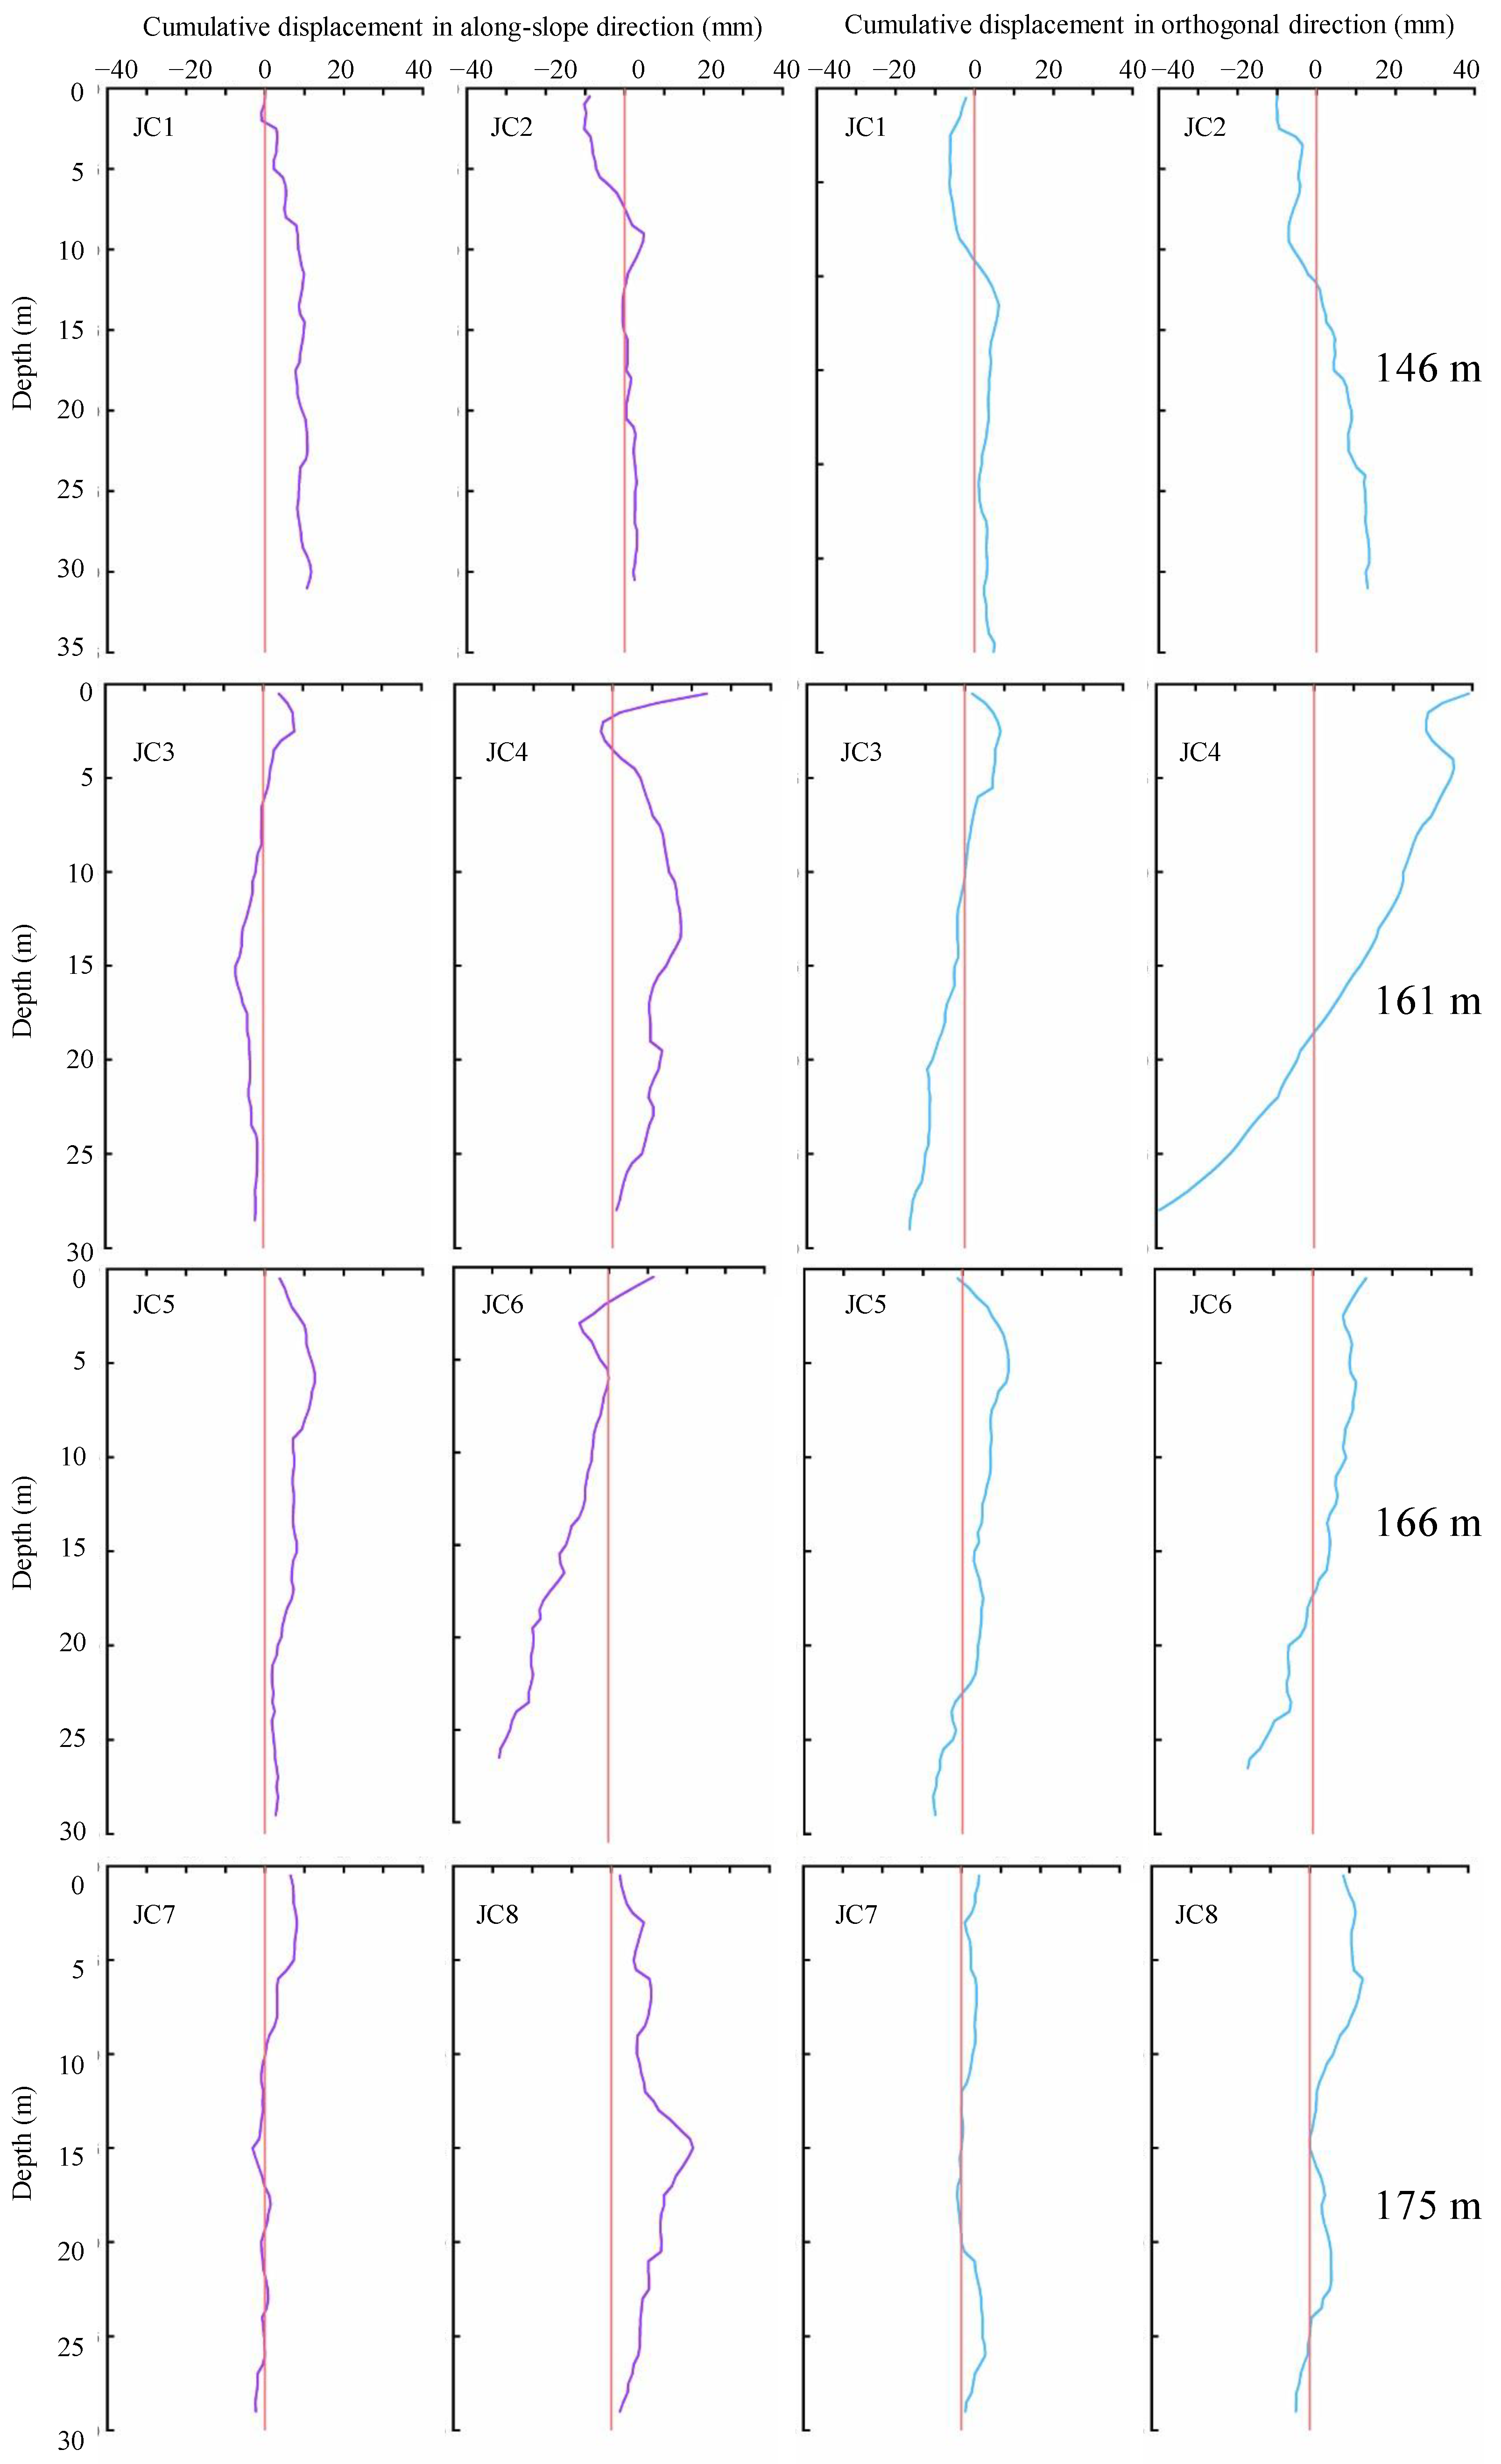
4. Acoustic Detection in Cross-Boreholes and Inclinometer Tests
5. Discussion
6. Conclusions
Author Contributions
Funding
Institutional Review Board Statement
Informed Consent Statement
Data Availability Statement
Conflicts of Interest
References
- Zhou, C.; Yin, K.; Cao, Y.; Ahmed, B. Application of time series analysis and PSO-SVM model in predicting the Bazimen landslide in the Three Gorges Reservoir, China. Eng. Geol. 2016, 204, 108–120. [Google Scholar] [CrossRef]
- Zhang, Z.; Liu, Y.; Li, Y.; Wang, X.; Li, H.; Yang, H.; Ding, W.; Liao, Y.; Tang, N.; He, F. Lake ecosystem health assessment using a novel hybrid decision-making framework in the Nam Co, Qinghai-Tibet Plateau. Sci. Total Environ. 2022, 808, 152087. [Google Scholar] [CrossRef] [PubMed]
- Zhou, C.; Ma, W.; Sui, W. Transparent soil model test of a landslide with umbrella-shaped anchors and different slope angles in response to rapid drawdown. Eng. Geol. 2022, 307, 106765. [Google Scholar] [CrossRef]
- Gong, W.; Juang, C.; Wasowski, J. Geohazards and human settlements: Lessons learned from multiple relocation events in Badong, China-Engineering geologist’s perspective. Eng. Geol. 2021, 285, 106051. [Google Scholar] [CrossRef]
- Huang, B.; Yin, Y.; Yan, G.; Li, B.; Qin, Z.; Wang, J. A study on in situ measurements of carbonate rock mass degradation in the water-level fluctuation zone of the Three Gorges Reservoir, China. B Eng. Geol. Environ. 2021, 80, 1091–1101. [Google Scholar]
- Zhang, K.; Wang, L.; Dai, Z.; Huang, B.; Zhang, Z. Evolution trend of the Huangyanwo rock mass under the action of reservoir water fluctuation. Nat. Hazards 2022, 113, 1583–1600. [Google Scholar] [CrossRef]
- Zhang, Q.; Huang, B.; Chen, X.; Wang, J. Research on Deformation Mechanism Transformation of Jurassic Consequent Bank Slope Based on Thickness Variation of Deposition Layer. Geol. Miner. Resour. South China 2019, 35, 354–360. [Google Scholar]
- Leue, M.; Gerke, H.; Ellerbrock, R. Millimetre-scale distribution of organic matter composition at intact biopore and crack surfaces. Eur. J. Soil Sci. 2013, 64, 757–769. [Google Scholar] [CrossRef]
- Sun, J.; Huang, Y. Modeling the Simultaneous Effects of Particle Size and Porosity in Simulating Geo-Materials. Materials 2022, 15, 1576. [Google Scholar] [CrossRef]
- Wang, L.; Yin, Y.; Zhou, C.; Huang, B.; Wang, W. Damage evolution of hydraulically coupled Jianchuandong dangerous rock mass. Landslides 2020, 17, 1083–1090. [Google Scholar] [CrossRef]
- Yin, Y.; Huang, B.; Liu, G.; Wang, S. Potential Risk Analysis on a Jianchuandong Dangerous Rockmass-Generated Impulse Wave in the Three Gorges Reservoir, China. Environ. Earth Sci. 2015, 74, 2595–2607. [Google Scholar] [CrossRef]
- Yin, Y.; Wang, L.; Huang, B.; Zhang, Z.; Dai, Z. Evolution analysis of the Banbiyan Dangerous Rock Mass in the Three Gorges Reservoir area, China. Georisk Assess. Manag. Risk Eng. Syst. Geohazards NGRK 2022, 2062776. [Google Scholar] [CrossRef]
- Parise, M.; Closson, D.; Gutiérrez, F.; Stevanović, Z. Anticipating and Managing Engineering Problems in the Complex Karst Environment. Environ. Earth Sci. 2015, 74, 7823–7835. [Google Scholar] [CrossRef]
- Yan, G.; Huang, B.; Qin, Z.; Dai, Z.; Zhang, Q. Rock mass deterioration model of bank slope based on high-precision 3D multiperiod point clouds in the Three Gorges Reservoir, China. Q. J. Eng. Geol. Hydrogeol. 2022, 55, qjegh2020-100. [Google Scholar] [CrossRef]
- Gao, X.; Wang, L.; Xiang, Y.; Jiang, X.; Yang, Y.; Ran, B. Study on the Deterioration Trend of the Rock Mass on the Reservoir Banks under Dry-wet cycles. Front. Ecol. Evol. 2022, 10, 1033935. [Google Scholar] [CrossRef]
- Yin, Y.; Huang, B.; Wang, W.; Wei, Y.; Ma, X.; Ma, F.; Zhao, C. Reservoir-Induced Landslides and Risk Control in Three Gorges Project on Yangtze River, China. J. Rock Mech. Geotech. 2016, 8, 577–595. [Google Scholar] [CrossRef] [Green Version]
- Yin, Y.; Wang, L.; Zhang, W.; Zhang, Z.; Dai, Z. Research on the collapse process of a thick-layer dangerous rock on the reservoir bank. B Eng. Geol. Environ. 2022, 81, 109. [Google Scholar] [CrossRef]
- Wang, L.; Yin, Y.; Huang, B.; Dai, Z. Damage evolution and stability analysis of the Jianchuandong Dangerous Rock Mass in the Three Gorges Reservoir Area. Eng. Geol. 2020, 265, 105439. [Google Scholar] [CrossRef]
- Liu, X.; Jin, M.; Li, D.; Zhang, L. Strength deterioration of a Shaly sandstone under dry-wet cycles: A case study from the Three Gorges Reservoir in China. B Eng. Geol. Environ. 2018, 77, 1607–1621. [Google Scholar] [CrossRef]
- Feng, X.; Zhou, Y.; Jiang, Q. Rock Mechanics Contributions to Recent Hydroelectric Developments in China. J. Rock Mech. Geotech. 2019, 11, 511–526. [Google Scholar] [CrossRef]
- Chen, X.; Huang, B.; Li, B.; Jiang, X. Risk assessment study on landslide-generated impulse waves: Case study from Zhongliang Reservoir in Chongqing, China. B Eng. Geol. Environ. 2022, 81, 158. [Google Scholar]
- Li, X.; Peng, K.; Peng, J.; Hou, D. Experimental investigation of cyclic wetting-drying effect on mechanical behavior of a medium-grained sandstone. Eng. Geol. 2021, 293, 106335. [Google Scholar] [CrossRef]
- Huang, B.; Dong, X.; Yang, C.; Qin, Z.; Zhang, P. Structural damage to carbonate pillar hazardous rock masses subject to long-term water-level fluctuations in the Three Gorges reservoir area, China. Q. J. Eng. Geol. Hydrogeol. 2022, 55, 2. [Google Scholar] [CrossRef]
- Shah, K.S.; Hashim, M.H.B.M.; Rehman, H.; Ariffin, K.S.B. Evaluating Microscale Failure Response of Various Weathering Grade Sandstones Based on Micro-Scale Observation and Micro-Structural Modelling Subjected to Wet and Dry Cycles. J. Min. Environ. 2022, 13, 341–355. [Google Scholar]
- Shah, K.S.; Mohd Hashim, M.H.B.; Rehman, H.; Ariffin, K.S.B. Weathering Induced Brazilian Tensile Strength and Fracture Characteristics of Sandstone and their Prevailing Mutual Association. Int. J. Min. Geo-Eng. 2022, 56, 191–197. [Google Scholar]
- Vaneghi, R.G.; Ferdosi, B.; Okoth, A.D.; Kuek, B. Strength degradation of sandstone and granodiorite under uniaxial cyclic loading. J. Rock Mech. Geotech. Eng. 2018, 10, 117–126. [Google Scholar] [CrossRef]
- Liu, Y.; Dai, F. A review of experimental and theoretical research on the deformation and failure behavior of rocks subjected to cyclic loading. J. Rock Mech. Geotech. Eng. 2021, 13, 1203–1230. [Google Scholar] [CrossRef]
- Li, H.; Liao, H.; Xiong, G.; Han, B.; Zhao, G. A Three-Dimensional Statistical Damage Constitutive Model for Geomaterials. J. Mech. Sci. Technol. 2015, 29, 71–77. [Google Scholar] [CrossRef]
- Lawal, A.; Kwon, S. Application of Artificial Intelligence to Rock Mechanics: An Overview. J. Rock Mech. Geotech. 2021, 13, 248–266. [Google Scholar] [CrossRef]
- Shen, P.; Tang, H.; Ning, Y.; Xia, D. A Damage Mechanics Based on the Constitutive Model for Strain-Softening Rocks. Eng. Fract. Mech. 2019, 216, 106521. [Google Scholar] [CrossRef]
- Chen, S.; Walske, M.; Davies, I. Rapid mapping and analysing rock mass discontinuities with 3D terrestrial laser scanning in the underground excavation. Int. J. Rock Mech. Min. Sci. 2018, 110, 28–35. [Google Scholar] [CrossRef]
- Zhang, J.; Liu, S.; Chen, Q.; Wang, B.; Ren, C. Application of Cross-borehole Integrated Geophysical Methods for the Detailed Investigation of Karst in Urban Metro Construction. J. Environ. Eng. Geophys. 2020, 22, 525–536. [Google Scholar] [CrossRef]
- Su, H.; Zhou, W. Mechanism of Accelerated Dissolution of Mineral Crystals by Cavitation Erosion. Acta Geochim. 2020, 39, 11–42. [Google Scholar] [CrossRef]
- Wu, F.; Wu, J.; Bao, H.; Li, B.; Shan, Z.; Kong, D. Advances in Statistical Mechanics of Rock Masses and Its Engineering Applications. J. Rock Mech. Geotech. 2021, 13, 22–45. [Google Scholar] [CrossRef]
- Agan, C.; Unal, M. Performance of Pressuremeter Tests to Estimate the Position of the Sliding Surface: A Case Study in Zonguldak, Turkey. Geotech. Test. J. 2013, 36, 584–591. [Google Scholar] [CrossRef]
- Calcaterra, S.; Cesi, C.; DI Maio, C.; Gambino, P.; Merli, K.; Vallario, M.; Vassallo, R. Surface displacements of two landslides evaluated by GPS and inclinometer systems: A case study in Southern Apennines, Italy. Nat. Hazards 2012, 61, 257–266. [Google Scholar] [CrossRef]
- Zhao, Y.; Yang, T.; Zhang, P.; Zhou, J.; Yu, Q.; Deng, W. The Analysis of Rock Damage Process Based on the Microseismic Monitoring and Numerical Simulations. Tunn. Undergr. Space Technol. 2017, 69, 1–17. [Google Scholar] [CrossRef]
- Wang, L.; Yin, Y.; Huang, B.; Zhang, Z.; Zhao, P.; Wei, Y. A Study of the Treatment of a Dangerous Thick Submerged Rock Mass in the Three Gorges Reservoir Area. B Eng. Geol. Environ. 2020, 79, 2579–2590. [Google Scholar] [CrossRef]
- Wang, L.; Zhang, Z.; Huang, B.; Hu, M.; Zhang, C. Triggering mechanism and possible evolution process of the ancient Qingshi landslide in the Three Gorges Reservoir. Geomat Nat. Hazards Risk 2021, 12, 3160–3174. [Google Scholar] [CrossRef]
- Wang, L.; Wu, J.; Zhang, W.; Wang, L.; Cui, W. Efficient Seismic Stability Analysis of Embankment Slopes Subjected to Water Level Changes Using Gradient Boosting Algorithms. Front. Earth SC-SWITZ 2021, 9, 807317. [Google Scholar] [CrossRef]
- Zhang, W.; Li, H.; Tang, L.; Gu, X.; Wang, L.; Wang, L. Displacement prediction of Jiuxianping landslide using gated recurrent unit (GRU) networks. Acta Geotech. 2022, 17, 1367–1382. [Google Scholar] [CrossRef]
- Qin, C.; Zhou, J. On the seismic stability of soil slopes containing dual weak layers: True failure load assessment by finite-element limit-analysis. Acta Geotech. 2023. [Google Scholar] [CrossRef]
- Liu, S.; Wang, L.; Zhang, W.; He, Y.; Pijush, S. A comprehensive review of machine learning-based methods in landslide susceptibility mapping. Geol. J. 2023, 4666. [Google Scholar] [CrossRef]
- Zhang, C.; Yin, Y.; Yan, H.; Zhu, S.; Li, B.; Hou, X.; Yang, Y. Centrifuge modelling of multi-row stabilizing piles reinforced reservoir landslide with different row spacings. Landslides 2022. [Google Scholar] [CrossRef]
- Guo, J.; Zhang, P.; Zhang, Q.; Huang, B.; Qin, Z. Study on Landslide Hazard Identification Technology Based on Multispectral Remote Sensing Images in Wu Gorge. Geol. Miner. Resour. South China 2020, 36, 38–45. [Google Scholar]


| Date | Rows | Cols | Number of Points | Scan Area (m2) |
|---|---|---|---|---|
| 30 August 2019 | 4428 | 6995 | 6,120,697 | 5312 |
| 24 June 2020 | 3845 | 7647 | 5,635,568 | 6020 |
| Number of Joints Traces | Dip Angle (°) | Dip Direction (°) | Number of Joints | Dip Angle (°) | Dip Direction (°) |
|---|---|---|---|---|---|
| 1 | 35 | 121 | 1 | 40 | 127 |
| 2 | 22 | 82 | 2 | 68 | 130 |
| 3 | 24 | 107 | 3 | 32 | 169 |
| 4 | 35 | 91 | 4 | 47 | 147 |
| 5 | 33 | 89 | 5 | 26 | 152 |
| 6 | 32 | 85 | 6 | 35 | 50 |
| / | / | / | 7 | 29 | 37 |
| / | / | / | 8 | 40 | 33 |
| Boreholes | Depth (m) | Wave Velocity in 2019 (km/s) | Wave Velocity in 2020 (km/s) | Drop Rate (%) |
|---|---|---|---|---|
| ZK01/02 | 8.8~10.6 | 5.09 | 4.57 | 10.22 |
| 15~21 | 4.03 | 3.72 | 7.69 | |
| ZK03/04 | 12.8~13.6 | 2.49 | 2.35 | 5.62 |
| 17.6~19 | 4.50 | 4.22 | 6.23 | |
| ZK07/08 | 7~13.6 | 4.42 | 4.10 | 7.24 |
Disclaimer/Publisher’s Note: The statements, opinions and data contained in all publications are solely those of the individual author(s) and contributor(s) and not of MDPI and/or the editor(s). MDPI and/or the editor(s) disclaim responsibility for any injury to people or property resulting from any ideas, methods, instructions or products referred to in the content. |
© 2023 by the authors. Licensee MDPI, Basel, Switzerland. This article is an open access article distributed under the terms and conditions of the Creative Commons Attribution (CC BY) license (https://creativecommons.org/licenses/by/4.0/).
Share and Cite
Dai, Z.; Wang, L.; Fu, X.; Huang, B.; Zhang, S.; Gao, X.; He, X. Degradation of Typical Reverse Sand-Mudstone Interbedded Bank Slope Based on Multi-Source Field Experiments. Int. J. Environ. Res. Public Health 2023, 20, 2591. https://doi.org/10.3390/ijerph20032591
Dai Z, Wang L, Fu X, Huang B, Zhang S, Gao X, He X. Degradation of Typical Reverse Sand-Mudstone Interbedded Bank Slope Based on Multi-Source Field Experiments. International Journal of Environmental Research and Public Health. 2023; 20(3):2591. https://doi.org/10.3390/ijerph20032591
Chicago/Turabian StyleDai, Zhenwei, Luqi Wang, Xiaolin Fu, Bolin Huang, Senlin Zhang, Xuecheng Gao, and Xiangrong He. 2023. "Degradation of Typical Reverse Sand-Mudstone Interbedded Bank Slope Based on Multi-Source Field Experiments" International Journal of Environmental Research and Public Health 20, no. 3: 2591. https://doi.org/10.3390/ijerph20032591