

Landscape Aesthetic Value of Waterfront Green Space Based on Space–Psychology–Behavior Dimension: A Case Study along Qiantang River (Hangzhou Section)
Abstract
:1. Introduction
2. Materials and Methods
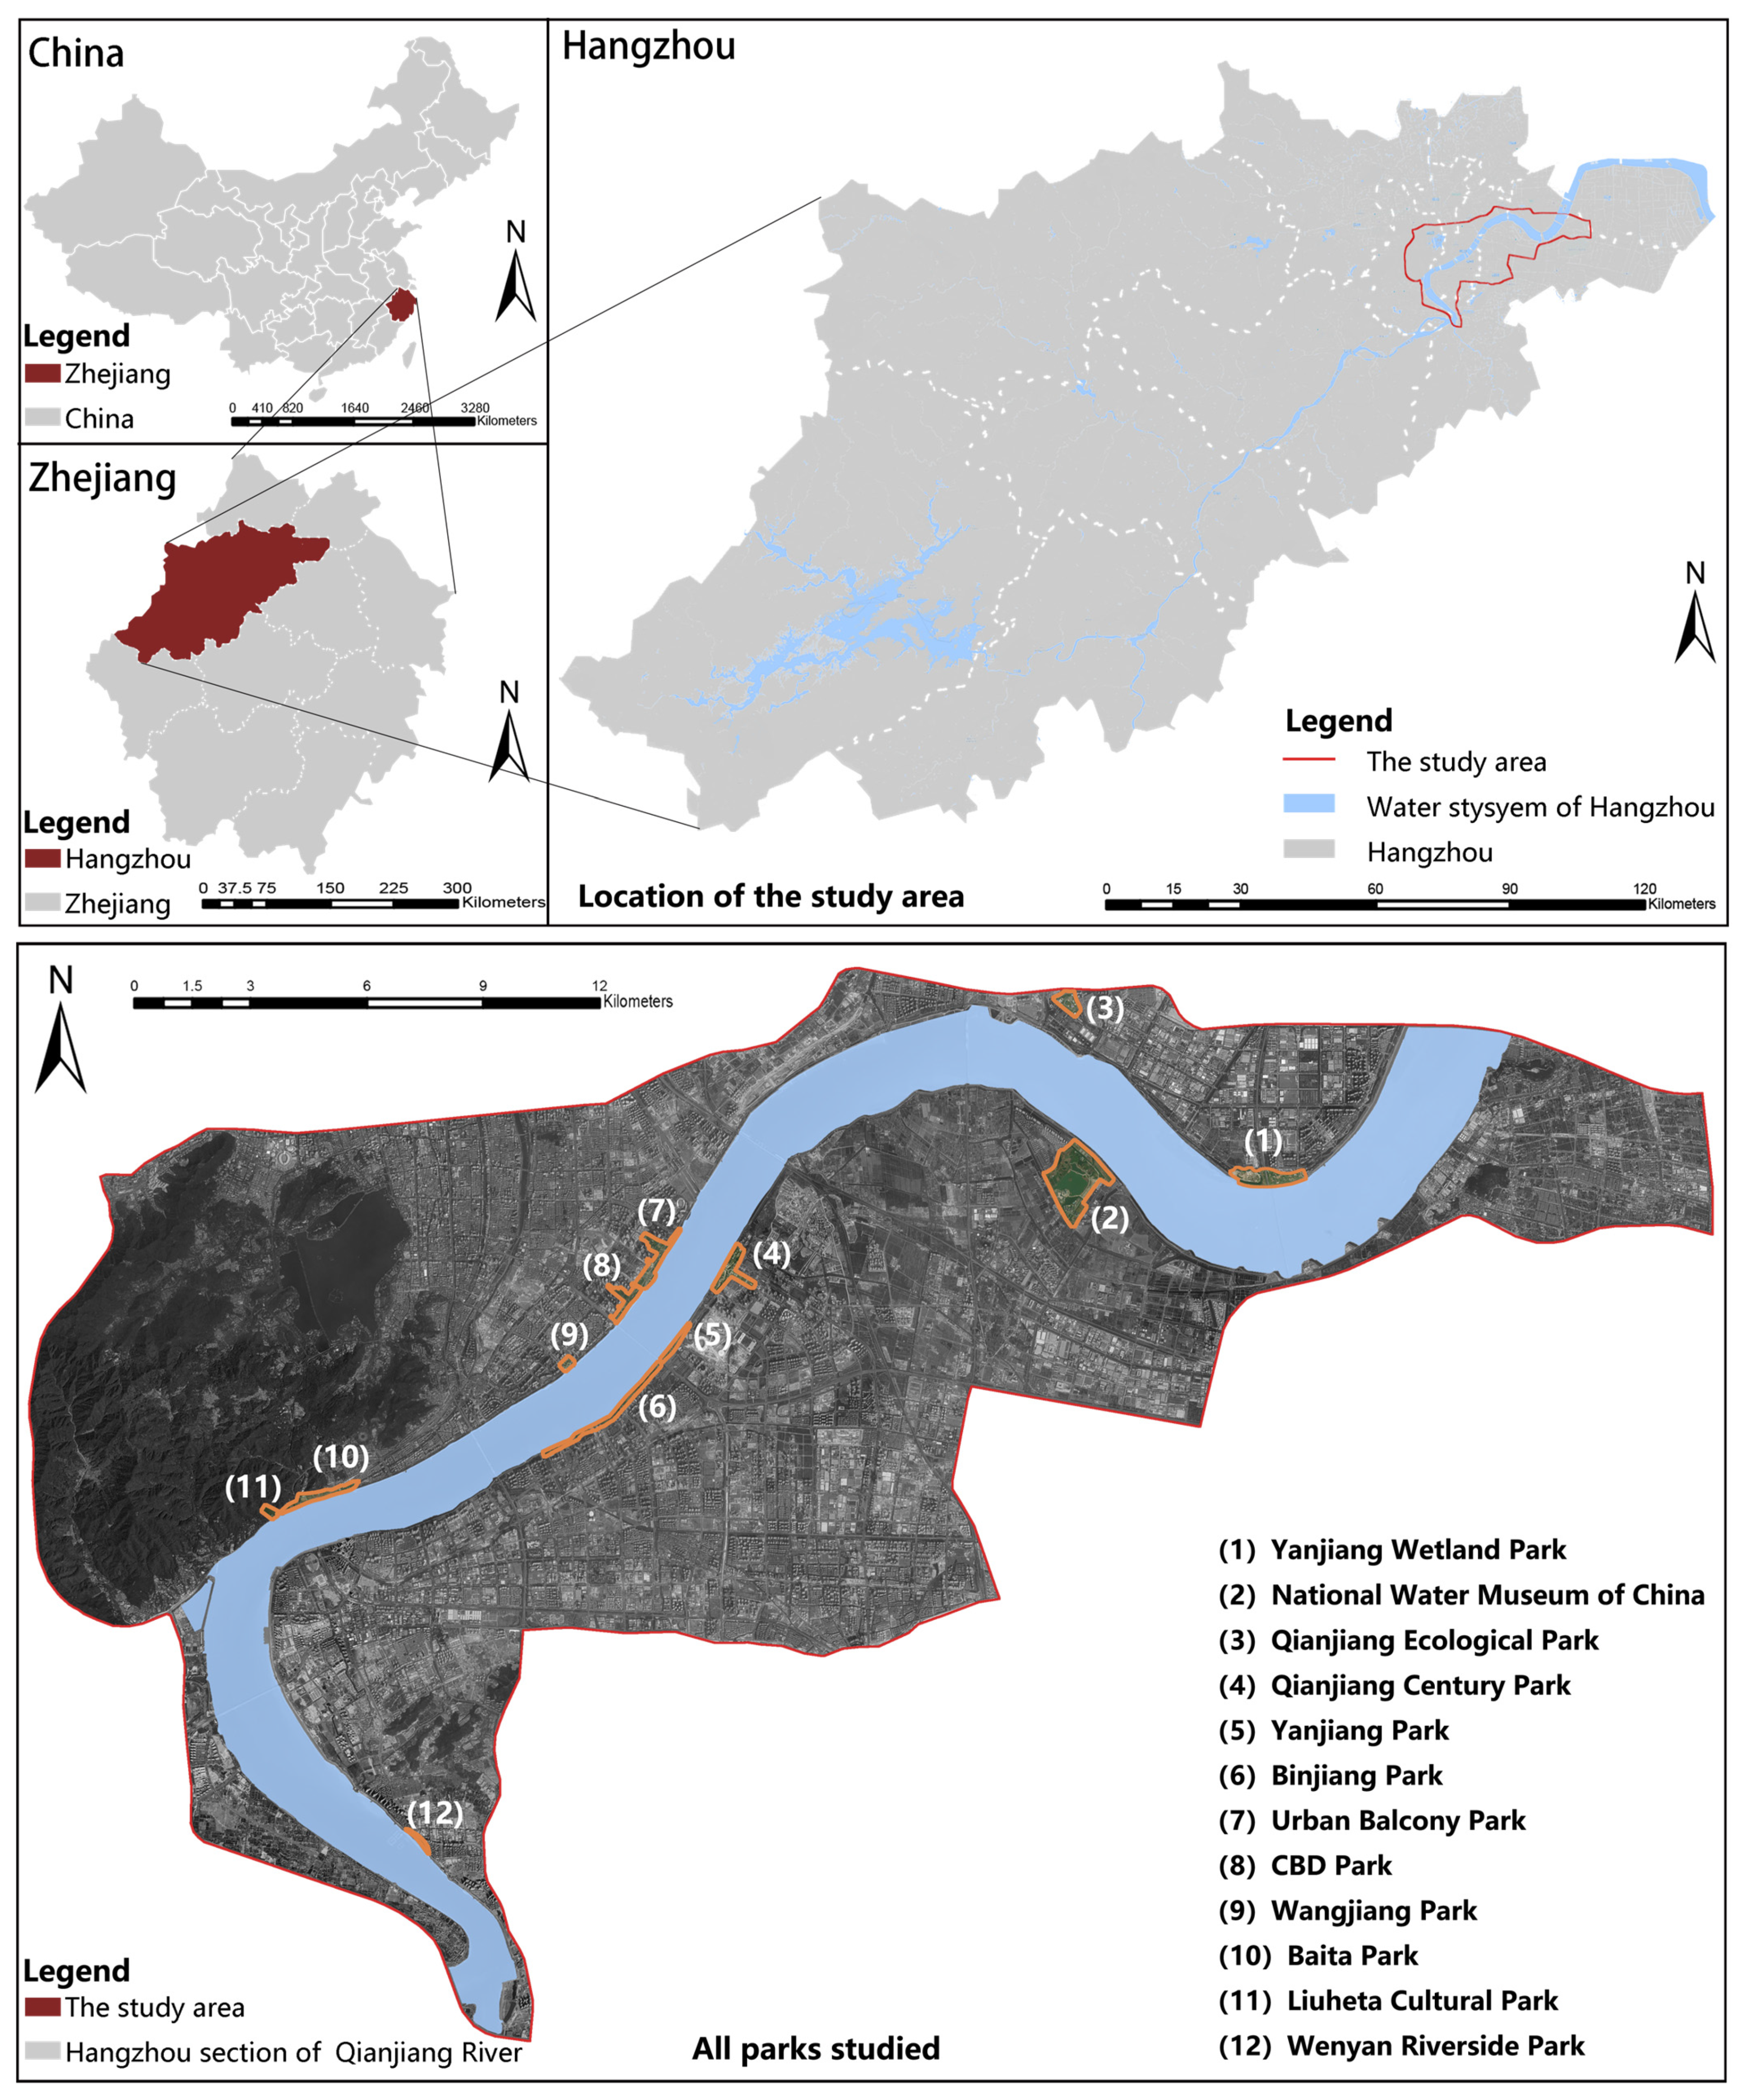
2.1. Study Area
2.2. Landscape Aesthetic Evaluation Method
2.2.1. Spatial Dimension of Landscape Aesthetics Research
2.2.2. Psychological Dimension of Landscape Aesthetics Research
2.2.3. Behavioral Dimension of Landscape Aesthetics Research
2.3. Data Collection and Preprocessing
3. Results
3.1. Spatial Dimension of Landscape Aesthetics Research
3.2. Psychological Dimension of Landscape Aesthetics Research
3.3. Behavioral Dimension of Landscape Aesthetics Research
4. Discussion
4.1. The Interaction among Space, Psychology and Behavior Dimensions
4.2. The Coupling Coordination Results of Spatial, Psychological and Behavioral Dimensions
4.3. Future Recommendations and Deficiency
5. Conclusions
- (1)
- The spatial dimension of landscape aesthetics research indicated that the overall aesthetic value of the waterfront green space in the study area was low. Among them, the QEP space aesthetic value index was the highest, and the lowest was UBP. According to the evaluation grade analysis, the study area waterfront park space aesthetic value was mainly concentrated in the secondary level. The spatial aesthetic value of the waterfront park was three-dimensional space > vertical space > horizontal space.
- (2)
- The psychological dimension of landscape aesthetics research indicated that people’s perceptions of the waterfront green space in the study area were relatively weak. The waterfront green space landscape had a positive attraction for visitors, and the waterfront green space with a relative emotional value greater than one accounted for 75%. The higher the relative emotional value of the waterfront green space landscape, the richer and more comprehensive the five-sense sensory experience of users, which also has a connection to a large number of comments available about the park. Among them, QCP had the highest relative emotional value, and WP had the lowest.
- (3)
- The behavioral dimension of landscape aesthetics research indicated that the overall thermal value of the waterfront green space in the study area was insufficient and, distributed from 1.3719 to 7.1583, was mainly concentrated in low-heat levels. Users were mostly motivated by sightseeing. The population density of the waterfront green space in the study area was generally low, and the kernel density value was distributed in the 0.0014–0.0663 range, mainly concentrated in the low-density level. CP had the highest population density, and NWMC had the lowest population density.
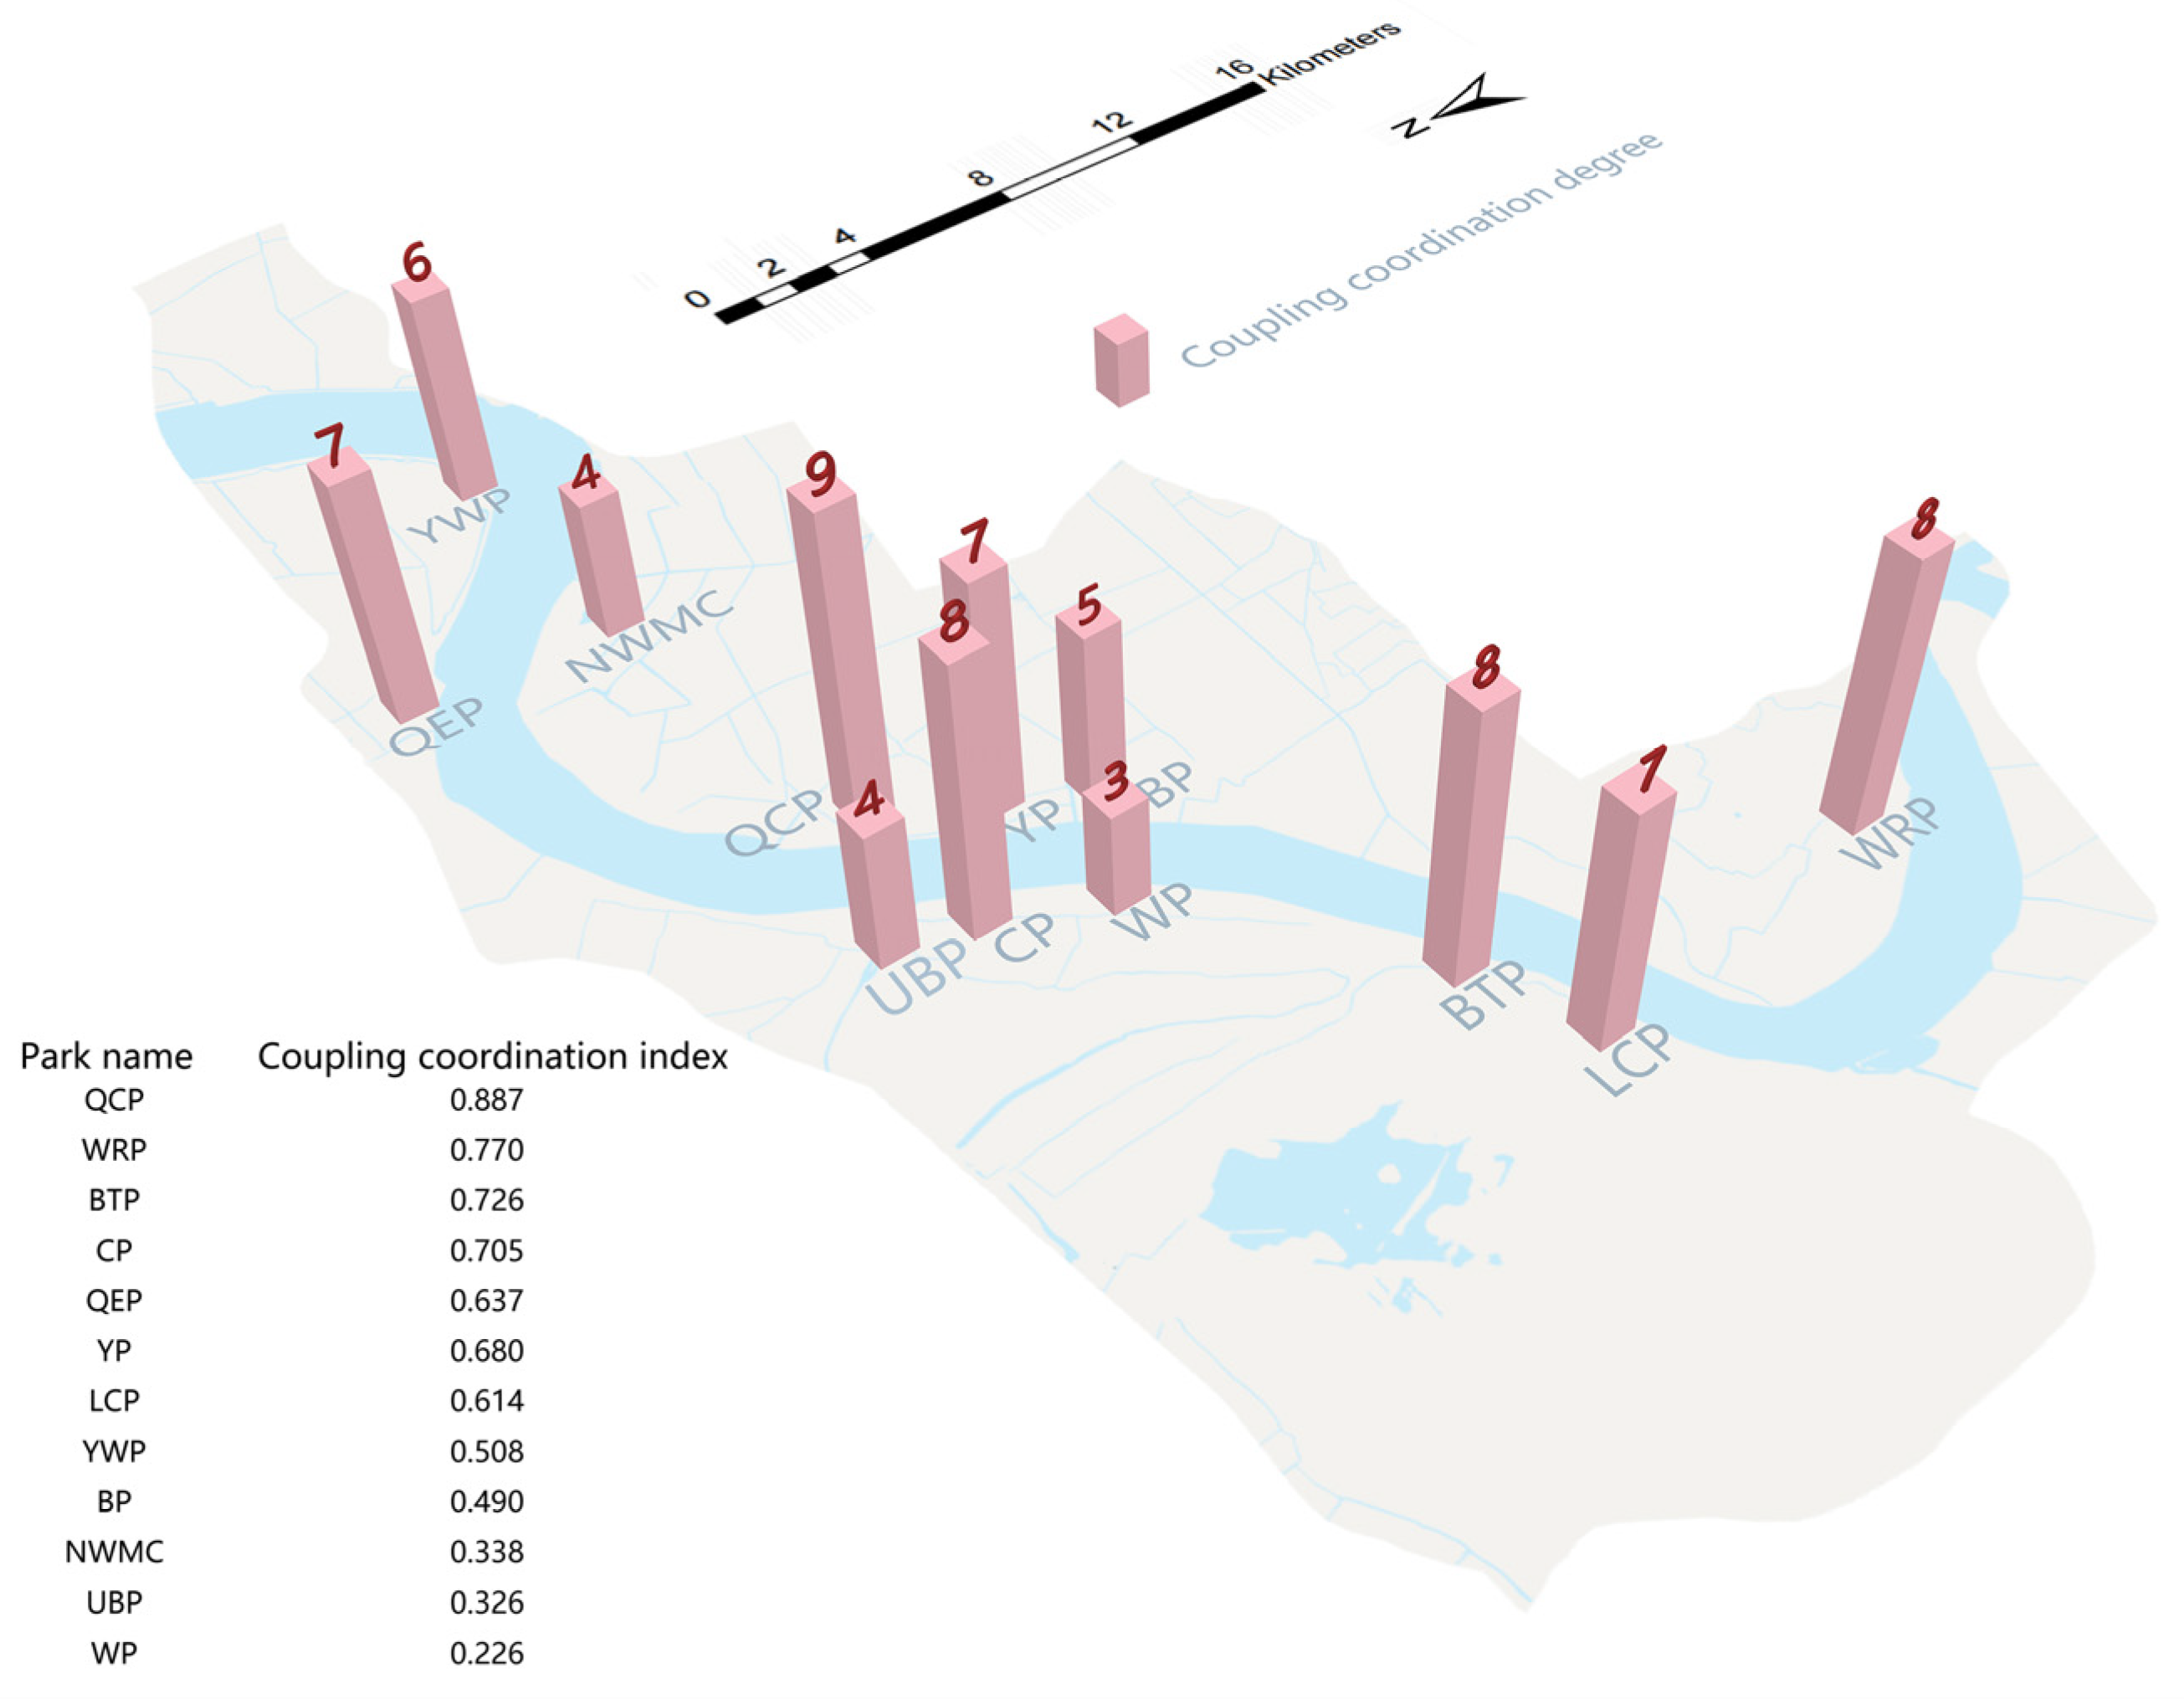
- (4)
- The results of the coupling coordination analysis indicated that the distribution of the coupling coordination degrees of the waterfront green space in the study area was not balanced, showing the form of ‘high coupling degree and low coordination degree’. Among them, the spatial–behavior–psychological coupling coordination degree of QCP was the best, and the spatial–behavior–psychological coupling coordination degree of WP was the lowest. The spatial–psychological dimension coupling degrees of QCP, YP, WRP, YWP, and BTP were strong. The coupling degrees of the psychological–behavior dimension of QCP, CP, WRP, BTP, and LCP were strong. The coupling degrees of the space–behavior dimension of QCP, QEP, YWP, and CP were strong.
- (5)
- This study avoided the shortcomings of fewer data points, high cost, and the low efficiency of traditional research methods, providing a practical value evaluation method for future landscape aesthetics.
Author Contributions
Funding
Institutional Review Board Statement
Informed Consent Statement
Data Availability Statement
Acknowledgments
Conflicts of Interest
Abbreviations
| QCP | Qianjiang Century Park |
| QEP | Qianjiang Ecological Park |
| YWP | Yanjiang Wetland Park |
| NWMC | National Water Museum of China |
| YP | Yanjiang Park |
| CP | CBD Park |
| WP | Wangjiang Park |
| BTP | Baita Park |
| BP | Binjiang Park |
| LCP | Liuheta Cultural Park |
| WRP | Wenyan Riverside Park |
| UBP | Urban Balcony Park |
| DIFN | Diffuse non-interceptance |
| ALOS | Advanced Land Observation Satellite |
| DEM | Digital Elevation Model |
References
- Taufen, A.; Yocom, K. Transitions in Urban Waterfronts: Imagining, Contesting, and Sustaining the Aquatic/Terrestrial Interface. Sustainability 2021, 13, 366. [Google Scholar] [CrossRef]
- Jiang, Y.; Huang, J.; Shi, T.; Wang, H. Interaction of Urban Rivers and Green Space Morphology to Mitigate the Urban Heat Island Effect: Case-Based Comparative Analysis. Int. J. Environ. Res. Public Health 2021, 18, 11404. [Google Scholar] [CrossRef] [PubMed]
- Dai, F.; Wang, Y.; Chen, M.; Huang, Y.; Guo, L. Study on the Planning and Protection of Waterfront Green Space Under the Vision of “Park City”: A Case Study of Hundreds-kilometers Riverbank Parks Group of the Yangtze River in Wuhan. Shanghai Urban Plan. Rev. 2019, 1, 19–26. [Google Scholar]
- Kondo, M.; Fluehr, J.; McKeon, T.; Branas, C. Urban Green Space and Its Impact on Human Health. Int. J. Environ. Res. Public Health 2021, 15, 445. [Google Scholar] [CrossRef]
- Ahmed, S.; Meenar, M.; Alam, A. Designing a Blue-Green Infrastructure (BGI) Network: Toward Water-Sensitive Urban Growth Planning in Dhaka, Bangladesh. Land 2019, 8, 138. [Google Scholar] [CrossRef]
- Reid, W.V.; Mooney, H.; Cropper, A.; Capistrano, D.; Carpenter, S.R.; Chopra, K.R.; Dasgupta, P.; Dietz, T.; Duraiappah, A.K.; Hassan, R.M.; et al. Ecosystems and Human Well-Being—Synthesis: A Report of the Millennium Ecosystem Assessment; Island Press: Washington, DC, USA, 2005. [Google Scholar]
- Sousa, R.D.; Paiva, P.D.; Reis, M.V.; Carcaud, N. The Trajectory of the Landscape and Functionality of Urban Watercourses: A Study of Lavras City, Brazil. Front. Sustain. Cities 2022, 4, 793288. [Google Scholar] [CrossRef]
- Yang, C.X.; Geng, H.Z.; Qin, M. Optimizing the Organization Models of Control Lines in Chinese Waterfronts. Adv. Mater. Res. 2013, 869, 124–129. [Google Scholar] [CrossRef]
- Shi, D.; Song, J.; Huang, J.; Zhuang, C.; Guo, R.; Gao, Y. Synergistic Cooling Effects (SCEs) of Urban Green-blue Spaces on Local Thermal Environment: A Case Study in Chongqing, China. Sustain. Cities Soc. 2020, 55, 102065. [Google Scholar] [CrossRef]
- Cheng, Y.; Wu, C. Planning Approach of Urban Blue-green Space Based on Local Climate Optimization: A Review. Chin. J. Appl. Ecol. 2020, 31, 3935–3945. [Google Scholar]
- Zhang, Q.; Lee, J.; Jiang, B.; Kim, G. Revitalization of the Waterfront Park Based on Industrial Heritage Using Post-Occupancy Evaluation-A Case Study of Shanghai (China). Int. J. Environ. Res. Public Health 2022, 19, 9107. [Google Scholar] [CrossRef]
- Gascon, M.; Zijlema, W.L.; Vert, C.; White, M.P.; Nieuwenhuijsen, M.J. Outdoor Blue Spaces, Human Health and Well-being: A Systematic Review of Quantitative Studies. Int. J. Hyg. Environ. Health 2017, 220, 1207–1221. [Google Scholar] [CrossRef]
- Sun, D.; Hu, C.; Wang, Y.; Wang, Z.; Zhang, J. Examining Spatio-Temporal Characteristics of Urban Heat Islands and Factors Driving Them in Hangzhou, China. IEEE J. 2021, 14, 8316–8325. [Google Scholar] [CrossRef]
- Song, Y.; Chen, B.; Ho, H.C.; Kwan, M.; Liu, D.; Wang, F.; Wang, J.; Cai, J.; Li, X.; Xu, Y.; et al. Observed Inequality in Urban Greenspace Exposure in China. Environ. Int. 2021, 156, 106778. [Google Scholar] [CrossRef] [PubMed]
- Avni, N.; Teschner, N. Urban Waterfronts: Contemporary Streams of Planning Conflicts. J. Plan. Lit. 2019, 34, 408–420. [Google Scholar] [CrossRef]
- Wang, Y.; Dewancker, B.; Qi, Q. Citizens’ Preferences and Attitudes Towards Urban Waterfront Spaces: A Case Study of Qiantang Riverside Development. Environ. Sci. Pollut. Res. 2020, 27, 45787–45801. [Google Scholar] [CrossRef]
- Botequilha-Leito, A.; Díaz-Varela, E.R. Performance Based Planning of complex urban social-ecological systems: The quest for sustainability through the promotion of resilience. Sustain. Cities Soc. 2020, 56, 102089. [Google Scholar] [CrossRef]
- Zhang, X.; Du, H.; Wang, Y.; Chen, Y.; Ma, L.; Dong, T. Watershed Landscape Ecological Risk Assessment and Landscape Pattern Optimization: Take Fujiang River Basin as an Example. Hum. Ecol. Risk Assess. Int. J. 2021, 27, 2254–2276. [Google Scholar] [CrossRef]
- Wang, Y.; Pan, J. Building Ecological Security Patterns Based on Ecosystem Services Value Reconstruction in an Arid Inland Basin: A Case Study in Ganzhou District, NW China. J. Clean. Prod. 2019, 241, 118337. [Google Scholar] [CrossRef]
- Hartog, H.D. Engineering an Ecological Civilization Along Shanghai’s Main Waterfront and Coastline: Evaluating Ongoing Efforts to Construct an Urban Eco-Network. Front. Media SA 2021, 9, 639739. [Google Scholar] [CrossRef]
- Meenar, M.; Heckert, M.; Adlakha, D. “Green Enough Ain’t Good Enough:” Public Perceptions and Emotions Related to Green Infrastructure in Environmental Justice Communities. Int. J. Environ. Res. Public Health 2022, 19, 1448. [Google Scholar] [CrossRef]
- Lomnicky, G.A.; Herlihy, A.T.; Kaufmann, P.R. Quantifying the Extent of Human Disturbance Activities and Anthropogenic Stressors in Wetlands across the Conterminous United States:Results from the National Wetland Condition Assessment. Environ. Monit. Assess. 2019, 191, 324. [Google Scholar] [CrossRef] [PubMed]
- Othman, A.; Al-Hagla, K.; Hasan, A.E. The Impact of Attributes of Waterfront Accessibility on Human Well-being: Alexandria Governorate as A Case Study. Ain Shams Eng. J. 2020, 12, 1033–1047. [Google Scholar]
- Wu, C.J.; He, X.Y. Environmental Aesthetic Value Influences the Intention for Moral Behavior: Changes in Behavioral Moral Judgment. Int. J. Environ. Res. Public Health 2021, 18, 6477. [Google Scholar] [CrossRef] [PubMed]
- Hermida, M.A.; Cabrera-Jara, N.; Osorio, P.; Cabrera, S. Methodology for the Assessment of Connectivity and Comfort of Urban Rivers. Cities 2019, 95, 102376. [Google Scholar] [CrossRef]
- Zhang, N.; Zheng, X.R.; Wang, X. Assessment of Aesthetic Quality of Urban Landscapes by Integrating Objective and Subjective Factors: A Case Study for Riparian Landscapes. Front. Ecol. Evol. 2022, 9, 735905. [Google Scholar] [CrossRef]
- Tan, X.; Li, X.; Peng, Y. Aesthetic Evaluation of Plant Landscape Based on Principal Factor Analysis and SBE in Wetland Park-A Case Study of Jinlong Lake Wetland Park(China). J. Environ. Eng. Landsc. Manag. 2021, 29, 40–47. [Google Scholar] [CrossRef]
- Djuki, A.; Mari, J.; Antoni, B.; Kova, V.; Jokovi, J.; Dinki, N. The Evaluation of Urban Renewal Waterfront Development: The Case of the Sava Riverfront in Belgrade, Serbia. Sustainability 2020, 12, 6620. [Google Scholar] [CrossRef]
- Gao, S.; Liu, S.F. Exploration and Analysis of the Aesthetic Cognitive Schema of Contemporary Western Urban Landscapes. Int. J. Environ. Res. Public Health 2021, 18, 5152. [Google Scholar] [CrossRef]
- Luo, J.; Zhao, T.; Cao, L.; Biljecki, F. Water View Imagery: Perception And Evaluation of Urban Waterscapes Worldwide. Ecol. Indic. 2022, 145, 109615. [Google Scholar] [CrossRef]
- Cheng, S.Y.; Zhai, Z.R.; Sun, W.Z.; Wang, Y.; Yu, R.; Ge, X.Y. Research on the Satisfaction of Beijing Waterfront Green Space Landscape Based on Social Media Data. Land 2022, 11, 1849. [Google Scholar] [CrossRef]
- Gobster, P.H.; Ribe, R.G.; Palmer, J.F. Themes and Trends in Visual Assessment Research: Introduction to the Landscape and Urban Planning Special Collection on the Visual Assessment of Landscapes. Landsc. Urban Plan. 2019, 191, 103635. [Google Scholar] [CrossRef]
- Sun, D.; Li, Q.; Gao, W.; Huang, G.; Tang, N.; Lyu, M.; Yu, Y. On the Relation Between Visual Quality and Landscape Characteristics: A Case Study Application to the Waterfront Linear parks in Shenyang, China. Environ. Res. Commun. 2021, 3, 115013. [Google Scholar] [CrossRef]
- Hong, C.; Chang, H.; Chung, E. Comparing the Functional Recognition of Aesthetics, Hydrology, and Quality in Urban Stream Restoration Through the Framework of Environmental Perception. River Res. Appl. 2019, 35, 543–552. [Google Scholar] [CrossRef]
- Liu, Q.; Zhu, Z.; Zeng, X.; Zhuo, Z.; Ye, B.; Fang, L.; Huang, Q.; Lai, P. The Impact of Landscape Complexity on Preference Ratings and Eye Fixation of Various Urban Green Space Settings. Urban For. Urban Green. 2021, 66, 127411. [Google Scholar] [CrossRef]
- Zhang, Z.C.; Zhang, H.J.; Feng, J.; Wang, Y.R.; Liu, K. Evaluation of Social Values for Ecosystem Services in Urban Riverfront Space Based on the SolVES Model: A Case Study of the Fenghe River, Xi’an, China. Int. J. Environ. Res. Public Health 2021, 18, 2765. [Google Scholar] [CrossRef] [PubMed]
- Wu, L.; Dong, Q.; Luo, S.; Jiang, W.; Hao, M.; Chen, Q. Effects of Spatial Elements of Urban Landscape Forests on the Restoration Potential and Preference of Adolescents. Environ. Sci. 2021, 10, 1349. [Google Scholar] [CrossRef]
- Wu, Y. The Research on Microclimate Effect of the Three-Dimension Morphology on Urban Waterfront Green Space Vegetation. Master’s Thesis, East China Normal University, Shanghai, China, 2020. [Google Scholar]
- Hu, D.; Hao, X.; Liu, C. Research on the Application of Public Art Design Based on Digital Technology and Multisensor Fusion Technology in Urban Landscape Construction. J. Sen. 2022, 2022, 8366667. [Google Scholar] [CrossRef]
- Ma, B.; Hauer, R.J.; Xu, C. Effects of Design Proportion and Distribution of Color in Urban and Suburban Green Space Planning to Visual Aesthetics Quality. Forests 2020, 11, 278. [Google Scholar] [CrossRef]
- Tan, X.; Peng, Y.Y. Scenic Beauty Evaluation of Plant Landscape in Yunlong Lake Wetland Park of Xuzhou City, China. Arab. J. Geosci. 2020, 13, 701. [Google Scholar] [CrossRef]
- Li, X.; Wang, X.R.; Jiang, X.; Han, J.Y.; Wang, Z.Y.; Wu, D.Z.; Lin, Q.; Li, L.; Zhang, S.Y.; Dong, Y. Prediction of Riverside Greenway Landscape Aesthetic Quality of Urban Canalized Rivers Using Environmental Modeling. J. Clean. Prod. 2022, 367, 133066. [Google Scholar] [CrossRef]
- Zhao, Y.; Wu, B.; Wu, J.; Shu, S.; Liang, H.; Liu, M.; Badenko, V.; Fedotov, A.; Yao, S.; Yu, B. Mapping 3d Visibility in an Urban Street Environment from Mobile Lidar Point Clouds. Giscience Remote Sens. 2020, 57, 797–812. [Google Scholar] [CrossRef]
- Kothencz, G.; Kolcsár, R.; Cabrera-Barona, P.; Szilassi, P. Urban Green Space Perception and Its Contribution to Well-Being. Int. J. Environ. Res. Public Health 2017, 14, 766. [Google Scholar] [CrossRef] [PubMed]
- Solecka, I.; Rinne, T.; Martins, R.C.; Kytta, M.; Albert, C. Important Places in Landscape-investigating the Determinants of Perceived Landscape Value in the Suburban Area of Wroclaw, Poland. Landsc. Urban Plan. 2022, 218, 104289. [Google Scholar] [CrossRef]
- Jisoo, S.; Miller, P.; Swarup, S. Tweeting the High Line Life: A Social Media Lens on Urban Green Spaces. Sustainability 2020, 12, 8895. [Google Scholar]
- Li, H.E.; You, C.; Li, J.; Li, M.; Tan, M.; Zhang, G.F.; Zhong, Y.P. Influence of Environmental Aesthetic Value and Anticipated Emotion on Pro-Environmental Behavior: An ERP Study. Int. J. Environ. Res. Public Health 2022, 19, 5714. [Google Scholar] [CrossRef]
- Yue, M.; Ling, C.; Wu, J. Exploring the Spatial Distribution Characteristics of Emotions of Weibo Users in Wuhan Waterfront Based on Gender Differences Using Social Media Texts. ISPRS Int. J. Geo Inf. 2020, 9, 465. [Google Scholar]
- Xia, Y.; Yabuki, N.; Fukuda, T. Development of A system for Assessing the Quality of Urban Street-level Greenery Using Street View Images and Deep Learning. Urban For. Urban Green. 2021, 59, 126995. [Google Scholar] [CrossRef]
- Vian, F.D.; Izquierdo, J.; Martínez, M.S. River-city Recreational Interaction: A Classification of Urban Riverfront Parks and Walks. Urban For. Urban Green. 2021, 59, 127042. [Google Scholar] [CrossRef]
- Xue, J.; Shi, J.H. Spatio-temporal Big Data Analysis of Tourists: A Case Study of Hangzhou. In Proceedings of the International Conference on Environmental Remote Sensing and Big Data (ERSBD 2021), Wuhan, China, 9 December 2021; p. 12129. [Google Scholar]
- Huang, X.; Li, M.; Zhang, J.; Zhang, L.; Zhang, H.; Yan, S. Tourists’ Spatial-temporal Behavior Patterns in Theme Parks: A Case Study of Ocean Park HongKong. J. Destin. Mark. Manag. 2020, 15, 100411. [Google Scholar] [CrossRef]
- Li, J.; Deng, J.; Pierskalla, C. Impact of attendees’ motivation and past experience on their attitudes toward the national cherry blossom festival in Washington, D.C. Urban For. Urban Green. 2018, 36, 57–67. [Google Scholar] [CrossRef]
- Schirpke, U.; Zoderer, B.M.; Tappeiner, U.; Tasser, E. Effects of Past Landscape Changes on Aesthetic Landscape Values in the European Alps. Landsc. Urban Plan. 2021, 212, 104109. [Google Scholar] [CrossRef]
- Wang, R.; Jiang, W.; Lu, T. Landscape Characteristics of University Campus in Relation to Aesthetic Quality and Recreational Preference. Urban For. Urban Green. 2021, 66, 127389. [Google Scholar] [CrossRef]
- Gülçin, D.; Yalçınkaya, N.M. Correlating Fluency Theory-based Visual Aesthetic Liking of Landscape with Landscape Types and Features. Geo Spat. Inf. Sci. 2022. [Google Scholar] [CrossRef]
- Korlyakov, K.A.; Gashev, S.N. Classification of Ecotones In Three-dimensionalspace: Horizontal, Verticaland Cross-horizontalecotones. In Proceedings of the VI International Scientific Conference on Advanced Agritechnologies, Environmental Engineering and Sustainable Development, Krasnoyarsk, Russia, 17–19 November 2021. [Google Scholar]
- Cha, I.; Park, I.K. A Study on the Relationship between the User’s Behavior and Lighting Design by Horizontal-Vertical-Three Dimensional elements of Light in Brand Coffee Shop. Des. Converg. Study 2014, 13, 171–186. [Google Scholar]
- Pototan, B.L.; Capin, N.C.; Delima, A.G.; Novero, A.U. Assessment of Mangrove Species Diversity in Banaybanay, Davao Oriental, Philippines. Biodiversitas J. Biol. Divers. 2020, 22, 144–153. [Google Scholar] [CrossRef]
- Yeboah, D.; Chen, H.Y.; Kingston, S.R. Tree species richness decreases while species evenness increases with disturbance frequency in a natural boreal forest landscape. Ecol. Evol. 2016, 6, 842–850. [Google Scholar] [CrossRef]
- Wu, T.; Zha, P.; Yu, M.; Jiang, G.; Zhang, J.; You, Q.; Xie, X. Landscape Pattern Evolution and Its Response to Human Disturbance in a Newly Metropolitan Area: A Case Study in Jin-Yi Metropolitan Area. Land 2021, 10, 767. [Google Scholar] [CrossRef]
- Srinivasan, K.; Sebastian, A.; Menachery, M.P.; Pant, G. Landscape Fragmentation Analysis in and around Rajaji, National Park, Uttarakhand, India. Indian J. Ecol. 2022, 49, 590–595. [Google Scholar]
- Jie, L.Y. Research and Application of Image Semantic Segmentation Algorithm Based on CNN. Master’s Dissertation, Chang’an University, Xi’an, China, 2020. [Google Scholar]
- Haobo, J.; Shan, L.U.; Yang, X. Method of Urban Color Evaluation for Historic and Cultural Areas in Shanghai Based on Street View Technology. Urban Paning Forum 2022, 269, 111–118. [Google Scholar]
- Xiang, J.l.; Yan, H.; Jin, L.; Fang, J.; Ming, Y. Relationship Between Slope Shape and Soil and Water Loss: A Case Study of Xixi Catchment Watershed. J. China Agric. Univ. 2019, 24, 161–171. [Google Scholar]
- Krebs, P.; Stocker, M.; Pezzatti, G.B.; Conedera, M. An Alternative Approach to Transverse and Profile Terrain Curvature. Int. J. Geogr. Inf. Sci. 2015, 29, 643–666. [Google Scholar] [CrossRef]
- Grimmond, C.S.; Potter, S.; Zutter, H.N.; Souch, C. Rapid Methods to Estimate Sky-view Factors Applied to Urban Areas. Int. J. Climatol. 2001, 21, 903–913. [Google Scholar] [CrossRef]
- Jia, B.L.; Ying, F.Z.; Han, L.B.; Chen, M.; Zheng, H.Y.; Tong, T.S.; Zheng, Y.H.; Chao, Z.; Shu, C.F. Quick Estimation of Three-dimensional Vegetation Volume Based on Images from an Unmanned Aerial Vehicle: A Case Study on Shanghai Botanical Garden. J. East China Norm. Univ. Nat. Sci. 2022, 2022, 122–134. [Google Scholar]
- Paudel, A.; Karkee, M.; Davidson, J.R.; Grimm, C. Canopy Density Estimation of Apple Trees. IFAC-PapersOnLine 2022, 55, 124–128. [Google Scholar] [CrossRef]
- Yang, S.; Zhang, Y.; Chen, S. Extraction of Terrain Relief Amplitude Based on GIS and Change Point Theory. In DEStech Transactions on Computer Science and Engineering; DEStech Publications: Lancaster, PA, USA, 2018. [Google Scholar]
- Yang, L.; Li, Y.; Wang, J.; Sherratt, R.S. Sentiment Analysis for E-Commerce Product Reviews in Chinese Based on Sentiment Lexicon and Deep Learning. IEEE Access 2020, 8, 23522–23530. [Google Scholar] [CrossRef]
- Xu, G.; Meng, Y.; Qiu, X.; Yu, Z.; Wu, X. Sentiment Analysis of Comment Texts Based on BiLSTM. IEEE Access 2019, 7, 51522–51532. [Google Scholar] [CrossRef]
- Guan, C.; Song, J.; Keith, M.; Akiyama, Y.; Shibasaki, R.; Sato, T. Delineating Urban Park Catchment Areas Using Mobile Phone Data: A Case Study of Tokyo. Comput. Environ. Urban Syst. 2020, 81, 101474. [Google Scholar] [CrossRef]
- Wang, S.; Ning, Y.; Shi, H. A New Uncertain Linear Regression Model Based on Equation Deformation. Soft Comput. 2021, 25, 12817–12824. [Google Scholar] [CrossRef]
- Tang, J.; Xue, Y.; Wang, Z.; Hu, S.; Gong, T.; Chen, Y.; Zhao, H.; Xiao, L. Bayesian Estimation-based Sentiment Word Embedding Model for Sentiment Analysis. CAAI Trans. Intell. Technol. 2022, 7, 144–155. [Google Scholar] [CrossRef]
- Englhardt, A.; Willkomm, J.; Schäler, M.; Böhm, K. Improving Semantic Change Analysis by Combining Word Embeddings and Word Frequencies. Int. J. Digit. Libr. 2019, 21, 247–264. [Google Scholar] [CrossRef]
- Feng, D.; Tu, L.; Sun, Z. Research on Population Spatiotemporal Aggregation Characteristics of a Small City: A Case Study on Shehong County Based on Baidu Heat Maps. Sustainability 2019, 11, 6276. [Google Scholar] [CrossRef]
- Zhang, S.; Zhang, W.; Wang, Y.; Zhao, X.; Mayer, A.L. Comparing Human Activity Density and Green Space Supply Using the Baidu Heat Map in Zhengzhou, China. Sustainability 2020, 12, 7075. [Google Scholar] [CrossRef]
- Li, J.; Li, J.; Yuan, Y.; Li, G. Spatiotemporal Distribution Characteristics and Mechanism Analysis of Urban Population Density: A Case of Xi’an, Shaanxi, China. Cities 2019, 86, 62–70. [Google Scholar] [CrossRef]
- Shi, R.; Li, G.; Wei, W.; Liu, Z. Personalized Image Observation Behavior Learning in Fixation Based Personalized Salient Object Segmentation. Neurocomputing 2021, 445, 255–266. [Google Scholar] [CrossRef]
- Peng, Y.; Liu, J.; Zhang, T.; Li, X. The Relationship between Urban Population Density Distribution and Land Use in Guangzhou, China: A Spatial Spillover Perspective. Int. J. Environ. Res. Public Health 2021, 18, 12160. [Google Scholar] [CrossRef]
- Dong, X.M.; Xu, S.N. Spatial Evolution Characteristics of Urban and Rural Settlements in Inner Mongolia. Arab. J. Geosci. 2020, 13, 1214. [Google Scholar] [CrossRef]
- Sen, S.; Guchhait, S.K. Urban Green Space in India: Perception of Cultural Ecosystem Services and Psychology of Situatedness and Connectedness. Ecol. Indic. 2021, 123, 107338. [Google Scholar] [CrossRef]
- Zhiman, Z.; Xianyu, Z. Study on Landscape Design of Urban Riverside Green Space Based on Environmental Behavior—Take the Small Garden of Nanchuan East Road in Xining City as an Example. In Proceedings of the 2021 6th International Conference on Minerals Source, Geotechnology and Civil Engineering, Guangzhou, China, 9–11 April 2021; Volume 768, p. 012149. [Google Scholar]
- Turan, I.A.; True, E.M. Research on the user—Space relations of a historical node. Fresenius Environ. Bull. 2020, 29, 9880–9888. [Google Scholar]
- Maes, M.J.; Pirani, M.; Booth, E.R.; Shen, C.; Milligan, B.; Jones, K.E.; Toledano, M.B. Benefit of woodland and other natural environments for adolescents’ cognition and mental health. Nat. Sustain. 2021, 4, 851–858. [Google Scholar] [CrossRef]
- Candini, M.; Giuberti, V.; Santelli, E.; di Pellegrino, G.; Frassinetti, F. When Social and Action Spaces Diverge: A Study in Children with Typical Development and Autism. Autism 2019, 23, 1687–1698. [Google Scholar] [CrossRef]
- Zhang, Z.; Gao, Y.; Zhou, S.T.; Zhang, T.; Zhang, W.K.; Meng, H. Psychological Cognitive Factors Affecting Visual Behavior and Satisfaction Preference for Forest Recreation Space. Forests 2022, 13, 136. [Google Scholar] [CrossRef]
- Zhou, S.; Chang, J.; Hu, T.; Luo, P.; Zhou, H. Spatiotemporal Variations of Land Use and Landscape Ecological Risk in A Resource-based City, From Rapid Development to Recession. Pol. J. Environ. Stud. 2019, 29, 475–490. [Google Scholar] [CrossRef]
- Li, Y.; Commenges, H.; Bordignon, F.; Bonhomme, C.; Deroubaix, J.F. The Tianjin Eco-City Model in the Academic Literature on Urban Sustainability. J. Clean. Prod. 2019, 213, 59–74. [Google Scholar] [CrossRef]
- Li, Q.; Yu, Y.; Jiang, X.; Guan, Y. Multifactor-based Environmental Risk Assessment for Sustainable Land-use Planning in Shenzhen, China. Sci. Total Environ. 2019, 657, 1051–1063. [Google Scholar] [CrossRef]
- Jia, Y.; Tang, X.; Liu, W. Spatial–temporal Evolution and Correlation Analysis of Ecosystem Service Value and Landscape Ecological Risk in Wuhu city. Sustainability 2020, 12, 2803. [Google Scholar] [CrossRef] [Green Version]


| Park Name | Location | Geographical Coordinates (N, E) | Area (HA) |
| NATIONAL WATER MUSEUM OF CHINA (NWMC) | No. 1 Shuibo Avenue, Xiaoshan District | 120.32033, 30.26778 | 129.8 |
| QIANJIANG CENTURY PARK (QCP) | Guanlan Road, Xiaoshan District | 112.45942, 34.62426 | 62 |
| YANJIANG WETLAND PARK (YWP) | The intersection of No. 15 Avenue and Zhijiang East Road in Qiantang District | 120.36557, 30.26874 | 33.2 |
| BINJIANG PARK (BP) | Wentao Road Intersection, Jianghan Road, Binjiang District | 120.20504, 30.21559 | 29.07 |
| CBD PARK (CP) | No. 181 Wuxing Road, Shangcheng District | 112.45942, 34.62426 | 26 |
| YANJIANG PARK (YP) | Wentao Road, Xiaoshan District | 120.23452, 30.24166 | 19.06 |
| QIANJIANG ECOLOGICAL PARK (QEP) | No. 270 Qige Road, Qiantang District | 120.32112, 30.30381 | 18 |
| BAITA PARK (BP) | No. 4, Old Fuxing Street, Shangcheng District | 120.14627, 30.20504 | 15.66 |
| LIUHETA CULTURAL PARK (LCP) | No. 16 Zhijiang Road, Xihu District | 120.14079, 30.20339 | 10.8 |
| WENYAN RIVERSIDE PARK (WRP) | Intersection of Wanda North Road and Wanda Middle Road, Xiaoshan District | 120.17122, 30.13673 | 3.98 |
| WANGJIANG PARK (WP) | No. 844 Zhijiang Road, Shangcheng District | 120.20483, 30.23133 | 3.32 |
| URBAN BALCONY PARK (UBP) | No. 1078 Zhijiang Road, Shangcheng District | 120.22326, 30.24792 | 2.81 |
| Goal Layer (A) | Criterion Layer (B) | Indicator Layer (C) | Method of Calculation | Indicator Meaning | Information Gathering |
|---|---|---|---|---|---|
| Space aesthetic value index (A1) | Horizontal space(B1) | Species diversity (C1) * | , H is the Shannon–Wiener diversity index, pi is fraction of the entire population made up of species i, S is number of species in the study area. | The Shannon-Wiener diversity index is an index used to investigate the diversity (α-diversity) within the territory of plant communities [59]. | Land-use data |
| Landscape evenness index (C2) * | , J is Pielou’s index of evenness. H is the Shannon–Weiner diversity index and lnS is the natural logarithm of species richness. | Landscape evenness index describes the distribution uniformity of each component in the landscape. The greater the value, the more uniform the distribution of each component in the landscape [59]. | Land-use data | ||
| Landscape disturbance index (C3) | HI = , HI is the hemeroby index, h is number of degrees of hemeroby, SA is total area of grid unit, Si is area of cover types with interference level i. | GIS was used to calculate the landscape disturbance index. The hemeroby index (HI) represents the degree of human interference; the smaller the interference intensity, the more conducive to the survival of organisms, the greater the ecological significance of the landscape [60,61]. | Land-use data | ||
| Landscape fragmentation index (C4) | Ci = Ni/Ai, Ni is the total number of patches, and Ai is the total area. | The fragmentation degree of landscape segmentation reflects the complexity of landscape spatial structure [62]. | Land-use data | ||
| Vertical Space (B2) | Vertical visual level (C5) | PA = T/F, T is the sum of diagonal elements, F is the sum of all elements of the matrix. | Vertical visual level represents the degree of superposition of multiple types of landscapes. The stronger the level, the more diverse types, landscape also has a deeper degree of superposition [63]. | Panoramic photos | |
| Color Diversity (C6) | C = σrgyb + 0.3 × μrgyb, R is red, G is green, B is blue, rg = R − G, rg is the difference between red channel and green channel. yb = 1/2(R + G) − B, yb represents the half of the sum of red and green channels minus the blue channel, , | Color diversity represents the number of plant colors, such as leaf color [64]. | Panoramic photos | ||
| Shape (C7) | , Hg is elevation of center grid, Hi is the elevation of the i-th grid in the neighborhood, and n is the number of neighborhood grids. | Shape is based on DEM data and is characterized by calculating the quantitative relationship between the center grid and the neighborhood grid elevation [65]. | Elevation data | ||
| Site section geometry (C8) | , p = ∂z/∂x, p is the elevation change rate in x direction, q = ∂z/∂y, q is the y direction elevation change rate, s = ∂2z/∂x∂y, s is the rate of change of height in x direction in y direction, t = ∂2z/∂y2, t is the change rate of height change rate in y direction, r = ∂2z/∂x2, r is the rate of change of elevation in x direction, z = f(x,y), z is the terrain surface function. | Site section geometry is used to describe the curvature variation of a surface curve or surface in the straight direction [66]. | Panoramic photos | ||
| Three-dimensional space (B3) | Diffuse non-interceptance (DIFN) (C9) | SVIn = Sn/An, Sn is the number of pixels in the n-th image, and An is the number of pixels in the sky range in the n-th image. | Diffuse non-interceptance (DIFN) refers to the degree of blue sky that can be seen. It is determined by construction and greening. Open sky visibility can relieve people’s life pressure [67]. | Elevation data | |
| Tridimensional green biomass (C10) | , , Vc (s, t) is the tridimensional green biomass of the vegetation in each park, s and t are the number of rows and columns of the image; ∆d is the resolution of the image (0.1 m × 0.1 m); hij is the actual ground elevation, Hij is the digital surface elevation; D is the spatial extent of each park. | Tridimensional green biomass refers to the space volume occupied by the stems and leaves of all growing plants. According to the high resolution characteristics of satellite images, the tridimensional green biomass of the park is estimated by multiplying the base area by the height [68]. | Elevation data | ||
| Canopy density (C11) | A = Acanopy/Aplot, Acanopy is the projected area of canopy (metres2), and Aplot is the standard area (metres2). | Canopy density refers to the degree to which the crowns of trees in a forest meet each other and shade the ground [69]. | Ichnography | ||
| Relief amplitude (C12) | RA = Emax − Emin, Emax and Emin are the maximum elevation value and the minimum elevation value in each park area. | Relief amplitude is a macroscopic indicator of the topographical features of a region [70]. | Elevation data |
| Park Name | C1 | C2 | C3 | C4 | C5 | C6 | C7 | C8 | C9 | C10 | C11 | C12 | Average Value |
|---|---|---|---|---|---|---|---|---|---|---|---|---|---|
| QEP | 0.8334 | 0.8863 | 0.4344 | 0.2235 | 0.2639 | 0.5455 | 0.0033 | 0.8061 | 0.2237 | 0.7318 | 0.7624 | 0.8536 | 0.5473 |
| QCP | 0.7419 | 0.8454 | 0.2459 | 0.1823 | 0.4226 | 0.6363 | 0.0185 | 0.8488 | 0.2648 | 0.8711 | 0.5606 | 0.8394 | 0.5398 |
| YP | 0.7304 | 0.7863 | 0.3584 | 0.1790 | 0.4545 | 0.4226 | 0.0739 | 0.8032 | 0.3048 | 0.6742 | 0.6126 | 0.8024 | 0.5169 |
| WRP | 0.6497 | 0.4525 | 0.5687 | 0.1844 | 0.7142 | 0.1188 | 0.0245 | 0.8085 | 0.2941 | 0.8331 | 0.7043 | 0.8258 | 0.5149 |
| YWP | 0.7216 | 0.6012 | 0.414 | 0.0708 | 0.5000 | 0.3330 | 0.0080 | 0.8250 | 0.3226 | 0.6942 | 0.7714 | 0.8409 | 0.5086 |
| BTP | 0.6817 | 0.3113 | 0.5361 | 0.2357 | 0.2500 | 0.6234 | 0.0172 | 0.8562 | 0.3514 | 0.6804 | 0.5140 | 0.8520 | 0.4925 |
| NWMC | 0.6812 | 0.7063 | 0.4544 | 0.1807 | 0.5454 | 0.3928 | 0.0031 | 0.9351 | 0.3831 | 0.1743 | 0.4820 | 0.9332 | 0.4893 |
| CP | 0.5214 | 0.4067 | 0.3344 | 0.0660 | 0.3636 | 0.4824 | 0.0206 | 0.8254 | 0.2935 | 0.9015 | 0.7604 | 0.8394 | 0.4846 |
| BP | 0.5268 | 0.3349 | 0.5319 | 0.1640 | 0.5714 | 0.3376 | 0.0622 | 0.8468 | 0.3132 | 0.6221 | 0.6419 | 0.8373 | 0.4825 |
| LCP | 0.3855 | 0.4874 | 0.58369 | 0.2845 | 0.7000 | 0.1911 | 0.0813 | 0.8100 | 0.1426 | 0.4438 | 0.8309 | 0.8095 | 0.4792 |
| WP | 0.1942 | 0.0654 | 0.469 | 0.7467 | 0.3000 | 0.6270 | 0.0648 | 0.8622 | 0.7023 | 0.5627 | 0.1903 | 0.8513 | 0.4697 |
| UBP | 0.0533 | 0.0656 | 0.4399 | 0.7677 | 0.7142 | 0.4049 | −0.0070 | 0.8564 | 0.5703 | 0.5307 | 0.2732 | 0.8737 | 0.4619 |
 First level park
  Second level park
  Third level park
  Fourth-level park.
| Park Name | Horizontal Space | Vertical Space | Three-Dimensional Space |
|---|---|---|---|
| QEP | 0.5944 | 0.4047 | 0.6429 |
| QCP | 0.5039 | 0.4816 | 0.6340 |
| YP | 0.5135 | 0.4385 | 0.5985 |
| WRP | 0.4638 | 0.4165 | 0.6643 |
| YWP | 0.4519 | 0.4165 | 0.6573 |
| BTP | 0.4412 | 0.4367 | 0.5995 |
| NWMC | 0.5057 | 0.4691 | 0.4932 |
| CP | 0.3321 | 0.4230 | 0.6987 |
| BP | 0.3894 | 0.4545 | 0.6036 |
| LCP | 0.4353 | 0.4456 | 0.5567 |
| WP | 0.3688 | 0.4635 | 0.5767 |
| UBP | 0.3316 | 0.4921 | 0.5620 |
First level park Second level park Third level park Fourth-level park.| Park Name | Landscape Evaluation Number | Park Evaluation Number | Landscape Relative Evaluation Rate | Landscape Emotional Value | Park Emotional Value | Relative Emotional Value |
|---|---|---|---|---|---|---|
| QCP | 410 | 1376 | 29.8 | 7.2 | 3.5 | 2.1 |
| QEP | 26 | 84 | 30.1 | 2.3 | 3.3 | 0.7 |
| YWP | 10 | 28 | 35.7 | 7.8 | 4.5 | 1.7 |
| NWMC | 1 | 3 | 33.3 | 3.0 | 2.0 | 1.5 |
| YP | 7 | 28 | 25.0 | 2.4 | 1.4 | 1.7 |
| CP | 32 | 168 | 19.0 | 2.5 | 1.7 | 1.5 |
| WP | 3 | 30 | 23.3 | 0.6 | 1.5 | 0.4 |
| BTP | 225 | 630 | 31.0 | 5.9 | 2.1 | 2.8 |
| BP | 27 | 182 | 14.8 | 4.9 | 3.5 | 1.4 |
| LCP | 22 | 98 | 22.4 | 3.7 | 3.1 | 1.2 |
| WRP | 2 | 5 | 40.0 | 1.5 | 0.8 | 1.9 |
| UBP | 185 | 1822 | 10.2 | 2.4 | 2.8 | 0.9 |
| Park Name | Vision | Smell | Hearing | Touch | Taste | Feeling |
|---|---|---|---|---|---|---|
| QCP | Wonderful, bright, beautiful scenery | Fresh air, sweet osmanthus fragrance | Good listening, quiet | Smooth | Delicious | Happy |
| YWP | Beautiful, spectacular | Refreshing, bursts of osmanthus fragrance | Quiet, peaceful, loneness | Beautiful, comfortable, natural and comfortable, | ||
| NWMC | Very big | Moldy odor | Not good | |||
| YP | Greenery, colorful | Comfort, enjoyable, | ||||
| CP | Huge, beautiful, golden flower field, green grass | Fresh, urban green aroma | Quiet, peaceful | Soft | Calm, beautiful environment, impressive | |
| BTP | Beautiful, white reed flowers, golden apricot forest, cherry blossom colorful, warm color magnolia | Refreshed | Clean, spring rain drizzling | Swaying in the wind | Tasty | Beautiful, worthwhile trip, poetic, pleasant, still unfinished |
| BP | Charming, spectacular, endless, colorful falling cherry blossoms, shady trees | Serenity, tranquility | The river wind blows | Safe, comfortable | ||
| LCP | National color beautiful, flowers such as a brocade | Day fragrance | Quiet, silent | Good, happy | ||
| WRP | Beautiful, good-looking | Fragrant | Tranquility | Leisurely |
| Park Name | Thermal Mean | Thermal Grade |
|---|---|---|
| CP | 7.1583 | High-heat grade |
| UBP | 6.9481 | High-heat grade |
| QEP | 5.8863 | High-heat grade |
| QCP | 3.3249 | Sub-heat grade |
| BTP | 2.1420 | Sub-heat grade |
| BP | 2.1073 | Sub-heat grade |
| YP | 1.9804 | low-heat grade |
| LCP | 1.9525 | low-heat grade |
| WRP | 1.6562 | low-heat grade |
| WP | 1.6217 | low-heat grade |
| YWP | 1.4416 | low-heat grade |
| NWMC | 1.3719 | low-heat grade |
| Park Name | Recreation Time (h) | Recreation Number (Persons/Day) | Recreation Frequency (Times/Week) | Recreation Purpose |
|---|---|---|---|---|
| QCP | 1.5 | 2128 | 4 | Eating, square dancing, passage, fairs, walking |
| QEP | 2 | 536 | 4 | Viewing, running, basketball, badminton, tennis, walking |
| YWP | 1.5 | 336 | 3 | Viewing, chatting, walking the dog, picnicking, playing |
| NWMC | 1 | 384 | 1 | Chatting, accompanying the family |
| YP | 1.5 | 384 | 2 | Running, cycling, chatting, playing table tennis, walking |
| CP | 3 | 2160 | 3 | Sightseeing, photography, playing, cycling, running, chatting, playing cards, walking |
| WP | 0.5 | 680 | 1 | Rope skipping, dog walking, square dancing, Taiji |
| BTP | 2.5 | 1008 | 2 | Sightseeing, photography, playing, spending time with family |
| BP | 1.5 | 728 | 2 | Running, cycling, chatting, walking the dog, rope skipping, walking, daze |
| LCP | 1.5 | 784 | 1 | Viewing, photography, mountaineering, accompanying family |
| WRP | 1.5 | 552 | 2 | Photography, play, running, square dancing |
| UBP | 0.5 | 2208 | 2 | Sightseeing, playing, square dance, Taiji, chatting, walking |
| Park Name | Coupling Index | Coordination Index | Coupling Coordination Index | Coordination Level | Coupling Coordination Degree |
|---|---|---|---|---|---|
| QCP | 0.995 | 0.791 | 0.887 | 9 | Good coordination |
| WRP | 0.998 | 0.595 | 0.770 | 8 | Moderate coordination |
| BTP | 0.898 | 0.587 | 0.726 | 8 | Moderate coordination |
| CP | 0.867 | 0.573 | 0.705 | 8 | Moderate coordination |
| QEP | 0.746 | 0.544 | 0.637 | 7 | Mild coordination |
| YP | 0.946 | 0.489 | 0.680 | 7 | Mild coordination |
| LCP | 0.865 | 0.435 | 0.614 | 7 | Mild coordination |
| YWP | 0.677 | 0.382 | 0.508 | 6 | Poor coordination |
| BP | 0.901 | 0.266 | 0.490 | 5 | Near maladjustment |
| NWMC | 0.432 | 0.265 | 0.338 | 4 | Mild maladjustment |
| UBP | 0.405 | 0.263 | 0.326 | 4 | Mild maladjustment |
| WP | 0.628 | 0.082 | 0.226 | 3 | Moderate maladjustment |
| Park Name | Coupling Index | Coordination Index | Coupling Coordination Index | Coordination Level | Coupling Coordination Degree |
|---|---|---|---|---|---|
| QCP | 0.992 | 0.804 | 0.893 | 9 | Good coordination |
| YP | 0.996 | 0.591 | 0.767 | 8 | Mild coordination |
| WRP | 1 | 0.62 | 0.788 | 8 | Moderate coordination |
| YWP | 1 | 0.543 | 0.737 | 8 | Mild coordination |
| BTP | 0.885 | 0.676 | 0.773 | 8 | Moderate coordination |
| QEP | 0.645 | 0.561 | 0.602 | 7 | Mild coordination |
| NWMC | 0.985 | 0.392 | 0.621 | 7 | Severe maladjustment |
| CP | 0.966 | 0.365 | 0.594 | 6 | Good coordination |
| BP | 0.966 | 0.332 | 0.567 | 6 | Mild coordination |
| LCP | 0.972 | 0.273 | 0.515 | 6 | Poor coordination |
| UBP | 0.413 | 0.112 | 0.215 | 3 | Moderate coordination |
| WP | 0.576 | 0.055 | 0.178 | 2 | Moderate maladjustment |
| Park Name | Coupling Index | Coordination Index | Coupling Coordination Index | Coordination Level | Coupling Coordination Degree |
|---|---|---|---|---|---|
| QCP | 0.999 | 0.735 | 0.857 | 9 | Good coordination |
| CP | 0.93 | 0.725 | 0.821 | 9 | Near maladjustment |
| WRP | 0.998 | 0.583 | 0.763 | 8 | Moderate coordination |
| BTP | 0.91 | 0.7 | 0.798 | 8 | Moderate maladjustment |
| LCP | 0.922 | 0.549 | 0.711 | 8 | Mild coordination |
| YP | 0.951 | 0.414 | 0.627 | 7 | Good coordination |
| QEP | 0.809 | 0.321 | 0.51 | 6 | Severe maladjustment |
| UBP | 0.893 | 0.389 | 0.59 | 6 | Good coordination |
| YWP | 0.593 | 0.3 | 0.421 | 5 | Poor coordination |
| BP | 0.857 | 0.276 | 0.486 | 5 | Near maladjustment |
| NWMC | 0.289 | 0.235 | 0.26 | 3 | Poor coordination |
| WP | 0.506 | 0.073 | 0.192 | 2 | Poor coordination |
| Park Name | Coupling Index | Coordination Index | Coupling Coordination Index | Coordination Level | Coupling Coordination Degree |
|---|---|---|---|---|---|
| QCP | 0.997 | 0.834 | 0.912 | 10 | Good coordination |
| QEP | 0.947 | 0.75 | 0.843 | 9 | Moderate coordination |
| WRP | 0.998 | 0.581 | 0.761 | 8 | Moderate coordination |
| CP | 0.821 | 0.63 | 0.719 | 8 | Moderate maladjustment |
| YP | 0.924 | 0.464 | 0.655 | 7 | Mild coordination |
| BTP | 0.998 | 0.386 | 0.62 | 7 | Good coordination |
| LCP | 0.822 | 0.485 | 0.631 | 7 | Mild maladjustment |
| YWP | 0.591 | 0.302 | 0.422 | 5 | Mild coordination |
| BP | 0.955 | 0.19 | 0.426 | 5 | Poor coordination |
| WP | 0.988 | 0.117 | 0.341 | 4 | Near maladjustment |
| NWMC | 0.341 | 0.167 | 0.239 | 3 | Poor coordination |
| UBP | 0.262 | 0.287 | 0.274 | 3 | Moderate maladjustment |
Disclaimer/Publisher’s Note: The statements, opinions and data contained in all publications are solely those of the individual author(s) and contributor(s) and not of MDPI and/or the editor(s). MDPI and/or the editor(s) disclaim responsibility for any injury to people or property resulting from any ideas, methods, instructions or products referred to in the content. |
© 2023 by the authors. Licensee MDPI, Basel, Switzerland. This article is an open access article distributed under the terms and conditions of the Creative Commons Attribution (CC BY) license (https://creativecommons.org/licenses/by/4.0/).
Share and Cite
Liu, X.; Chen, X.; Huang, Y.; Wang, W.; Zhang, M.; Jin, Y. Landscape Aesthetic Value of Waterfront Green Space Based on Space–Psychology–Behavior Dimension: A Case Study along Qiantang River (Hangzhou Section). Int. J. Environ. Res. Public Health 2023, 20, 3115. https://doi.org/10.3390/ijerph20043115
Liu X, Chen X, Huang Y, Wang W, Zhang M, Jin Y. Landscape Aesthetic Value of Waterfront Green Space Based on Space–Psychology–Behavior Dimension: A Case Study along Qiantang River (Hangzhou Section). International Journal of Environmental Research and Public Health. 2023; 20(4):3115. https://doi.org/10.3390/ijerph20043115
Chicago/Turabian StyleLiu, Xiaojia, Xi Chen, Yan Huang, Weihong Wang, Mingkan Zhang, and Yang Jin. 2023. "Landscape Aesthetic Value of Waterfront Green Space Based on Space–Psychology–Behavior Dimension: A Case Study along Qiantang River (Hangzhou Section)" International Journal of Environmental Research and Public Health 20, no. 4: 3115. https://doi.org/10.3390/ijerph20043115
APA StyleLiu, X., Chen, X., Huang, Y., Wang, W., Zhang, M., & Jin, Y. (2023). Landscape Aesthetic Value of Waterfront Green Space Based on Space–Psychology–Behavior Dimension: A Case Study along Qiantang River (Hangzhou Section). International Journal of Environmental Research and Public Health, 20(4), 3115. https://doi.org/10.3390/ijerph20043115