
Associations of Social Networks with Physical Activity Enjoyment among Older Adults: Walkability as a Modifier through a STROBE-Compliant Analysis

 ,
,  , ,
, ,  ,
, 
 and
and
Abstract
:1. Introduction
2. Methods and Materials
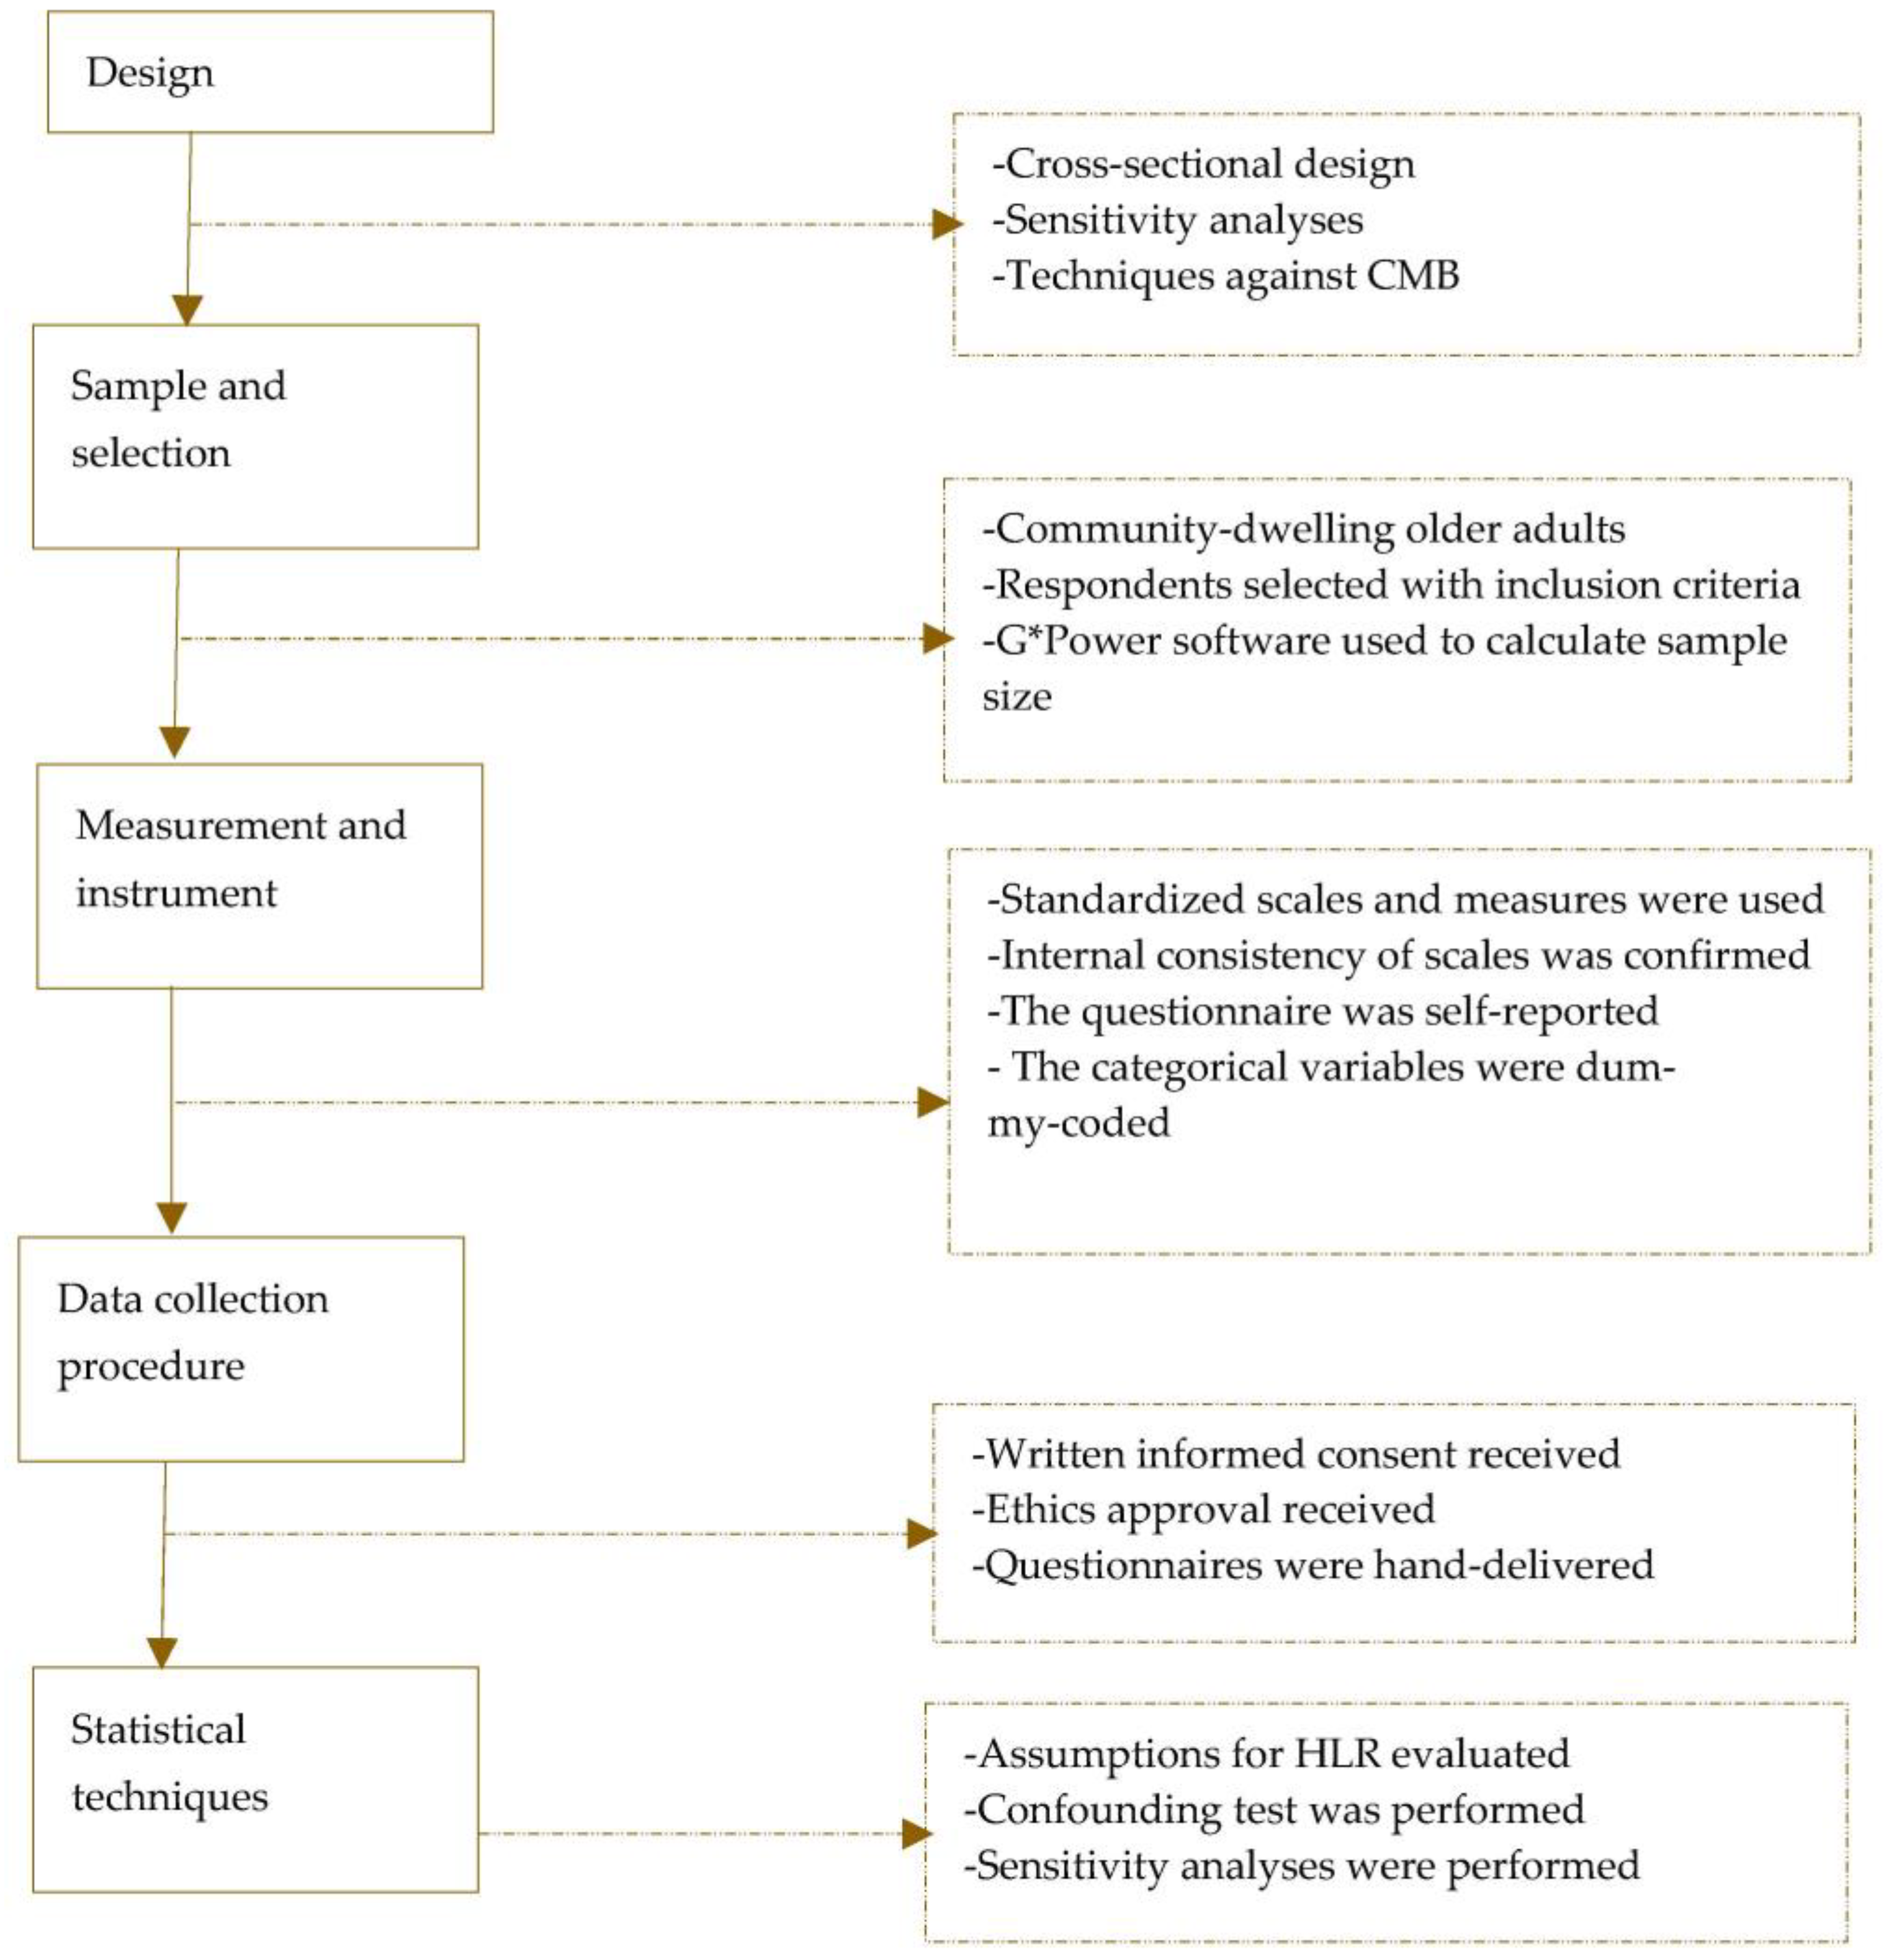
2.1. Design
2.2. Study Population, Sample, and Selection
2.3. Measurement and Operationalisation
2.4. The Questionnaire and Measures against Common Method Bias
2.5. Data Collection and Ethics
2.6. Statistical Analysis Methods
3. Findings
4. Discussion
4.1. Discussion of Findings
4.2. Strengths and Limitations
5. Conclusions
Author Contributions
Funding
Institutional Review Board Statement
Informed Consent Statement
Data Availability Statement
Acknowledgments
Conflicts of Interest
Appendix A
Appendix A.1. Measures of Active and Sedentary Social Network Size
- Active social network size
- 1.
- In the last 7 days, how many of your social networks (i.e., friends, blood relations, neighbours, workmates, or acquaintances) …
| Task | Number |
| |
|
- Sedentary social network size
- 2.
- In the last 7 days, how many of your social networks (i.e., friends, blood relations, neighbours, workmates, or acquaintances) have encouraged or compelled you to sit or stay at one place (without moving around) for at least 1 hour on a typical day?
Appendix A.2. Physical Activity Enjoyment Scale
| No | Statement | 1 | 2 | 3 | 4 | 5 | 6 | 7 |
| 1 | I enjoy it | |||||||
| 2 | I feel interested in it | |||||||
| 3 | I like it | |||||||
| 4 | I find it pleasurable | |||||||
| 5 | I am very absorbed in it | |||||||
| 6 | It’s a lot of fun | |||||||
| 7 | I find it energizing | |||||||
| 8 | It makes me happy | |||||||
| 9 | It’s very pleasant | |||||||
| 10 | I feel good physically while doing it | |||||||
| 11 | It’s very invigorating | |||||||
| 12 | I am not at all frustrated by it | |||||||
| 13 | It’s very gratifying | |||||||
| 14 | It’s very exhilarating | |||||||
| 15 | It’s very stimulating | |||||||
| 16 | It gives me a strong sense of accomplishment | |||||||
| 17 | It’s very refreshing | |||||||
| 18 | I felt as though there was nothing else I would rather be doing |
Appendix A.3. Measures of Neighbourhood Walkability
| # | Statement | 1 | 2 | 3 | 4 | 5 |
| 1 | Many places are easy to go within walking distance | |||||
| 2 | It is easy to walk to a public transport stop | |||||
| 3 | There are footpaths on most of the streets | |||||
| 4 | There are crosswalks and pedestrian signals | |||||
| 5 | The streets in my neighbourhood are not hilly | |||||
| 6 | Walkers in my neighbourhood can easily be seen | |||||
| 7 | There is lots of greenery around my neighbourhood | |||||
| 8 | There are many interesting things to look at | |||||
| 9 | There is not much traffic along nearby streets | |||||
| 10 | My neighbourhood has parks and walking trails | |||||
| 11 | Crime rate in my neighbourhood is not a problem |
Appendix B
Appendix B.1. Steps Taken to Assess and Meet Five Necessary Assumptions for HLR Analysis
| # | Assumption | Step | Result | Decision |
| 1 | Normality of the data associated with the dependent variable | We computed the Mahalanobis values through the HLR in which PA enjoyment was the dependent variable | The significance values associated with the Mahalanobis values met the condition p < 0.001; thus, normality was confirmed. Each variable also produced a skewness and kurtosis value not greater than 2 in absolute terms [26,28] | We confirmed normality of the data for HLR analysis |
| 2 | Linearity | We plotted standardised residuals against standardised predicted values of the dependent variable in the above HLR analysis. We observed the linearity of the lines of best fit | The graph shows a straight line as recommended [28] | Assumption or condition met for HLR analysis |
| 3 | Independence of errors | Durbin–Watson statistics were generated for all the HLR models fitted | Durbin–Watson statistic was approximately 2 as recommended [26] | The assumption was met for HLR analysis |
| 4 | Multi-collinearity | Tolerance values were computed through the above HLR analysis | The tolerance values are >0.2 as recommended [28] | The assumption was met for HLR analyses |
| 5 | Homogeneity of variances | We plotted standardised residuals against standardised predicted values of the dependent variable in all HLR models | The graphs produced a satisfactory pattern as recommended [28] | The assumption was met for HLR analyses |
| Note: HLR—hierarchical linear regression; PA—physical activity. | ||||
Appendix B.2. Steps Taken in the First Sensitivity Analyses for Confounding Variables
| Stage | Step | Assumption |
| 1 | 1 | Fit a simple linear regression model to assess the relationship between the active social network size and physical activity enjoyment |
| 2 | Note the standardised regression weight from Step 1 | |
| 3 | Fit a multiple linear regression model in which all measured confounding variables are treated as predictors of the main independent variable, physical activity enjoyment | |
| 4 | Identify from Step 3 potential confounders that have a p-value ≥ 0.25 | |
| 5 | Predictors from Step 4 that produced a p ≥ 0.25 should be removed from the analysis and the others kept for the next stage of the analysis | |
| 2 | 6 | Adjust for each of the remaining confounding variables in the model fitted at Step 1 |
| 7 | Compute the per cent change between the standardised regression weight at Step 1 and the new weight resulting from Step 6 | |
| 8 | All potential confounders that produce a change of 10% or more should be incorporated into the final analysis as the ultimate confounders | |
| 9 | Repeat the above eight steps, with the sedentary social network size now serving as the primary predictor |
Appendix C. STROBE Statement—Checklist of Items That Should Be Included in Reports of Observational Studies
| Item No | Recommendation | Achieved? | Section No. | |
| Title and abstract | 1 | (a) Indicate the study’s design with a commonly used term in the title or the abstract | Yes | Abstract |
| (b) Provide in the abstract an informative and balanced summary of what was done and what was found | Yes | Abstract | ||
| Introduction | ||||
| Background/rationale | 2 | Explain the scientific background and rationale for the investigation being reported | Yes | Section 1 |
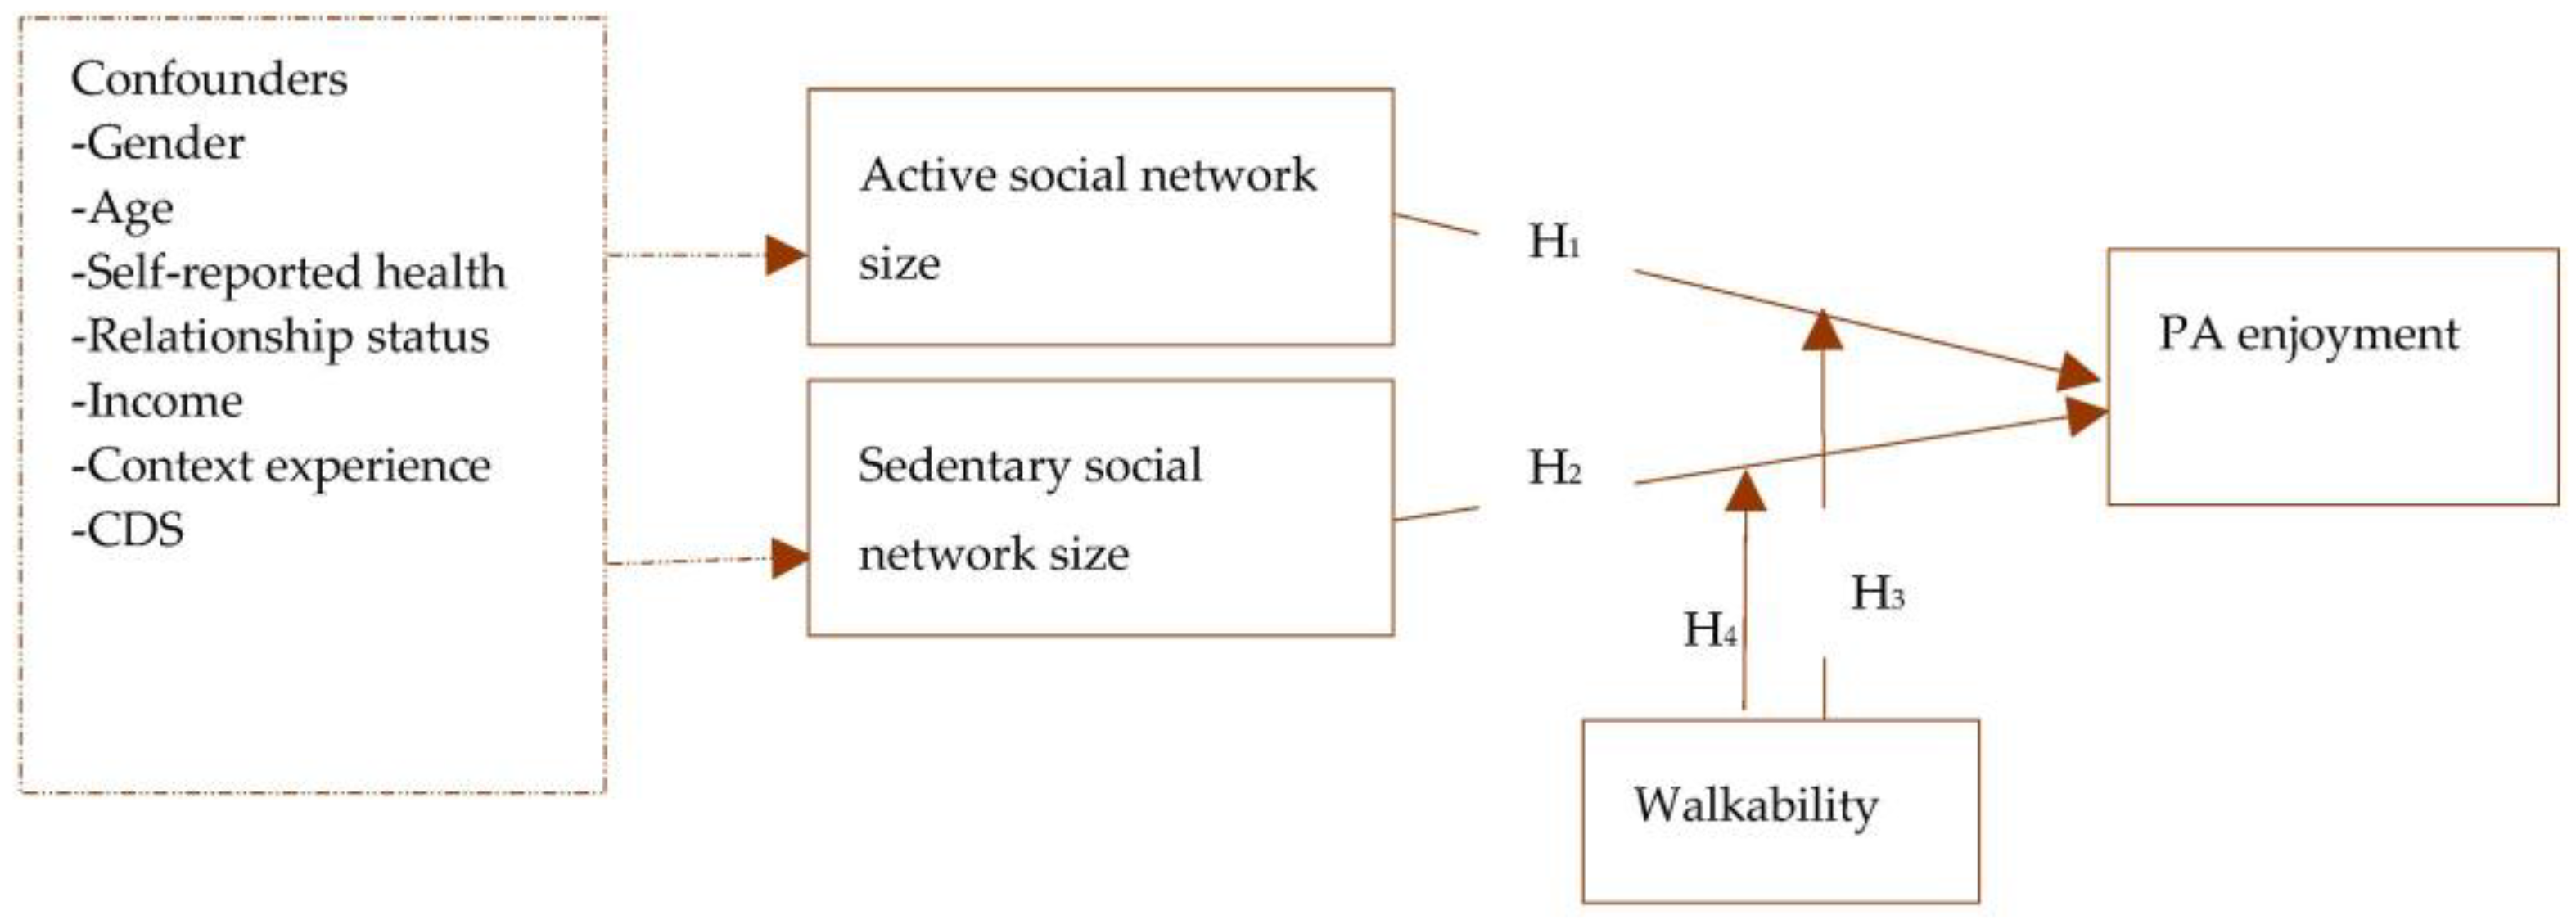
| Objectives | 3 | State specific objectives, including any prespecified hypotheses | Yes | Section 1 and Section 2.6 |
| Methods | ||||
| Study design | 4 | Present key elements of study design early in the paper | Yes | Section 2.1 |
| Setting | 5 | Describe the setting, locations, and relevant dates, including periods of recruitment, exposure, follow-up, and data collection | Yes | Section 2.2 |
| Participants | 6 | (a) Cohort study—Give the eligibility criteria, and the sources and methods of selection of participants. Describe methods of follow-up Case-control study—Give the eligibility criteria, and the sources and methods of case ascertainment and control selection. Give the rationale for the choice of cases and controls Cross-sectional study—Give the eligibility criteria, and the sources and methods of selection of participants | Yes | Section 2.2 |
| (b) Cohort study—For matched studies, give matching criteria and number of exposed and unexposed Case-control study—For matched studies, give matching criteria and the number of controls per case | Not applicable (NA) | NA | ||
| Variables | 7 | Clearly define all outcomes, exposures, predictors, potential confounders, and effect modifiers. Give diagnostic criteria, if applicable | Yes | Section 2.3 |
| Data sources/ measurement | 8 | For each variable of interest, give sources of data and details of methods of assessment (measurement). Describe comparability of assessment methods if there is more than one group | Yes | Section 2.2 and Section 2.3 |
| Bias | 9 | Describe any efforts to address potential sources of bias | Yes | Section 2.3 and Section 2.6 |
| Study size | 10 | Explain how the study size was arrived at | Yes | Section 2.2 |
| Quantitative variables | 11 | Explain how quantitative variables were handled in the analyses. If applicable, describe which groupings were chosen and why | Yes | Section 2.3 |
| Statistical methods | 12 | (a) Describe all statistical methods, including those used to control for confounding | Yes | Section 2.6 |
| (b) Describe any methods used to examine subgroups and interactions | Yes | Section 2.6 | ||
| (c) Explain how missing data were addressed | Yes | Section 2.6 | ||
| (d) Cohort study—If applicable, explain how loss to follow-up was addressed Case-control study—If applicable, explain how matching of cases and controls was addressed Cross-sectional study—If applicable, describe analytical methods taking account of sampling strategy | Yes | |||
| (e) Describe any sensitivity analyses | Yes | Section 2.6 | ||
| Results | ||||
| Participants | 13 | (a) Report numbers of individuals at each stage of study—eg numbers potentially eligible, examined for eligibility, confirmed eligible, included in the study, completing follow-up, and analysed | Yes | Section 2.2 and Section 2.5 |
| (b) Give reasons for non-participation at each stage | Yes | Section 2.5 | ||
| (c) Consider use of a flow diagram | Yes | Section 2.1 | ||
| Descriptive data | 14 | (a) Give characteristics of study participants (eg demographic, clinical, social) and information on exposures and potential confounders | Yes | Section 2.1 and Section 3 |
| (b) Indicate number of participants with missing data for each variable of interest | Yes | Section 2.6 and Section 3 | ||
| (c) Cohort study—Summarise follow-up time (eg, average and total amount) | NA | |||
| Outcome data | 15 | Cohort study—Report numbers of outcome events or summary measures over time | NA | |
| Case-control study—Report numbers in each exposure category, or summary measures of exposure | NA | |||
| Cross-sectional study—Report numbers of outcome events or summary measures | Yes | Section 2.6 and Section 3 | ||
| Main results | 16 | (a) Give unadjusted estimates and, if applicable, confounder-adjusted estimates and their precision (eg, 95% confidence interval). Make clear which confounders were adjusted for and why they were included | Yes | Section 2.6 and Section 3 |
| (b) Report category boundaries when continuous variables were categorized | Yes | Section 2.3 and Section 3 | ||
| (c) If relevant, consider translating estimates of relative risk into absolute risk for a meaningful time period | NA | |||
| Other analyses | 17 | Report other analyses done—eg analyses of subgroups and interactions, and sensitivity analyses | Yes | Section 2.6 and Section 3 |
| Discussion | ||||
| Key results | 18 | Summarise key results with reference to study objectives | Yes | Section 4 |
| Limitations | 19 | Discuss limitations of the study, taking into account sources of potential bias or imprecision. Discuss both direction and magnitude of any potential bias | Yes | Section 4.2 |
| Interpretation | 20 | Give a cautious overall interpretation of results considering objectives, limitations, multiplicity of analyses, results from similar studies, and other relevant evidence | Yes | Section 4.1 |
| Generalisability | 21 | Discuss the generalisability (external validity) of the study results | Yes | Section 4.2 |
| Other information | ||||
| Funding | 22 | Give the source of funding and the role of the funders for the present study and, if applicable, for the original study on which the present article is based | Yes | Appendix A, Appendix B and Appendix C |
References
- Guthold, R.; Stevens, G.A.; Riley, L.M.; Bull, F.C. Worldwide trends in insufficient physical activity from 2001 to 2016: A pooled analysis of 358 population-based surveys with 1·9 million participants. Lancet Glob. Health 2018, 6, e1077–e1086. [Google Scholar] [CrossRef]
- Bauman, A.; Bull, F.; Chey, T.; Craig, C.L.; Ainsworth, B.E.; Sallis, J.F.; Bowles, H.R.; Hagstromer, M.; Sjostrom, M.; Pratt, M.; et al. The international prevalence study on physical activity: Results from 20 countries. Int. J. Behav. Nutr. Phys. Act. 2009, 6, 21. [Google Scholar] [CrossRef] [PubMed]
- Vuori, I.M.; Lavie, C.J.; Blair, S.N. Physical activity promotion in the health care system. Mayo Clin. Proc. 2013, 88, 1446–1461. [Google Scholar] [CrossRef] [PubMed]
- Zandieh, R.; Acheampong, R.A. Mobility and healthy ageing in the city: Exploring opportunities and challenges of autonomous vehicles for older adults’ outdoor mobility. Cities 2021, 112, 103135. [Google Scholar] [CrossRef]
- Asiamah, N.; Petersen, C.; Kouveliotis, K.; Eduafo, R. The Built Environment and Socio-Demographic Correlates of Partial and Absolute Sedentary Behaviours in Community-Dwelling Older Adults in Accra, Ghana. J. Cross. Cult. Gerontol. 2021, 36, 21–42. [Google Scholar] [CrossRef] [PubMed]
- Legh-Jones, H.; Moore, S. Network social capital, social participation, and physical inactivity in an urban adult population. Soc. Sci. Med. 2012, 74, 1362–1367. [Google Scholar] [CrossRef] [PubMed]
- Izquierdo, M.; Duque, G.; Morley, J.E. Physical activity guidelines for older people: Knowledge gaps and future directions. Lancet Health Longev. 2021, 2, e380–e383. [Google Scholar] [CrossRef] [PubMed]
- Asiamah, N.; Conduah, A.K.; Eduafo, R. Social network moderators of the association between Ghanaian older adults’ neighbourhood walkability and social activity. Health Promot. Int. 2021, 36, 1357–1367. [Google Scholar] [CrossRef] [PubMed]
- Asiamah, N. Social engagement and physical activity: Commentary on why the activity and disengagement theories of ageing may both be valid. Cogent Med. 2017, 4, 1289664. [Google Scholar] [CrossRef]
- Morris, K.A.; Arundell, L.; Cleland, V.; Teychenne, M. Social ecological factors associated with physical activity and screen time amongst mothers from disadvantaged neighbourhoods over three years. Int. J. Behav. Nutr. Phys. Act. 2020, 17, 110. [Google Scholar] [CrossRef] [PubMed]
- Murrock, C.J.; Bekhet, A.; Zauszniewski, J.A. Psychometric Evaluation of the Physical Activity Enjoyment Scale in Adults with Functional Limitations. Issues Ment. Health Nurs. 2016, 37, 164–171. [Google Scholar] [CrossRef] [PubMed]
- Mullen, S.P.; Olson, E.A.; Phillips, S.M.; Szabo, A.N.; Wójcicki, T.R.; Mailey, E.L.; Gothe, N.P.; Fanning, J.T.; Kramer, A.F.; McAuley, E. Measuring enjoyment of physical activity in older adults: Invariance of the physical activity enjoyment scale (paces) across groups and time. Int. J. Behav. Nutr. Phys. Act. 2011, 8, 103. [Google Scholar] [CrossRef] [PubMed]
- Budd, E.L.; McQueen, A.; Eyler, A.A.; Haire-Joshu, D.; Auslander, W.F.; Brownson, R.C. The role of physical activity enjoyment in the pathways from the social and physical environments to physical activity of early adolescent girls. Prev. Med. 2018, 111, 6–13. [Google Scholar] [CrossRef] [PubMed]
- Jago, R.; Brockman, R.; Fox, K.R.; Cartwright, K.; Page, A.S.; Thompson, J.L. Friendship groups and physical activity: Qualitative findings on how physical activity is initiated and maintained among 10-11 year old children. Int. J. Behav. Nutr. Phys. Act. 2009, 6, 4. [Google Scholar] [CrossRef] [PubMed]
- Fitzgerald, A.; Fitzgerald, N.; Aherne, C. Do peers matter? A review of peer and/or friends’ influence on physical activity among American adolescents. J. Adolesc. 2012, 35, 941–958. [Google Scholar] [CrossRef] [PubMed]
- Garn, A.C.; Centeio, E.; Shen, B.; Martin, J.; McCaughtry, N. A moderated mediation analysis of children’s physical activity enjoyment. J. Posit. Psychol. 2016, 11, 428–438. [Google Scholar] [CrossRef]
- Bennett, E.V.; Hurd Clarke, L.; Wolf, S.A.; Dunlop, W.L.; Harden, S.M.; Liu, Y.; Estabrooks, P.A.; Rhodes, R.E.; Beauchamp, M.R. Older adults’ experiences of group-based physical activity: A qualitative study from the ‘GOAL’ randomized controlled trial. Psychol. Sport Exerc. 2018, 39, 184–192. [Google Scholar] [CrossRef]
- Shergold, I.; Lyons, G.; Hubers, C. Future mobility in an ageing society—Where are we heading? J. Transp. Health 2015, 2, 86–94. [Google Scholar] [CrossRef]
- Notthoff, N.; Reisch, P.; Gerstorf, D. Individual Characteristics and Physical Activity in Older Adults: A Systematic Review. Gerontology 2017, 63, 443–459. [Google Scholar] [CrossRef]
- Mema, E.; Spain, E.S.; Martin, C.K.; Hill, J.O.; Sayer, R.D.; McInvale, H.D.; Evans, L.A.; Gist, N.H.; Borowsky, A.D.; Thomas, D.M. Social influences on physical activity for establishing criteria leading to exercise persistence. PLoS ONE 2022, 17, e0274259. [Google Scholar] [CrossRef]
- Seifert, A.; Wahl, H.W. Young at heart and online? Subjective age and internet use in two Swiss survey studies. Educ. Gerontol. 2018, 44, 139–147. [Google Scholar] [CrossRef]
- Cantor, M.H. Life space and the social support system of the inner city elderly of new york. Gerontologist 1975, 15, 23–27. [Google Scholar] [CrossRef] [PubMed]
- Cleland, V.; Ball, K.; Hume, C.; Timperio, A.; King, A.C.; Crawford, D. Individual, social and environmental correlates of physical activity among women living in socioeconomically disadvantaged neighbourhoods. Soc. Sci. Med. 2010, 70, 2011–2018. [Google Scholar] [CrossRef] [PubMed]
- Sallis, J.F.; Kerr, J.; Carlson, J.A.; Norman, G.J.; Saelens, B.E.; Durant, N.; Ainsworth, B.E. Evaluating a brief self-report measure of neighborhood environments for physical activity research and surveillance: Physical Activity Neighborhood Environment Scale (PANES). J. Phys. Act. Health 2010, 7, 533–540. [Google Scholar] [CrossRef]
- Brydges, C.R. Effect Size Guidelines, Sample Size Calculations, and Statistical Power in Gerontology. Innov. Aging 2019, 3, igz036. [Google Scholar] [CrossRef]
- Asiamah, N.; Lowry, R.; Khan, H.T.A.; Awuviry-Newton, K. Associations between Social support Provided and Walkability among Older Adults: Health Self-Consciousness as a Moderator. Arch. Gerontol. Geriatr. 2022, 101, 104691. [Google Scholar] [CrossRef]
- Aguirre-Urreta, M.I.; Hu, J. Detecting common method bias: Performance of the Harman’s single-factor test. Data Base Adv. Inf. Syst. 2019, 50, 45–70. [Google Scholar] [CrossRef]
- Sghaier, S.; Asiamah, N.; Danquah, E.; Opuni, F.F.; Hatsu, S. Information technology ability mediates the association between older adults’ subjective age and social activity: A STROBE-compliant cross-sectional analysis. Arch. Gerontol. Geriatr. 2022, 103, 104790. [Google Scholar] [CrossRef] [PubMed]
- Faquinello, P.; Marcon, S.S. Friends and neighbors: An active social network for adult and elderly hypertensive individuals. Rev. da Esc. Enferm. 2011, 45, 1345–1352. [Google Scholar] [CrossRef]
- Kosteli, M.C.; Williams, S.E.; Cumming, J. Investigating the psychosocial determinants of physical activity in older adults: A qualitative approach. Psychol. Health 2016, 31, 730–749. [Google Scholar] [CrossRef] [Green Version]
- McPhee, J.S.; French, D.P.; Jackson, D.; Nazroo, J.; Pendleton, N.; Degens, H. Physical activity in older age: Perspectives for healthy ageing and frailty. Biogerontology 2016, 17, 567–580. [Google Scholar] [CrossRef] [PubMed]
- Zhang, J.; Bloom, I.; Dennison, E.M.; Ward, K.A.; Robinson, S.M.; Barker, M.; Cooper, C.; Lawrence, W. Understanding influences on physical activity participation by older adults: A qualitative study of community-dwelling older adults from the Hertfordshire Cohort Study, UK. PLoS ONE 2022, 17, e0263050. [Google Scholar] [CrossRef] [PubMed]
- Gladwell, V.F.; Brown, D.K.; Wood, C.; Sandercock, G.R.; Barton, J.L. The evidence for green space affecting physical health. Extrem. Physiol. Med. 2013, 2, 1–7. [Google Scholar]
- Asiamah, N.; Kouveliotis, K.; Eduafo, R.; Borkey, R. The Influence of Community-Level Built Environment Factors on Active Social Network Size in Older Adults: Social Activity as a Moderator. Int. Q. Community Health Educ. 2020, 41, 77–87. [Google Scholar] [CrossRef] [PubMed]
- Wahl, H.W.; Gerstorf, D. A conceptual framework for studying COntext Dynamics in Aging (CODA). Dev. Rev. 2018, 50, 155–176. [Google Scholar] [CrossRef]
- Asiamah, N.; Mends-Brew, E.; Boison, B.K.T. A spotlight on cross-sectional research: Addressing the issues of confounding and adjustment. Int. J. Healthc. Manag. 2021, 14, 183–196. [Google Scholar] [CrossRef]

| Variable | Group | n/Mean | %/SD |
|---|---|---|---|
| Categorical variables | |||
| Gender | Male | 495 | 49.7 |
| Female | 501 | 50.3 | |
| Total | 996 | 100 | |
| Self-reported health | Poor | 337 | 33.84 |
| Good | 650 | 65.26 | |
| Missing | 9 | 0.9 | |
| Total | 996 | 100 | |
| Relationship status | No | 245 | 24.6 |
| Yes | 751 | 75.4 | |
| Total | 996 | 100 | |
| Chronic disease status | None | 353 | 35.44 |
| One or more | 638 | 64.06 | |
| Missing | 5 | 0.5 | |
| Total | 996 | 100 | |
| Continuous variables | |||
| Income (GHS) | --- | 787.14 | 933.37 |
| Age (yrs) | --- | 66.34 | 10.51 |
| Context experience (yrs) | --- | 34.21 | 24.81 |
| Active social network size | --- | 4.04 | 3.96 |
| Sedentary social network size | --- | 1.04 | 1.31 |
| Walkability | --- | 36.11 | 5.09 |
| Physical activity enjoyment | --- | 77.21 | 19.4 |
| Education (yrs) | --- | 12.09 | 3.90 |
| Variable | 1 | 2 | 3 | 4 | 5 | 6 |
|---|---|---|---|---|---|---|
| 1. Physical activity enjoyment | 1 | 0.195 ** | 0.185 ** | 0.377 ** | 0.298 ** | −0.130 ** |
| 2. Active social network size | 1 | 0.417 ** | 0.098 ** | 0.368 ** | −0.349 ** | |
| 3. Sedentary social network size | 1 | 0.157 ** | 0.056 | −0.181 ** | ||
| 4. Walkability | 1 | 0.055 | 0.065 * | |||
| 5. Income (GHS) | 1 | −0.313 ** | ||||
| 6. Age (years) | 1 |
| Model | Predictor | Regression Weights | 95% CI | Model Fit | |||||
|---|---|---|---|---|---|---|---|---|---|
| B | SE | β(t) | R2 | Adjusted R2 | Durbin–Watson | F-Test | |||
| 1 | (Constant) | 73.367 | 0.862 | (85.09) ** | ±3.384 | 0.038 | 0.037 | 38.96 ** | |
| Active social network size | 0.952 | 0.153 | 0.194(6.24) ** | ±0.598 | --- | --- | --- | --- | |
| 2 | (Constant) | 74.381 | 0.772 | (96.40) ** | ±3.029 | 0.034 | 0.033 | 34.89 ** | |
| Sedentary social network size | 2.72 | 0.461 | 0.184(5.91) ** | ±1.807 | --- | --- | --- | --- | |
| 3 | (Constant) | 72.829 | 0.841 | (86.57) ** | ±3.302 | 0.052 | 0.051 | 55.00 ** | |
| ASNSxNW | 0.03 | 0.004 | 0.229(7.42) ** | ±0.015 | --- | --- | --- | --- | |
| 4 | (Constant) | 74.013 | 0.761 | (97.29) ** | ±2.985 | 0.045 | 0.044 | 47.02 ** | |
| SSNSxNW | 0.083 | 0.012 | 0.213(6.86) ** | ±0.047 | --- | --- | --- | --- | |
| 5 | (Constant) | 72.948 | 4.408 | (16.39) ** | ±17.301 | 0.098 | 0.095 | 1.72 | 35.76 ** |
| Active social network size | 0.46 | 0.165 | 0.094(2.79) * | ±0.646 | --- | --- | --- | --- | |
| Income (GHS) | 0.005 | 0.001 | 0.259(7.82) ** | ±0.003 | --- | --- | --- | --- | |
| Age (yrs) | −0.028 | 0.061 | −0.015(-0.46) | ±0.238 | --- | --- | --- | --- | |
| 6 | (Constant) | 71.113 | 4.229 | (16.82) ** | ±16.597 | 0.117 | 0.115 | 1.83 | 43.97 ** |
| Sedentary social network size | 2.461 | 0.448 | 0.167(5.49) ** | ±1.758 | --- | --- | --- | --- | |
| Income (GHS) | 0.006 | 0.001 | 0.286(9.12) ** | ±0.002 | --- | --- | --- | --- | |
| Age (yrs) | −0.017 | 0.059 | −0.009(-0.29) | ±0.231 | --- | --- | --- | --- | |
| 7 | (Constant) | 71.316 | 4.351 | (16.39) ** | ±17.075 | 0.106 | 0.103 | 1.92 | 39.17 ** |
| ASNSxNW | 0.018 | 0.004 | 0.137(4.13) ** | ±0.017 | --- | --- | --- | --- | |
| Income (GHS) | 0.005 | 0.001 | 0.247(7.47) ** | ±0.002 | --- | --- | --- | --- | |
| Age (yrs) | −0.012 | 0.06 | −0.006(-0.19) | ±0.236 | --- | --- | --- | --- | |
| 8 | (Constant) | 70.489 | 4.201 | (16.78) ** | ±16.488 | 0.125 | 0.122 | 1.81 | 47.29 ** |
| SSNSxNW | 0.074 | 0.012 | 0.189(6.26) ** | ±0.046 | --- | --- | --- | --- | |
| Income (GHS) | 0.006 | 0.001 | 0.282(9.01) ** | ±0.002 | --- | --- | --- | --- | |
| Age (yrs) | −0.011 | 0.059 | −0.006(-0.189) | ±0.23 | --- | --- | --- | --- | |
Disclaimer/Publisher’s Note: The statements, opinions and data contained in all publications are solely those of the individual author(s) and contributor(s) and not of MDPI and/or the editor(s). MDPI and/or the editor(s) disclaim responsibility for any injury to people or property resulting from any ideas, methods, instructions or products referred to in the content. |
© 2023 by the authors. Licensee MDPI, Basel, Switzerland. This article is an open access article distributed under the terms and conditions of the Creative Commons Attribution (CC BY) license (https://creativecommons.org/licenses/by/4.0/).
Share and Cite
Asiamah, N.; Agyemang, S.M.; Yarfi, C.; Jnr, R.A.-M.; Muhonja, F.; Khan, H.T.A.; Kouveliotis, K.; Sghaier, S. Associations of Social Networks with Physical Activity Enjoyment among Older Adults: Walkability as a Modifier through a STROBE-Compliant Analysis. Int. J. Environ. Res. Public Health 2023, 20, 3341. https://doi.org/10.3390/ijerph20043341
Asiamah N, Agyemang SM, Yarfi C, Jnr RA-M, Muhonja F, Khan HTA, Kouveliotis K, Sghaier S. Associations of Social Networks with Physical Activity Enjoyment among Older Adults: Walkability as a Modifier through a STROBE-Compliant Analysis. International Journal of Environmental Research and Public Health. 2023; 20(4):3341. https://doi.org/10.3390/ijerph20043341
Chicago/Turabian StyleAsiamah, Nestor, Simon Mawulorm Agyemang, Cosmos Yarfi, Reginald Arthur-Mensah Jnr, Faith Muhonja, Hafiz T. A. Khan, Kyriakos Kouveliotis, and Sarra Sghaier. 2023. "Associations of Social Networks with Physical Activity Enjoyment among Older Adults: Walkability as a Modifier through a STROBE-Compliant Analysis" International Journal of Environmental Research and Public Health 20, no. 4: 3341. https://doi.org/10.3390/ijerph20043341
APA StyleAsiamah, N., Agyemang, S. M., Yarfi, C., Jnr, R. A.-M., Muhonja, F., Khan, H. T. A., Kouveliotis, K., & Sghaier, S. (2023). Associations of Social Networks with Physical Activity Enjoyment among Older Adults: Walkability as a Modifier through a STROBE-Compliant Analysis. International Journal of Environmental Research and Public Health, 20(4), 3341. https://doi.org/10.3390/ijerph20043341