


New Digital Infrastructure’s Impact on Agricultural Eco-Efficiency Improvement: Influence Mechanism and Empirical Test—Evidence from China


Abstract
:1. Introduction
- It maybe the first study to measure the influence and the conductive mechanism of the agricultural digitization on the AEE;
- The corresponding indicator system and specific method are proposed and constructed innovatively;
- The relevant policy enlightenment is provided, based on the obtained results.
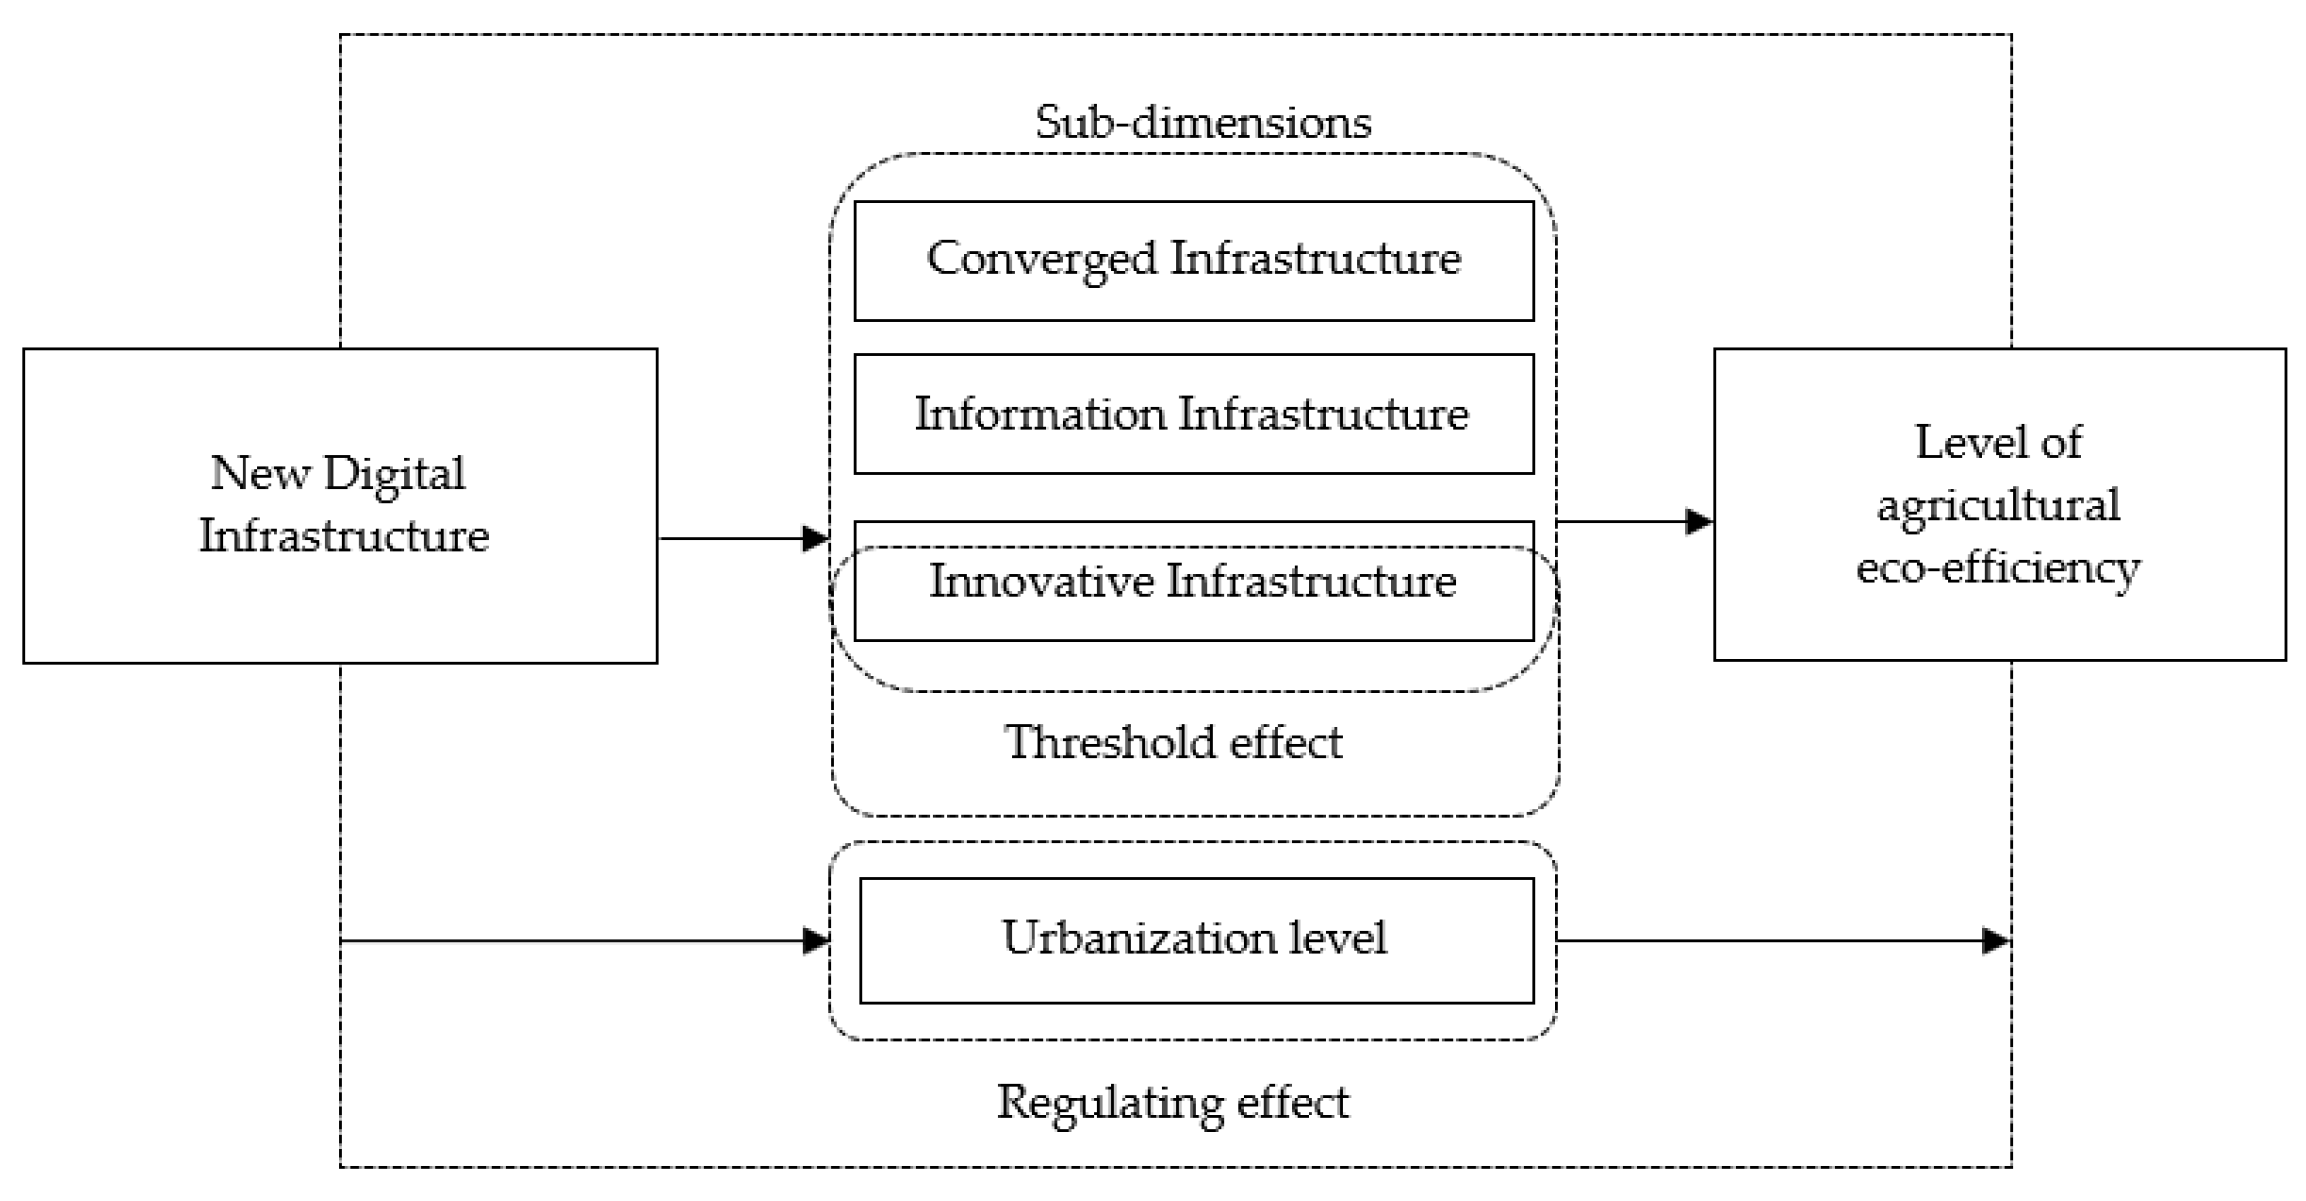
2. Theoretical Analysis
2.1. Ecological Effects of New Digital Infrastructure
2.2. The Threshold Effect of Innovative Infrastructure
2.3. Moderating Effect of Urbanization Level
3. Models, Estimation Methods, and Variables
3.1. Econometric Models and Estimation Methods
3.2. Variables
3.2.1. Explained Variable
3.2.2. Explanatory Variable
3.2.3. Moderating Variables
3.2.4. Control Variables
3.2.5. Data Sources and Descriptive Statistics
4. Empirical Testing
4.1. Baseline Regression
4.2. Threshold Effect of Innovation Infrastructure
4.3. Robustness Tests
4.3.1. One-Period Lag Analysis
4.3.2. Replacement of the Baseline Model Regression Method
4.4. Heterogeneity Tests
4.5. Heterogeneity Tests
4.5.1. Heterogeneity of Government Attention
4.5.2. Heterogeneity in the Degree of Developed Traditional Transportation Facilities
4.6. Testing the Impact Mechanism: Moderating Effect of Urbanization Level
5. Policy Recommendations, and Research Outlook
6. Research Conclusions
Author Contributions
Funding
Institutional Review Board Statement
Informed Consent Statement
Data Availability Statement
Conflicts of Interest
References
- Palaniyandi, S.A.; Yang, S.H.; Zhang, L.; Suh, J.W. Effects of actinobacteria on plant disease suppression and growth promotion. Appl. Microbiol. Biotechnol. 2013, 97, 9621–9636. [Google Scholar] [CrossRef]
- Bravo, G.; Lopez, D.; Vasquez, M.; Iriarte, A. Carbon footprint assessment of sweet cherry production: Hotspots and improvement options. Polish J. Environ. Stud. 2017, 26, 559–566. [Google Scholar] [CrossRef] [PubMed]
- Sala, S.; Anton, A.; McLaren, S.; Notarnicola, B.; Saouter, E.; Sonesson, U. In quest of reducing the environmental impacts of food production and consumption. J. Clean. Prod. 2017, 140, 387–398. [Google Scholar] [CrossRef]
- Olesen, J.E.; Bindi, M. Consequences of climate change for European agricultural productivity, land use and policy. Eur. J. Agron. 2002, 16, 239–262. [Google Scholar] [CrossRef]
- Akbar, U.; Li, Q.L.; Akmal, M.A.; Shakib, M.; Iqbal, W. Nexus between agro-ecological efficiency and carbon emission transfer: Evidence from China. Environ. Sci. Pollut. Res. 2021, 28, 18995–19007. [Google Scholar] [CrossRef] [PubMed]
- Power, A.G. Ecosystem services and agriculture: Tradeoffs and synergies. Philos. Trans. R. Soc. B Biol. Sci. 2010, 365, 2959–2971. [Google Scholar] [CrossRef]
- Geffersa, A.G.; Agbola, F.W.; Mahmood, A. Techndical efficiency in crop production across agro-ecological zones in Ethiopia: A meta-analysis of frontier studies. Outlook Agric. 2019, 48, 5–15. [Google Scholar] [CrossRef]
- Hou, M.; Yao, S. Spatial spillover effects and threshold characteristics of the impact of rural labor transfer on agricultural eco-efficiency in China. Resour. Sci. 2018, 40, 2475–2486. [Google Scholar]
- Wang, B.; Zhang, W. Inter-provincial differences and influencing factors of agricultural eco-efficiency in China—Analysis based on panel data of 31 provinces from 1996 to 2015. China Rural. Econ. 2018, 46–62. [Google Scholar]
- Hu, P.B.; Zhong, Y.-P. Mechanism and empirical analysis of government-supported agro-tourism integration to promote agricultural eco-efficiency—A case study of national leisure agriculture and rural tourism demonstration counties. China Rural. Econ. 2019, 85–104. [Google Scholar]
- Li, L.; Xu, W. Changes in agricultural eco-efficiency under the effect of aging rural population. J. South China Agric. Univ. (Soc. Sci. Ed.) 2021, 20, 14–29. [Google Scholar]
- Jiang, Z.; Liu, Y.; Zeng, Z.; Qin, G. A study on the impact of fiscal environmental protection expenditure on agricultural eco-efficiency: Empirical evidence from the development strategy of Yangtze River Economic Belt. Econ. Issues 2022, 113–122. [Google Scholar] [CrossRef]
- Färe, R.; Karagiannis, G. A postscript on aggregate Farrell efficiencies. Eur. J. Oper. Res. 2014, 233, 784–786. [Google Scholar] [CrossRef]
- Angulo-Meza, L.; González-Araya, M.; Iriarte, A.; Rebolledo-Leiva, R.; de Mello, J.C.S. A multiobjective DEA model to assess the eco-efficiency of agricultural practices within the CF+ DEA method. Comput. Electron. Agric. 2019, 161, 151–161. [Google Scholar] [CrossRef]
- Lv, X. Limitations of e-commerce development of agricultural products in China and coping strategies. Bus. Econ. Res. 2021, 83–86. [Google Scholar]
- Wang, H. The association between agricultural big data and agricultural AI and future development trend. China Agric. Resour. Zoning 2022, 43, 114–143. [Google Scholar]
- Feng, X.; Li, J.; Cui, K. Comparative analysis of historical evolution and policy trends of smart agriculture in China and abroad. Sci. Technol. Manag. Res. 2022, 42, 28–36. [Google Scholar]
- Wen, C.; Tan, J.; Li, Y.; Zhao, S. Research on the emission reduction effect of new infrastructure construction and its mechanism of action. Ind. Technol. Econ. 2021, 40, 122–130. [Google Scholar]
- Greenpeace, International Environmental Protection Organization, China International Civil Society Organization Cooperation Promotion Association. Exploring the Comprehensive Benefits of New Infrastructure—An Assessment Analysis Based on the Green and Inclusive Recovery Framework. 2021. Available online: https://www.shangyexinzhi.com/article/4274065.html (accessed on 16 October 2021).
- Tan, H.-F.; Zhang, S.-F. Digital New Infrastructure, Financial Resource Allocation and High Quality Economic Development. J. Yunnan Univ. Natl. (Philos. Soc. Sci. Ed.) 2023, 134–142. [Google Scholar] [CrossRef]
- Hu, B.; Zhu, Y. From spatial production to production space: A study on the economic spatial logic of the new development pattern of double cycle. Econ. Syst. Reform 2021, 53–58. [Google Scholar]
- Xu, X.; Fan, H.; Su, Y.; Zheng, Z. Study on the measurement of green economy development level and its influencing factors in China. Res. Quant. Econ. Technol. Econ. 2021, 38, 65–82. [Google Scholar]
- Shang, J.; Ji, X.; Chen, X. Impact of urbanization on agro-ecological efficiency in China—Based on panel data of 13 major grain-producing regions in China from 2009–2018. Chin. J. Ecol. Agric. 2020, 28, 1265–1276, (In English and Chinese). [Google Scholar]
- You, X. Study on the Evolution of Spatial and Temporal Patterns of Agro-Ecological Efficiency and Its Influencing Factors in the Three Gorges Reservoir Area under the Background of the Transformation of Farmland for Mechanization. Master’s Thesis, Chongqing Three Gorges College, Chongqing, China, 2021. [Google Scholar] [CrossRef]
- Zhu, Y.; Sun, C.; Huang, D. Labor transfer, agricultural scale operation and agricultural eco-efficiency: An empirical study based on the mediating effect and threshold effect. J. Fujian Agric. For. Univ. (Philos. Soc. Sci. Ed.) 2022, 25, 32–42. [Google Scholar]
- Zhao, C.; Yang, X.; Li, B.; Li, M.; Yan, H. Review and prospect of agricultural information technology development in China. China Agric. Dig. Agric. Eng. 2018, 30, 3–7. [Google Scholar]
- Li, J.; Feng, X.; Guo, M.; Ma, C. International comparison and reference of “Internet+” modern agriculture development model. Agric. Mod. Res. 2018, 39, 194–202. [Google Scholar]
- Zhang, F.; Wang, H. Labor force return, factor allocation and agricultural productivity. J. South China Agric. Univ. (Soc. Sci. Ed.) 2021, 20, 73–84. [Google Scholar]
- Zheng, H.; Li, G. Research on the impact of urban-rural policy bias on the efficiency of agricultural resource allocation. Agric. Technol. Econ. 2020, 79–92. [Google Scholar] [CrossRef]
- Ruan, J.; Liu, T.; Feng, X.; Qiao, Z.; Huo, X.; Zhu, Y.; Hu, X. Digital agriculture operation management: Key issues, theoretical approaches and demonstration projects. Manag. World 2020, 36, 222–233. [Google Scholar]
- Chen, J. Transportation infrastructure construction, environmental pollution and regional economic growth. East China Econ. Manag. 2020, 34, 72–79. [Google Scholar]
- Zhang, L.; Luo, B. Agricultural downsizing: The logic of scale of farming and its evidence. China Rural. Econ. 2020, 81–99. [Google Scholar]
- Zhang, Q.Y.; Lu, K.Y.; Zhang, H. Does agricultural land transfer lead to soil fertility decline?—An empirical study based on soil testing results of large grain farmers in four provinces. China Agric. Resour. Zoning 2019, 40, 31–39. [Google Scholar]
- Cheng, L.; Chen, P. Promoting New Infrastructure, Ecological and Environmental Infrastructure cannot Be Missing. Bright Daily, 11 July 2020. [Google Scholar]
- Chen, X.H.; Fang, K.; Liu, J. The impact of scientific and technological progress on eco-efficiency in Guangdong Province and its mechanism of action. Sci. Technol. Manag. Res. 2017, 37, 82–87. [Google Scholar]
- Wang, C.; Yao, Z. Spatial characteristics of agricultural eco-efficiency and its threshold effect. Stat. Decis. Mak. 2022, 38, 49–54. [Google Scholar]
- Yan, X.; Cheng, C. The dynamic response between science and technology innovation and ecological environment in Yangtze River Economic Zone. J. Nantong Univ. (Soc. Sci. Ed.) 2019, 35, 22–29. [Google Scholar]
- Huang, S.L.; Yeh, C.T.; Chang, L.F. The transition to an urbanizing world and the demand for natural resources. Curr. Opin. Environ. Sustain. 2010, 2, 136–143. [Google Scholar] [CrossRef]
- Bao, S.-Y. Innovative development of urban complexes in the context of new urbanization. Theor. Explor. 2014, 91–94. [Google Scholar]
- Pickett, S.T.A.; Cadenasso, M.L. Advancing urban ecological studies: Frameworks, concepts, and results from the Baltimore Ecosystem Study. Austral Ecol. 2010, 31, 114–125. [Google Scholar] [CrossRef]
- Wu, C. Impact of urbanization on agricultural carbon emissions in China—An empirical study of inter-provincial data. Econ. Econ. 2015, 32, 12–18. [Google Scholar]
- Li, J.-X. Reflections and policy suggestions on the construction of new urbanization by “new infrastructure”. Econ. Forum 2020, 127–131. [Google Scholar]
- Charnes, A.; Cooper, W.W.; Rhodes, E. Measuring the efficiency of decision making units. Eur. J. Oper. Res. 1978, 2, 429–444. [Google Scholar] [CrossRef]
- Banker, R.D.; Charnes, A.; Cooper, W.W. Some models forestimating technical and scale inefficiencies in data envelopment a-nalysis. Manag. Sci. 1984, 30, 1078–1092. [Google Scholar] [CrossRef] [Green Version]
- Chen, B.; Ren, J. Ecological efficiency of grain production measurement and improvement path. J. Jiangsu Agric. 2019, 35, 211–218. [Google Scholar]
- Chen, J.; Xin, M.; Ma, X.; Chang, B.; Zhang, Z. Measurement and drivers of agricultural eco-efficiency in China. China Environ. Sci. 2020, 40, 3216–3227. [Google Scholar]
- Tian, Y.; Zhang, J. Equity of agricultural carbon emissions in provincial regions of China. China Popul.-Resour. Environ. 2013, 23, 36–44. [Google Scholar]
- Wang, X. Estimation of global crop uptake of atmospheric CO2 and its multiplication. J. Meteorol. 1996, 466–473. [Google Scholar]
- Han, Z.; Meng, Y.; Xu, J.; Wu, Y.; Zhou, Z. Analysis of spatial and temporal differences in carbon footprint of regional farmland ecosystems: A case study of Jiangsu Province. J. Agric. Environ. Sci. 2012, 31, 1034–1041. [Google Scholar]
- Wang, B.; Zhang, W. Study on the measurement of agricultural eco-efficiency and spatial and temporal differences in China. China Popul. Resour. Environ. 2016, 26, 11–19. [Google Scholar] [CrossRef]
- Tian, Y.; Zhang, J.B.; Li, B. Study on agricultural carbon emissions in China: Measurement, spatial and temporal comparison and decoupling effect. Resour. Sci. 2012, 34, 2097–2105. [Google Scholar]
- Duan, H.; Zhang, Y.; Zhao, J.; Bian, X. Carbon footprint analysis of farmland ecosystems in China. J. Soil Water Conserv. 2011, 25, 203–208. [Google Scholar]
- Wu, F.; Li, L.; Zhang, H.; Chen, F. Effects of conservation tillage on net carbon release from farmland ecosystems. Chin. J. Ecol. 2007, 26, 2035–2039. [Google Scholar]
- Yang, S.Q. Considerations on the integrated prevention and control system of agricultural surface pollution based on national food security. China Agric. Sci. 2022, 55, 3380–3394. [Google Scholar]
- Beijing Urban Modern Agriculture Ecological Service Value Monitoring Bulletin for 2021; Beijing Municipal Bureau of Statistics: Beijing, China; Beijing General Survey Team of National Bureau of Statistics: Beijing, China; Beijing Municipal Bureau of Landscape Architecture: Beijing, China; Beijing Municipal Bureau of Water Affairs: Beijing, China; Beijing Municipal Bureau of Agriculture and Rural Development:: Beijing, China, 2022.
- Li, G. The green productivity revolution in Chinese agriculture: 1978–2008. Economics 2014, 13, 537–558. [Google Scholar]
- Yang, Q.; Wang, J.; Li, C.; Liu, X. Spatial divergence of green total factor productivity in Chinese agriculture and its driving factors. Quant. Econ. Tech. Econ. Res. 2019, 36, 21–37. [Google Scholar]
- Lu, Q.Y.; Zhang, X.Q.; Meng, X.H. Study on the spatial correlation and influencing factors of eco-efficiency of grain cultivation in China. Econ. Issues 2021, 82–88+94. [Google Scholar] [CrossRef]
- Yan, X.; Cheng, C. Research on the unbalanced development of science and technology innovation efficiency and ecological environment in Yangtze River Economic Belt—Based on double-threshold panel model. Soft Sci. 2018, 32, 11–15. [Google Scholar]
- Xue, X.-D.; Wen, Y.-Y. The impact of agro-industrial agglomeration on agro-ecological efficiency in the Yellow River basin—An empirical study based on PCA-DEA and panel Tobit model. China Agric. Resour. Zoning 2023, 1–13. Available online: http://kns.cnki.net/kcms/detail/11.3513.S.20221117.1156.010.html (accessed on 30 January 2023).
- Zhao, T.; Zhang, Z.; Liang, S. Digital economy, entrepreneurial activity and high quality development—Empirical evidence from Chinese cities. Manag. World 2020, 36, 65–76. [Google Scholar]
- Luo, S. Agro-ecological transformation trends and the path of ecological agriculture in China. Chin. J. Ecol. Agric. 2017, 25, 1–7. [Google Scholar]
- Qian, J.; Chen, Y. The inspiration of agricultural information construction in typical developed countries to China’s agricultural “new infrastructure”. Sci. Technol. Manag. Res. 2021, 41, 174–180. [Google Scholar]
- Liu, C.; Xing, H.; Zhu, M. Agricultural policy support system in developing countries in Asia: Overall level, structural evolution and its empirical insights—A comparison of China, Indonesia, Philippines and Vietnam. World Agric. 2021, 4–13. [Google Scholar] [CrossRef]

| Crop | Economic Coefficient | Water Content | Uptake Rate | Crop | Economic Coefficient | Water Content | Uptake Rate |
|---|---|---|---|---|---|---|---|
| Rice | 0.45 | 12% | 0.414 | Potato | 0.70 | 70% | 0.423 |
| Wheat | 0.40 | 12% | 0.485 | Sugar cane | 0.50 | 50% | 0.450 |
| Corn | 0.40 | 13% | 0.471 | Sugar beets | 0.70 | 75% | 0.407 |
| Beans | 0.34 | 13% | 0.450 | Vegetables | 0.60 | 90% | 0.450 |
| Canola | 0.25 | 10% | 0.450 | Melon | 0.70 | 90% | 0.450 |
| Peanut | 0.43 | 10% | 0.450 | Tobacco | 0.55 | 85% | 0.450 |
| Sunflower | 0.30 | 10% | 0.450 | Other crops | 0.40 | 12% | 0.450 |
| Cotton | 0.10 | 8% | 0.450 | ||||
| Carbon Emission Sources | Coefficients | Reference Value Sources |
|---|---|---|
| Pesticides | 4.9341 kg/kg | Oak Ridge National Laboratory (USA) |
| Fertilizer | 0.8956 kg/kg | Oak Ridge National Laboratory (USA) |
| Diesel | 0.5927 kg/kg | IPCC |
| Agricultural film | 5.18 kg/kg | Institute of Agricultural Resources and Ecological Environment, Nanjing Agricultural University |
| Irrigation | 266.48 kg/hm2 | Duan et al. [52] |
| Tillage | 312.6 kg/hm2 | Wu et al. [53] |
| Primary Indicators | Secondary Indicators | Units | Indicator Direction | |
|---|---|---|---|---|
| Information Infrastructure | Local exchange capacity | 10,000 doors | Positive | |
| Mobile Phone Switching Capacity | million homes | Positive | ||
| Cell phone base station | million | Positive | ||
| Fiber optic cable line length | meters | Positive | ||
| Number of domain names | million | Positive | ||
| Number of websites | million | Positive | ||
| Number of IPv4 addresses | million | Positive | ||
| Internet broadband access ports | million | Positive | ||
| Software business revenue | million | Positive | ||
| Number of computers in use at the end of the period | table | Positive | ||
| Computing base per 100 people | table | Positive | ||
| Number of websites owned by enterprises | individual | Positive | ||
| Number of websites owned by each 100 enterprises | individual | Positive | ||
| E-commerce sales | billion yuan | Positive | ||
| Convergence Infrastructure | Traditional Infrastructure | Railroad mileage | Kilometer | Positive |
| High-speed grade highway mileage | kilometer | Positive | ||
| Bus and trolley bus mileage | kilometer | Positive | ||
| Rail mileage | kilometer | Positive | ||
| Informatization degree | Software business revenue | million yuan | Positive | |
| Number of computers in use at the end of the period | table | Positive | ||
| Number of computers per 100 people | table | Positive | ||
| Number of websites owned by enterprises | individual | Positive | ||
| Number of websites owned by each 100 enterprises | individual | Positive | ||
| E-commerce sales | billion yuan | Positive | ||
| Innovation Infrastructure | R&D investment intensity | % | Positive | |
| Number of institutions | individual | Positive | ||
| Total R&D personnel | people | Positive | ||
| R&D personnel equivalent full time | per person per year | Positive | ||
| R&D funding internal expenditure | million | Positive | ||
| Government Funds | million yuan | Positive | ||
| R&D subject input funds | ten thousand yuan | Positive | ||
| Number of patent applications | piece | Positive | ||
| Province | 2011 | 2020 | Province | 2011 | 2020 |
|---|---|---|---|---|---|
| Beijing | 0.7480 | 0.7192 | Henan | 0.2543 | 0.3077 |
| Tianjin | 0.2362 | 0.2511 | Hubei | 0.2751 | 0.3381 |
| Hebei | 0.2392 | 0.2944 | Hunan | 0.2178 | 0.2826 |
| Shanxi | 0.1349 | 0.1609 | Guangdong | 0.9178 | 0.9559 |
| Inner Mongolia | 0.1278 | 0.1793 | Guangxi | 0.1643 | 0.1715 |
| Liaoning | 0.3319 | 0.2847 | Hainan | 0.0920 | 0.0908 |
| Ji Lin | 0.1421 | 0.1620 | Chongqing | 0.2029 | 0.2582 |
| Heilongjiang | 0.1438 | 0.1899 | Sichuan | 0.3174 | 0.4160 |
| Shanghai | 0.5478 | 0.5286 | Guizhou | 0.1220 | 0.1589 |
| Jiangsu | 0.7708 | 0.6788 | Yunnan | 0.1677 | 0.2070 |
| Zhejiang | 0.5339 | 0.5769 | Shaanxi | 0.2142 | 0.2845 |
| Anhui | 0.2222 | 0.3102 | Gansu | 0.1153 | 0.1186 |
| Fujian | 0.3016 | 0.3026 | Qinghai | 0.0632 | 0.0980 |
| Jiangxi | 0.1451 | 0.2318 | Ningxia | 0.0660 | 0.0674 |
| Shandong | 0.4362 | 0.5094 | Xinjiang | 0.1097 | 0.1063 |
| Variable | Codes | Sample Size | Mean Value | Standard Deviation | Maximum Value | Minimum Value |
|---|---|---|---|---|---|---|
| New Digital Infrastructure | NDI | 300 | 0.302 | 0.211 | 0.0632 | 0.956 |
| Converged Infrastructure | CI | 300 | 0.406 | 0.226 | 0.0746 | 1 |
| Innovation Infrastructure | INNI | 300 | 0.214 | 0.150 | 0.0726 | 0.801 |
| Information Infrastructure | INFI | 300 | 0.256 | 0.177 | 0.0726 | 0.875 |
| AEE with Constant Returns to Scale | CRS-AEE | 300 | 0.966 | 0.217 | 0.401 | 1.279 |
| AEE with Variable Returns to Scale | VRS-AEE | 300 | 1.140 | 1.176 | 0.421 | 20.29 |
| Level of Agricultural Economic Development | AED | 300 | 4.692 | 5.389 | 0.146 | 76.95 |
| Planting Structure | PS | 300 | 0.649 | 0.140 | 0.355 | 0.971 |
| Agricultural Disaster Rate | ADR | 300 | 0.151 | 0.119 | 0 | 0.619 |
| Rural Human Capital | RHC | 300 | 2.044 | 0.0778 | 1.766 | 2.268 |
| Financial Support to Agriculture | FSA | 300 | 0.115 | 0.0336 | 0.0374 | 0.217 |
| Level of Urbanization | LU | 300 | 58.14 | 12.05 | 34.96 | 89.60 |
| VRS-AEE | CRS-AEE | |||||||
|---|---|---|---|---|---|---|---|---|
| (1) | (2) | (3) | (4) | (5) | (6) | (7) | (8) | |
| NDI | 1.0237 ** | 0.1917 ** | ||||||
| (2.41) | (2.56) | |||||||
| INFI | 1.4666 *** | 0.2169 ** | ||||||
| (3.09) | (2.58) | |||||||
| CI | 0.9352 ** | 0.1964 *** | ||||||
| (2.24) | (2.68) | |||||||
| INNI | −0.0168 | −0.3417 *** | ||||||
| (−0.03) | (−4.16) | |||||||
| AED | −0.0033 | −0.0034 | −0.0037 | −0.0029 | 0.0036 | 0.0037 | 0.0035 | 0.0035 |
| (−0.26) | (−0.27) | (−0.29) | (−0.22) | (1.62) | (1.63) | (1.58) | (1.58) | |
| ADR | −0.4523 | −0.4329 | −0.4449 | −0.6034 | −0.3342 *** | −0.3373 *** | −0.3291 *** | −0.3301 *** |
| (−0.76) | (−0.73) | (−0.75) | (−1.01) | (−3.19) | (−3.23) | (−3.14) | (−3.22) | |
| PS | −0.9796 ** | −0.8642 * | −1.0386 ** | −1.0780 ** | −0.3335 *** | −0.3204 *** | −0.3436 *** | −0.2724 *** |
| (−2.03) | (−1.79) | (−2.15) | (−2.16) | (−3.92) | (−3.75) | (−4.06) | (−3.19) | |
| RHC | 0.9122 | 0.8185 | 1.0057 | 1.0943 | 0.4055 *** | 0.3989 *** | 0.4209 *** | 0.3721 ** |
| (1.05) | (0.95) | (1.16) | (1.25) | (2.66) | (2.61) | (2.77) | (2.48) | |
| FSA | 1.3899 | 1.7025 | 1.6100 | −2.6385 | 0.9668 ** | 0.8555 * | 1.1043 ** | −0.2209 |
| (0.51) | (0.67) | (0.56) | (−1.17) | (2.02) | (1.89) | (2.20) | (−0.57) | |
| N | 300 | 300 | 300 | 300 | 300 | 300 | 300 | 300 |
| Type | Threshold | F Value | p Value | Sampling Number |
|---|---|---|---|---|
| Single Threshold | 0.2813 | 9.28 | 0.0233 | 300 |
| Double Threshold | 0.3169 | 4.20 | 1.0000 | 300 |
| 0.3233 |
| VRS-AEE | |
|---|---|
| 14.9609 *** | |
| (6.21) | |
| −4.1182 ** | |
| (−2.36) | |
| Control variables | Yes |
| N | 300 |
| VRS-AEE | CRS-AEE | VRS-AEE | CRS-AEE | |
|---|---|---|---|---|
| (1) | (2) | (3) | (4) | |
| NDI | 1.0135 ** | 0.1933 ** | ||
| (2.40) | (2.55) | |||
| L.NDI | 1.1286 ** | 0.1917 ** | ||
| (2.39) | (2.56) | |||
| Control variables | Yes | Yes | Yes | Yes |
| N | 270 | 270 | 300 | 300 |
| First Stage | Second Stage | ||
|---|---|---|---|
| VRS-AEE | CRS-AEE | ||
| NDI | 2.6976 *** | ||
| (3.72) | |||
| IV | 0.0147 *** | 0.3865 *** | |
| (12.64) | (3.07) | ||
| Control variables | Yes | Yes | Yes |
| N | 300 | 300 | 300 |
| F value | 170.777 | ||
| Government Attention | Degree of Development of Traditional Transportation Facilities | |||
|---|---|---|---|---|
| 2011–2016 | 2017–2020 | Underdeveloped | Developed | |
| (1) | (2) | (3) | (4) | |
| 0.2262 * | 2.6258 ** | 0.9427 | 0.2753 ** | |
| (2.34) | (1.70) | (1.30) | (2.06) | |
| Control variables | Yes | Yes | Yes | Yes |
| N | 180 | 120 | 150 | 150 |
| VRS-AEE | CRS-AEE | |
|---|---|---|
| (1) | (2) | |
| −9.7882 *** | −0.0530 | |
| (−4.65) | (−0.14) | |
| −0.0278 ** | 0.0020 | |
| (−2.08) | (0.79) | |
| 0.1580 *** | 0.0029 | |
| (5.00) | (0.50) | |
| Control variables | Yes | Yes |
| N | 300 | 300 |
Disclaimer/Publisher’s Note: The statements, opinions and data contained in all publications are solely those of the individual author(s) and contributor(s) and not of MDPI and/or the editor(s). MDPI and/or the editor(s) disclaim responsibility for any injury to people or property resulting from any ideas, methods, instructions or products referred to in the content. |
© 2023 by the authors. Licensee MDPI, Basel, Switzerland. This article is an open access article distributed under the terms and conditions of the Creative Commons Attribution (CC BY) license (https://creativecommons.org/licenses/by/4.0/).
Share and Cite
Ren, J.; Chen, X.; Gao, T.; Chen, H.; Shi, L.; Shi, M. New Digital Infrastructure’s Impact on Agricultural Eco-Efficiency Improvement: Influence Mechanism and Empirical Test—Evidence from China. Int. J. Environ. Res. Public Health 2023, 20, 3552. https://doi.org/10.3390/ijerph20043552
Ren J, Chen X, Gao T, Chen H, Shi L, Shi M. New Digital Infrastructure’s Impact on Agricultural Eco-Efficiency Improvement: Influence Mechanism and Empirical Test—Evidence from China. International Journal of Environmental Research and Public Health. 2023; 20(4):3552. https://doi.org/10.3390/ijerph20043552
Chicago/Turabian StyleRen, Jin, Xinrui Chen, Tingting Gao, Hao Chen, Lefeng Shi, and Ming Shi. 2023. "New Digital Infrastructure’s Impact on Agricultural Eco-Efficiency Improvement: Influence Mechanism and Empirical Test—Evidence from China" International Journal of Environmental Research and Public Health 20, no. 4: 3552. https://doi.org/10.3390/ijerph20043552
APA StyleRen, J., Chen, X., Gao, T., Chen, H., Shi, L., & Shi, M. (2023). New Digital Infrastructure’s Impact on Agricultural Eco-Efficiency Improvement: Influence Mechanism and Empirical Test—Evidence from China. International Journal of Environmental Research and Public Health, 20(4), 3552. https://doi.org/10.3390/ijerph20043552