
Effects of Heatwaves on Hospital Admissions for Cardiovascular and Respiratory Diseases, in Southern Vietnam, 2010–2018: Time Series Analysis
 ,
,
Abstract
:1. Introduction
2. Materials and Methods
2.1. Study Area and Population
2.2. Data Source
2.3. Data Analysis
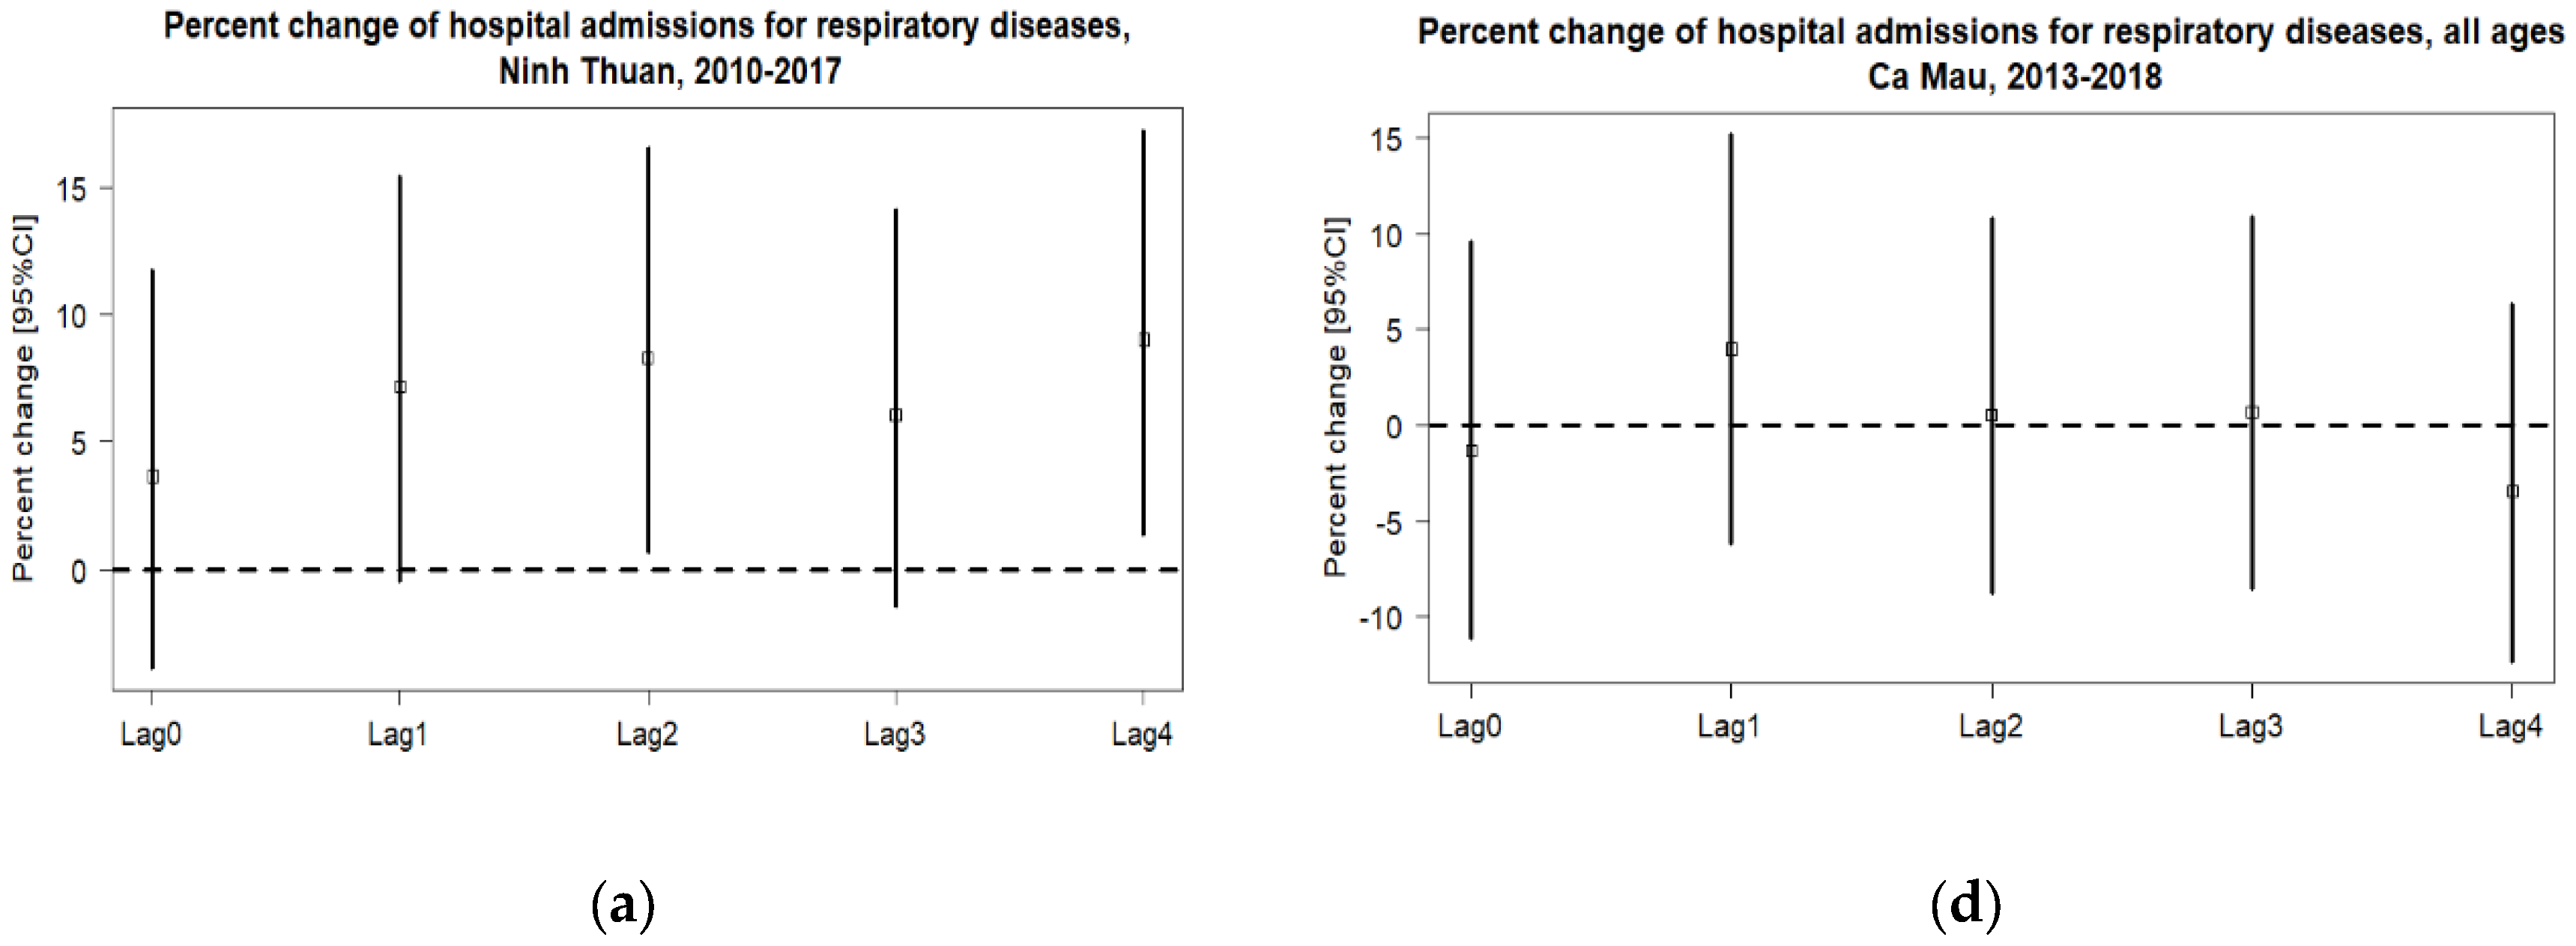
3. Results
4. Discussion
5. Conclusions
Supplementary Materials
Author Contributions
Funding
Institutional Review Board Statement
Informed Consent Statement
Data Availability Statement
Acknowledgments
Conflicts of Interest
References
- IHME. Available online: http://ghdx.healthdata.org/gbd-results-tool (accessed on 15 September 2020).
- Zhang, Y.; Peng, L.; Kan, H.; Xu, J.; Chen, R.; Liu, Y.; Wang, W. Effects of meteorological factors on daily hospital admissions for asthma in adults: A time-series analysis. PLoS ONE 2014, 9, e102475. [Google Scholar] [CrossRef] [PubMed] [Green Version]
- Breitner, S.; Wolf, K.; Devlin, R.B.; Diaz-Sanchez, D.; Peters, A.; Schneider, A. Shortterm effects of air temperature on mortality and effect modification by air pollution in three cities of Bavaria, Germany: A time-series analysis. Sci. Total Environ. 2014, 1, 485–486. [Google Scholar] [CrossRef]
- Campbell, S.; Remenyi, T.A.; White, C.J.; Johnston, F.H. Heatwave and health impact research: A global review. Health Place 2018, 53, 210–218. [Google Scholar] [CrossRef] [PubMed]
- Perkins, S.E.; Alexander, L.V.; Nairn, J.R. Increasing frequency, intensity and duration of observed global heatwaves and warm spells. Geophys. Res. Lett. 2012, 39, 10. [Google Scholar] [CrossRef]
- Ye, X.; Wolff, R.; Yu, W.; Vaneckova, P.; Pan, X.; Tong, S. Ambient temperature and morbidity: A review of epidemiological evidence. Environ. Health Perspect. 2012, 120, 19–28. [Google Scholar] [CrossRef] [Green Version]
- Elliot, A.J.; Bone, A.; Morbey, R.; Hughes, H.E.; Harcourt, S.; Smith, S.; Loveridge, P.; Green, H.K.; Pebody, R.; Andrews, N.; et al. Using real-time syndromic surveillance to assess the health impact of the 2013 heatwave in England. Environ. Res. 2014, 135, 31–36. [Google Scholar] [CrossRef]
- Cheng, J.; Xu, Z.; Bambrick, H.; Prescott, V.; Wang, N.; Zhang, Y.; Su, H.; Tong, S.; Hu, W. Cardiorespiratory effects of heatwaves: A systematic review and meta-analysis of global epidemiological evidence. Environ. Res. 2019, 177, 108610. [Google Scholar] [CrossRef]
- Kang, C.; Park, C.; Lee, W.; Pehlivan, N.; Choi, M.; Jang, J.; Kim, H. Heatwave-Related Mortality Risk and the Risk-Based Definition of Heat Wave in South Korea: A Nationwide Time-Series Study for 2011–2017. Int. J. Environ. Res. Public Health 2020, 17, 5720. [Google Scholar] [CrossRef]
- Varghese, B.; Beaty, M.; Panchuk, S.; Mackie, B.; Chen, C.; Jakab, M.; Yang, T.; Bi, P.; Nairn, J. Heatwave-related Mortality in Australia: Who’s impacted the most? Eur. J. Public Health 2020, 30, ckaa165.377. [Google Scholar] [CrossRef]
- Hopp, S.; Dominici, F.; Bobb, J.F. Medical diagnoses of heat wave-related hospital admissions in older adults. Prev. Med. 2018, 110, 81–85. [Google Scholar] [CrossRef]
- Xu, Z.; Crooks, J.L.; Black, D.; Hu, W.; Tong, S. Heatwave and infants’ hospital admissions under different heatwave definitions. Environ. Pollut. 2017, 229, 525–530. [Google Scholar] [CrossRef]
- Eckstein, D.; Künzel, V.; Schäfer, L.; Winges, M. Global Climate Risk Index 2020; Who Suffers Most from Extreme Weather Events? Weather-Related Loss Events in 2018 and 1999 to 2018; Germanwatch e.V.: Bonn, Germany, 2020. [Google Scholar]
- Ministry of Natural Resources and Environment. Climate Change and Sea Level Rise Scenarios for Vietnam; Ministry of Natural Resources and Environment: Hanoi, Vietnam, 2016.
- General Statistic Office of Vietnam. Population and Employment. Available online: https://www.gso.gov.vn/default_en.aspx?tabid=774 (accessed on 2 February 2020).
- Xu, Z.; FitzGerald, G.; Guo, Y.; Jalaludin, B.; Tong, S. Impact of heatwave on mortality under different heatwave definitions: A systematic review and meta-analysis. Environ. Int. 2016, 89–90, 193–203. [Google Scholar] [CrossRef]
- Phung, D.; Chu, C.; Rutherford, S.; Nguyen, H.L.T.; Do, C.M.; Huang, C. Heatwave and risk of hospitalization: A multi-province study in Vietnam. Environ. Pollut. 2017, 220, 597–607. [Google Scholar] [CrossRef]
- Zhang, A.; Hu, W.; Li, J.; Wei, R.; Lin, J.; Ma, W. Impact of heatwaves on daily outpatient visits of respiratory disease: A time-stratified case-crossover study. Environ. Res. 2019, 169, 196–205. [Google Scholar] [CrossRef]
- Yang, J.; Yin, P.; Sun, J.; Wang, B.; Zhou, M.; Li, M.; Tong, S.; Meng, B.; Guo, Y.; Liu, Q. Heatwave and mortality in 31 major Chinese cities: Definition, vulnerability and implications. Sci. Total Environ. 2019, 649, 695–702. [Google Scholar] [CrossRef]
- Peng, R.D.; Dominici, F.; Louis, T.A. Model choice in Time series studies of air pollution and mortality. R. Stat. Soc. 2006, 169, 179–203. [Google Scholar]
- Fuhrmann, C.M.; Sugg, M.M.; Konrad, C.E.; Waller, A. Impact of extreme heat events on emergency department visits in North Carolina (2007–2011). J. Community Health 2016, 41, 146–156. [Google Scholar] [CrossRef]
- Song, X.; Wang, S.; Li, T.; Tian, J.; Ding, G.; Wang, J.; Wang, J.; Shang, K. The impact of heat waves and cold spells on respiratory emergency department visits in Beijing, China. Sci. Total Environ. 2018, 615, 1499–1505. [Google Scholar] [CrossRef]
- Wang, Y.-C.; Lin, Y.-K.; Chuang, C.-Y.; Li, M.-H.; Chou, C.-H.; Liao, C.-H.; Sung, F.-C. Associating emergency room visits with first and prolonged extreme temperature event in Taiwan: A population-based cohort study. Sci. Total Environ. 2012, 416, 97–104. [Google Scholar] [CrossRef]
- Smith, S.; Elliot, A.J.; Hajat, S.; Bone, A.; Bates, C.; Smith, G.E.; Kovats, S. The impact of heatwaves on community morbidity and healthcare usage: A retrospective observational study using real-time syndromic surveillance. Int. J. Environ. Res. Public Health 2016, 13, 132. [Google Scholar] [CrossRef] [Green Version]
- Ogbomo, A.S.; Gronlund, C.J.; O’Neill, M.S.; Konen, T.; Cameron, L.; Wahl, R. Vulnerability to extreme-heat-associated hospitalization in three counties in Michigan, USA, 2000–2009. Int. J. Biometeorol. 2017, 61, 833–843. [Google Scholar] [CrossRef] [PubMed] [Green Version]
- Phung, D.; Guo, Y.; Thai, P.; Rutherford, S.; Wang, X.; Nguyen, M.; Do, C.M.; Nguyen, N.H.; Alam, N.; Chu, C. The effects of high temperature on cardiovascular admissions in the most populous tropical city in Vietnam. Environ. Pollut. 2016, 208, 33–39. [Google Scholar] [CrossRef] [PubMed]
- Nhung, N.T.T.; Schindler, C.; Chau, N.Q.; Hanh, P.T.; Hoang, L.T.; Dien, T.M.; Thanh, N.T.N.; Künzli, N. Exposure to air pollution and risk of hospitalization for cardiovascular diseases amongst Vietnamese adults: Case-crossover study. Sci. Total Environ. 2020, 703, 134637. [Google Scholar] [CrossRef] [PubMed]
- Phung, D.; Thai, P.K.; Guo, Y.; Morawska, L.; Rutherford, S.; Chu, C. Ambient temperature and risk of cardiovascular hospitalization: An updated systematic review and meta-analysis. Sci. Total Environ. 2016, 550, 1084–1102. [Google Scholar] [CrossRef]
- Turner, L.R.; Barnett, A.G.; Connell, D.; Tonga, S. Ambient temperature and cardiorespiratory morbidity: A systematic review and meta-analysis. Epidemiology 2012, 23, 594–606. [Google Scholar] [CrossRef] [Green Version]
- Cheng, J.; Xu, Z.; Bambrick, H.; Su, H.; Tong, S.; Hu, W. Heatwave and elderly mortality: An evaluation of death burden and health costs considering short-term mortality displacement. Environ. Int. 2018, 115, 334–342. [Google Scholar] [CrossRef]
- Koken, P.J.; Piver, W.T.; Ye, F.; Elixhauser, A.; Olsen, L.M.; Portier, C.J. Temperature, air pollution, and hospitalization for cardiovascular diseases among elderly people in Denver. Environ. Health Perspect. 2003, 111, 1312–1317. [Google Scholar] [CrossRef]
- Patel, D.; Jian, L.; Xiao, J.; Jansz, J.; Yun, G.; Robertson, A. Joint effect of heatwaves and air quality on emergency department attendances for vulnerable population in Perth, Western Australia, 2006 to 2015. Environ. Res. 2019, 174, 80–87. [Google Scholar] [CrossRef]
- Anwar, A.; Anwar, S.; Ayub, M.; Nawaz, F.; Hyder, S.; Khan, N.; Malik, I. Climate Change and Infectious Diseases: Evidence from Highly Vulnerable Countries. Iran. J. Public Health 2019, 48, 2187–2195. [Google Scholar] [CrossRef]


| Entire Time a | During Heatwave Occur | |||||||||||
|---|---|---|---|---|---|---|---|---|---|---|---|---|
| Total of Cases | Mean | SD | p25 | p50 | p75 | Total of Cases | Mean | SD | p25 | p50 | p75 | |
| Ninh Thuan (1 February 2010–31 December 2017) | ||||||||||||
| Respiratory diseases (ICD10: J00–J99, exclude J60–J70) | ||||||||||||
| All | 17,988 | 6.2 | 3.4 | 4 | 6 | 8 | 1369 | 6.3 | 3.3 | 4 | 6 | 8 |
| 6–60 | 5827 | 2.0 | 2.0 | 1 | 2 | 3 | 473 | 2.2 | 2.0 | 1 | 2 | 3 |
| >60 | 6844 | 2.3 | 1.9 | 1 | 2 | 3 | 543 | 2.5 | 1.9 | 1 | 2 | 3 |
| Ca Mau (31 May 2013–31 July 2018) | ||||||||||||
| Respiratory diseases (ICD10: J00–J99, exclude J60–J70) | ||||||||||||
| All | 13,203 | 7.0 | 4.2 | 4 | 7 | 10 | 838 | 5.9 | 4.2 | 3 | 6 | 9 |
| 6–60 | 4480 | 2.4 | 2.1 | 1 | 2 | 4 | 287 | 2.0 | 1.9 | 0 | 2 | 3 |
| >60 | 8722 | 4.6 | 3.0 | 3 | 4 | 6 | 551 | 3.9 | 2.9 | 2 | 4 | 6 |
| Cardiovascular diseases (ICD 10: I00– I99, exclude I00–I02 and I05–I09) | ||||||||||||
| All | 29,056 | 15.4 | 7.2 | 12 | 16 | 20 | 1785 | 12.7 | 7.7 | 9 | 14 | 18 |
| 6–60 | 7204 | 3.8 | 2.5 | 2 | 4 | 6 | 447 | 3.2 | 2.3 | 1 | 3 | 5 |
| >60 | 21,851 | 11.6 | 5.7 | 9 | 12 | 15 | 1338 | 9.5 | 6.0 | 6 | 10 | 13 |
| Average Temperature (°C) | Sun Hour (h) | Average Relative Humidity (%) | Rainfall Level (cm) | |||||||
|---|---|---|---|---|---|---|---|---|---|---|
| Number of Heatwaves | Duration | Entire Time | Heatwave | Entire Time | Heatwave | Entire Time | Heatwave | Entire Time | Heatwave | |
| Mean (min_max) | Mean (min_max) | Mean (min_max) | Mean (min_max) | Mean (min_max) | Mean (min_max) | Mean (min_max) | Mean (min_max) | Mean (min_max) | ||
| Ninh Thuan (1 January 2010 to 31 December 2017) a | ||||||||||
| Whole year | 34 | 6.4 (3–17) | 27.2 (21.8–31.8) | 29.7 (26.5–31.8) | 7.7 (0–12) | 9.2 (0.1–11.7) | 76.9 (50–97) | 73.5 (61–88) | 2.7 (0–147.7) | 1.2 (0–39.2) |
| 2010 | 3 | 7.3 (3–13) | 27.4 (23–31) | 29.8 (28.5–30) | 8.2 (0–11.8) | 9.0 (3.7–11.7) | 77.6 (60–92) | 75.8 (71–81) | 2.8 (0–98.8) | 0.3 (0–4.3) |
| 2011 | 3 | 3.7 (3–5) | 26.9 (22.6–30.4) | 29.7 (29.1–30.3) | 7.4 (0–11.6) | 9.2 (6.5–11.4) | 75.5 (57–91) | 71.9 (68.0–75.0) | 3.1 (0–147.7) | 1.4 (0–8.2) |
| 2012 | 3 | 7.3 (3–13) | 27.3 (24–30.9) | 29.0 (26.5–30.9) | 7.9 (0–11.6) | 8.9 (0.1–11.6) | 77.1 (57–96) | 74.6 (61–88) | 3.2 (0–145.3) | 4.3 (0–39.2) |
| 2013 | 1 | 8 | 27.1 (22.5–31.2) | 30.3 (29.6–31.2) | 7.6 (0–11.6) | 10.0 (7.4–11.6) | 76.7 (58–95) | 73 (70–78) | 2.9 (0–65.5) | 0 |
| 2014 | 9 | 5.2 (3–9) | 27.1 (21.8–31.2) | 29.7 (28.6–31.2) | 7.9 (0–12) | 8.9 (3.6–11.5) | 74.9 (58–88) | 71.8 (64–81) | 1.4 (0–63.8) | 0.9 (0–18.1) |
| 2015 | 9 | 7 (3–17) | 27.5 (21.8–31.8) | 30.1 (27.8–31.8) | 8.5 (0–11.5) | 9.6 (7.2–11.5) | 74.8 (50–92) | 73 (64–80) | 2.2 (0–136.6) | 1.1 (0–30.8) |
| 2016 | 5 | 8.4 (4–17) | 27.5 (23.2–30.9) | 29.8 (28.5–30.9) | 7.5 (0–11.5) | 9.0 (1–11.4) | 78.7 (56–97) | 74.8 (64–82) | 3.5 (0–132.1) | 0.7 (0–14.5) |
| 2017 | 1 | 4 | 27.0 (22.4–30.5) | 28.7 (28.2–29.4) | 6.8 (0–11.7) | 10.45 (9.9–11.2) | 79.7 (55–95) | 78 (77–80) | 2.6 (0–76) | 0 |
| Ca Mau (31 May 2013 to 31 July 2018) b | ||||||||||
| Whole year | 18 | 7.8 (3–37) | 30.2 (28.6–32) | 30.2 (28.6–32) | 8.4 (2.8–11.2) | 8.4 (2.8–11.2) | 75.4 (68–85) | 75.5 (68–85) | 1.9 (0–61.2) | 1.9 (0–62) |
| 2013 | 0 | - | 27.4 (24.3–30.2) | - | 4.7 (0–11.2) | - | 83.5 (70–97) | - | 7.3 (0–86.8) | - |
| 2014 | 4 | 7 (3–11) | 27.7 (23.2–31.1) | 29.9 (28.9–31.1) | 6.0 (0–11) | 7.85 (2.8–11) | 81.1 (66–94) | 77.4 (70–85) | 2.2 (0–92) | 1.7 (0–19) |
| 2015 | 4 | 1.5 (3–30) | 27.9 (24.8–31.0) | 29.9 (29–31) | 6.5 (0–11.1) | 8.4 (4.5–11.1) | 80.1 (68–96) | 74.8 (68–84) | 6.3 (0–189.2) | 2.3 (0–31.3) |
| 2016 | 3 | 14.7 (3–37) | 28.2 (24.4–32) | 30.7 (28.6–32) | 5.7 (0–11.2) | 9.2 (5–11.2) | 80.6 (64–94) | 74.1 (68–83) | 6.3 (0–81.5) | 1.5 (0–61.2) |
| 2017 | 3 | 5 (3–6) | 27.9 (24.5–30.4) | 30.2 (29.5–31.2) | 5.9 (0–11) | 8.3 (5.7–10.5) | 79.8 (67–97) | 75.6 (73–82) | 4.9 (0–61.7 | 1.9 (0–24.4) |
| 2018 | 4 | 3 (3–3) | 27.9 (24.5–30.4) | 29.8 (29.2–30.2) | 5.9 (0–11) | 7.1 (5–9.1) | 79.8 (67–97) | 77.8 (76–82) | 4.9 (0–61.7) | 3 (0–24.8) |
| Percentage Change (%) | p-Value | |||
|---|---|---|---|---|
| ER (%) | 95%CI * | |||
| Lower | Upper | |||
| Ninh Thuan | ||||
| Respiratory diseases | ||||
| All ages | 8.31 | 0.64 | 16.55 | 0.033 * |
| 6–60 | 0.70 | −11.53 | 14.63 | 0.916 |
| 60+ | 2.45 | −8.01 | 14.10 | 0.660 |
| Ca Mau | ||||
| Respiratory diseases | ||||
| All ages | 0.53 | −8.78 | 10.78 | 0.916 |
| 6–60 | −3.04 | −17.60 | 14.11 | 0.710 |
| 60+ | 2.41 | −8.68 | 14.85 | 0.683 |
| Cardiovascular diseases | ||||
| All ages | −5.11 | −11.18 | 1.37 | 0.120 |
| 6–60 | 1.61 | −9.94 | 14.65 | 0.795 |
| 60+ | −7.28 | −13.97 | −0.08 | 0.048 * |
Disclaimer/Publisher’s Note: The statements, opinions and data contained in all publications are solely those of the individual author(s) and contributor(s) and not of MDPI and/or the editor(s). MDPI and/or the editor(s) disclaim responsibility for any injury to people or property resulting from any ideas, methods, instructions or products referred to in the content. |
© 2023 by the authors. Licensee MDPI, Basel, Switzerland. This article is an open access article distributed under the terms and conditions of the Creative Commons Attribution (CC BY) license (https://creativecommons.org/licenses/by/4.0/).
Share and Cite
Nhung, N.T.T.; Hoang, L.T.; Tuyet Hanh, T.T.; Toan, L.Q.; Thanh, N.D.; Truong, N.X.; Son, N.A.; Nhat, H.V.; Quyen, N.H.; Nhu, H.V. Effects of Heatwaves on Hospital Admissions for Cardiovascular and Respiratory Diseases, in Southern Vietnam, 2010–2018: Time Series Analysis. Int. J. Environ. Res. Public Health 2023, 20, 3908. https://doi.org/10.3390/ijerph20053908
Nhung NTT, Hoang LT, Tuyet Hanh TT, Toan LQ, Thanh ND, Truong NX, Son NA, Nhat HV, Quyen NH, Nhu HV. Effects of Heatwaves on Hospital Admissions for Cardiovascular and Respiratory Diseases, in Southern Vietnam, 2010–2018: Time Series Analysis. International Journal of Environmental Research and Public Health. 2023; 20(5):3908. https://doi.org/10.3390/ijerph20053908
Chicago/Turabian StyleNhung, Nguyen Thi Trang, Le Tu Hoang, Tran Thi Tuyet Hanh, Luu Quoc Toan, Nguyen Duc Thanh, Nguyen Xuan Truong, Nguyen Anh Son, Hoong Van Nhat, Nguyen Huu Quyen, and Ha Van Nhu. 2023. "Effects of Heatwaves on Hospital Admissions for Cardiovascular and Respiratory Diseases, in Southern Vietnam, 2010–2018: Time Series Analysis" International Journal of Environmental Research and Public Health 20, no. 5: 3908. https://doi.org/10.3390/ijerph20053908