
Analysis of the Spatial-Temporal Evolution of Urbanization Quality in Zhejiang Province, China

Abstract
:1. Introduction
2. Data and Methods
2.1. Data Sources
2.2. Methods
- (1)
- Dimensionless processing
- (2)
- Entropy method
2.3. Index System
3. Results
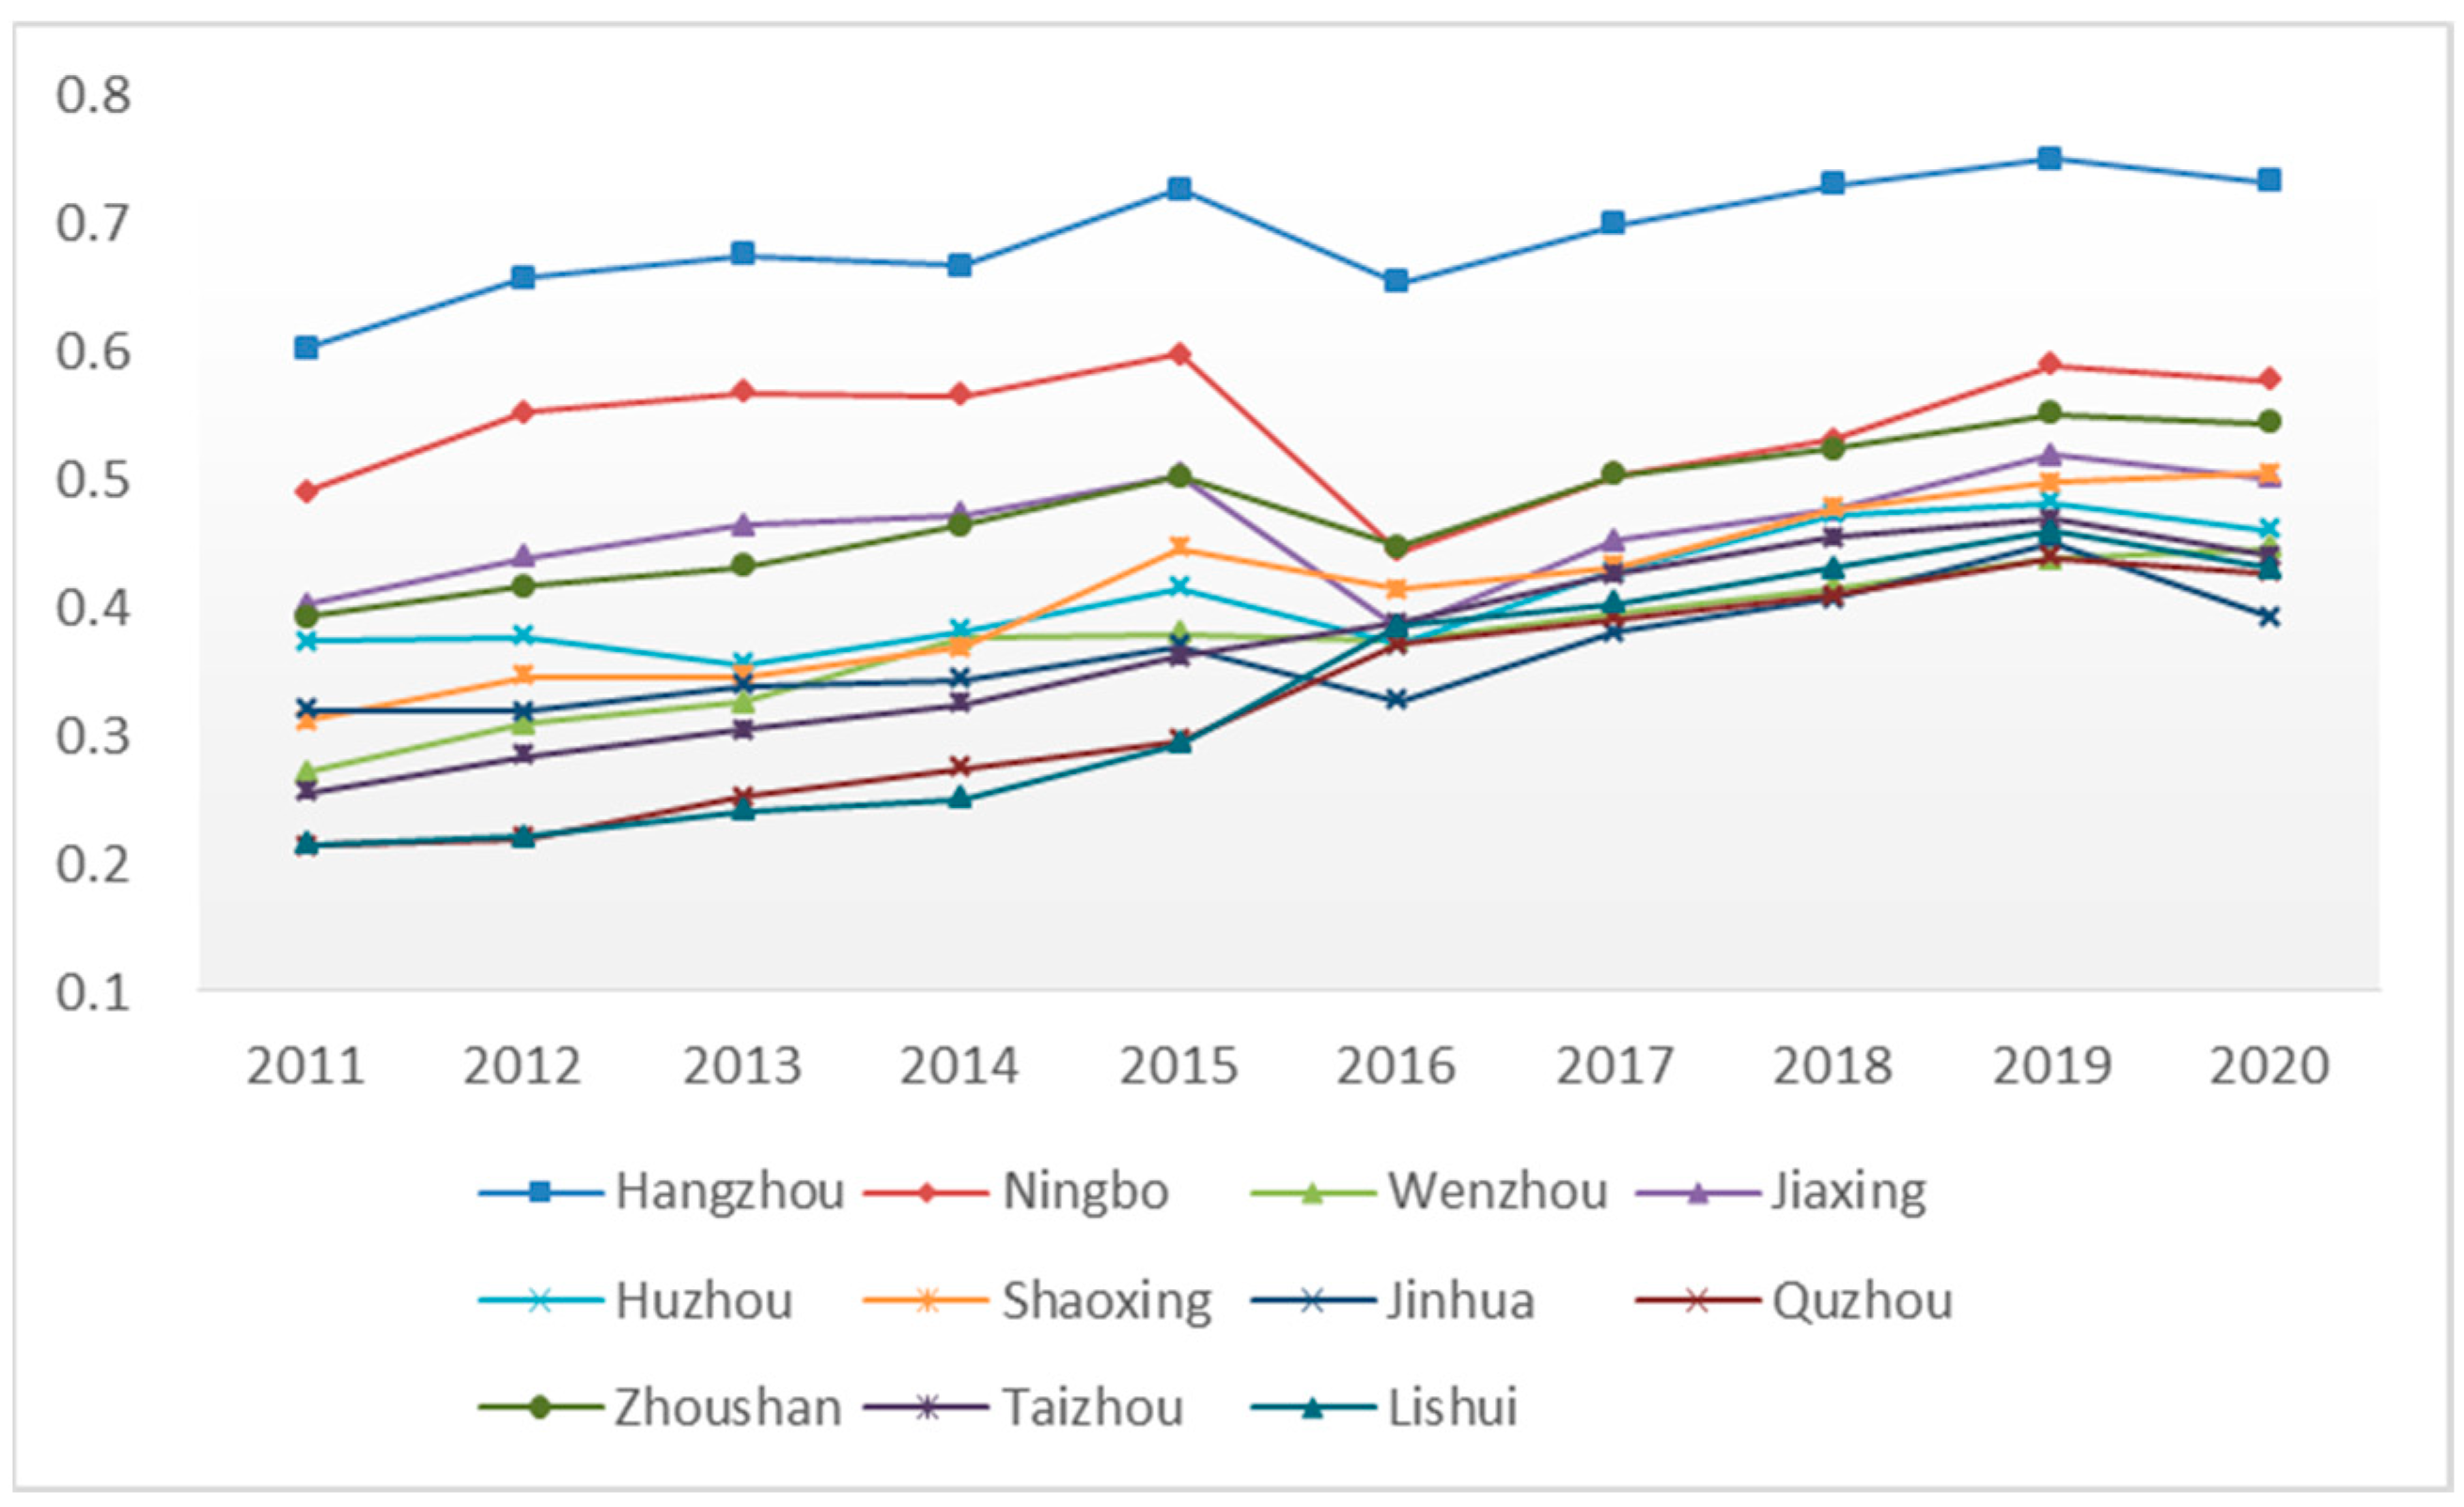
3.1. Characteristics of Urbanization Quality and Time Series Development
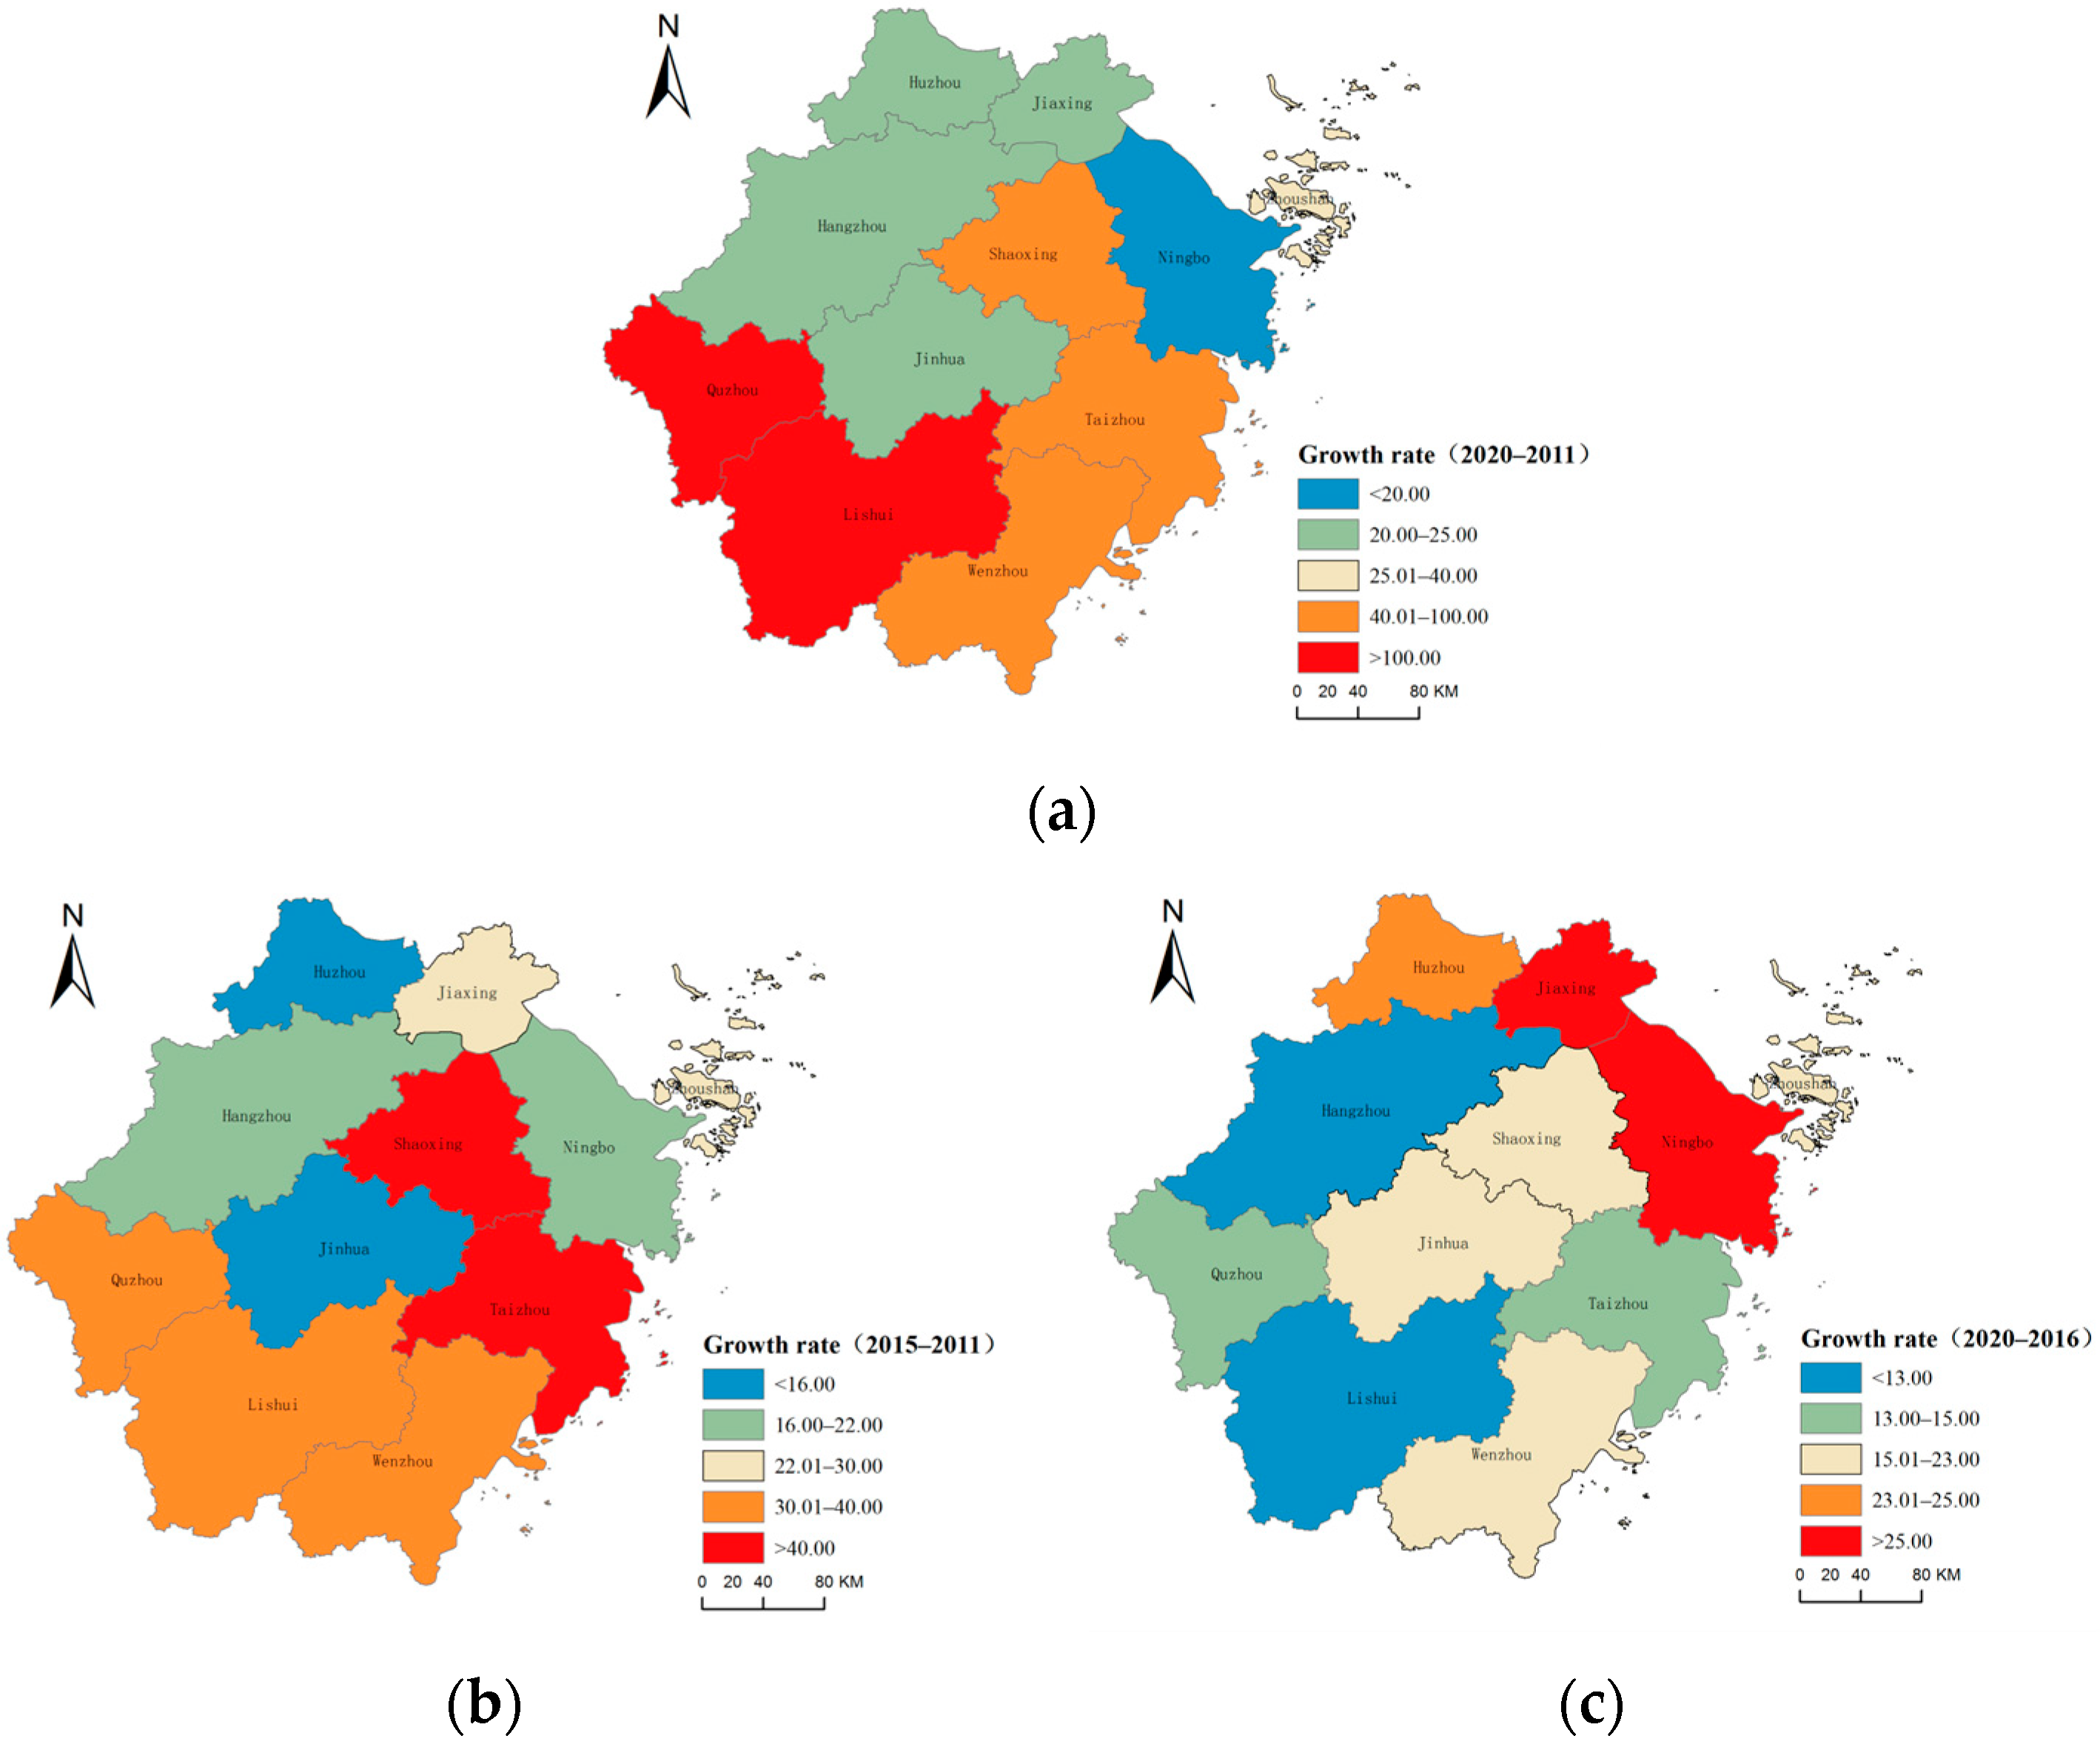
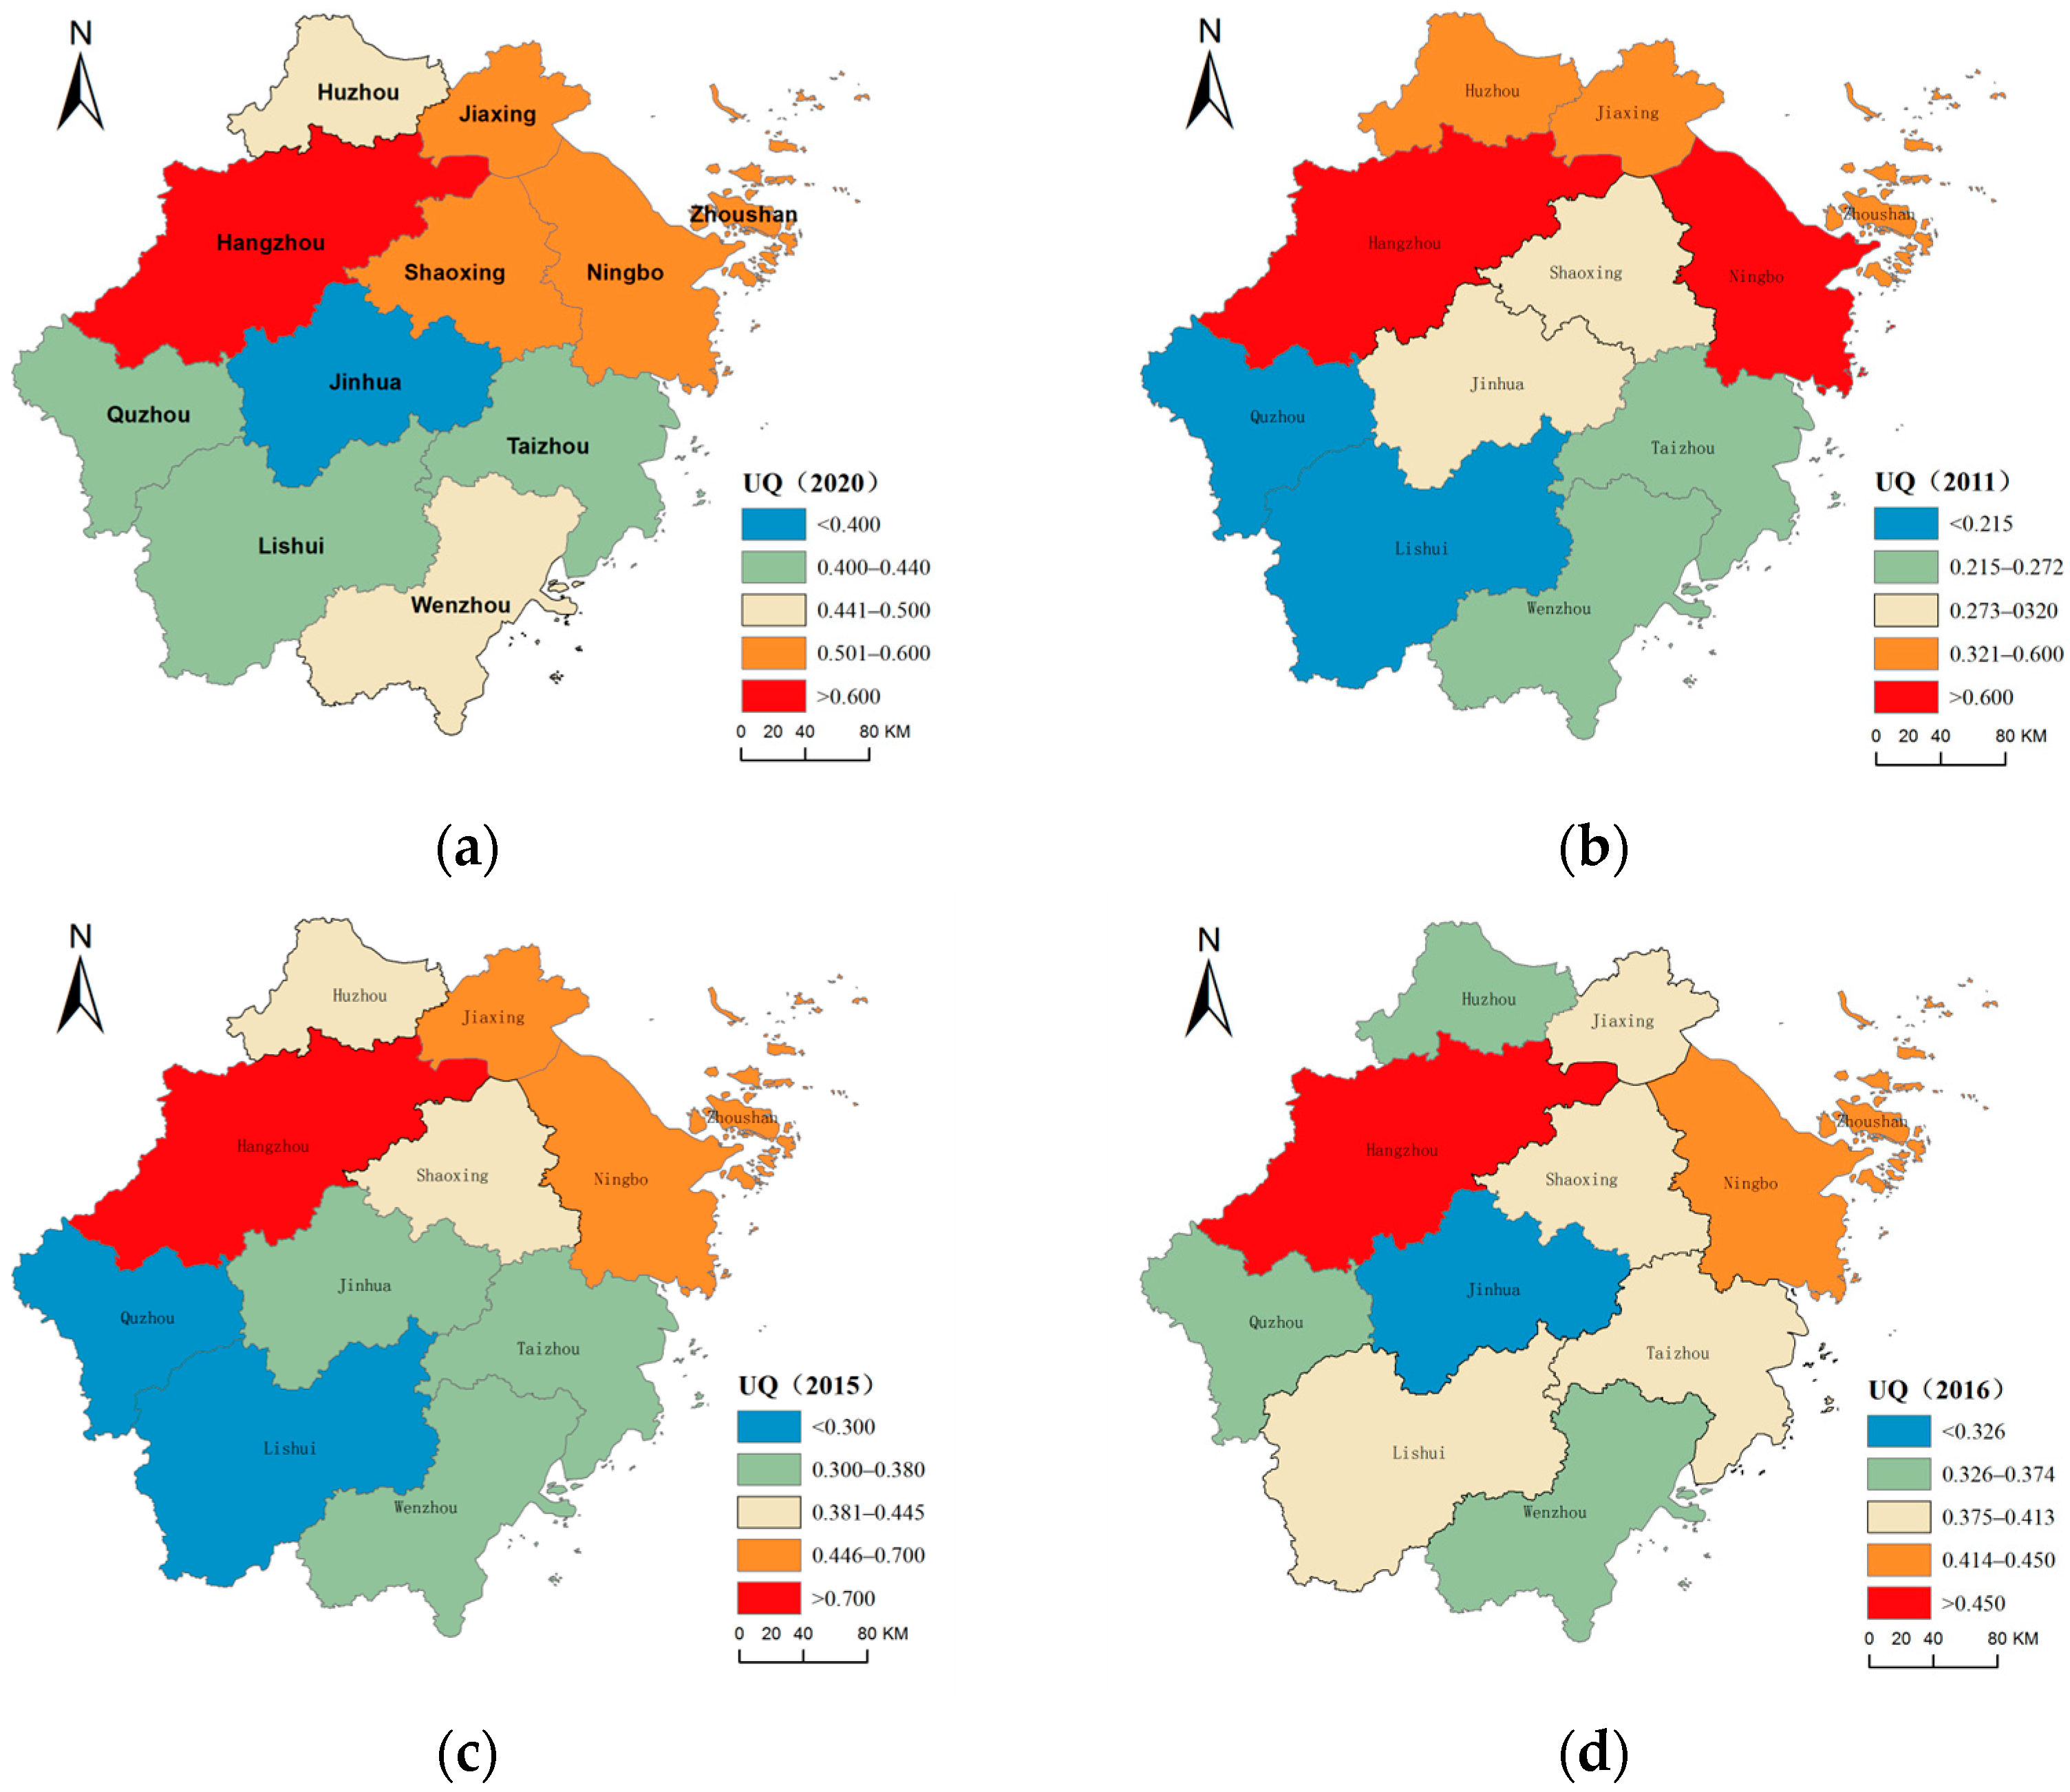
3.2. Spatial Difference of Urbanization Quality
3.3. Analysis of the Correlation between Urbanization Quality and Evaluation Indicators
3.3.1. Gray Correlation Calculation Method
3.3.2. Gray Relational Degree Result Analysis
3.3.3. Suggestions
- (1)
- Investment in innovation should be increased, employment support for urban industries should be strengthened, and the coordinated development of urban and rural areas should be promoted. In the process of economic development, Zhejiang Province should pay attention to the optimization and upgrading of industrial infrastructure, increase investment in innovative research and development, properly maintain the development of the secondary industry, and focus on increasing the proportion of the tertiary industry. For example, Wenzhou has been at a low level of urbanization quality during the study period. The fundamental reason for this is that Wenzhou is a city that was developed by relying on the private economy and township enterprises. The urban–rural dual structure has not been completely changed and the transformation of industrial structure has lagged, thus lowering the urbanization quality level.
- (2)
- Geographical advantages should be taken advantage of, urban public service capacity should be improved, and high-quality smart cities should play a leading role. Areas with high urbanization quality, such as Hangzhou and Ningbo, should continue to give full play to their advantages, take advantage of the superior geographical location to actively connect the construction of the Yangtze River Delta urban agglomeration and the national strategic development, improve the comprehensive carrying capacity and service capacity of the city and give full play to its radiating and driving role in the surrounding areas, promote coordinated development with the surrounding areas, build a metropolitan area, pay attention to the coordinated development between the economy and the ecological environment, improve the quality of public services, and build a leading area for China’s economic transformation, upgrading, reform, and innovation.
- (3)
- Attention should be paid to the inland mountainous areas, the coordinated development of the whole region should be promoted, and the mountain and sea cooperation project should be strengthened. The southwest area of Zhejiang Province has always been an underdeveloped region in the province, with poor geographical conditions and a weak urbanization foundation, resulting in a low level of urbanization. The Zhejiang Provincial Government has promoted the “Mountain and Sea Cooperation Project” for more than 20 years, and its policy effect is obvious. This is reflected in the prominent growth of the urbanization quality in Quzhou and Lishui, which are included in the project and have entered the rising channel. However, there are also policy marginal areas similar to Jinhua, and the urbanization development momentum is insufficient. It is necessary to pay attention to this over time, adjust the policy coverage of the mountain and sea cooperation project, and effectively promote coordinated development in the region.
- (4)
- Environmental governance should be continued, green and low-carbon development should be encouraged, and people’s quality of life should be improved. The direction of new urbanization toward sustainable development, that is resource-saving, environmentally friendly, economically efficient, and socially harmonious and that constantly improves the quality of people’s lives, is increasingly clear. The impact of the ecological environment on the quality of urbanization is being increasingly weighed. Zhejiang Province should unswervingly integrate the concept of ecological civilization into the process of urbanization, adhere to the path of intensive, efficient, green, and low-carbon sustainable development, and pay attention to the effectiveness of comprehensive environmental governance. Regions with a good ecological environment should maintain the advantages of the ecological environment, effectively improve the ecological function, actively and steadily improve their economic development level, and promote coordinated development within the region, passing on the principle of not damaging the ecological environment.
4. Discussion and Conclusions
Author Contributions
Funding
Institutional Review Board Statement
Informed Consent Statement
Data Availability Statement
Acknowledgments
Conflicts of Interest
References
- Fang, C.L. Basic rules and key paths for high-quality development of the new urbanization in China. Geogr. Res. 2019, 38, 13–22. [Google Scholar]
- Song, Y.; Chen, B.; Kwan, M.-P. How does urban expansion impact people’s exposure to green environments? A comparative study of 290 Chinese cities. J. Clean. Prod. 2020, 246, 119018. [Google Scholar] [CrossRef]
- Streule, M.; Karaman, O.; Sawyer, L.; Schmid, C. Popular urbanization: Conceptualizing urbanization processes beyond informality. Int. J. Urban Reg. Res. 2020, 44, 652–672. [Google Scholar] [CrossRef]
- Rana, M.M.P. Urbanization and sustainability: Challenges and strategies for sustainable urban development in Bangladesh. Environ. Dev. Sustain. 2011, 13, 237–256. [Google Scholar] [CrossRef]
- Kalhor, K.; Mahdisoltani, M. Urbanization and its effects on the environment and society along with sustainable development. In Proceedings of the Third International Symposium on Environmental and Water Resources Engineering, Tehran, Iran, 2–3 June 2015. [Google Scholar]
- Agbola, T.; Agunbiade, E. Urbanization, slum development and security of tenure: The challenges of meeting millennium development goal (MDG 7) in metropolitan Lagos, Nigeria. In Proceedings of the PRIPODE Workshop, Nairobi, Kenya, 11–13 June 2007; pp. 11–13. [Google Scholar]
- Heshmati, A.; Rashidghalam, M. Measurement and analysis of urban infrastructure and its effects on urbanization in China. J. Infrastruct. Syst. 2020, 26, 04019030. [Google Scholar] [CrossRef]
- Fang, C.L.; Wang, D.L. Comprehensive measures and improvement of Chinese urbanization development quality. Geogr. Res. 2011, 30, 1931–1946. [Google Scholar]
- Liao, H.Y. Study on the evaluation index system of new urbanization in developed regions of China—Taking Guangdong province as an example. Hunan Soc. Sci. 2013, 4, 162–165. [Google Scholar]
- Gan, J.; Guo, F.Y.; Chen, C.; Liu, J.S.; Li, Z. The spatio-temporal evolution characteristics of urbanization spatial differentiation in northeast China. Sci. Geogr. Sin. 2015, 35, 565–574. [Google Scholar] [CrossRef]
- Shang, X.; Kang, L.; Yang, J. Analysis on the space-time difference of urbanization quality in Gansu Province. Gansu Sci. Technol. 2021, 50, 71–75. [Google Scholar]
- Zhao, Y.; Xie, Q.; Ding, B. Comprehensive measurement and evolution characteristics of high quality development of urbanization in China. Reg. Econ. Rev. 2020, 5, 85–93. [Google Scholar] [CrossRef]
- Li, L.; Yu, Q.; Gao, L.; Yu, B.; Lu, Z. The Effect of Urban Land-Use Change on Runoff Water Quality: A Case Study in Hangzhou City. Int. J. Environ. Res. Public Health 2021, 18, 10748. [Google Scholar] [CrossRef] [PubMed]
- Wang, F.X.; Mao, A.H.; Li, H.L.; Jia, M.L. Quality measurement and regional difference of urbanization in Shandong province based on the entropy method. Sci. Geogr. Sin. 2013, 33, 1323–1329. [Google Scholar] [CrossRef]
- Huang, Y.P.; Sun, M.; Wen, Y.C.; Yang, D. High quality leap—Forward development Yunnan in the new era: Realistic evaluation and future conception. Inq. Into Econ. Issues 2020, 8, 97–104. [Google Scholar]
- Jia, Q.; Yun, Y.X. Measurement of urbanization development quality and analysis of regional disparities in Beijing-Tianjin-Hebei metropolitan region. J. Arid. Land Resour. Environ. 2015, 29, 8–12. [Google Scholar] [CrossRef]
- Yang, X.; Zhang, S.; Qiang, Q. Temporal and spatial patterns evolution of county urbanization quality in Anhui. Econ. Geogr. 2016, 36, 84–91. [Google Scholar] [CrossRef]
- Liu, J.Y.; Sun, F.; Yang, X.X.; Cui, X.; Liu, S.R. Study on inter-regional comparison and region difference in urbanization quality in Henan province. J. Henan Univ. (Nat. Sci.) 2013, 43, 271–278. [Google Scholar] [CrossRef]
- Li, Y.N. Research on construction and evaluation of new urbanization quality index system in Hunan province. Chin. J. Agric. Resour. Reg. Plan. 2020, 41, 172–177. [Google Scholar]
- Lan, Q.X.; Liu, Z.J.; Peng, Y.R. The construction of evaluation index system for quality of new—Pattern urbanization and its evaluation method: Based on study of spatial differences among China’s 31 provinces (cities) during the year of 2003 to 2014. South China J. Econ. 2017, 1, 111–126. [Google Scholar] [CrossRef]
- Bao, C.; Zou, J.J. Spatiotemporal variations of urbanization quality in northwest China. Arid. Land Geogr. 2019, 42, 1141–1152. [Google Scholar]
- Wu, K.S.; Zhang, X. Analysis of urbanization development in eight ethnic provinces level. China Popul. Resour. Environ. 2016, 26, 148–154. [Google Scholar]
- Liu, J.; Fang, C.L.; He, L.Z.; Ma, X.D. Evaluation index system of urbanization development quality in countries along the belt and road: Based on economic, institutional and social perspectives. Econ. Geogr. 2019, 39, 59–66. [Google Scholar] [CrossRef]
- Yuan, X.L.; He, B.; Lu, X.L.; Chen, M.L. The new urbanization quality assessment and the analysis of spatial heterogeneity in China. Urban Dev. Stud. 2017, 24, 125–132. [Google Scholar]
- Siciliano, G. Urbanization strategies, rural development and land use changes in China: A multiple-level integrated assessment. Land Use Policy 2012, 29, 165–178. [Google Scholar] [CrossRef]
- Chen, M.; Liu, W.; Tao, X. Evolution and assessment on China’s urbanization 1960–2010: Under-urbanization or over-urbanization? Habitat Int. 2013, 38, 25–33. [Google Scholar] [CrossRef]
- Shi, Y.; Zhu, Q.; Xu, L.; Lu, Z.; Wu, Y.; Wang, X.; Fei, Y.; Deng, J. Independent or Influential? Spatial-Temporal Features of Coordination Level between Urbanization Quality and Urbanization Scale in China and Its Driving Mechanism. Int. J. Environ. Res. Public Health 2020, 17, 1587. [Google Scholar] [CrossRef] [PubMed] [Green Version]
- Liu, J.; Li, Z.H. Regional characteristics of the high-quality development of new urbanization in Gansu. J. Longdong Univ. 2022, 33, 32–37. [Google Scholar]
- Xue, Y.; Hu, L.N.; Liu, H.B.; Zhao, X. Measurement on urbanization quality in Beijing-Tianjin-Hebei urban agglomeration. Stat. Decis. 2021, 37, 57–61. [Google Scholar] [CrossRef]
- Huang, X.R.; Guan, W.H.; Chen, M.X.; Hu, H.Y. Urbanization and optimization of the Yangtze River Delta urban agglomeration. Sci. Geogr. Sin. 2021, 41, 64–73. [Google Scholar] [CrossRef]
- Zhang, Y.; Yang, Q.Y.; Min, J. An analysis of coupling between the bearing capacity of the ecological environment and the quality of new urbanization in Chongqing. Acta Geogr. Sin. 2016, 71, 817–828. [Google Scholar]
- Zeng, W.; Yan, S.X.; Tian, J.H. Quality evaluation of new urbanization in Wuhan based on factor analysis. Stat. Decis. 2019, 35, 114–117. [Google Scholar] [CrossRef]
- Zhang, C.L.; Du, L.J.; Ma, J.S. Research on Quality Evaluation of New-type Urbanization of County Territory. J. Hebei Univ. Econ. Bus. 2019, 40, 102–108. [Google Scholar] [CrossRef]
- Yang, L.L. Evolution of spatial pattern of urbanization quality and its driving factors in central China—Based on the analysis of cities at prefecture level or above. Econ. Geogr. 2015, 35, 68–75. [Google Scholar] [CrossRef]
- Wang, Y.R.; Huang, H.; Shi, P.J. Spatial and temporal evolution of urbanization quality in China. Econ. Geogr. 2017, 37, 90–97. [Google Scholar] [CrossRef]
- Jiang, Z.Y.; Hu, Y. Analysis on the spatial-temporal pattern and heterogeneity evolution of high-quality development of China’s new urbanization. Urban Probl. 2021, 3, 4–16. [Google Scholar] [CrossRef]
- Luo, T.; Deng, H.B. Quality measurement and spatial-temporal difference analysis of urbanization development in the Yangtze River Economic Belt. Stat. Decis. 2018, 34, 136–140. [Google Scholar] [CrossRef]
- Tang, J.; Zhu, H.-l.; Liu, Z.; Jia, F.; Zheng, X.-X. Urban sustainability evaluation under the modified TOPSIS based on grey relational analysis. Int. J. Environ. Res. Public Health 2019, 16, 256. [Google Scholar] [CrossRef] [PubMed] [Green Version]

| First-Level Index | Second-Level Index | Unit | Index Type | Weight |
|---|---|---|---|---|
| Economic development quality | Per capita gross domestic product (x1) | RMB | Positive | 0.060754 |
| Per capita local fiscal revenue (x2) | RMB | Positive | 0.091792 | |
| Proportion of tertiary industry output value (x3) | % | Positive | 0.066676 | |
| Proportion of R and D expenditure in gross domestic product (x4) | % | Positive | 0.041799 | |
| Number of patents authorized per 10,000 people (x5) | Piece | Positive | 0.072680 | |
| Ecological environment quality | Per capita park green area (x6) | m2 | Positive | 0.018217 |
| Reduction rate of energy consumption per unit gross domestic product (x7) | Ton standard coal/104 RMB | Positive | 0.003321 | |
| Greening coverage rate of built-up area (x8) | % | Positive | 0.010525 | |
| Proportion of days with good air quality (x9) | % | Positive | 0.033225 | |
| Average annual concentration of fine particles (PM10) (x10) | % | Negative | 0.003679 | |
| Quality of urban and rural overall planning | Proportion of the urban population to the total population (x11) | % | Positive | 0.035892 |
| Per capita disposable income ratio of urban and rural residents (x12) | % | Negative | 0.015361 | |
| Per capita consumption expenditure ratio of urban and rural residents (x13) | % | Negative | 0.014341 | |
| Per capita disposable income growth rate of urban residents (x14) | % | Positive | 0.045245 | |
| Engel coefficient ratio of urban and rural residents (x15) | % | Positive | 0.058120 | |
| Average wage of on-the-job employees in urban units above the designated size (x16) | RMB | Positive | 0.061287 | |
| Public service quality | Number of students in ordinary primary and secondary schools per 10,000 people (x17) | Per 104 person | Positive | 0.042722 |
| Number of health technicians per 10,000 people (x18) | Per 104 person | Positive | 0.055554 | |
| Number of beds in health institutions per 10,000 people (x19) | Per 104 person | Positive | 0.051835 | |
| Book collection in public library per 10,000 people (x20) | Per 104 person | Positive | 0.090099 | |
| Number of public transport options per 10,000 people (x21) | Per 104 person | Positive | 0.067877 | |
| Urban road area per capita (x22) | m2 | Positive | 0.059000 |
| 2011 | 2012 | 2013 | 2014 | 2015 | 2016 | 2017 | 2018 | 2019 | 2020 | |
|---|---|---|---|---|---|---|---|---|---|---|
| Hangzhou | 0.602 | 0.656 | 0.674 | 0.666 | 0.725 | 0.653 | 0.698 | 0.729 | 0.749 | 0.731 |
| Ningbo | 0.489 | 0.551 | 0.567 | 0.565 | 0.597 | 0.443 | 0.503 | 0.530 | 0.588 | 0.577 |
| Wenzhou | 0.271 | 0.308 | 0.325 | 0.375 | 0.379 | 0.374 | 0.396 | 0.415 | 0.437 | 0.445 |
| Jiaxing | 0.402 | 0.438 | 0.463 | 0.472 | 0.503 | 0.384 | 0.451 | 0.475 | 0.518 | 0.500 |
| Huzhou | 0.373 | 0.377 | 0.355 | 0.381 | 0.414 | 0.371 | 0.428 | 0.472 | 0.481 | 0.460 |
| Shaoxing | 0.311 | 0.345 | 0.346 | 0.368 | 0.445 | 0.413 | 0.431 | 0.476 | 0.497 | 0.504 |
| Jinhua | 0.319 | 0.318 | 0.338 | 0.343 | 0.369 | 0.326 | 0.380 | 0.406 | 0.450 | 0.392 |
| Quzhou | 0.213 | 0.219 | 0.251 | 0.274 | 0.296 | 0.371 | 0.391 | 0.409 | 0.438 | 0.426 |
| Zhoushan | 0.392 | 0.416 | 0.431 | 0.463 | 0.502 | 0.447 | 0.503 | 0.523 | 0.550 | 0.543 |
| Taizhou | 0.255 | 0.283 | 0.304 | 0.324 | 0.361 | 0.387 | 0.425 | 0.454 | 0.468 | 0.439 |
| Lishui | 0.214 | 0.221 | 0.241 | 0.250 | 0.293 | 0.385 | 0.403 | 0.430 | 0.459 | 0.430 |
| Total | 3.841 | 4.132 | 4.296 | 4.483 | 4.884 | 4.554 | 5.009 | 5.320 | 5.636 | 5.447 |
| Ranking | Evaluation Index | Correlation |
|---|---|---|
| 1 | Reduction rate of energy consumption per unit gross domestic product (x7) | 0.9884 |
| 2 | Engel coefficient ratio of urban and rural residents (x15) | 0.9708 |
| 3 | Per capita disposable income ratio of urban and rural residents (x12) | 0.9682 |
| 4 | Per capita consumption expenditure ratio of urban and rural residents (x13) | 0.9666 |
| 5 | Proportion of tertiary industry output value (x3) | 0.9649 |
| 6 | Proportion of the urban population to the total population (x11) | 0.9586 |
| 7 | Proportion of days with good air quality (x9) | 0.9578 |
| 8 | Number of students in ordinary primary and secondary schools per 10,000 people (x17) | 0.9517 |
| 9 | Number of health technicians per 10,000 people (x18) | 0.9461 |
| 10 | Average wage of on-the-job employees in urban units above the designated size (x16) | 0.9428 |
Disclaimer/Publisher’s Note: The statements, opinions and data contained in all publications are solely those of the individual author(s) and contributor(s) and not of MDPI and/or the editor(s). MDPI and/or the editor(s) disclaim responsibility for any injury to people or property resulting from any ideas, methods, instructions or products referred to in the content. |
© 2023 by the authors. Licensee MDPI, Basel, Switzerland. This article is an open access article distributed under the terms and conditions of the Creative Commons Attribution (CC BY) license (https://creativecommons.org/licenses/by/4.0/).
Share and Cite
Huang, Y.; Jiang, X.; Chen, Y. Analysis of the Spatial-Temporal Evolution of Urbanization Quality in Zhejiang Province, China. Int. J. Environ. Res. Public Health 2023, 20, 4093. https://doi.org/10.3390/ijerph20054093
Huang Y, Jiang X, Chen Y. Analysis of the Spatial-Temporal Evolution of Urbanization Quality in Zhejiang Province, China. International Journal of Environmental Research and Public Health. 2023; 20(5):4093. https://doi.org/10.3390/ijerph20054093
Chicago/Turabian StyleHuang, Yangfei, Xiaomin Jiang, and Yong Chen. 2023. "Analysis of the Spatial-Temporal Evolution of Urbanization Quality in Zhejiang Province, China" International Journal of Environmental Research and Public Health 20, no. 5: 4093. https://doi.org/10.3390/ijerph20054093