1. Introduction
China is the third largest mining country in the world, and mining and utilization have caused many environmental problems [
1,
2,
3]. The environmental regulations of the People’s Republic of China on the Prevention and Control of Radioactive Pollution give a clear definition of the associated radioactive mines, but the definition standard of associated radioactive mines has been perplexing for the departments of ecological and environmental protection, the nuclear industry, and the exploration and development of various resources, and it is still under the process of long-term investigation and research. According to the survey, the output of industrial solid waste in China exceeded 3 billion t/year in 2020, with an average annual growth rate of about 7% [
4]. Tailing production accounts for about 80% of total industrial waste, and the total reserves exceed 60 billion tons. At present, the main types of tailings at home and abroad are iron, copper, and gold, and the total stock of the three accounts for about 83% of the total tailings.
Located between 26°50′ and 36°53′ north latitude and between 78°25′ and 99°06′ east longitude, the Tibet Autonomous Region has an average altitude of over 4000 m. It is the main part of the Qinghai–Tibet Plateau, known as the “roof of the world”, with a vast territory. More than 3 million permanent residents are distributed on land that is 1.2 million square kilometers in size [
5], and it is one of five ethnic autonomous regions in China. Tibet has special geology and is rich in natural resources, and its unique resource advantages and resource endowments give Tibet excellent metallogenic conditions [
6]. With the acceleration of urbanization, the arrival of the era of industrialization, and the rich reserves of mineral resources, mineral resource mining, and tourism have become the mainstay of economic development in Tibet [
7]. The exploitation of mineral resources not only drives economic development but also causes a series of environmental problems. For example, Wu et al. [
8] found that the accumulation of tailings (slag) in southwest Guizhou seriously exceeded the standard of As, Cd, and Hg in the surrounding surface soil. In addition to the impact on the surrounding soil, mining will have an impact on water, the atmosphere, geology, etc. The tailing wastewater generated by mining will lead to the balance between groundwater, surface water, and precipitation being disrupted, and mining can easily result in soil erosion, mining area settlement, etc. In the process of quarry operations, a lot of soot and exhaust gas will be produced, thus causing serious pollution to the atmosphere [
9,
10,
11]. Ruiz-Ortiz et al. [
12] found that the surrounding environment of lead–zinc tailing ponds increased gradually with increasing distance from the tailing pond. Many studies have found that the accumulation of tailings will also affect the surrounding environment, and the development of tailing resource utilization has become the main way of solving the problem of large tailing reserves.
A total of 19 mineral deposits have been discovered in Lhasa, Tibet. Copper, lead, and zinc mines account for 78.95% of the total mines around Lhasa [
13]. In order to deal with the slag generated by mining, there are currently seven copper, lead, and zinc tailing ponds in use and two copper tailing ponds under construction around Lhasa [
14]. Tibet’s special geology and landform have resulted in the formation of many mineral resources (molybdenum ore, chromite, copper ore, lead, and zinc ore). Therefore, mining has become the mainstay of Tibet’s economic development. In addition to driving economic development, mining also causes a series of environmental problems. Under the prospect of simultaneous economic and ecological protection, tailing ponds have played a significant role in the treatment of tailings and slag, but long-term storage will also have an impact on the surrounding environment, especially the heavy metals in tailings.
Therefore, by investigating the background information of the typical tailing ponds around Lhasa, this study focused on the specific activity of radium-226, thorium-232, potassium-40, and other radioactive indicators in 17 mining areas, analyzed the relationship between radionuclides and radioactivity levels in each mining area, and evaluated the gamma radiation level exposure to miners and their surrounding residents.
2. Survey and Research Methods
2.1. Sample Collection and Processing
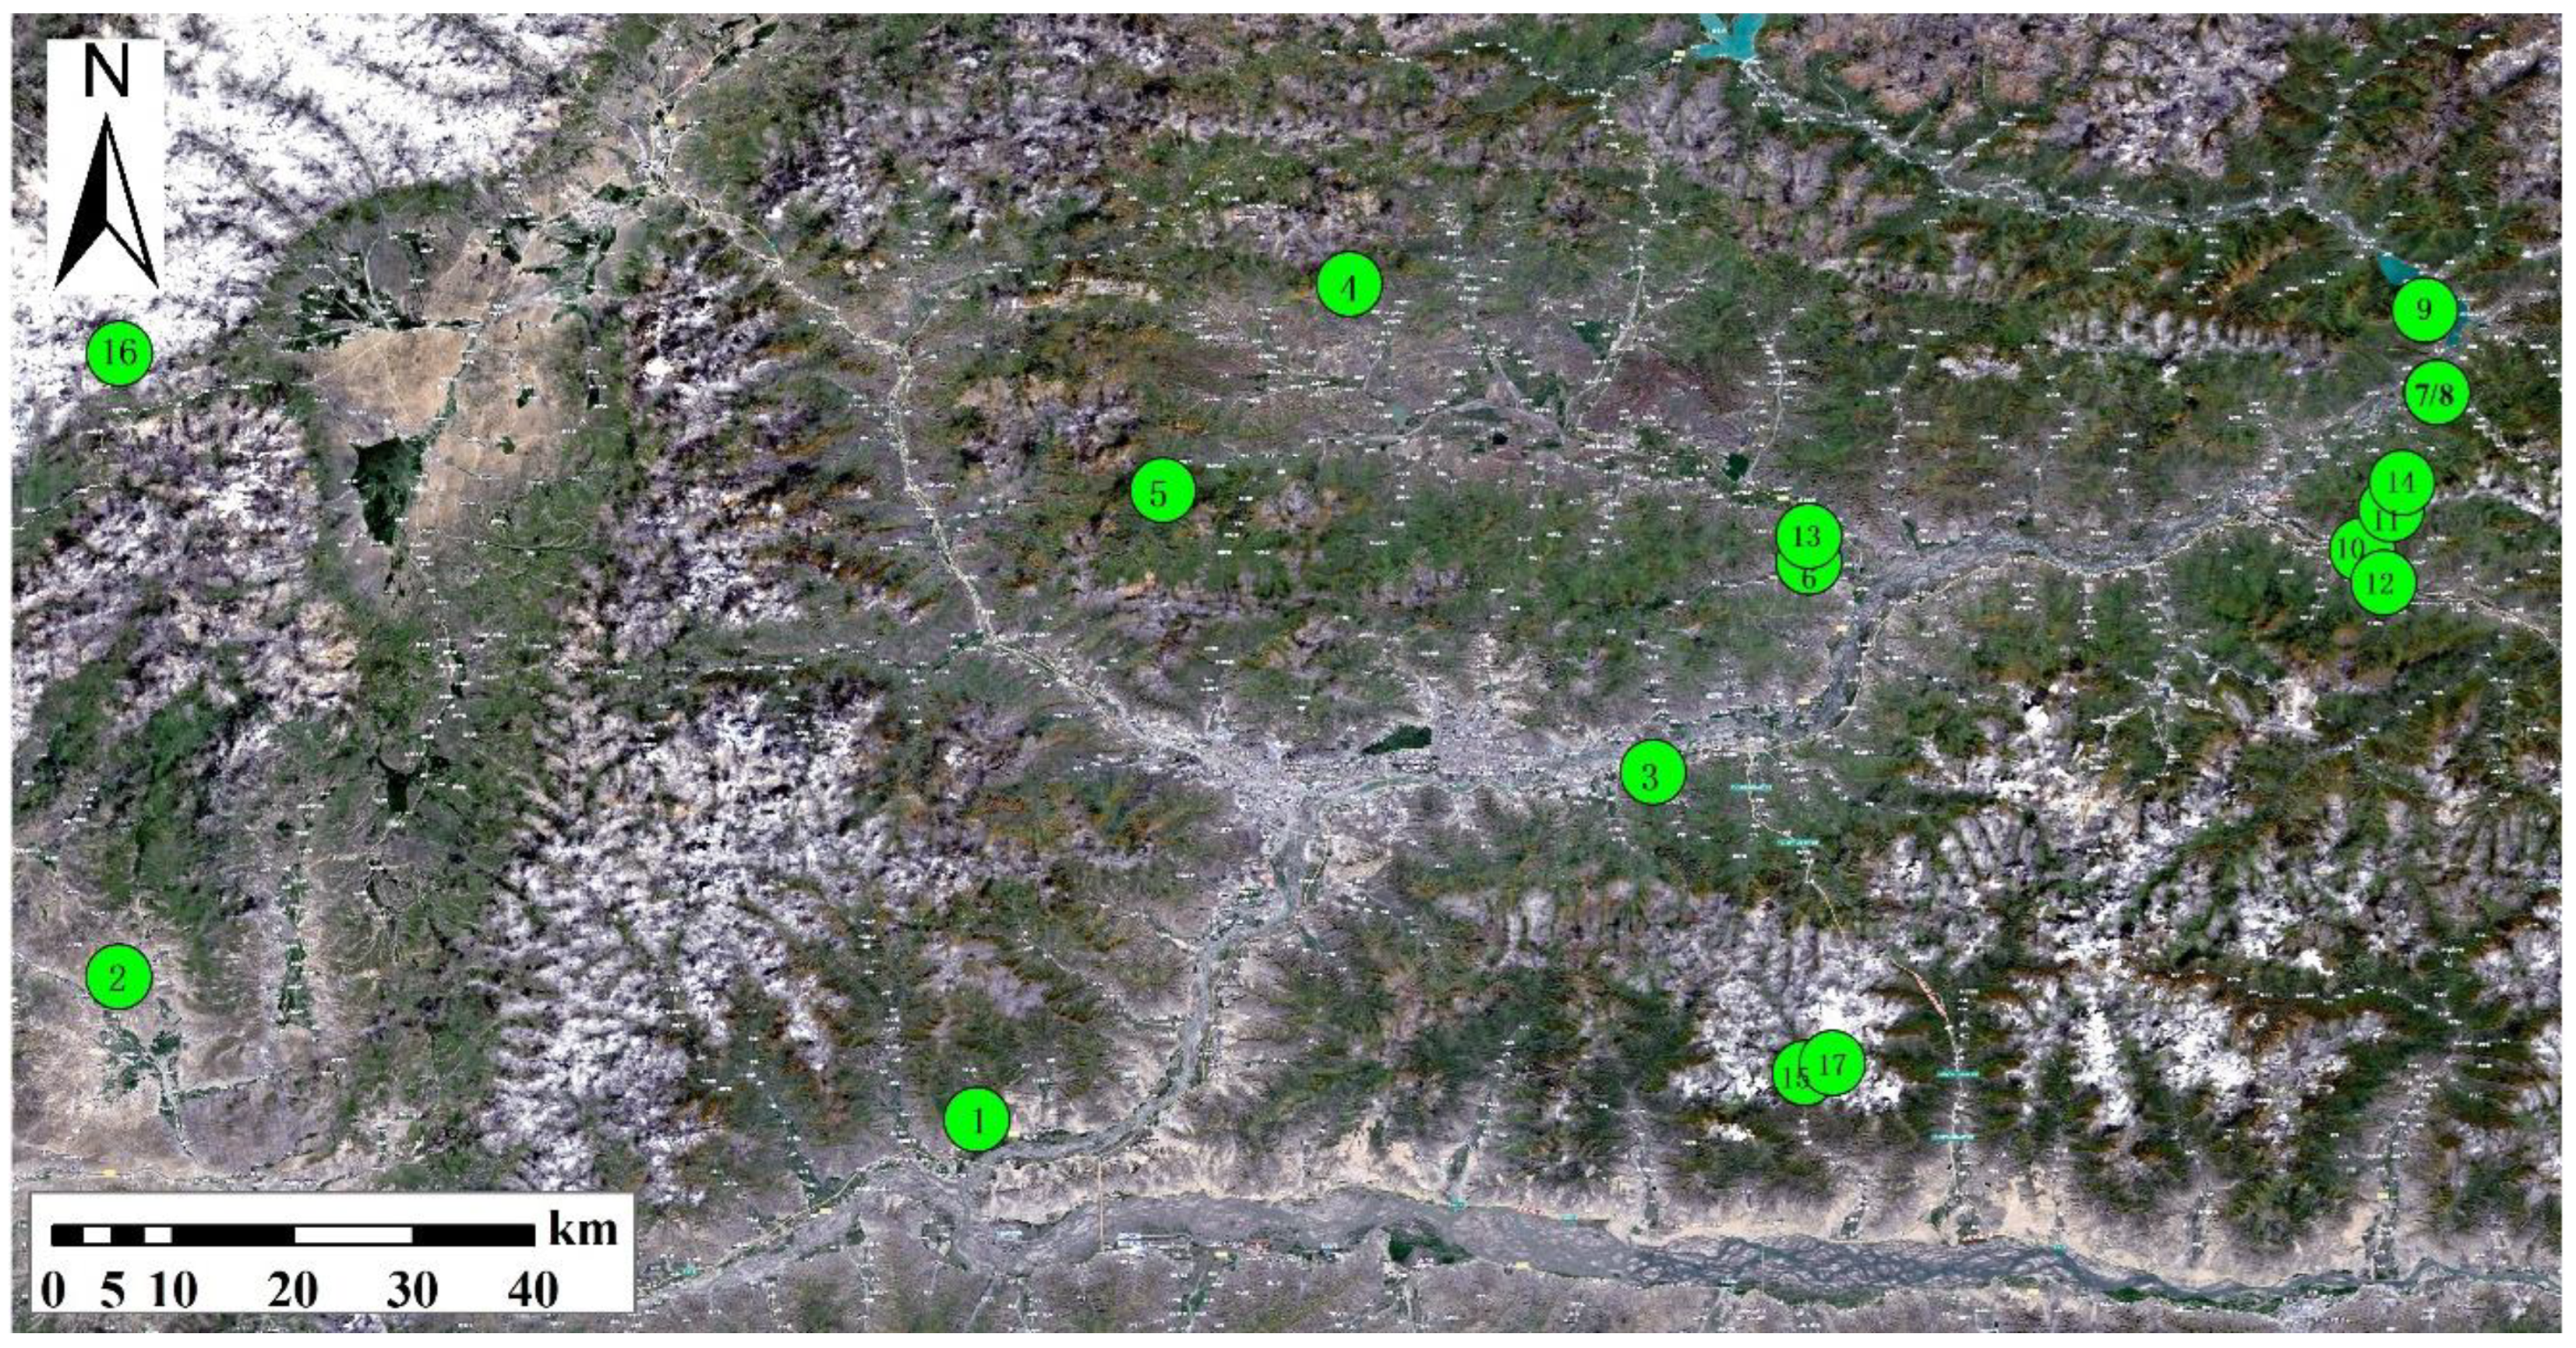
In this study, 17 typical metal tailing mining areas in Lhasa, Tibet, are considered, and the sampling points are calibrated by using directional Angle distribution points combined with GPS coordinate information. The 17 sampling points in the tailing pond are numbered 1–17. The specific distribution of sampling points is shown in
Figure 1, and the specific mining areas of the sampling points are shown in
Table 1.
Samples were dried in an oven at 200 °C for 72 h until a constant mass (103 g) was obtained to ensure that moisture was completely removed from the sample to avoid clamping the sample particles during crushing. The sample was then pulverized into a powder using a mortar and pestle to increase the surface area. A 2 mm sieve was used to obtain a uniform particle size. The sieved samples were weighed with an electronic balance to determine their dry mass. The samples were then sealed in standard 500 mL beakers and stored for 30 days to achieve long-term equilibrium between radon and its progeny.
2.2. Radioactivity Detection
2.2.1. Calibration of Detector
Gamma rays and their energy were detected using a sodium iodide detector (GDM 20 series). First, the gamma-ray detector was calibrated. Europium (Eu-152) radioisotope was used as the reference material to calibrate the energy and efficiency of the detector. Eu-152 was used in the calibration process because it emits many gamma rays of known intensity and energy. The spectrum of the Eu-152 solution was obtained by placing it on the detector for 6000 s. AutoDas software 2020 was used to analyze the peak of known energy, and the channel number scale was converted into an energy scale. The resolution of the detector was determined by energy and efficiency calibration. To obtain the background radiation, an empty 500 mL beaker was placed on the detector to produce a spectrum with a period of 6000 s. The background radiation spectrum was then subtracted from the gamma-ray spectrum of the sample to obtain a net count [
15,
16,
17]. In addition, the setup was coupled with a computer-based multichannel analyzer (MCA), which will be used for data acquisition and analysis of gamma spectra.
2.2.2. Identification of Radionuclides
Each sample was placed on a gamma-ray detector surrounded by a 10-cm-thick lead cylinder with a removable top to reduce background radiation. A minimum of 6000 s were counted in order to obtain a clear spectrum. Using AutoDas software, the gamma ray energy and intensity of each sample spectrum were obtained. Each energy peak observed in the gamma spectrum was compared with the standard energy peak of various radionuclides found in nature. The radionuclides produced in the energy peaks observed in the spectra of each sample were identified [
17,
18,
19].
2.2.3. Determination of Radon Concentration
Radon concentration was measured in metal tailing samples from 17 areas in Lhasa, Tibet, by RAD on an electronic detector (RAD7). It was measured in the air. The detector uses a solid-state alpha detector to convert alpha radiation into an electrical signal and has the ability to electrically determine the energy of each alpha particle. Radon was quantified from 218 Po and 214 Po peaks with α energies of 6.00 MeV and 7.69 MeV, respectively. Before beginning to measure radon, it was ensured that a desiccant and inlet filter was placed between the sample and RAD7. RAD7 is set to “sniff” mode because of its rapid response to concentration changes and its ability to recover quickly after high concentrations. Before the counting procedure, the pump was run for 5 min to flush the measuring chamber [
20]. The actual measurement of radon concentration was performed over a full cycle, lasting 5 min, for a total of 48 cycles. At the end of the run, RAD7 displayed a bar chart showing the maximum, minimum, and average radon concentrations.
2.2.4. Determination of Specific Activity
The activity level of each radionuclide determined in the sample was determined by subtracting the background radiation count from the total light peak area. The activity of
226Ra was determined to be 351.9 keV of 214 Bi and 609.3 keV of 214 Pb. The activity of 232 Th was measured using 238.6 keV of its decay product
212Pb and 583.2 keV of 208 Tl, while the concentration of
40K activity was measured in it’s own the gamma spectrum of 1460.8 keV [
21,
22,
23,
24].
The specific activity concentration levels (SAC, Bq/kg) of
226Ra,
232Th, and
40K in each sample were calculated using the following formula:
where N/T is the net activity rate, N is the net light peak area, m is the sample mass, k is the absolute γ emission probability (branching ratio), η is the detector efficiency, and T is the counting time for each sample. According to the standard radionuclide data sheet of the International Atomic Energy Agency [
25], the branching ratio of each radionuclide was determined. By using this equation, the detector efficiency η was determined:
where Y is the net peak area of the calibration spectrum, A is the activity of Eu-152 (reference radionuclide), and T is the counting time of the calibration spectrum.
2.2.5. Determination of γ Dose Rate
The gamma radiation dose rate (D
O nGy/h) in air at 1 meter above ground level was calculated from the measured specific activity concentration using the following equation:
Among them, 0.462, 0.604, and 0.0417 are the conversion factors of the absorbed dose rate of
226Ra,
232Th, and
40K, respectively, and A
Ra, A
Th, and A
K are their average specific activities, respectively [
26,
27,
28,
29,
30].
The annual outdoor effective dose caused by ground gamma radiation can be calculated using the conversion coefficient between the absorbed dose in air and the effective dose in the human body denoted as 0.7 Sv G/y, and the outdoor occupancy coefficient, denoted as 0.2. The formula is as follows:
where EO is the annual outdoor effective dose (mSv/y), D
O is the absorbed dose rate in air, and T is 8760 h [
31,
32,
33,
34].
2.3. Determination of Radiation Hazard Index
The radiation hazard index is determined to assess the level of exposure to γ-rays that can cause harm to the exposed person. Therefore, the external hazard index, internal hazard index, and γ index were determined in this study.
We assume that a dose of 370 Bq/kg of 226Ra, 259 Bq/kg of 232Th, and 1410 Bq/kg of 40K yields the same γ dose. When the human body is exposed to gamma rays, the tissues of the body absorb a certain amount of gamma rays. How much radiation is absorbed depends on how the body is exposed to radiation. The damage from radiation depends on many factors, including the amount of radiation absorbed, the duration of exposure, and the person’s age and sex.
External risk index and internal risk index are two radiation risk indexes used to assess the risk of γ radiation exposure, and their maximum values must be less than 1 (unit).
Due to the influence of external gamma radiation, the external hazard index (H
ex) can be calculated using Equation (5) [
35,
36,
37]:
The internal hazard index (H
in) caused by gamma radiation from internally deposited radionuclides is calculated using Equation (6) [
38,
39,
40]:
The gamma index is another hazard index used to screen materials containing
226Ra,
232Th, and
40K that could become hazardous when used as construction materials. The γ index (Iγ) was calculated using Formula (7):
For commonly used materials such as concrete and sand, the standard dose rate for I
γ < 0.5 is 0.3 mSv/y. If I
γ > 6, the material cannot be used [
41,
42,
43].


