

Brisk Walking Pace Is Associated with Better Cardiometabolic Health in Adults: Findings from the Chilean National Health Survey 2016–2017

 ,
,  , , ,
, , ,  , and
, and 
Abstract
:1. Introduction
2. Materials and Methods
2.1. Study Design
2.2. Variables and Measuring Instruments
2.2.1. Walking Pace
2.2.2. Cardiometabolic Health Markers and Lipid Profile
2.2.3. Sociodemographic, Lifestyle, and General Health Variables
Sociodemographic Variables
Lifestyle Variables
Physical Activity (PA)
Anthropometric Measures
2.3. Statistical Analyses
3. Results
3.1. Characteristic of the Sample According to Walking Pace
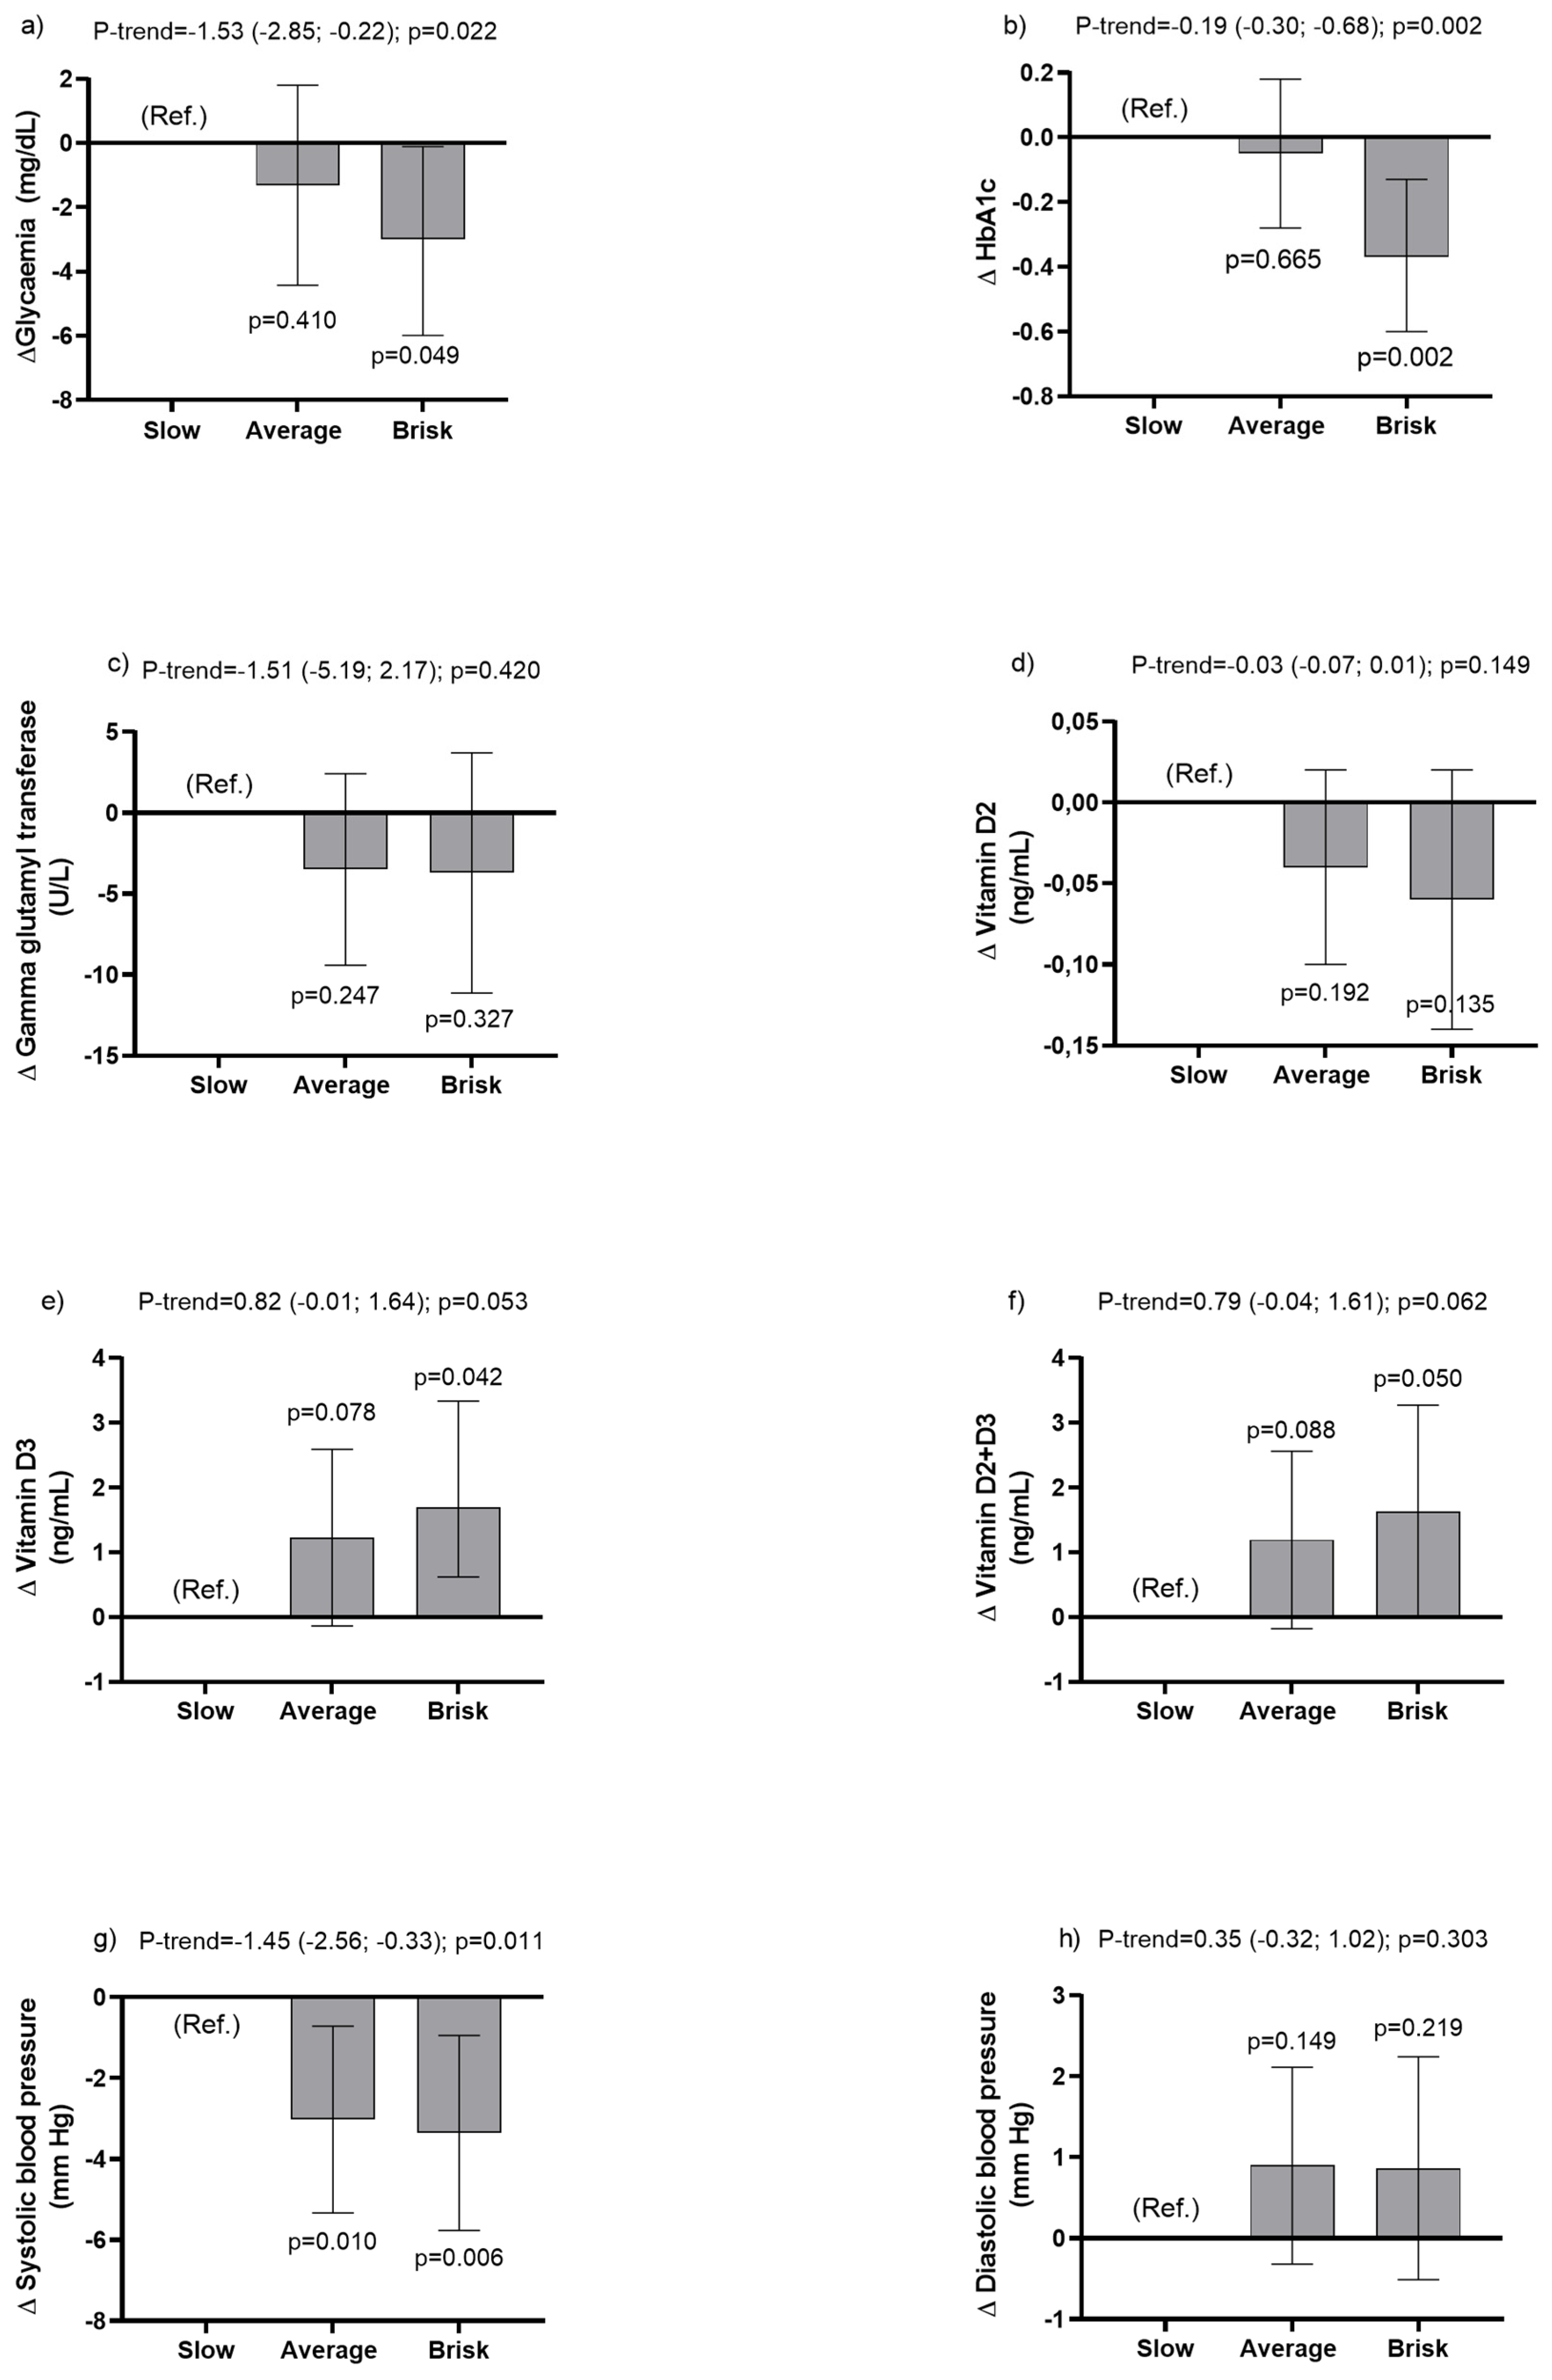
3.2. Associations between Walking Pace and Cardiometabolic Health Markers
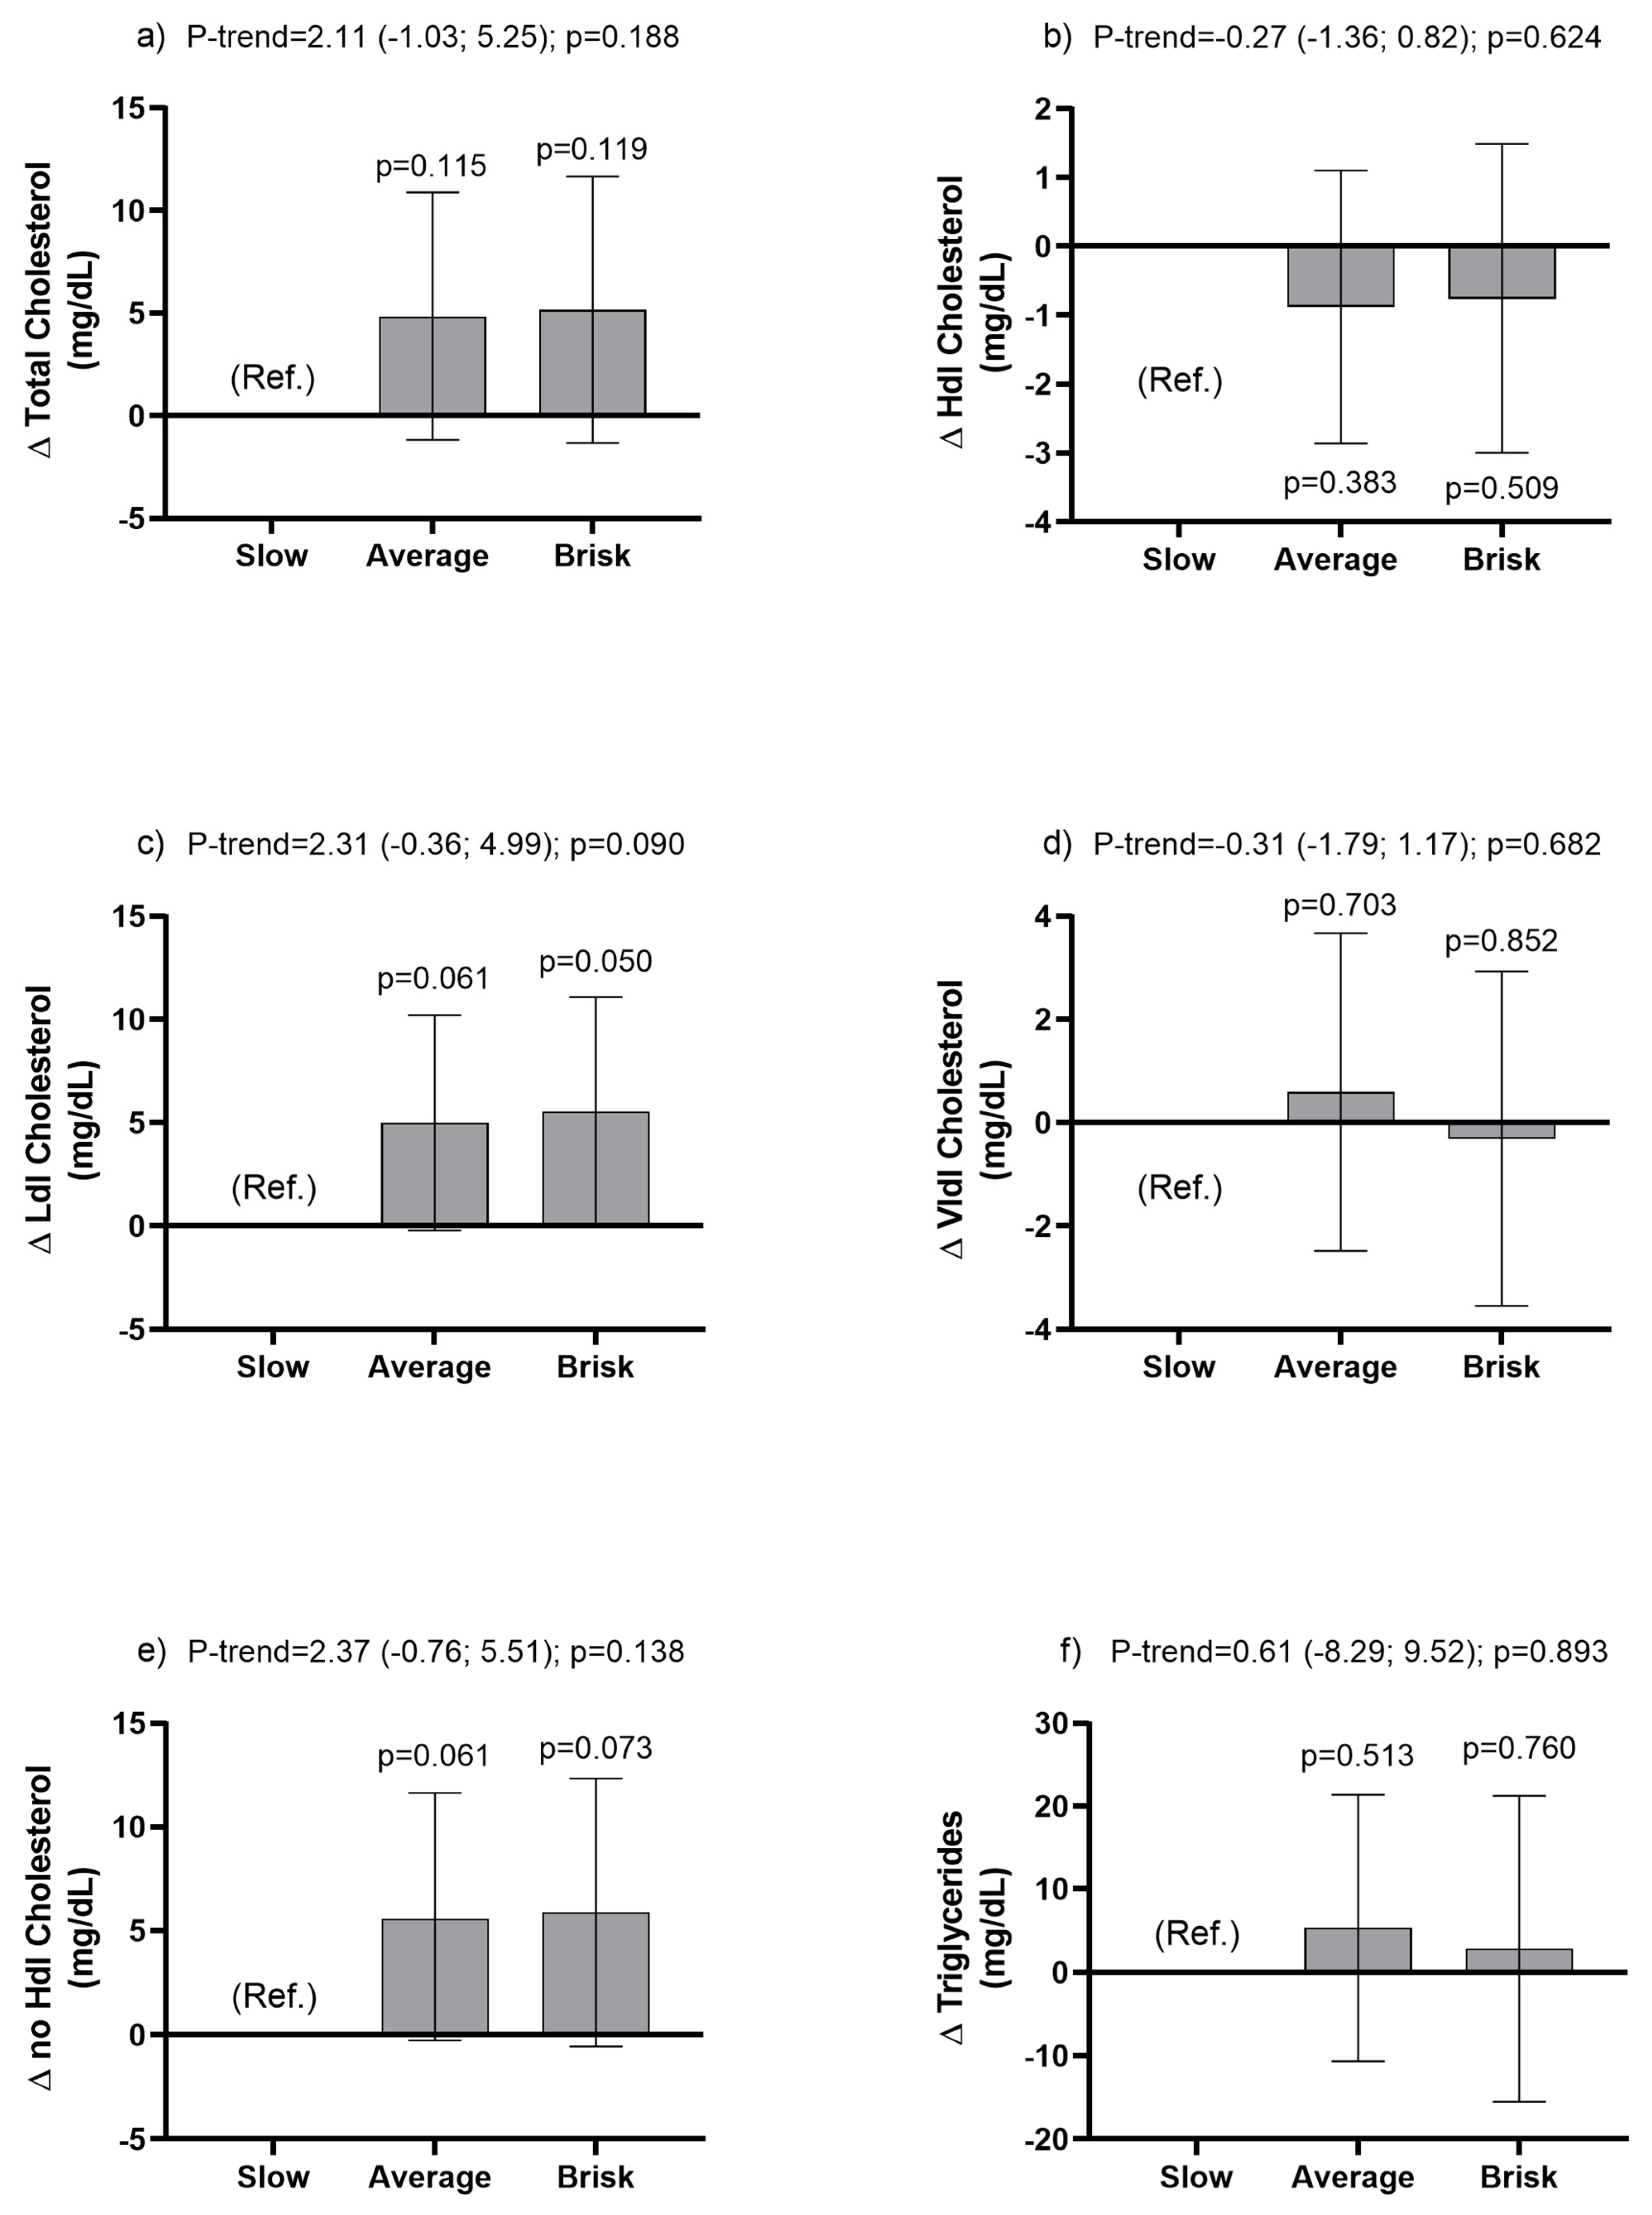
3.3. Associations between Walking Pace Categories and Metabolic Lipid Profile Outcomes
4. Discussion
4.1. How Does This Research Contribute to Society and Science?
4.2. Limitations and Future Research
5. Conclusions
Author Contributions
Funding
Institutional Review Board Statement
Informed Consent Statement
Data Availability Statement
Conflicts of Interest
References
- Mendoza, W.; Miranda, J. Global shifts in cardiovascular disease, the epidemiologic transition and other contributing factors: Towards a new practice of Global Health Cardiology. Cardiol. Clin. 2017, 35, 1–12. [Google Scholar] [CrossRef] [PubMed] [Green Version]
- Organización Panamericana de la Salud. Salud en las Américas+, Edicion del 2017. Resumen: Panorama Regional y Perfiles de País; OPS: Washington, DC, USA, 2017; Available online: http://iris.paho.org (accessed on 26 December 2022).
- Garrido-Méndez, A.; Concha-Cisternas, Y.; Petermann-Rocha, F.; Díaz-Martínez, X.; Leiva, A.M.; Troncoso, C.; Martinez, M.A.; Salas-Bravo, C.; Álvarez, C.; Ramírez-Campillo, R.; et al. Influencia de la edad sobre el cumplimiento de las recomendaciones de actividad física: Resultados de la Encuesta Nacional de Salud en Chile 2009–2010. Rev. Chil. Nutr. 2019, 46, 121–128. [Google Scholar] [CrossRef] [Green Version]
- Acosta, E.; Páez, M. Cardiometabolic index as a predictor of cardiovascular risk factors in adolescents. Rev. Salud Publica 2018, 20, 340–345. [Google Scholar] [CrossRef] [PubMed]
- Organización Panamericana de la Salud. Indicadores Básicos. Situación de Salud en las Américas. 2014. Available online: https://iris.paho.org/handle/10665.2/31074 (accessed on 26 December 2022).
- Ministerio de Salud de Chile. Encuesta Nacional de Salud 2016–2017 Primeros Resultados. 2018. Available online: https://www.minsal.cl/wp-content/uploads/2017/11/ENS-2016-17_PRIMEROS-RESULTADOS.pdf (accessed on 26 December 2022).
- Ortega, F.B.; Ruiz, J.R.; Castillo, M.J.; Sjöström, M. Physical fitness in childhood and adolescence: A powerful marker of health. Int. J. Obes. 2008, 32, 1–11. [Google Scholar] [CrossRef] [Green Version]
- Jurca, R.; Lamonte, M.J.; Barlow, C.E.; Kampert, J.B.; Church, T.S.; Blair, S.N. Association of muscular strength with incidence of metabolic syndrome in men. Med. Sci. Sport. Exerc. 2005, 37, 1849–1855. [Google Scholar] [CrossRef] [Green Version]
- Yokoyama, H.; Shiraiwa, T.; Takahara, M.; Iwamoto, M.; Kuribayashi, N.; Nomura, T.; Yamada, M.; Sone, H.; Araki, S.-I. Applications of physical performance measures to routine diabetes care for frailty prevention concept: Fundamental data with grip strength, gait speed, timed chair stand speed, standing balance, and knee extension strength. BMJ Open Diabetes Res. Care 2020, 8, e001562. [Google Scholar] [CrossRef]
- Smith, L.; Yang, L.; Hamer, M. Handgrip strength, inflammatory markers, and mortality. Scand. J. Med. Sci. Sport. 2019, 29, 1190–1196. [Google Scholar] [CrossRef] [Green Version]
- Bair, W.-N.; Petr, M.; Alfaras, I.; Mitchell, S.J.; Bernier, M.; Ferrucci, L.; Studenski, S.A.; De Cabo, R. Of Aging Mice and Men: Gait Speed Decline Is a Translatable Trait, with Species-Specific Underlying Properties. J. Gerontol.-Ser. A Biol. Sci. Med. Sci. 2019, 74, 1413–1416. [Google Scholar] [CrossRef] [Green Version]
- Celis-Morales, C.A.; Gray, S.; Petermann, F.; Iliodromiti, S.; Welsh, P.; Lyall, D.M.; Anderson, J.; Pellicori, P.; Mackay, D.F.; Pell, J.P.; et al. Walking Pace Is Associated with Lower Risk of All-Cause and Cause-Specific Mortality. Med. Sci. Sport. Exerc. 2019, 51, 472–480. [Google Scholar] [CrossRef] [Green Version]
- Stamatakis, E.; Kelly, P.; Strain, T.; Murtagh, E.M.; Ding, D.; Murphy, M.H. Self-rated walking pace and all-cause, cardiovascular disease and cancer mortality: Individual participant pooled analysis of 50 225 walkers from 11 population British cohorts. Br. J. Sport. Med. 2018, 52, 761–768. [Google Scholar] [CrossRef] [Green Version]
- Zaccardi, F.; Franks, P.W.; Dudbridge, F.; Davies, M.J.; Khunti, K.; Yates, T. Mortality risk comparing walking pace to handgrip strength and a healthy lifestyle: A UK Biobank study. Eur. J. Prev. Cardiol. 2021, 28, 704–712. [Google Scholar] [CrossRef] [PubMed]
- Fritz, S.; Lusardi, M. White Paper: Walking Speed: The Sixth Vital Sign. J. Geriatr. Phys. Ther. 2009, 32, 3–6. Available online: https://geriatrictoolkit.missouri.edu/gaitspeed/White_Paper___Walking_Speed__the_Sixth_Vital_Sign_.2.pdf (accessed on 26 December 2022). [CrossRef] [Green Version]
- Cigarroa, I.; Lasserre-Laso, N.; Zapata-Lamana, R.; Leiva-Ordóñez, A.M.; Troncoso-Pantoja, C.; Martínez-Sanguinetti, M.A.; Villagrán, M.; Nazar, G.; Díaz, X.; Petermann-Rocha, F.; et al. Asociación entre la velocidad de marcha y el riesgo de deterioro cognitivo en personas mayores que viven en la comunidad. Gerokomos 2020, 31, 204–210. [Google Scholar] [CrossRef]
- Grøntved, A.; Hu, F.B. Walking pace and handgrip strength: Simple measures of fitness and mortality risk? Eur. Heart J. 2017, 38, 3241–3243. [Google Scholar] [CrossRef] [Green Version]
- Yates, T.; Zaccardi, F.; Dhalwani, N.N.; Davies, M.J.; Bakrania, K.; Celis-Morales, C.A.; Gill, J.M.R.; Franks, P.W.; Khunti, K. Association of walking pace and handgrip strength with all-cause, cardiovascular, and cancer mortality: A UK Biobank observational study. Eur. Heart J. 2017, 38, 3232–3240. [Google Scholar] [CrossRef] [PubMed] [Green Version]
- Cigarroa, I.; Espinoza-Sanhueza, M.J.; Lasserre-Laso, N.; Diaz-Martinez, X.; Garrido-Mendez, A.; Matus-Castillo, C.; Martinez-Sanguinetti, M.A.; Leiva, A.M.; Petermann-Rocha, F.; Parra-Soto, S.; et al. Association between walking pace and diabetes: Findings from the chilean national health survey 2016–2017. Int. J. Environ. Res. Public Health 2020, 17, 5341. [Google Scholar] [CrossRef]
- Vásquez-Gómez, J.A.; Beltrán, A.R.; Cigarroa-Cuevas, I.; Lasserre-Laso, N.; Garrido-Méndez, A.; Matus-Castillo, C.; Álvarez, C.; Díaz-Martínez, X.; Salas-Bravo, C.; Martínez-Sanguinetti, M.A.; et al. Auto reporte de la velocidad de marcha y su asociación con marcadores de adiposidad y riesgo cardiovascular en Chile. Rev. Méd. Chile 2020, 148, 459–468. [Google Scholar] [CrossRef]
- Pontificia Universidad Católica, Facultad de Medicina. Encuestas y Estudios Longitudinales. Encuesta Nacional de Salud ENS 2016–2017 Chile; PUC: Santiago, Chile, 2016; Available online: https://arsmedica.cl/index.php/MED/article/view/1354 (accessed on 26 December 2022).
- International Diabetes Federation. IDF Diabetes Atlas, 8th ed.; IDF: Madrid, Spain, 2015; Available online: https://diabetesatlas.org/upload/resources/previous/files/8/IDF_DA_8e-EN-final.pdf (accessed on 26 December 2022).
- Hoos, T.; Espinoza, N.; Marshall, S.; Arredondo, E.M. Validity of the global physical activity questionnaire (GPAQ) in adult Latinas. J. Phys. Act. Health 2012, 9, 698–705. [Google Scholar] [CrossRef] [Green Version]
- Word Health Organization. Global Physical Activity Questionnaire: GPAQ Version 2.0; WHO: Geneva, Switzerland, 2009; Available online: https://www.who.int/ncds/surveillance/steps/resources/GPAQ_Analysis_Guide.pdf (accessed on 26 December 2022).
- Word Health Organization. Obesity: Preventing and Managing the Global Epidemic; WHO: Geneva, Switzerland, 2000; Available online: https://apps.who.int/iris/handle/10665/42330 (accessed on 26 December 2022).
- Kalyani, R.R.; Tra, Y.; Yeh, H.C.; Egan, J.M.; Ferrucci, L.; Brancati, F.L. Quadriceps strength, quadriceps power, and gait speed in older U.S. adults with diabetes mellitus: Results from the National Health and Nutrition Examination Survey, 1999–2002. J. Am. Geriatr. Soc. 2013, 61, 769–775. [Google Scholar] [CrossRef]
- Bemelmans, R.; Blommaert, P.; Wassink, A.; Coll, B.; Spiering, W.; Graaf, Y.; Visseren, F. The relationship between walking speed and changes in cardiovascular risk factors during a 12-day walking tour to Santiago de Compostela: A cohort study. BMJ Open 2012, 2, e000875. [Google Scholar] [CrossRef]
- Kositsawat, J.; Kuo, C.-L.; Barry, L.; Melzer, D.; Bandinelli, S.; Ferrucci, L.; Wu, R.; Kuchel, G. Interaction between vitamin D and interleukin 6 on slow gait speed: 6-year follow-up data of older adults from Inchianti. J. Gerontol. A Biol. Sci. Med. Sci. 2019, 75, 1161–1166. [Google Scholar] [CrossRef] [PubMed]
- Mahinrad, S.; Kurian, S.; Garner, C.R.; Sedaghat, S.; Nemeth, A.J.; Moscufo, N.; Higgins, J.P.; Jacobs, D.R., Jr.; Hausdorff, J.M.; Lloyd-Jones, D.M.; et al. Cumulative Blood Pressure Exposure during Young Adulthood and Mobility and Cognitive Function in Midlife. Circulation 2020, 141, 712–724. [Google Scholar] [CrossRef] [PubMed]
- Fonseca Alves, D.J.; Bartholomeu-Neto, J.; Júnior, E.R.; Ribeiro Zarricueta, B.S.; Nóbrega, O.T.; Córdova, C.M. Walking speed, risk factors, and cardiovascular events in older adults-systematic review. J. Strength Cond. Res. 2017, 31, 3235–3244. [Google Scholar] [CrossRef]
- Boonpor, J.; Parra-Soto, S.; Petermann-Rocha, F.; Ho, F.K.; Celis-Morales, C.; Gray, S.R. Combined association of walking pace and grip strength with incident type 2 diabetes. Scand. J. Med. Sci. Sport. 2022, 32, 1356–1365. [Google Scholar] [CrossRef]
- Boonpor, J.; Ho, F.K.; Gray, S.R.; Celis-Morales, C.A. Association of Self-reported Walking Pace with Type 2 Diabetes Incidence in the UK Biobank Prospective Cohort Study. Mayo Clin. Proc. 2022, 97, 1631–1640. [Google Scholar] [CrossRef]
- Shih, Y.L.; Shih, C.C.; Chen, J.Y. The association between walking speed and risk of cardiovascular disease in middle-aged and elderly people in Taiwan, a community-based, cross-sectional study. PLoS ONE 2020, 15, e0235277. [Google Scholar] [CrossRef] [PubMed]
- Argyridou, S.; Zaccardi, F.; Davies, M.; Khunti, K.; Yates, T. Walking pace improves all-cause and cardiovascular mortality risk prediction: A UK Biobank prognostic study. Eur. J. Prev. Cardiol. 2020, 27, 1036–1044. [Google Scholar] [CrossRef]
- Celis-Morales, C.; Salas-Bravo, C.; Yáñez, A.; Castillo, M. Inactividad física y sedentarismo. La otra cara de los efectos secundarios de la Pandemia de COVID-19. Rev. Méd. Chile 2020, 148, 881–886. [Google Scholar] [CrossRef]
- Yates, T.; Razieh, C.; Zaccardi, F.; Rowlands, A.V.; Seidu, S.; Davies, M.; Khunti, K. Obesity, walking pace and risk of severe COVID-19 and mortality: Analysis of UK Biobank. Int. J. Obes. 2021, 45, 1155–1159. [Google Scholar] [CrossRef]
- Ganna, A.; Ingelsson, E. 5-year mortality predictors in 498,103 UK Biobank participants: A prospective population-based study. Lancet 2015, 386, 533–540. [Google Scholar] [CrossRef]
- Quan, M.; Xun, P.; Chen, C.; Wen, J.; Wang, Y.; Wang, R.; Chen, P.; He, K. Walking pace and the risk of cognitive decline and dementia in elderly populations: A meta-analysis of prospective cohort studies. J. Gerontol. A Biol. Sci. Med. Sci. 2017, 72, 266–270. [Google Scholar] [CrossRef] [PubMed] [Green Version]
- Al Hazzouri, A.Z.; Mayeda, E.R.; Elfassy, T.; Lee, A.; Odden, M.C.; Thekkethala, D.; Wright, C.B.; Glymour, M.M.; Haan, M.N. Perceived Walking Speed, Measured Tandem Walk, Incident Stroke, and Mortality in Older Latino Adults: A Prospective Cohort Study. J. Gerontol. A Biol. Sci. Med. Sci. 2017, 72, 676–682. [Google Scholar] [CrossRef] [PubMed] [Green Version]
- Qiu, S.; Cai, X.; Schumann, U.; Velders, M.; Sun, Z.; Steinacker, J.M. Impact of walking on glycemic control and other cardiovascular risk factors in type 2 diabetes: A meta-analysis. PLoS ONE 2014, 9, e109767. [Google Scholar] [CrossRef] [PubMed] [Green Version]
- Tudor-Locke, C.E.; Myers, A.M.; Bell, R.C.; Harris, S.B.; Wilson, R.N. Preliminary outcome evaluation of the First Step Program: A daily physical activity intervention for individuals with type 2 diabetes. Patient Educ. Couns. 2002, 47, 23–28. [Google Scholar] [CrossRef] [PubMed]

| Variables | Walking Pace | ||
|---|---|---|---|
| Slow Pace | Average Pace | Brisk Pace | |
| n (%) | 17.9 (16.3; 19.6) | 54.7 (52.3; 57.0) | 27.4 (25.3; 29.7) |
| Estimation sample ** | 2.585.018 | 7.903.904 | 3.965.239 |
| Sociodemographic | |||
| Age (years) * | 55.7 (53.6; 57.8) | 40.1 (40.0; 42.0) | 39.1 (37.7; 40.5) |
| Sex (%) | |||
| Women | 60.8 (55.7; 65.7) | 47.4 (44.2; 50.5) | 51.1 (46.3; 55.9) |
| Men | 39.2 (34.3.3; 44.3) | 52.6 (49.5; 55.8) | 48.1 (44.1; 53.7) |
| Place of residence (%) | |||
| Urban | 84.7 (81.6; 87.3) | 88.7 (87.1; 90.2) | 92.5 (90.5; 94.1) |
| Rural | 15.3 (12.6; 18.3) | 11.2 (9.8; 12.8) | 7.4 (5.8; 9.5) |
| Education level (%) | |||
| ≤8 years | 36.8 (32.4; 41.4) | 13.0 (11.1; 15.0) | 9.6 (7.3; 12.6) |
| 9–12 years | 48.0 (43.0; 53.1) | 59.1 (55.8; 62.2) | 55.1 (50.3; 59.9) |
| >12 years | 15.2 (11.6; 19.6) | 28.0 (25.0; 31.1) | 35.2 (30.7; 40.1) |
| Lifestyle | |||
| Smoking (%) | |||
| Regular smoker | 18.7 (14.9; 23.2) | 26.3 (23.5; 29.4) | 24.1 (20.2; 28.5) |
| Occasional smoker | 6.4 (4.1; 9.7) | 9.3 (7.5; 11.5) | 7.8 (5.6; 10.7) |
| Ex-smoker | 27.3 (23.4; 31.6) | 24.7 (21.9; 27.6) | 26.5 (22.4; 31.0) |
| Non-smoking | 47.6 (42.5; 52.6) | 39.7 (36.7; 42.7) | 41.6 (37.0; 46.3) |
| Alcohol use (%) | |||
| High consumption (test AUDIT) | 4.3 (1.8; 10.2) | 5.0 (4.0; 7.3) | 6.1 (3.7; 9.8) |
| F and V intake (%) | |||
| Eats less than 5 F and V | 87.7 (84.2; 90.5) | 86.2 (83.6; 88.5) | 81.5 (77.4; 85.0) |
| Salt intake (g/day) * | 9.5 (9.2; 9.8) | 9.1 (8.9; 9.2) | 8.9 (8.6; 9.2) |
| Hours of sleep (%) | |||
| ≤6 h | 28.9 (24.4; 33.8) | 20.2 (17.7; 23.0) | 24.1 (20.2; 28.4) |
| 7–8 h | 45.2 (40.4; 50.3) | 54.2 (50.6; 57.3) | 52.5 (47.8; 57.3) |
| ≥9 h | 25.9 (21.6; 30.6) | 25.6 (23.0; 28.5) | 23.4 (19.7; 27.6) |
| Adiposity | |||
| Body weight (kg) * | 76.3 (74.6; 78.1) | 75.7 (74.7; 76.7) | 74.7 (73.3; 76.2) |
| BMI (kg/m2) * | 30.2 (29.6; 30.9) | 28.4 (28.1; 28.7) | 27.7 (27.3; 28.1) |
| Nutritional status (%) | |||
| Underweight | 1.1 (0.0; 2.6) | 1.5 (0.1; 2.6) | 0.1 (0.0; 0.2) |
| Normal | 21.8 (17.8; 26.4) | 24.2 (21.6; 27.0) | 27.0 (23.0; 31.4) |
| Overweight | 29.9 (25.6; 34.6) | 41.7 (38.6; 44.9) | 42.4 (37.7; 47.3) |
| Obese | 47.2 (42.1; 52.3) | 32.6 (29.7; 35.6) | 29.8 (25.6; 34.3) |
| Waist circumference (cm) * | 98.3 (96.9; 99.8) | 92.6 (91.7; 93.5) | 91.3 (90.1; 92.4) |
| Central obesity (cm) (%) | |||
| >102 cm men, >88 cm women | 59.0 (53.9; 63.9) | 41.3 (38.3; 44.4) | 39.2 (34.6; 43.9) |
| Physical activity * | |||
| Total PA (MET/min/day) | 771.1 (633; 909) | 1200 (1100; 1301) | 1412 (1232; 1591) |
| Transport PA (min/day) | 46.6 (32.9; 60.4) | 72.5 (64.2; 80.7) | 78.5 (65.8; 91.1) |
| Moderate PA (min/day) | 63.5 (49.9; 77.1) | 93.3 (82.2; 104.9) | 122.8 (102.8; 1428) |
| Vigorous PA (min/day) | 41.3 (27.0; 55.6) | 67.2 (57.9; 76.8) | 75.8 (60.3; 91.4) |
| Sedentary time (min/day) | 214 (196; 231) | 199 (188; 210) | 208 (190; 226) |
| Physical inactivity (%) | 38.8 (34.1; 43.6) | 23.9 (21.3; 26.7) | 18.9 (15.5; 22.8) |
| Variables | Slow Pace Mean (95% CI) | Average Pace Mean (95% CI) | Brisk Pace Mean (95% CI) | Delta (95% CI); p-Value |
|---|---|---|---|---|
| Glycaemia (mg/dL) | ||||
| Model 0 | 102.95 (99.86; 106.04) | 95.21 (93.93; 96.49) | 91.90 (90.73; 93.06) | −5.24 (−6.73; −3.74); p < 0.0001 |
| Model 1 | 98.38 (95.54; 101.21) | 95.82 (94.58; 97.07) | 93.53 (92.36; 94.70) | −2.40 (−7.77; −1.04); p = 0.001 |
| Model 2 | 97.61 (94.78; 100.44) | 95.85 (94.62; 97.08) | 93.96 (92.80; 95.12) | −1.83 (−3.21; −0.46); p = 0.009 |
| Model 3 | 97.8 (94.42; 99.95) | 95.87 (94.63; 97.12) | 94.18 (93.00; 95.35) | −1.53 (−2.85; −0.22); p = 0.022 |
| Glycosylated haemoglobin (HbA1c) | ||||
| Model 0 | 6.47 (6.28; 6.66) | 6.13 (6.00; 6.27) | 5.76 (5.64; 5.87) | −0.36 (−0.47; −0.25); p < 0.0001 |
| Model 1 | 6.27 (6.09; 6.44) | 6.19 (6.06; 6.31) | 5.87 (5.74; 6.01) | −0.20 (−0.31; −0.08); p = 0.001 |
| Model 2 | 6.26 (6.08; 6.45) | 6.19 (6.06; 6.31) | 5.88 (5.74; 6.01) | −0.20 (−0.31; −0.08); p = 0.001 |
| Model 3 | 6.25 (6.06; 6.43) | 6.20 (6.07; 6.32) | 5.88 (5.75; 6.01) | −0.19 (−.030; −0.68); p = 0.002 |
| Gamma glutamyl transferase (GGT) (U/L) | ||||
| Model 0 | 38.58 (33.45; 43.72) | 29.89 (27.42; 32.36) | 28.47 (23.96; 32.98) | −4.50 (−7.91; −1.10); p = 0.009 |
| Model 1 | 34.27 (29.14; 39.40) | 30.20 (27.70; 32.69) | 29.78 (25.04; 34.52) | −1.89 (−5.64; 1.86); p = 0.325 |
| Model 2 | 33.42 (28.15; 38.68) | 30.24 (27.78; 32.71) | 30.35 (25.59; 35.11) | −1.20 (−5.04; 2.63); p = 0.539 |
| Model 3 | 33.78 (28.64; 38.92) | 30.29 (27.83; 32.75) | 30.07 (25.46; 34.68) | −1.51 (−5.19; 2.17); p = 0.420 |
| Vitamin D2 (ng/mL) | ||||
| Model 0 | 0.10 (0.04; 0.15) | 0.06 (0.01; 0.10) | 0.04 (0.01; 0.07) | −0.03 (−0.06; 0.01); p = 0.103 |
| Model 1 | 0.08 (0.03; 0.14) | 0.06 (0.02; 0.11) | 0.04 (0.01; 0.08) | −0.02 (−0.05; 0.01); p = 0.229 |
| Model 2 | 0.09 (0.03; 0.15) | 0.06 (0.02; 0.10) | 0.04 (0.00; 0.08) | −0.03 (−0.06; 0.01); p = 0.166 |
| Model 3 | 0.10 (0.03; 0.16) | 0.06 (0.02; 0.10) | 0.04 (0.00; 0.07) | −0.03 (−0.07; 0.01); p = 0.149 |
| Vitamin D3 (ng/mL) | ||||
| Model 0 | 18.40 (17.43; 19.38) | 20.16 (19.42; 20.90) | 20.40 (19.11; 21.70) | 0.99 (0.17; 1.81); p = 0.018 |
| Model 1 | 18.36 (17.28; 19.44) | 20.4 (19.31; 20.77) | 20.62 (19.37; 21.88) | 1.09 (0.25; 1.93); p = 0.011 |
| Model 2 | 18.44 (17.34; 19.53) | 20.03 (19.30; 20.76) | 20.60 (19.36; 21.85) | 1.05 (0.21; 1.88); p = 0.015 |
| Model 3 | 18.74 (17.59; 19.90) | 19.97 (19.25; 20.69) | 20.44 (19.23; 21.64) | 0.82 (−0.01; 1.64); p = 0.053 |
| Vitamin D2 + D3 (ng/mL) | ||||
| Model 0 | 18.50 (17.52; 19.48) | 20.22 (19.48; 20.96) | 20.45 (19.15; 21.75) | 0.96 (0.14; 1.78); p = 0.021 |
| Model 1 | 18.45 (17.37; 19.53) | 20.10 (19.37; 20.83) | 20.67 (19.41; 21.92) | 1.07 (0.23; 1.91); p = 0.012 |
| Model 2 | 18.53 (17.43; 19.62) | 20.09 (19.36; 20.82) | 20.64 (19.39; 21.89) | 1.02 (0.18; 1.86); p = 0.017 |
| Model 3 | 18.84 (17.69; 20.00) | 20.03 (19.31; 20.75) | 20.48 (19.27; 21.68) | 0.79 (−0.04; 1.61); p = 0.062 |
| Systolic blood pressure (mm/Hg) | ||||
| Model 0 | 133.03 (130.67; 135.40) | 122.53 (121.38; 123.68) | 120.26 (118.92; 121.60) | −5.90 (−7.19; −4.62); p < 0.0001 |
| Model 1 | 126.96 (124.91; 129.01) | 123.30 (122.33; 124.27) | 122.56 (121.35; 123.77) | −1.97 (−3.12; −0.83); p = 0.001 |
| Model 2 | 126.22 (124.22; 128.21) | 123.29 (122.34; 124.23) | 122.90 (121.72; 124.08) | −1.45 (−2.56; −0.35); p = 0.010 |
| Model 3 | 126.28 (124.26; 128.30) | 123.25 (122.32; 124.19) | 122.92 (121.74; 124.12) | −1.45 (−2.56; −0.33); p = 0.011 |
| Diastolic blood pressure (mm/Hg) | ||||
| Model 0 | 75.44 (74.35; 76.53) | 74.17 (73.51; 74.84) | 73.34 (72.42; 74.25) | −1.03 (−1.73; −0.32); p = 0.004 |
| Model 1 | 74.01 (72.82; 75.17) | 74.35 (73.75; 74.95) | 73.94 (73.06; 74.81) | −0.10 (−0.81; 0.62); p = 0.792 |
| Model 2 | 73.26 (72.21; 74.32) | 74.37 (73.81; 74.93) | 74.31 (73.48; 75.14) | 0.43 (−0.24; 1.10); p = 0.206 |
| Model 3 | 73.43 (72.36; 74.50) | 74.33 (73.77; 74.88) | 74.29 (73.47; 75–11) | 0.35 (−0.32; 1.02); p = 0.303 |
| Variables | Slow Pace Mean (95% IC) | Average Pace Mean (95% IC) | Brisk Pace Mean (95% IC) | Delta (95% CI); p-Value |
|---|---|---|---|---|
| Total Cholesterol (mg/dL) | ||||
| Model 0 | 179.94 (175.00; 184.89) | 176.66 (173.66; 179.66) | 175.85 (171.98; 179.73) | −1.86 (−4.95; 1.23); p = 0.239 |
| Model 1 | 173.20 (167.97; 178.43) | 177.69 (174.79; 180.58) | 177.63 (173.79; 181.47) | 1.77 (−1.39; 4.93); p = 0.272 |
| Model 2 | 172.30 (167.01; 177.60) | 177.73 (174.86; 180.59) | 178.15 (174.32; 181.97) | 2.42 (−0.76; 5.60); p = 0.136 |
| Model 3 | 172.83 (167.64; 178.02) | 177.68 (174.81; 180.54) | 177.99 (174.21; 181.77) | 2.11 (−1.03; 5.25); p = 0.188 |
| HDL Cholesterol (mg/dL) | ||||
| Model 0 | 47.30 (45.55; 49.04) | 46.27 (45.27; 47.27) | 47.52 (45.98; 49.06) | 0.28 (−0.88; 1.45); p = 0.633 |
| Model 1 | 46.34 (44.43; 48.25) | 46.59 (45.64; 47.53) | 47.44 (46.05; 48.83) | 0.61 (−0.54; 1.76); p = 0.297 |
| Model 2 | 47.35 (45.55; 49.15) | 46.55 (45.65; 47.45) | 46.92 (45.60; 48.24) | −0.09 (−1.19; 1.00); p = 0.866 |
| Model 3 | 47.49 (45.70; 49.28) | 46.61 (45.71; 47.50) | 46.73 (45.44; 48.02) | −0.27 (−1.36; 0.82); p = 0.624 |
| LDL Cholesterol (mg/dL) | ||||
| Model 0 | 102.64 (98.46; 106.81) | 101.74 (98.95; 104.53) | 101.21 (98.10; 104.32) | −0.69 (−3.24; 1.87); p = 0.599 |
| Model 1 | 98.18 (93.77; 102.59) | 102.43 (99.76; 105.10) | 102.46 (99.36; 105.55) | 1.73 (−0.87; 4.33); p = 0.193 |
| Model 2 | 97.20 (92.75; 101.65) | 102.46 (99.81; 105.11) | 102.97 (99.87; 106.06) | 2.42 (−0.20; 5.03); p = 0.070 |
| Model 3 | 97.42 (92.95; 101.89) | 102.42 (99.76; 105.07) | 102.97 (99.84; 106.09) | 2.31 (−0.36; 4.99); p = 0.090 |
| VLDL Cholesterol (mg/dL) | ||||
| Model 0 | 29.67 (27.04; 32.31) | 28.20 (26.77; 29.63) | 26.16 (24.64; 27.68) | −1.80 (−3.24;−0.36); p = 0.014 |
| Model 1 | 28.46 (25.53; 31.40) | 28.23 (26.87; 29.58) | 26.70 (25.20; 28.19) | −1.01 (−2.56; 0.55); p = 0.205 |
| Model 2 | 27.63 (24.79; 30.46) | 28.26 (26.93; 29.58) | 27.20 (25.74; 28.66) | −0.38 (−1.88; 1.11); p = 0.617 |
| Model 3 | 27.62 (24.82; 30.41) | 28.21 (26.92; 29.52) | 27.31 (25.84; 28.77) | −0.31 (−1.79; 1.17); p = 0.682 |
| No HDL Cholesterol (mg/dL) | ||||
| Model 0 | 132.65 (127.73; 137.58) | 130.35 (127.20; 133.51) | 128.32 (124.37; 132.27) | −2.15 (−5.28; 0.98); p = 0.178 |
| Model 1 | 126.88 (121.59; 132.16) | 131.05 (128.06; 134.05) | 130.18 (126.30; 134.06) | 1.16 (−2.02; 4.34); p = 0.475 |
| Model 2 | 124.96 (119.76; 130.16) | 131.13 (128.22; 134.04) | 131.21 (127.42; 135.00) | 2.51 (−0.63; 5.65); p = 0.117 |
| Model 3 | 125.34 (120.24; 130.45) | 131.04 (128.14; 133.93) | 131.24 (127.45; 135.02) | 2.37 (−0.76; 5.50); p = 0.138 |
| Triglycerides (mg/dL) | ||||
| Model 0 | 149.63 (136.10; 163.17) | 144.37 (135.59; 152.15) | 135.83 (125.27; 146.39) | −7.15 (−15.60; 1.30); p = 0.097 |
| Model 1 | 143.41 (128.23; 158.58) | 144.47 (137.06; 151.88) | 138.71 (127.91; 149.51) | −3.01 (−12.35; 6.32); p = 0.527 |
| Model 2 | 138.54 (123.91; 153.17) | 144.68 (137.45; 151.92) | 141.48 (130.90; 152.06) | 0.53 (−8.64; 9.69); p = 0.910 |
| Model 3 | 139.03 (124.59; 153.46) | 144.48 (137.32; 151.45) | 141.89 (131.48; 152.31) | 0.61 (−8.29; 9.52); p = 0.893 |
Disclaimer/Publisher’s Note: The statements, opinions and data contained in all publications are solely those of the individual author(s) and contributor(s) and not of MDPI and/or the editor(s). MDPI and/or the editor(s) disclaim responsibility for any injury to people or property resulting from any ideas, methods, instructions or products referred to in the content. |
© 2023 by the authors. Licensee MDPI, Basel, Switzerland. This article is an open access article distributed under the terms and conditions of the Creative Commons Attribution (CC BY) license (https://creativecommons.org/licenses/by/4.0/).
Share and Cite
Cigarroa, I.; Bravo-Leal, M.; Petermann-Rocha, F.; Parra-Soto, S.; Concha-Cisternas, Y.; Matus-Castillo, C.; Vásquez-Gómez, J.; Zapata-Lamana, R.; Parra-Rizo, M.A.; Álvarez, C.; et al. Brisk Walking Pace Is Associated with Better Cardiometabolic Health in Adults: Findings from the Chilean National Health Survey 2016–2017. Int. J. Environ. Res. Public Health 2023, 20, 5490. https://doi.org/10.3390/ijerph20085490
Cigarroa I, Bravo-Leal M, Petermann-Rocha F, Parra-Soto S, Concha-Cisternas Y, Matus-Castillo C, Vásquez-Gómez J, Zapata-Lamana R, Parra-Rizo MA, Álvarez C, et al. Brisk Walking Pace Is Associated with Better Cardiometabolic Health in Adults: Findings from the Chilean National Health Survey 2016–2017. International Journal of Environmental Research and Public Health. 2023; 20(8):5490. https://doi.org/10.3390/ijerph20085490
Chicago/Turabian StyleCigarroa, Igor, Michelle Bravo-Leal, Fanny Petermann-Rocha, Solange Parra-Soto, Yeny Concha-Cisternas, Carlos Matus-Castillo, Jaime Vásquez-Gómez, Rafael Zapata-Lamana, María Antonia Parra-Rizo, Cristian Álvarez, and et al. 2023. "Brisk Walking Pace Is Associated with Better Cardiometabolic Health in Adults: Findings from the Chilean National Health Survey 2016–2017" International Journal of Environmental Research and Public Health 20, no. 8: 5490. https://doi.org/10.3390/ijerph20085490
APA StyleCigarroa, I., Bravo-Leal, M., Petermann-Rocha, F., Parra-Soto, S., Concha-Cisternas, Y., Matus-Castillo, C., Vásquez-Gómez, J., Zapata-Lamana, R., Parra-Rizo, M. A., Álvarez, C., & Celis-Morales, C. (2023). Brisk Walking Pace Is Associated with Better Cardiometabolic Health in Adults: Findings from the Chilean National Health Survey 2016–2017. International Journal of Environmental Research and Public Health, 20(8), 5490. https://doi.org/10.3390/ijerph20085490