
Assessment of Human Health Risk Indices Due to Metal Contamination in the Surface Water of the Negro River Sub-Basin, Áncash

 ,
,  ,
,
Abstract
:1. Introduction
2. Materials and Methods
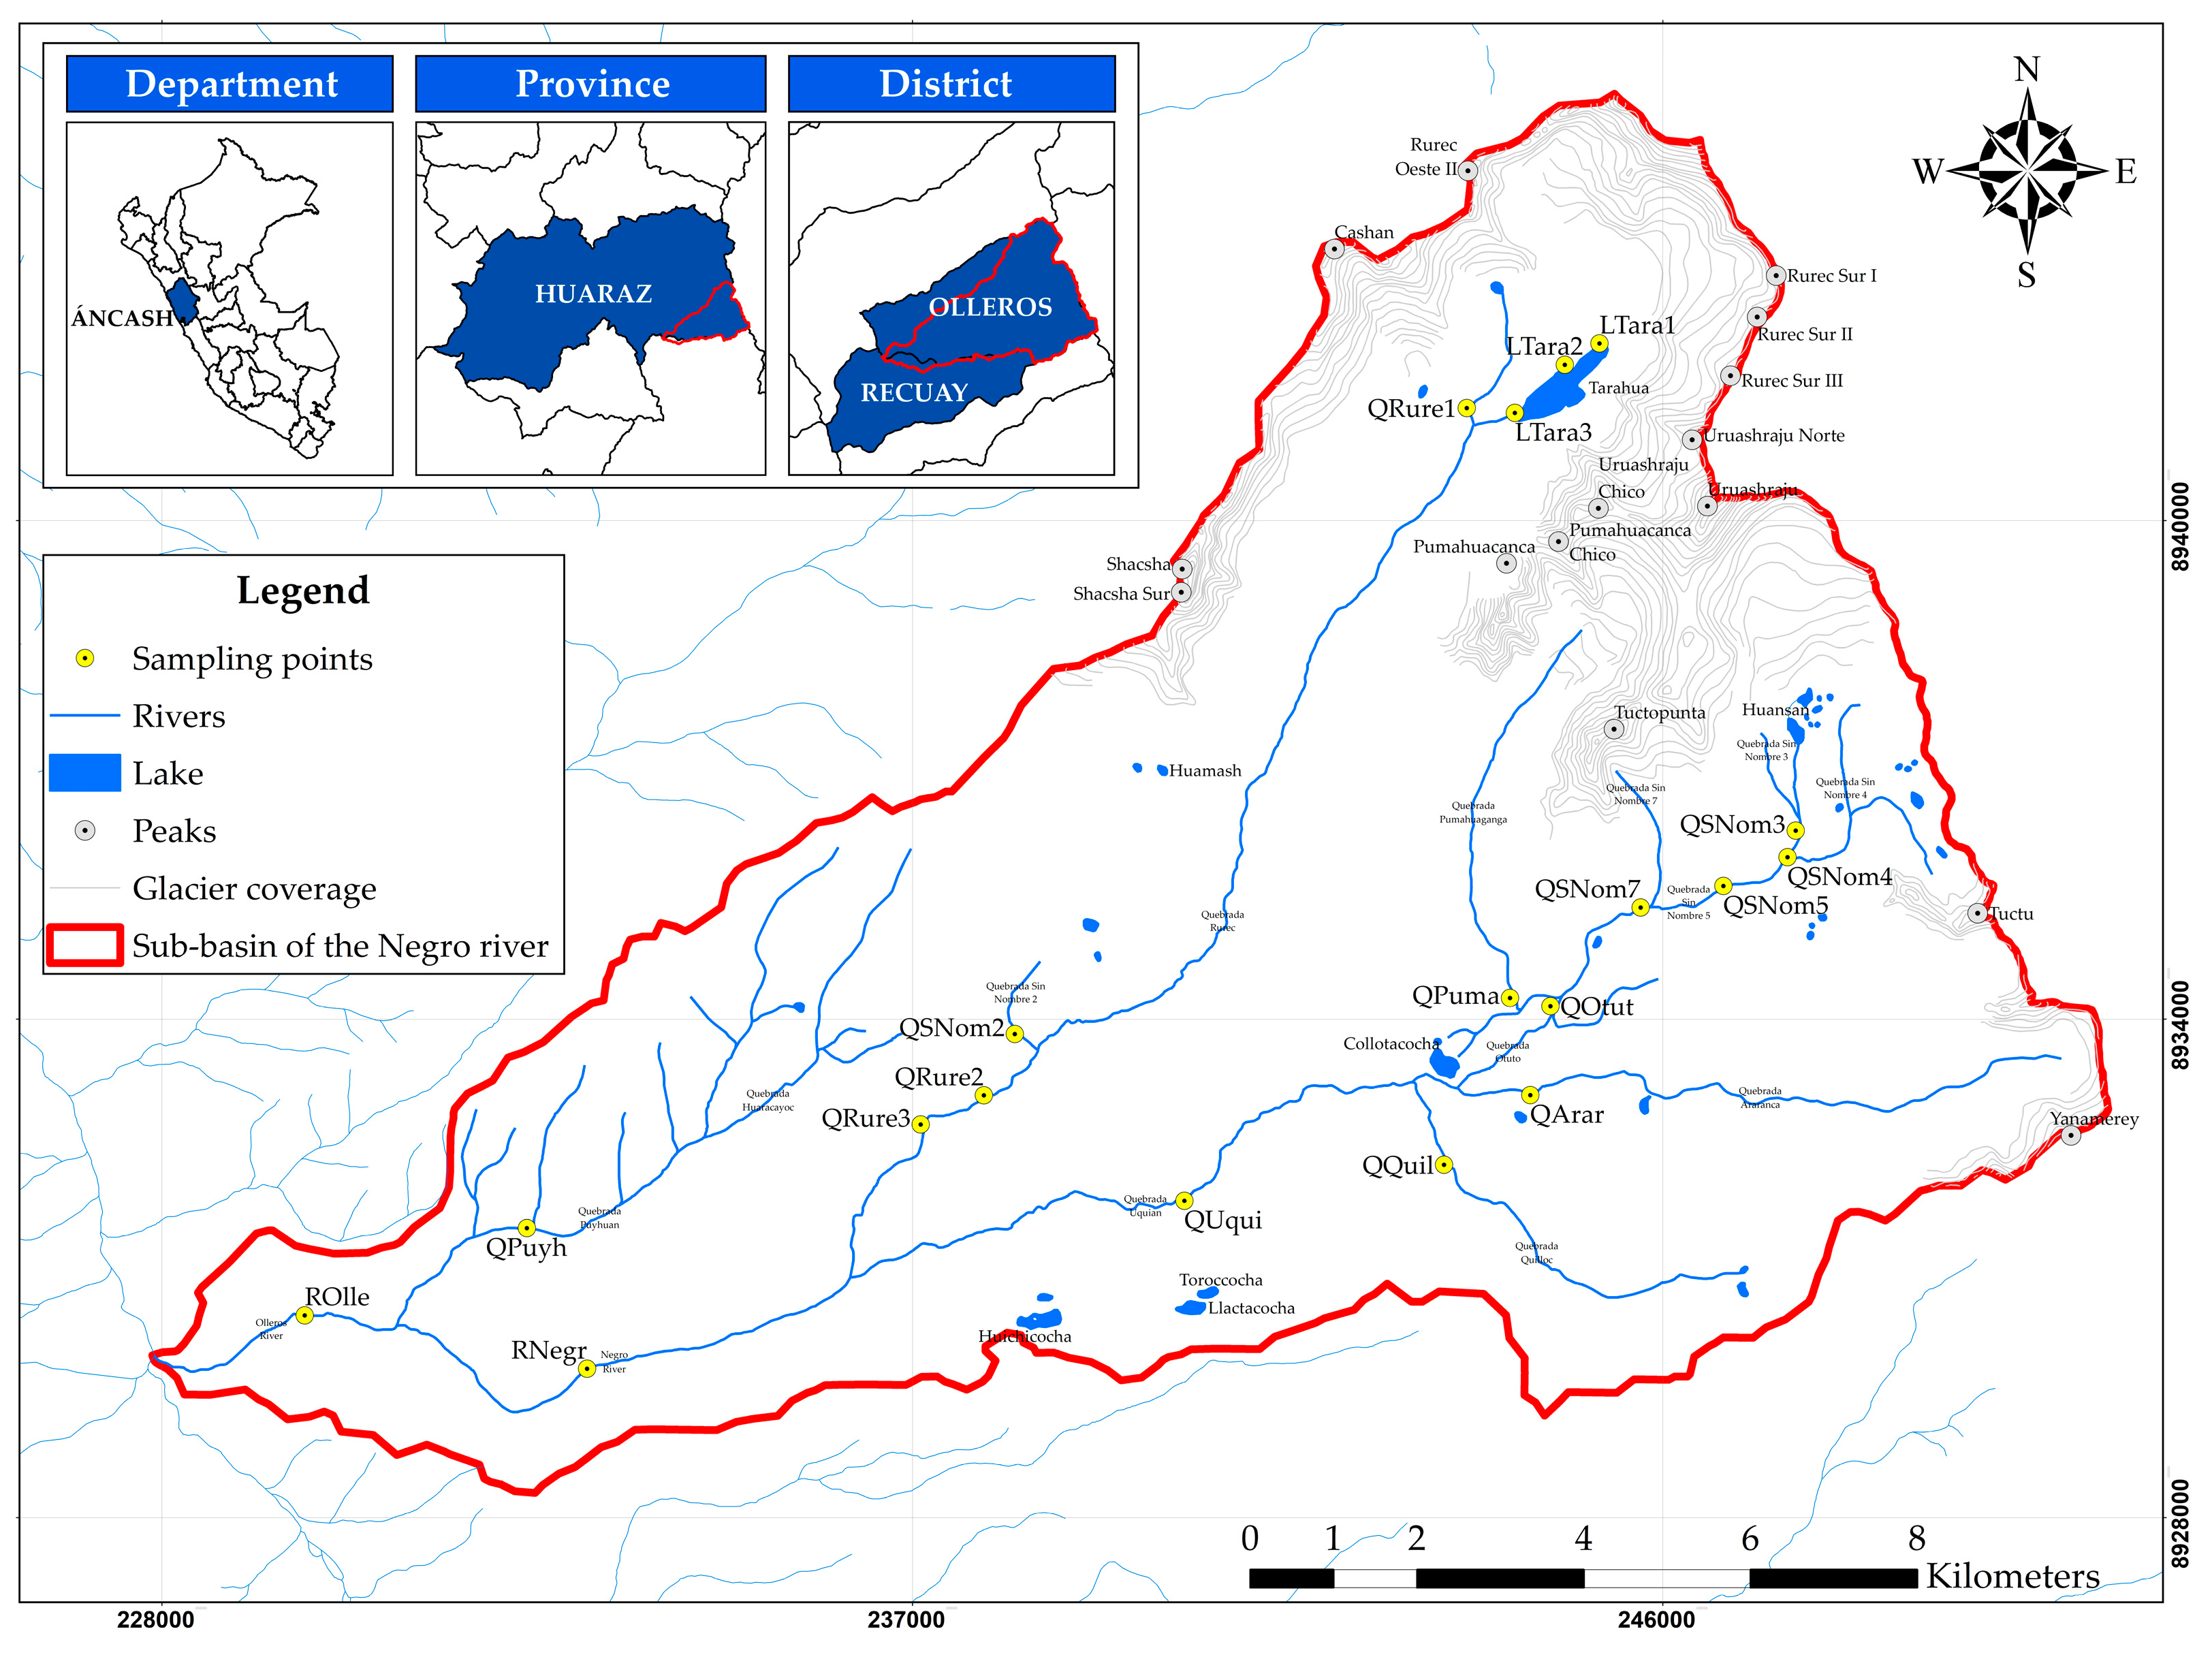
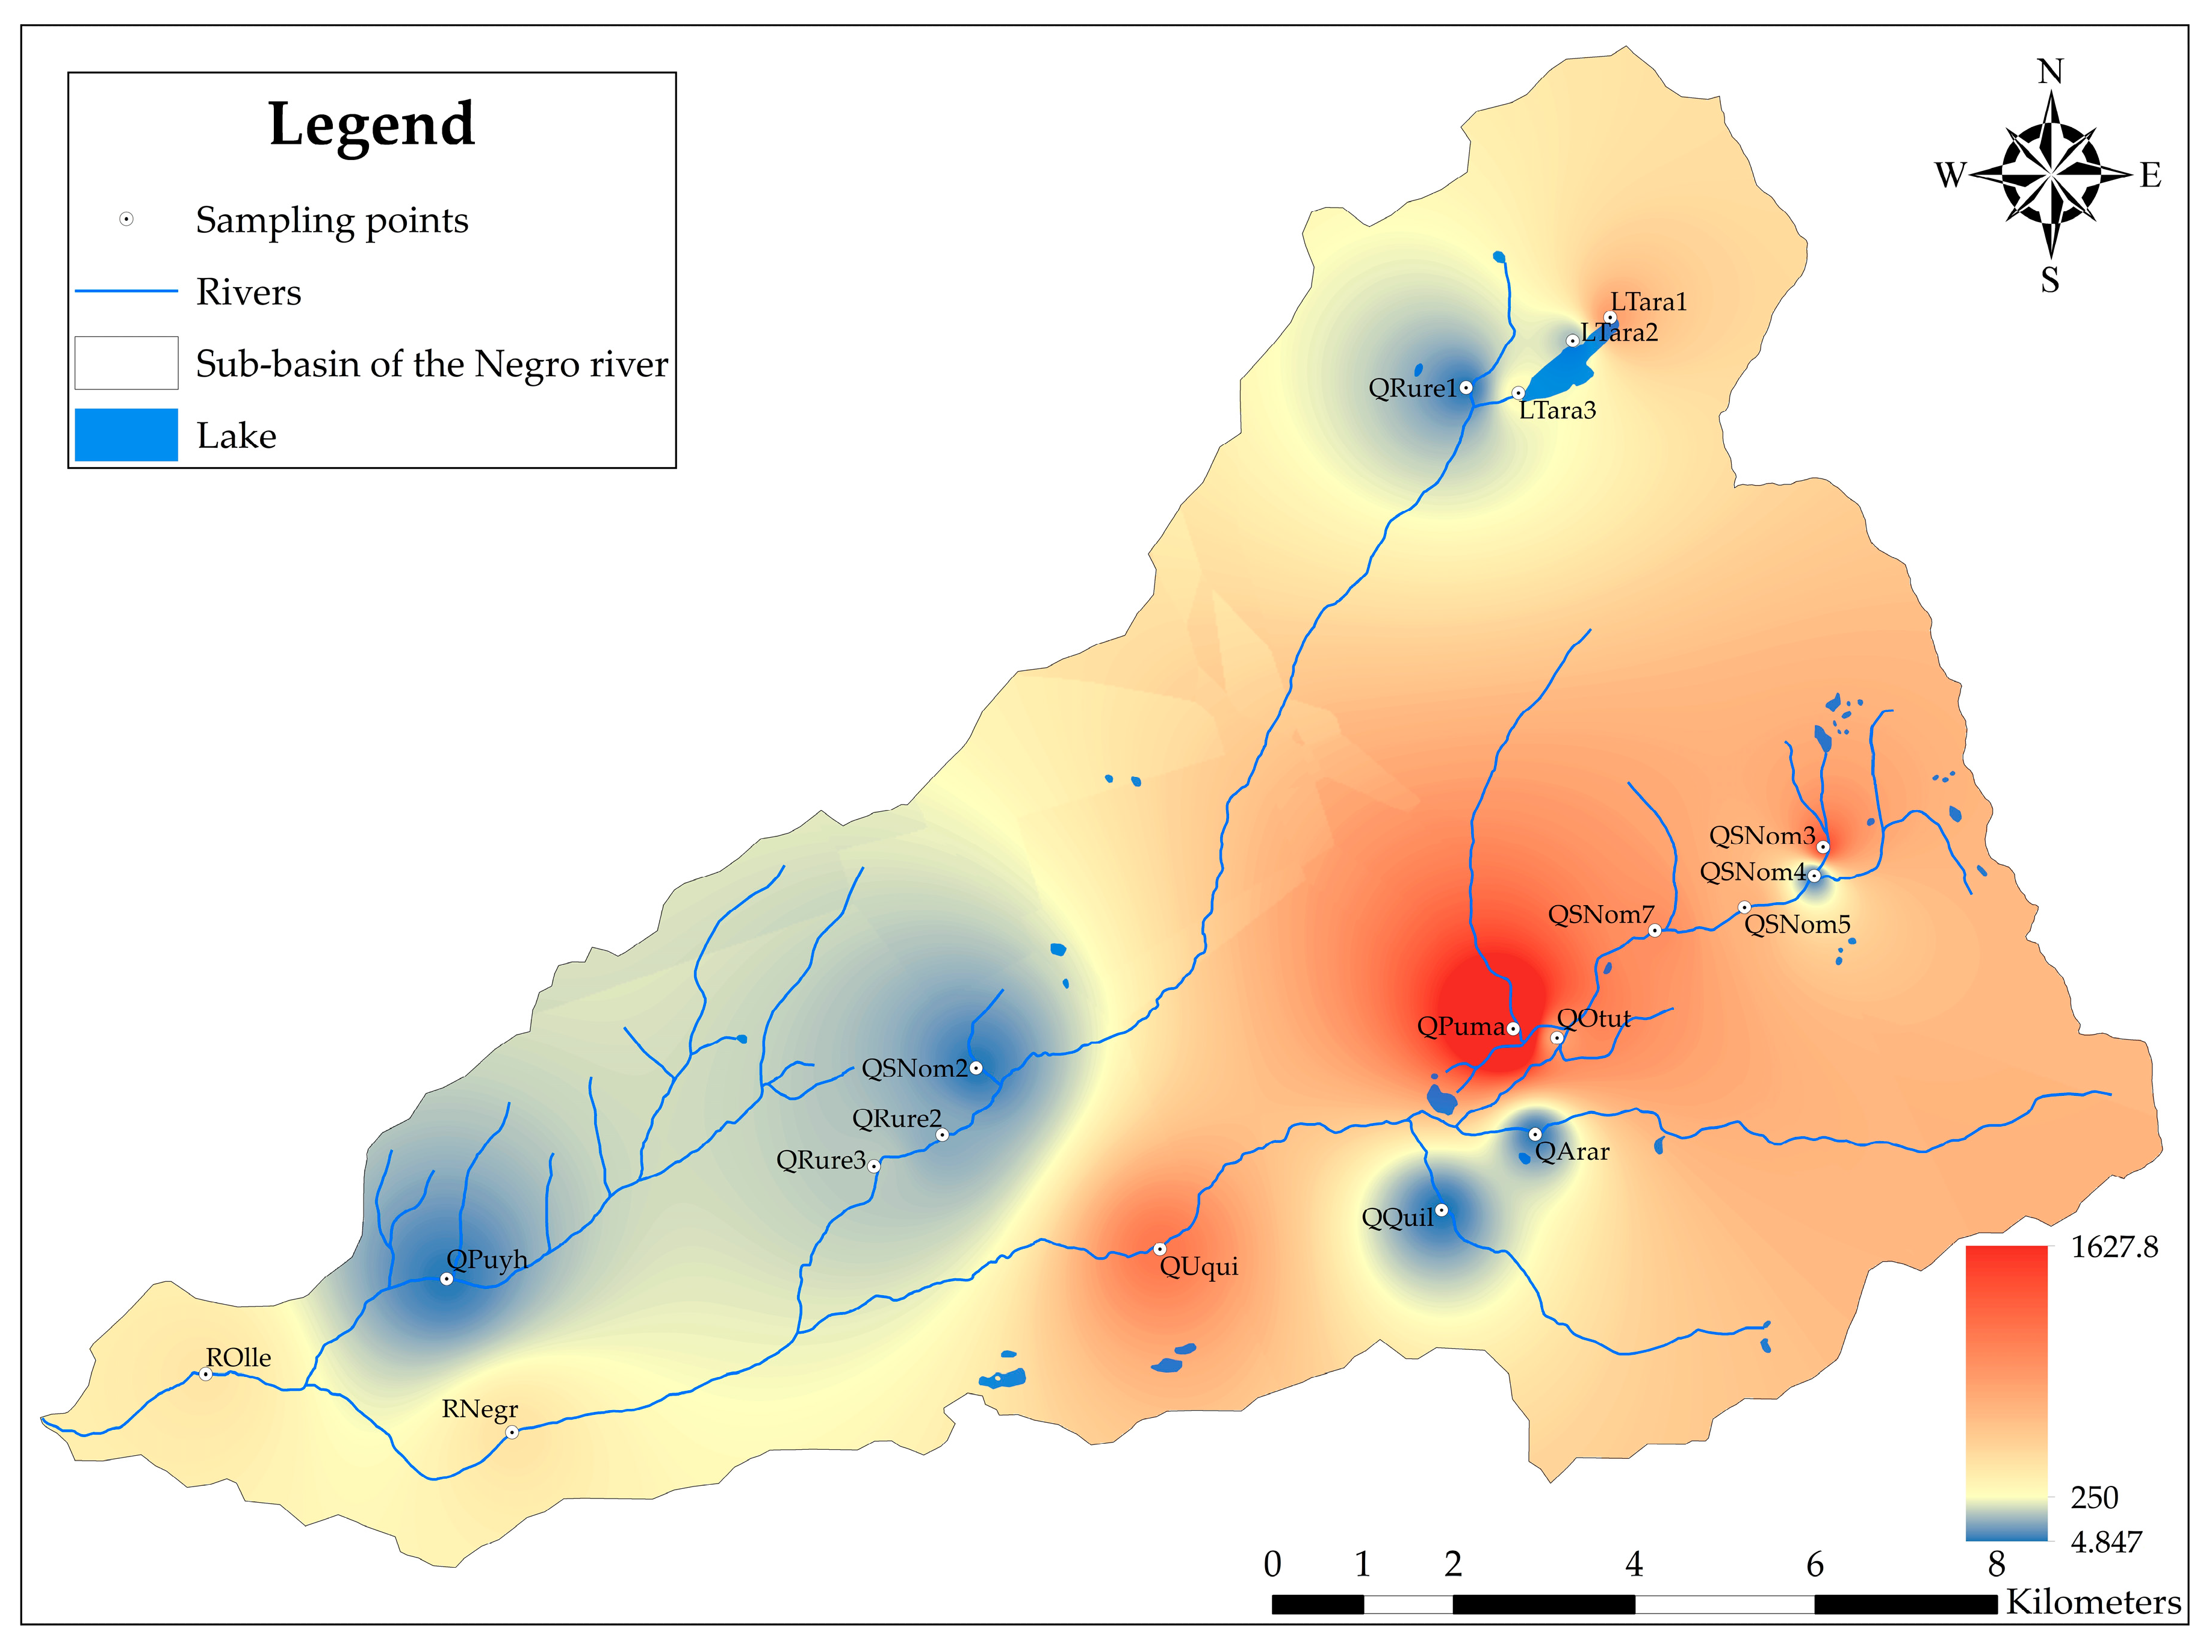
2.1. Study Area
2.2. Metal Analysis
2.2.1. Sample Collection and Processing
2.2.2. Quality Assurance and Quality Control (QA/QC)
2.3. Evaluation of Pollution and Human Health
2.3.1. Environmental Quality Assessment
2.3.2. Heavy Metal Pollution Index
2.3.3. Human Health Risk Assessment
2.4. Statistical Analysis
3. Results
3.1. Metal Concentration and Environmental Assessment
3.2. Evaluation of the Heavy Metal Pollution Index (HPI)
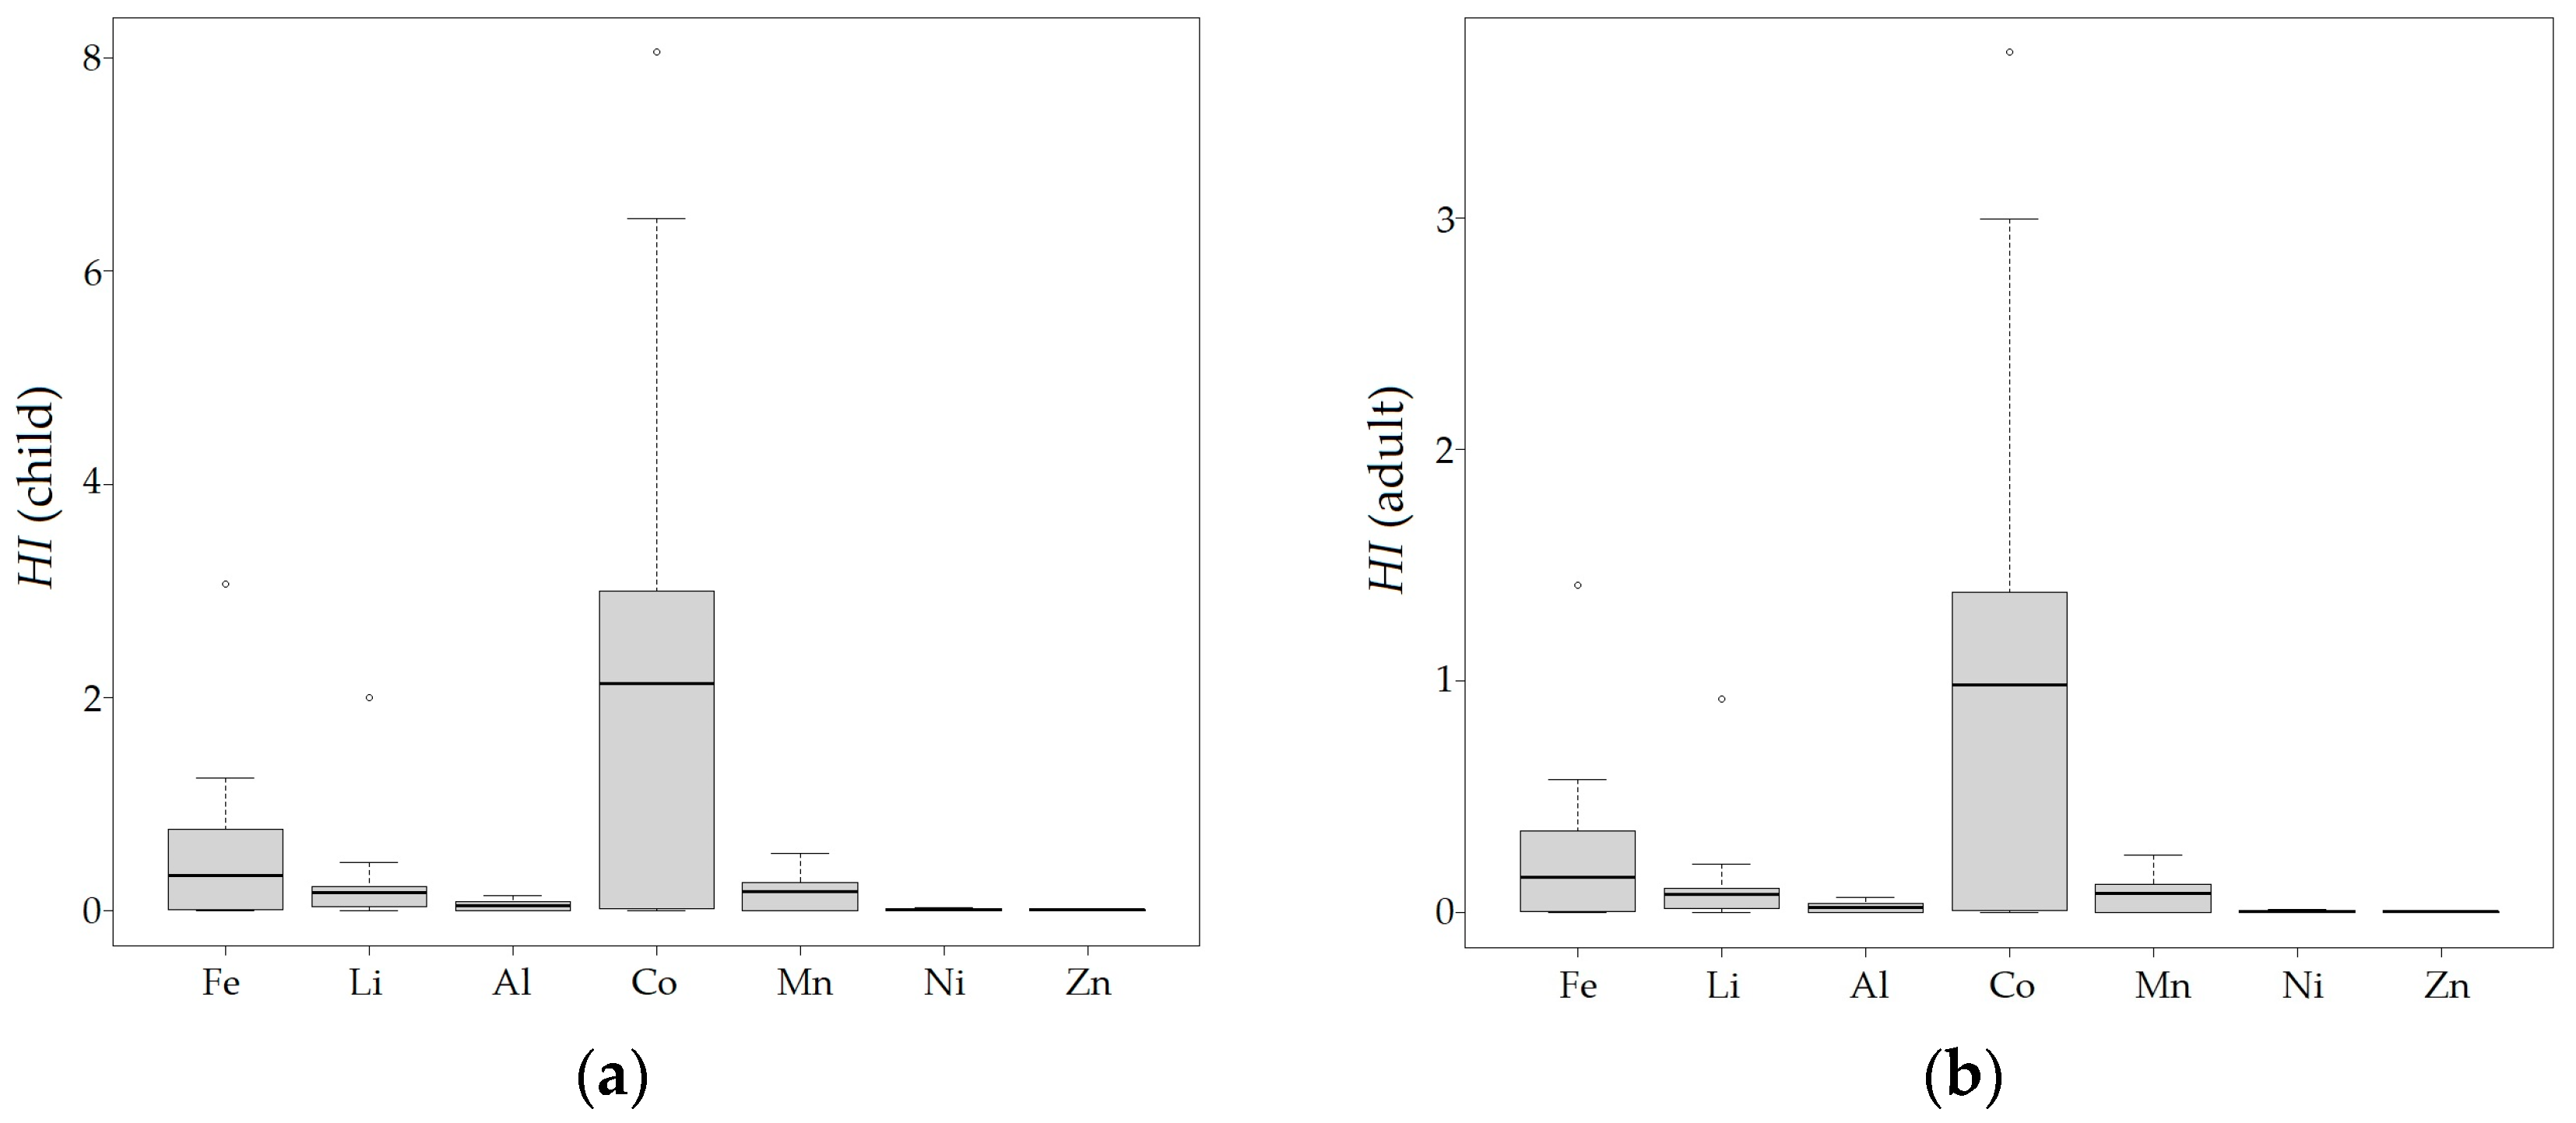
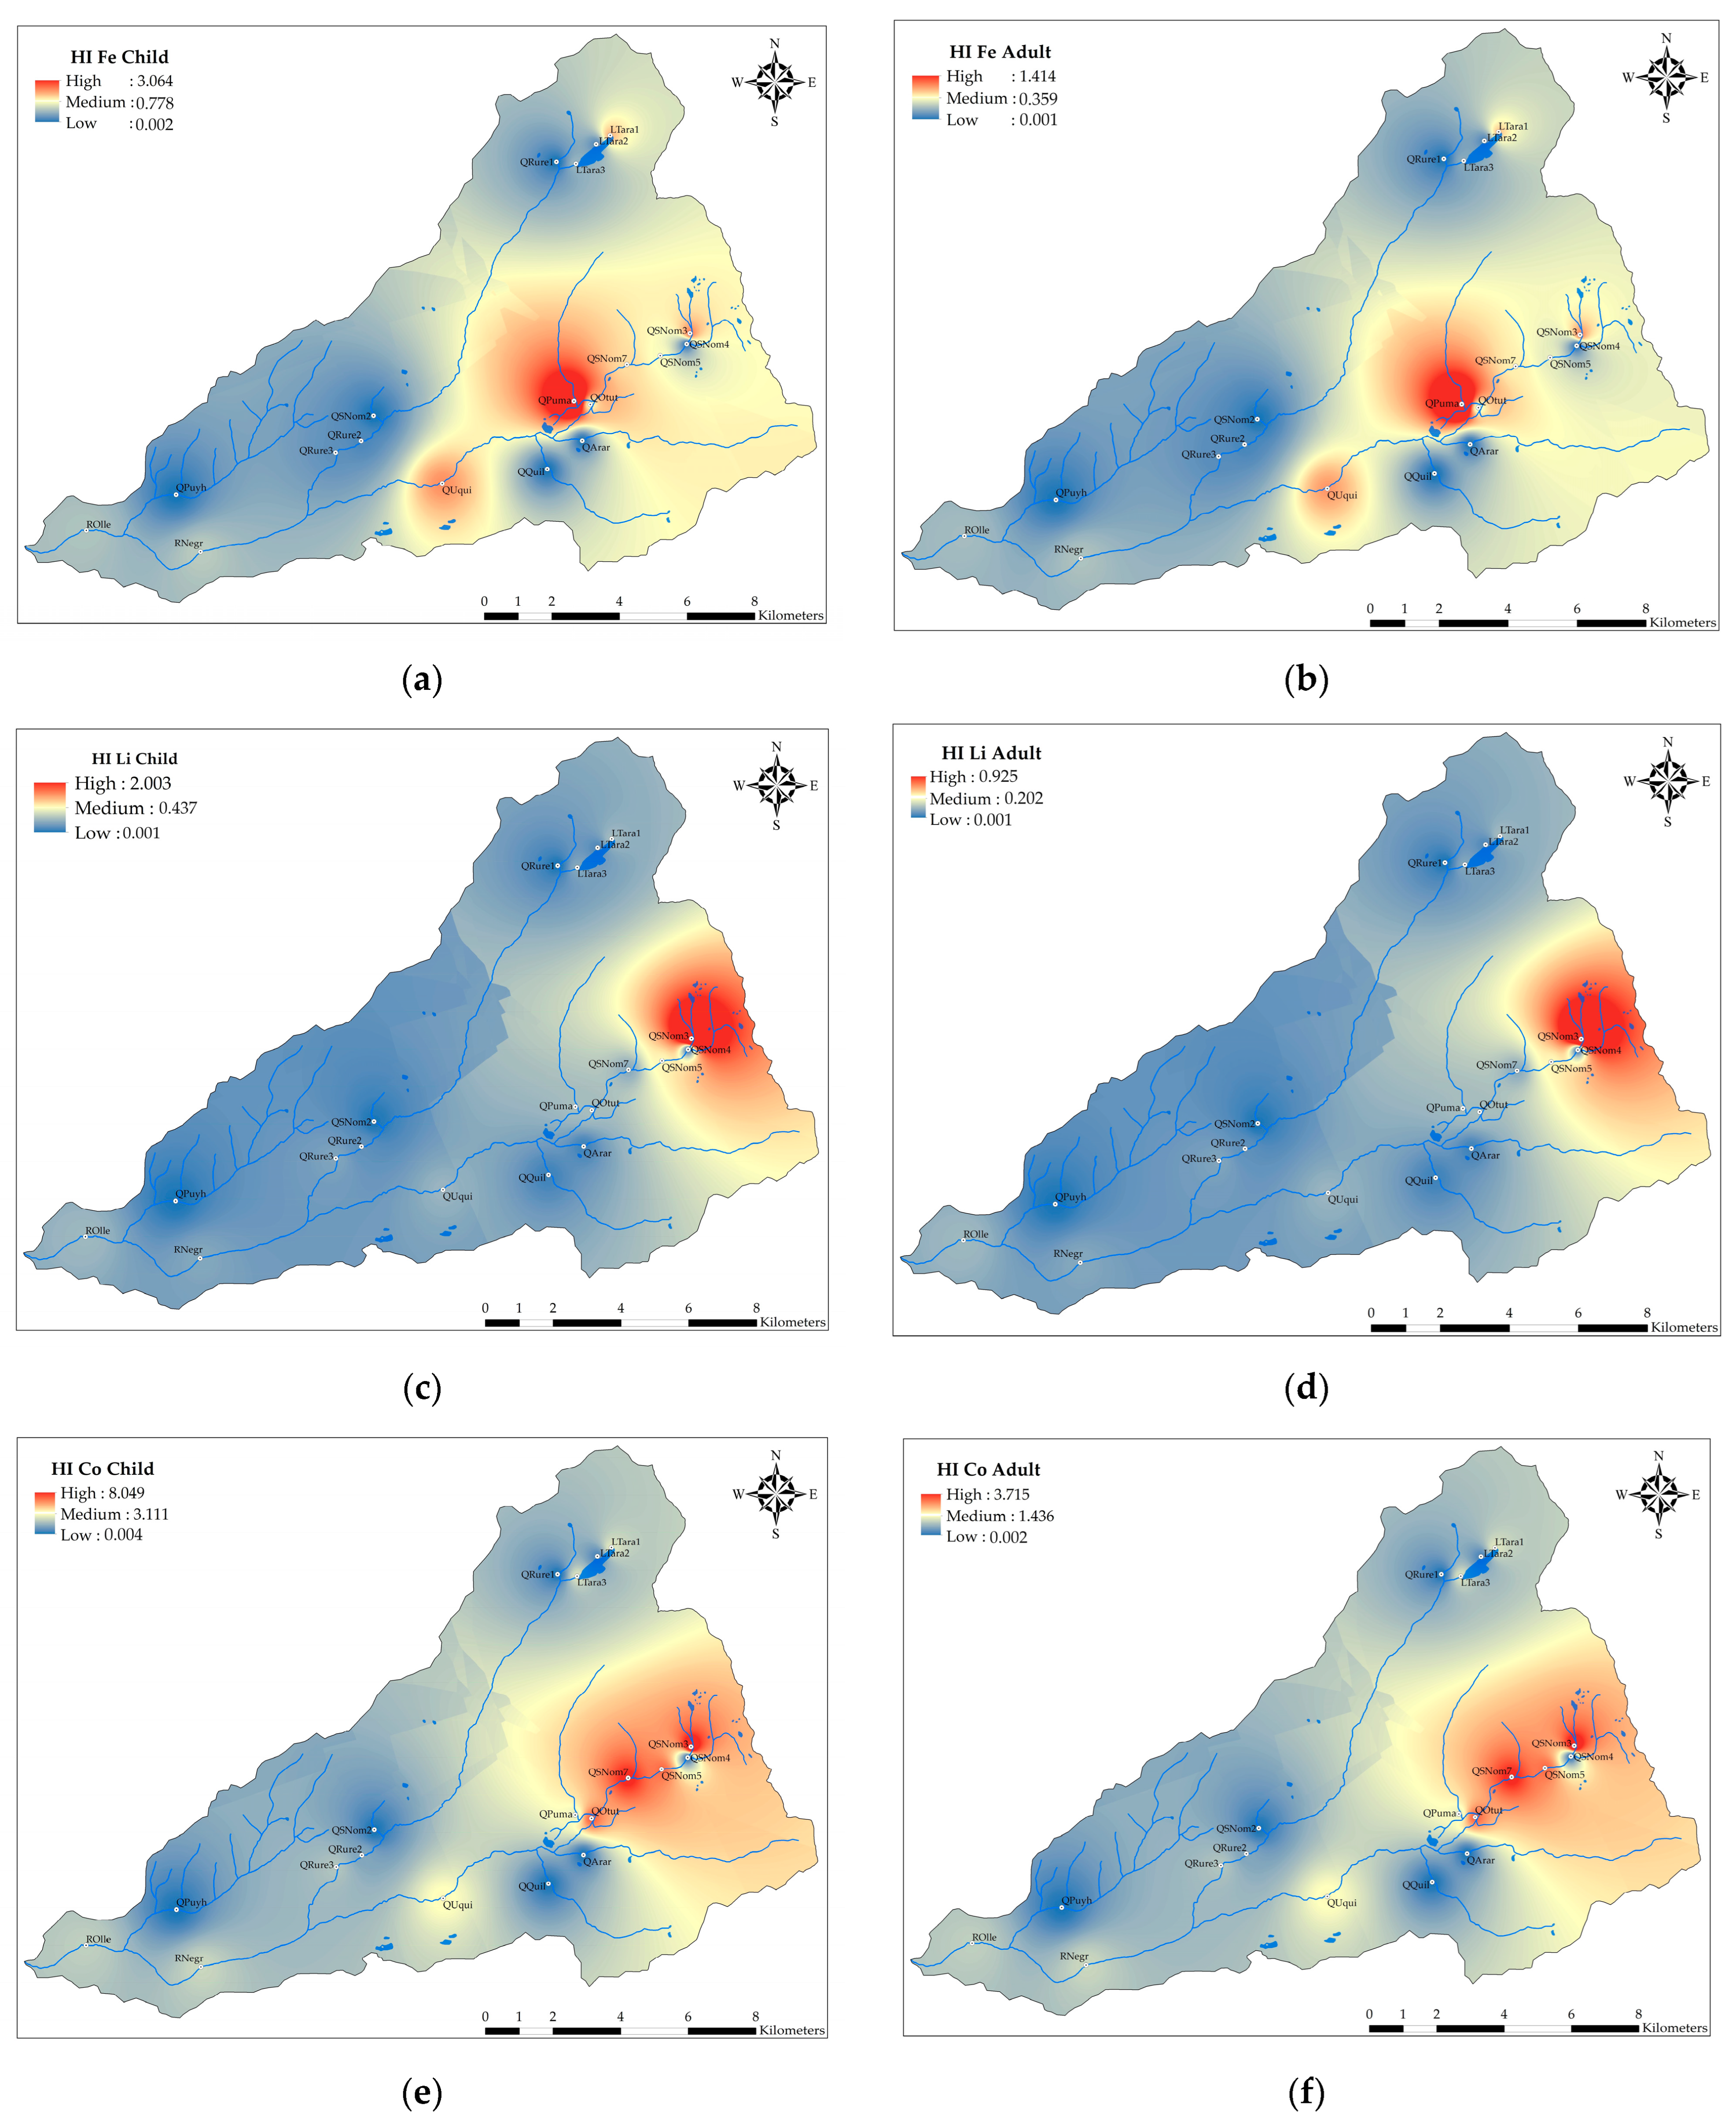
3.3. Human Health Risk Assessment
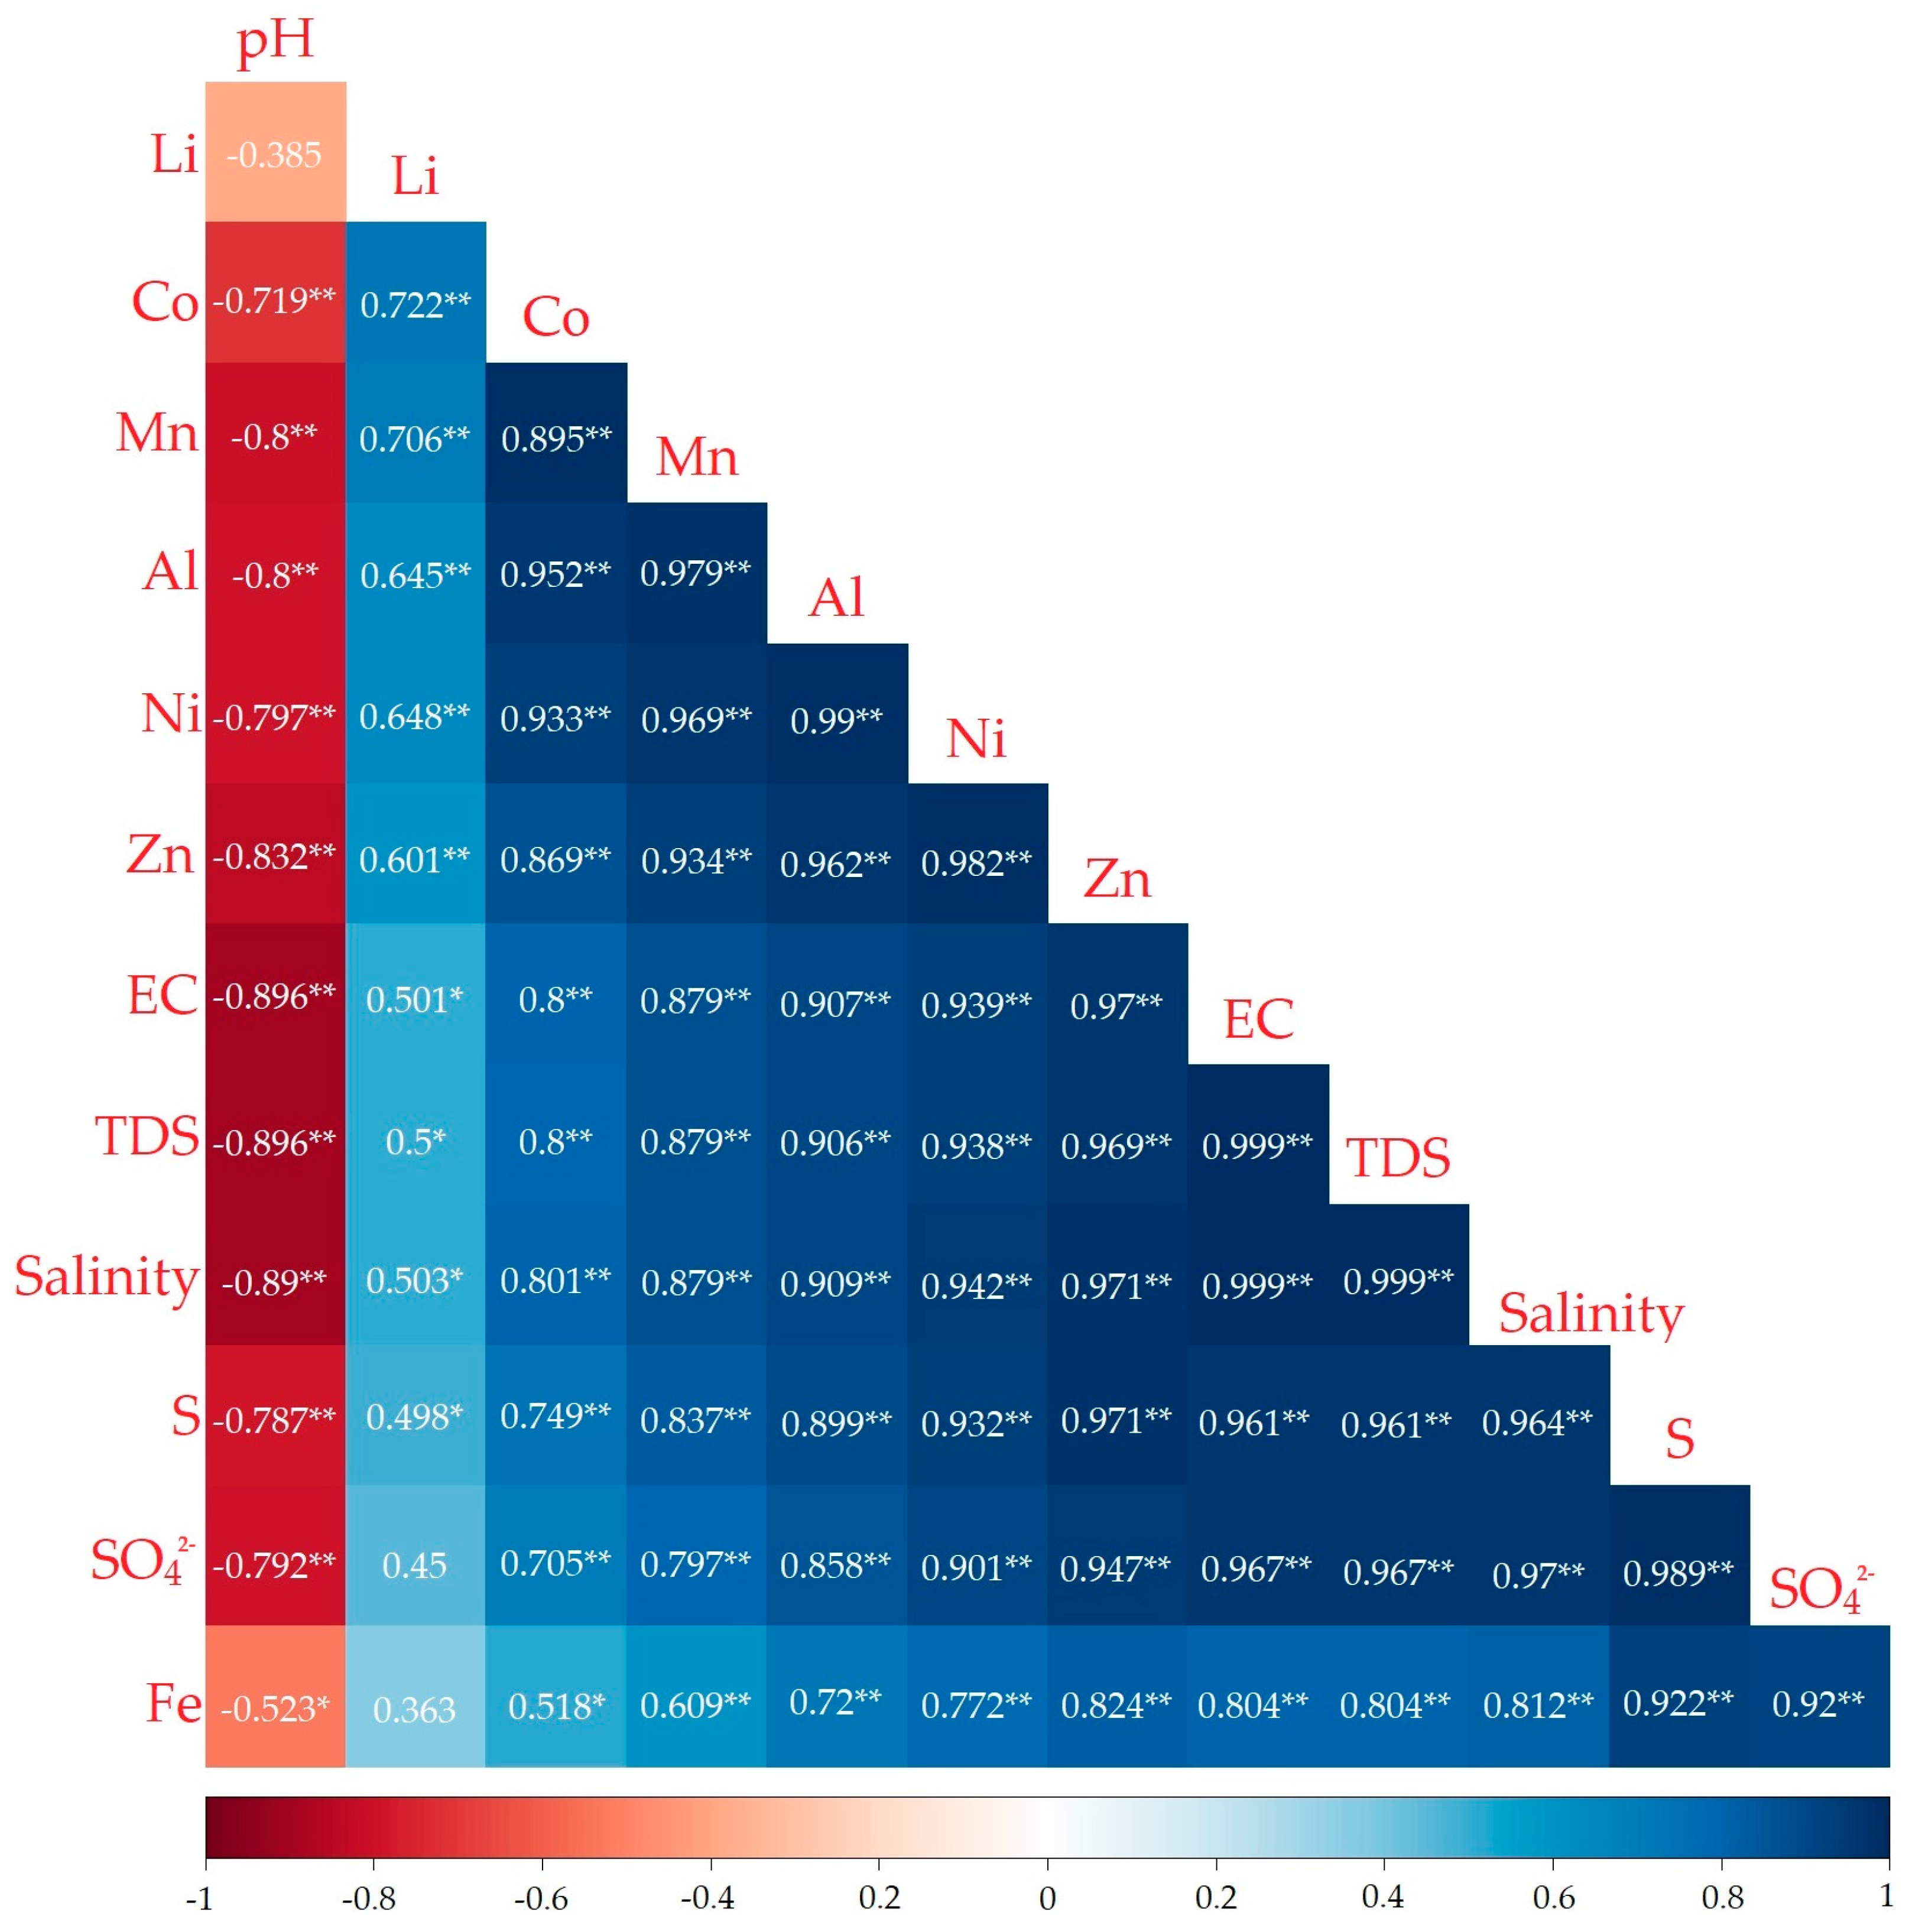
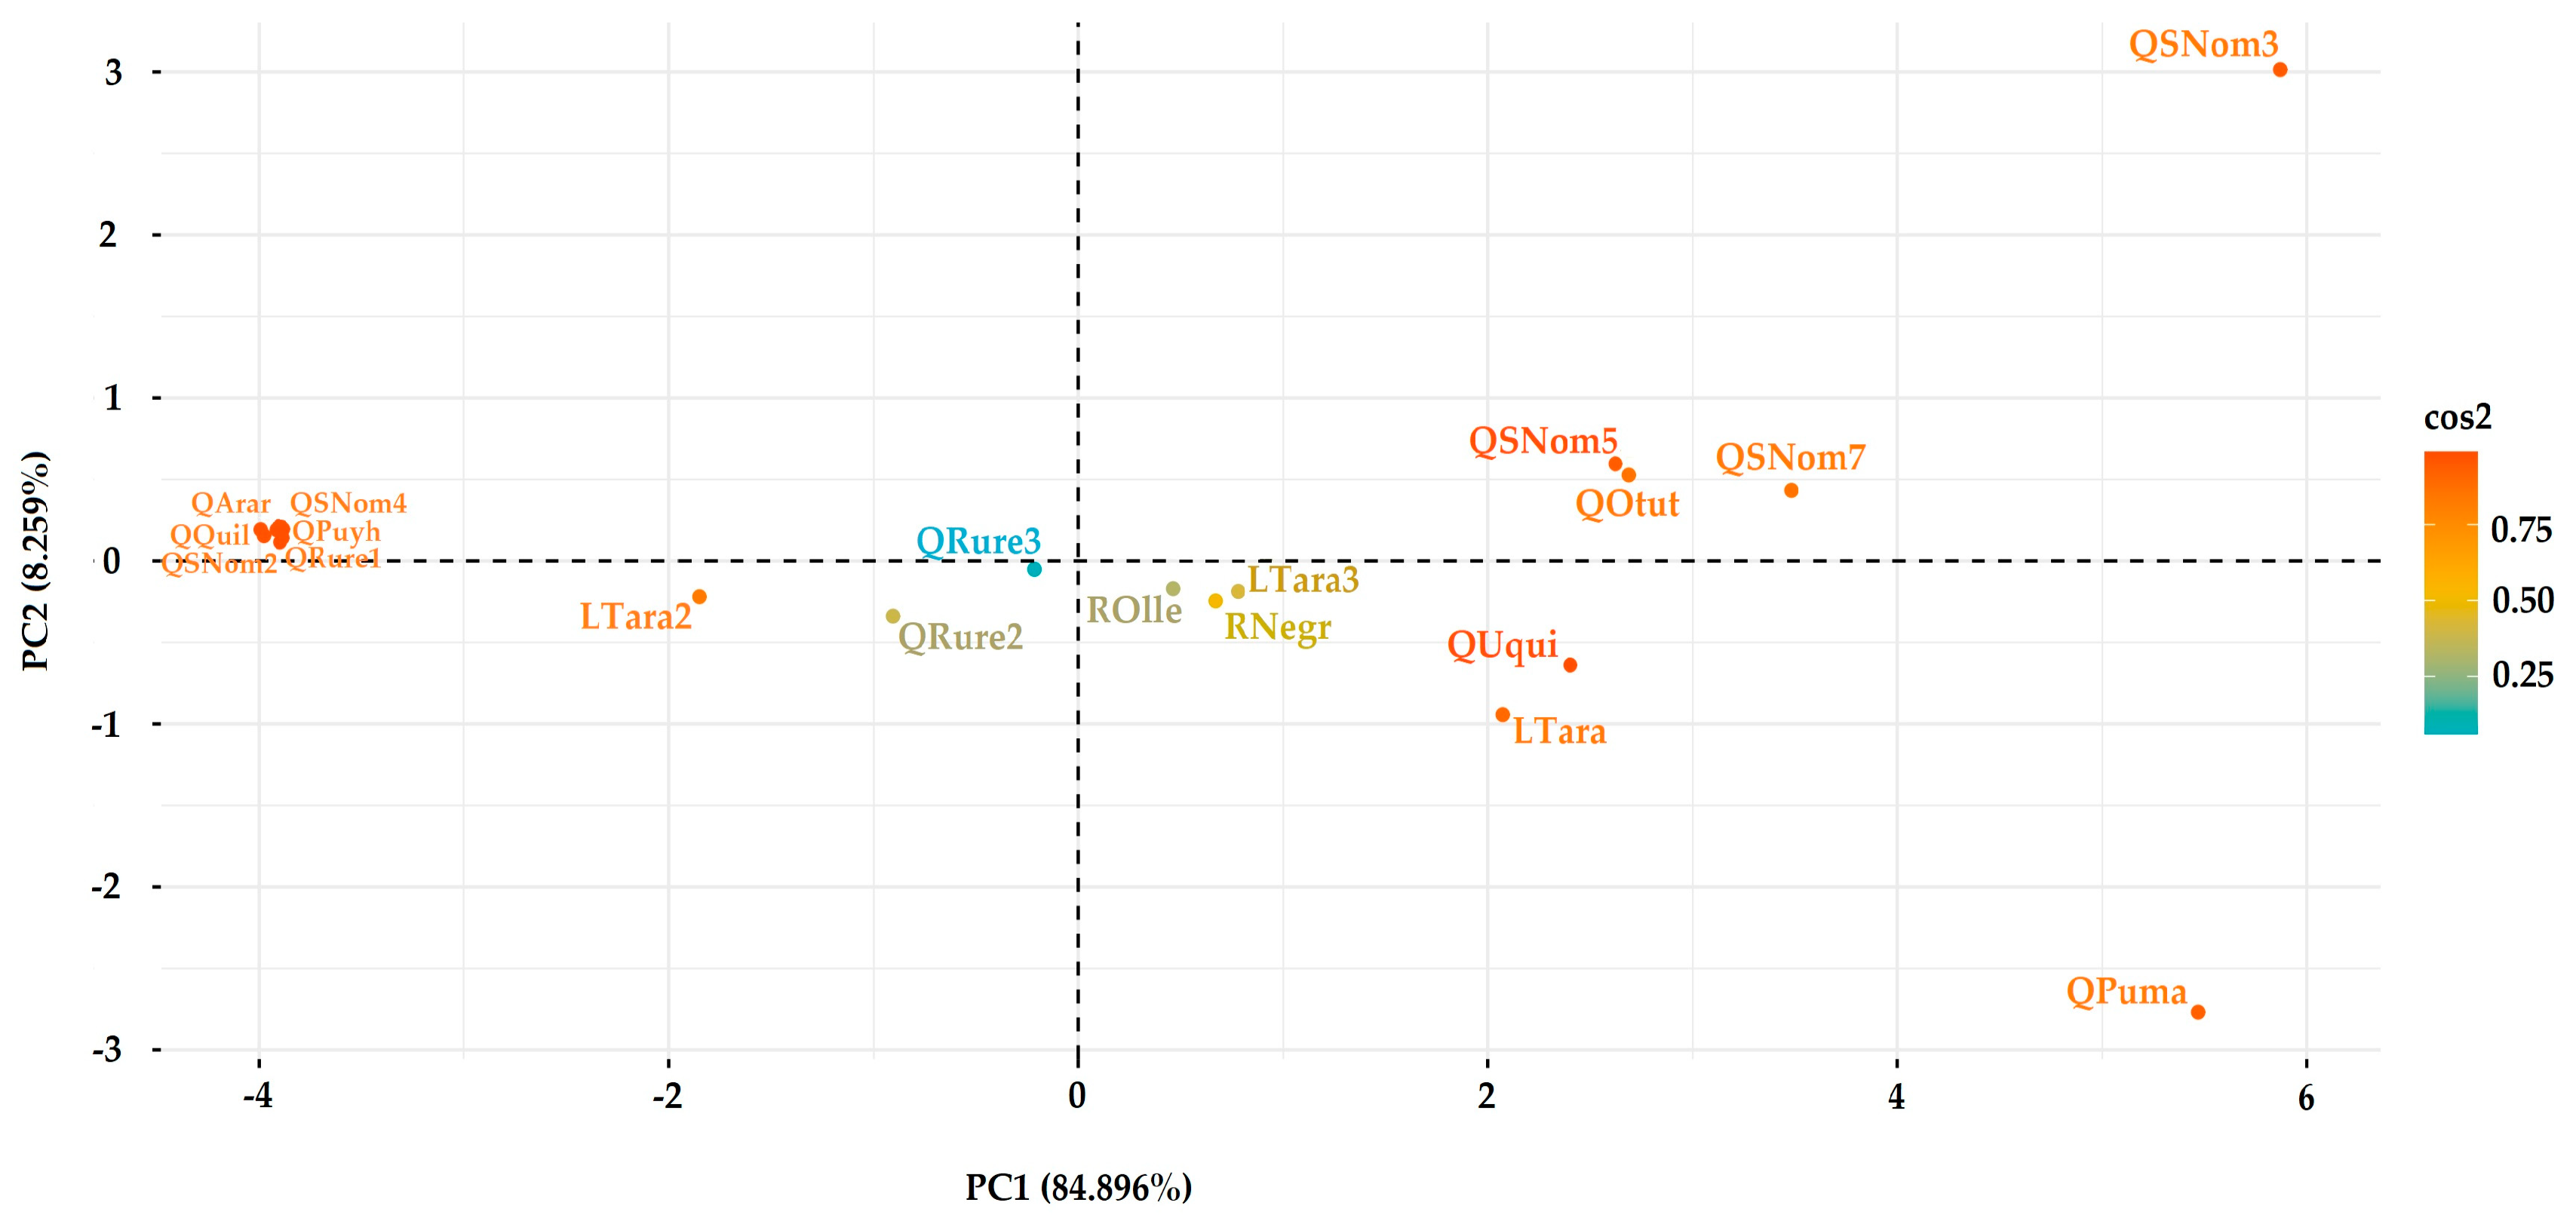
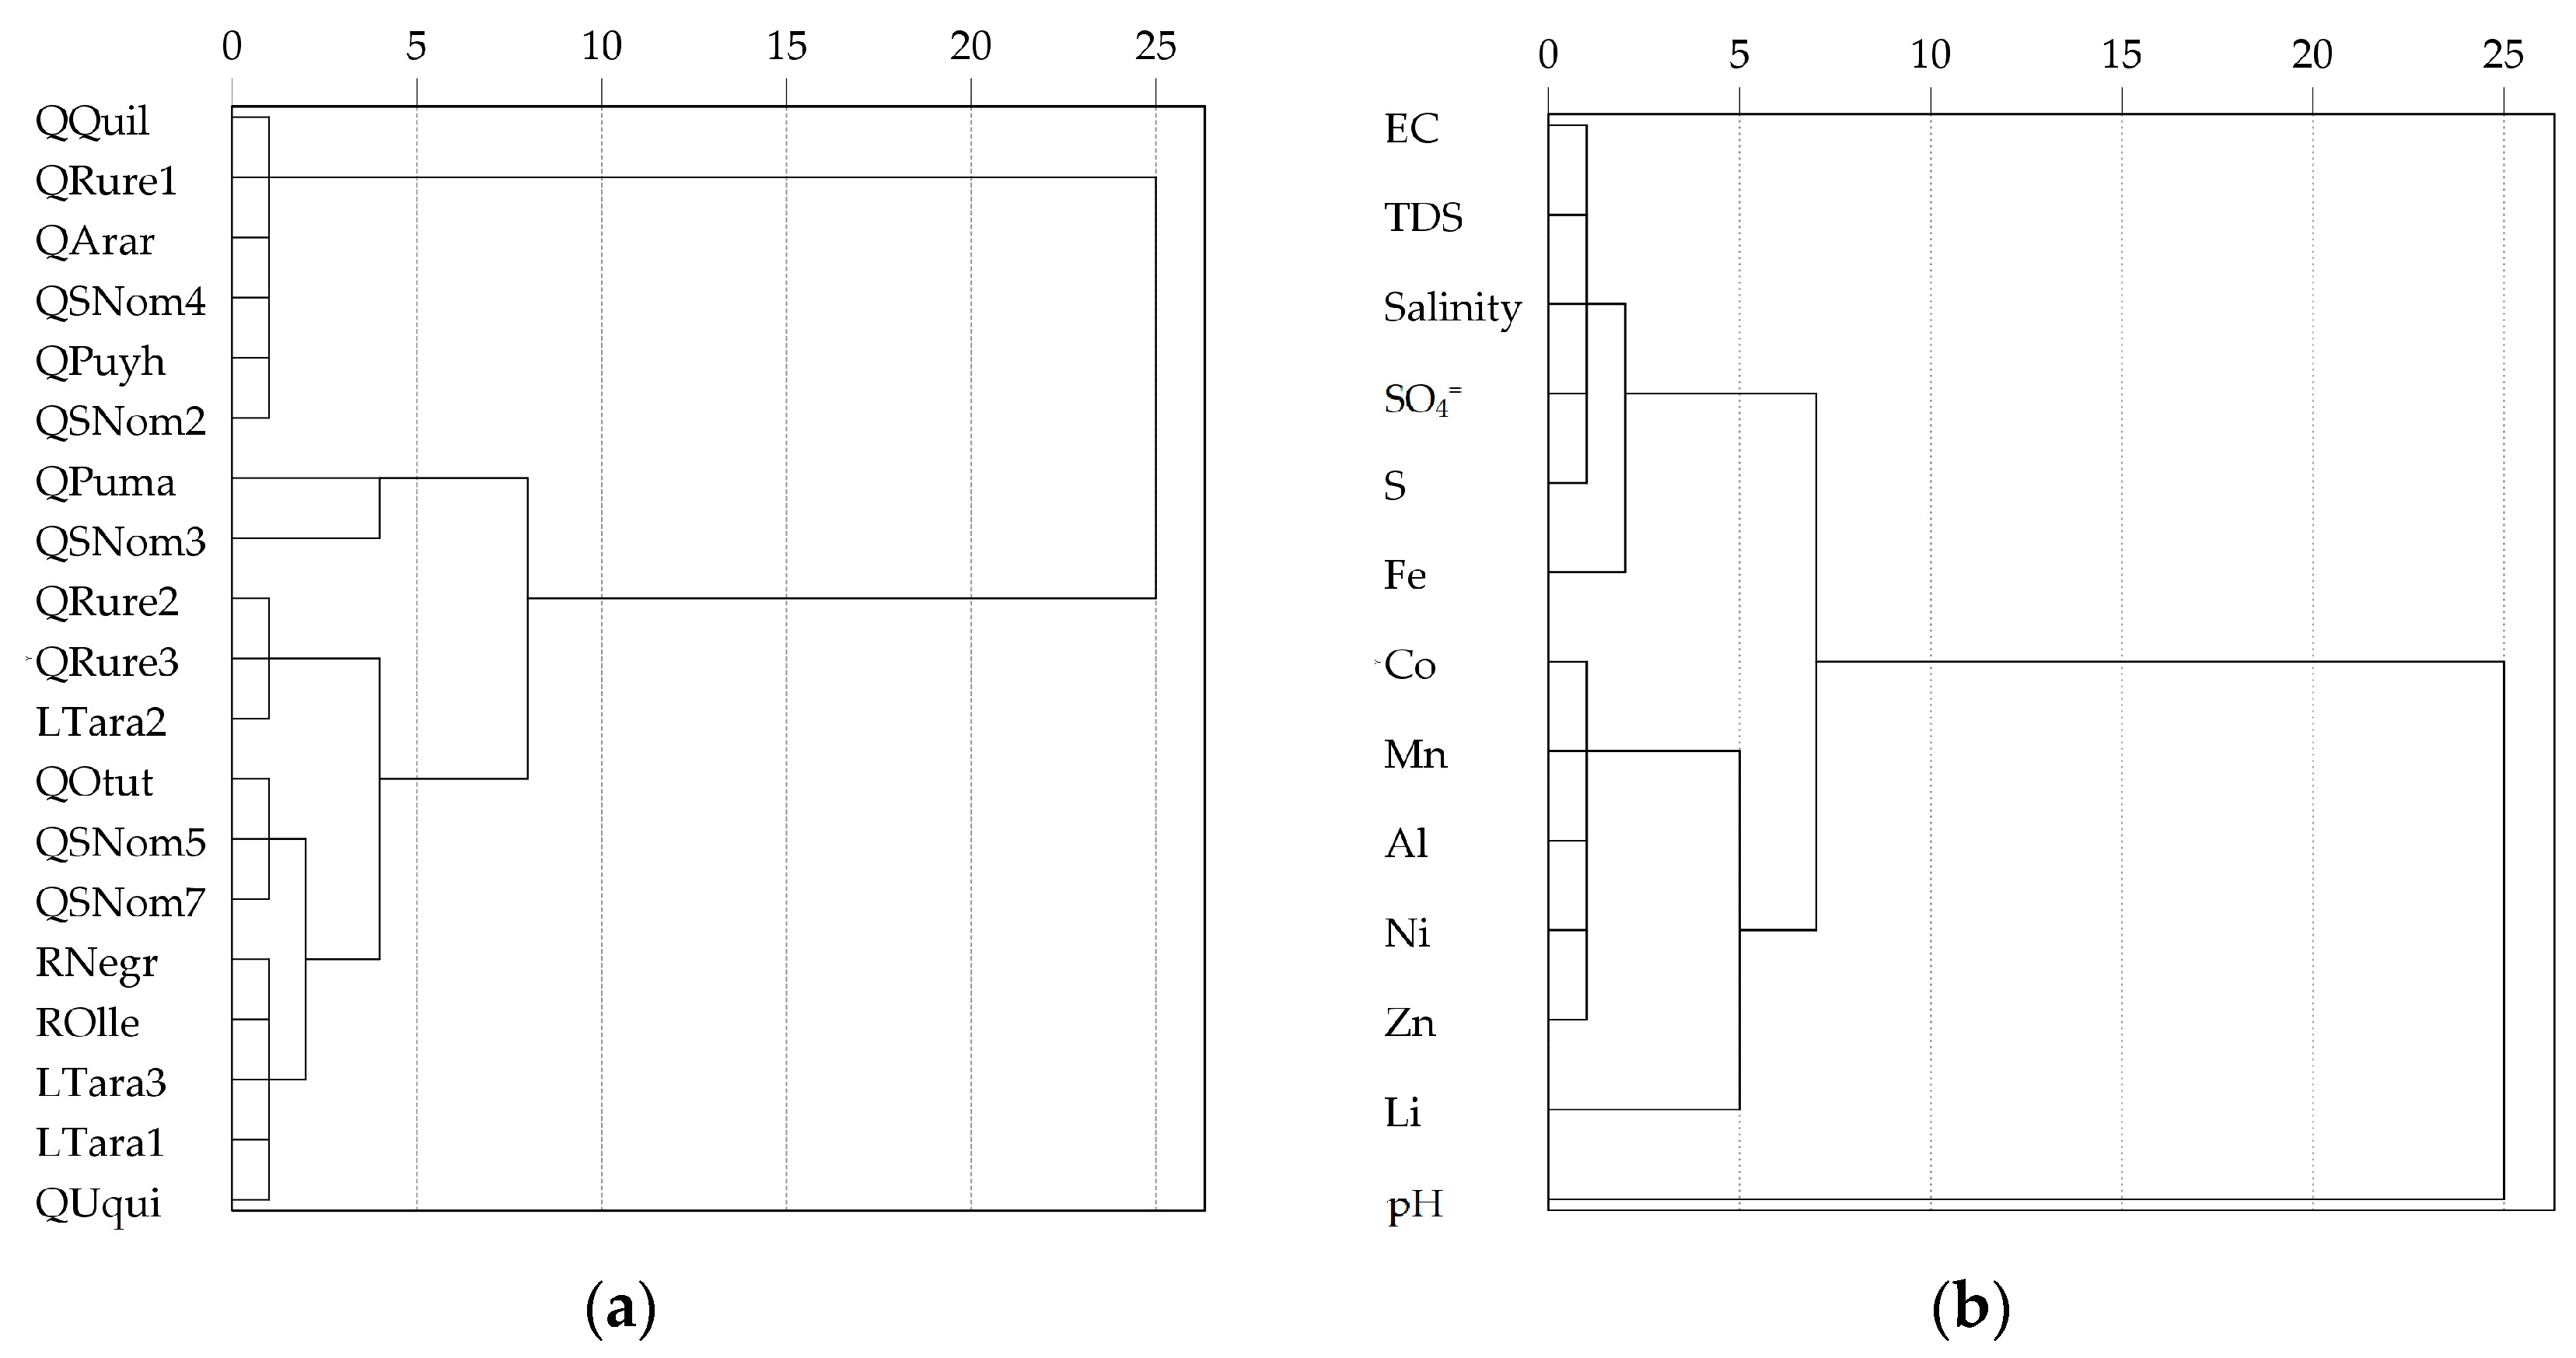
3.4. Analysis of Pollutant Sources
4. Discussion
4.1. Metal Concentration and Environmental Assessment
4.2. Evaluation of the Heavy Metal Pollution Index
4.3. Human Health Risk Assessment
4.4. Analysis of Metal Contaminant Sources
5. Conclusions
Supplementary Materials
Author Contributions
Funding
Institutional Review Board Statement
Informed Consent Statement
Data Availability Statement
Acknowledgments
Conflicts of Interest
References
- Intergovernmental Panel on Climate Change. AR6 Synthesis Report: Climate Change 2023. Available online: https://www.ipcc.ch/report/ar6/syr/ (accessed on 10 May 2023).
- The Lancet Regional Health—Americas. Climate Change: We Must Act Now to Secure a Sustainable, Healthy Future for All. Lancet Reg. Health—Am. 2023, 20, 100494. [Google Scholar] [CrossRef] [PubMed]
- Shivanna, K.R. Climate Change and Its Impact on Biodiversity and Human Welfare. Proc. Indian Natl. Sci. Acad. Part A Phys. Sci. 2022, 88, 160–171. [Google Scholar] [CrossRef]
- Conrad, K. The Era of Climate Change Medicine—Challenges to Health Care Systems. Ochsner J. 2023, 23, 7–8. [Google Scholar] [CrossRef] [PubMed]
- Fell, S.C.; Carrivick, J.L.; Brown, L.E. The Multitrophic Effects of Climate Change and Glacier Retreat in Mountain Rivers. BioScience 2017, 67, 897–911. [Google Scholar] [CrossRef] [PubMed]
- Knight, J. Scientists’ Warning of the Impacts of Climate Change on Mountains. PeerJ 2022, 10, e14253. [Google Scholar] [CrossRef] [PubMed]
- Priestley, R.K.; Heine, Z.; Milfont, T.L. Public Understanding of Climate Change-Related Sea-Level Rise. PLoS ONE 2021, 16, e0254348. [Google Scholar] [CrossRef] [PubMed]
- Marx, W.; Haunschild, R.; Bornmann, L. Heat Waves: A Hot Topic in Climate Change Research. Theor. Appl. Climatol. 2021, 146, 781–800. [Google Scholar] [CrossRef] [PubMed]
- Rounce, D.R.; Hock, R.; Maussion, F.; Hugonnet, R.; Kochtitzky, W.; Huss, M.; Berthier, E.; Brinkerhoff, D.; Compagno, L.; Copland, L.; et al. Global Glacier Change in the 21st Century: Every Increase in Temperature Matters. Science 2023, 379, 78–83. [Google Scholar] [CrossRef] [PubMed]
- Leal Filho, W.; Ternova, L.; Parasnis, S.A.; Kovalena, M.; Nagy, G.J. Climate Change and Zoonoses: A Review of Concepts, Definitions, and Bibliometrics. Int. J. Environ. Res. Public Health 2022, 19, 893. [Google Scholar] [CrossRef] [PubMed]
- Agostoni, C.; Baglioni, M.; La Vecchia, A.; Molari, G.; Berti, C. Interlinkages between Climate Change and Food Systems: The Impact on Child Malnutrition—Narrative Review. Nutrients 2023, 15, 416. [Google Scholar] [CrossRef] [PubMed]
- Wen, J.; Chengcheng, W.; Ye, Q.; Yan, J.; Li, W. Disaster Risk Reduction, Climate Change Adaptation and Their Linkages with Sustainable Development over the Past 30 Years: A Review. Int. J. Disaster Risk Sci. 2023, 14, 1–13. [Google Scholar] [CrossRef]
- Naciones Unidas Perú. Marco de Cooperación para el Desarrollo Sostenible 2022–2026. Available online: https://peru.un.org/es/143284-marco-de-cooperaci%C3%B3n-para-el-desarrollo-sostenible-2022-2026 (accessed on 30 June 2022).
- Rabatel, A.; Francou, B.; Soruco, A.; Gomez, J.; Cáceres, B.; Ceballos, J.L.; Basantes, R.; Vuille, M.; Sicart, J.-E.; Huggel, C.; et al. Current state of glaciers in the tropical Andes: A multi-century perspective on glacier evolution and climate change. Cryosphere 2013, 7, 81–102. [Google Scholar] [CrossRef]
- Instituto Nacional de Investigación en Glaciares y Ecosistemas de Montaña. Inventario Nacional de Glaciares Las Cordilleras Glaciares del Perú, 1st ed.; Instituto Nacional de Investigación en Glaciares y Ecosistemas de Montaña: Huaraz, Perú, 2018.
- Magnússon, R.; Cammeraat, E.; Lücke, A.; Jansen, B.; Zimmer, A.; Recharte, J. Influence of Glacial Sediments on the Chemical Quality of Surface Water in the Ulta Valley, Cordillera Blanca, Peru. J. Hydrol. 2020, 587, 125027. [Google Scholar] [CrossRef]
- Santofimia, E.; López-Pamo, E.; Palomino, E.J.; González-Toril, E.; Aguilera, Á. Acid Rock Drainage in Nevado Pastoruri Glacier Area (Huascarán National Park, Perú): Hydrochemical and Mineralogical Characterization and Associated Environmental Implications. Environ. Sci. Pollut. Res. 2017, 24, 25243–25259. [Google Scholar] [CrossRef] [PubMed]
- La Matta, F.P. Influencia Del Drenaje Ácido de Roca En La Comunidad de Macroinvertebrados Bentónicos, Índices Bióticos de Calidad de Agua y Grupos Funcionales Alimenticios En Ríos y Cabeceras de La Cordillera Blanca (Subcuenca de Quillcay, Ancash). Bachelor’s Thesis, Universidad Peruana Cayetano Heredia, Lima, Peru, 2020. [Google Scholar]
- Martel, G.; Torres, J.C.; Jara, W.H. Variación del pH en Aguas Superficiales Debido a Drenajes Ácidos de Roca en la Subcuenca Quillcay, Huaraz, Ancash. Rev. Glaciares Ecosistemas Montaña 2018, 5, 57–68. [Google Scholar] [CrossRef]
- Reyes, A.W. Contaminación por metales pesados de aguas y suelos en la microcuenca Quilcayhuanca; su relación con la litología y el contexto del cambio climático; Huaraz Áncash Perú 2014–2015. Ph.D. Thesis, Universidad Nacional Santiago Antúnez de Mayolo, Huaraz, Peru, 2018. [Google Scholar]
- Burns, P.; Nolin, A. Using Atmospherically-Corrected Landsat Imagery to Measure Glacier Area Change in the Cordillera Blanca, Peru from 1987 to 2010. Remote Sens. Environ. 2014, 140, 165–178. [Google Scholar] [CrossRef]
- Vuille, M.; Francou, B.; Wagnon, P.; Juen, I.; Kaser, G.; Mark, B.G.; Bradley, R.S. Climate Change and Tropical Andean Glaciers: Past, Present and Future. Earth-Sci. Rev. 2008, 89, 79–96. [Google Scholar] [CrossRef]
- Mishra, A.; Verbist, K.; Decker, J.; Verschueren, M.; Ávila, B. The Impact of Glacier Retreat in the Andes: International Multidisciplinary Network for Adaptation Strategies; Accomplishment Report; Intergovernmental Hydrological Programme; UNESCO: Paris, Francia, 2017. [Google Scholar]
- López-Moreno, J.I.; Valero-Garcés, B.; Mark, B.; Condom, T.; Revuelto, J.; Azorín-Molina, C.; Bazo, J.; Frugone, M.; Vicente-Serrano, S.M.; Alejo-Cochachin, J. Hydrological and Depositional Processes Associated with Recent Glacier Recession in Yanamarey Catchment, Cordillera Blanca (Peru). Sci. Total Environ. 2017, 579, 272–282. [Google Scholar] [CrossRef] [PubMed]
- Autoridad Nacional del Agua. Lagunas Reservas de Agua Dulce en Áncash, 1st ed.; Autoridad Nacional del Agua: Huaraz, Perú, 2020.
- Grande, J.A.; Loayza-Muro, R.; Alonso-Chaves, F.M.; Fortes, J.C.; Willems, B.; Sarmiento, A.M.; Santisteban, M.; Dávila, J.M.; De la Torre, M.L.; Durães, N.; et al. The Negro River (Ancash-Peru): A Unique Case of Water Pollution, Three Environmental Scenarios and an Unresolved Issue. Sci. Total Environ. 2019, 648, 398–407. [Google Scholar] [CrossRef] [PubMed]
- Leyva, M.V. Capacidad secuestradora de metales pesados en sedimento del humedal alto andino Collotacocha—Canrey—Recuay—Áncash, periodo abril–septiembre 2015. Master’s Thesis, Universidad Nacional Santiago Antúnez de Mayolo, Huaraz, Peru, 2017. [Google Scholar]
- Morales, A.P. Absorción y acumulación de metales pesados en las especies Distichia muscoides y Juncus articus Willd en el humedal Uquián, Canrey Chico—Recuay—Áncash en el periodo agosto 2018—marzo 2019. Bachelor’s Thesis, Universidad Nacional Santiago Antúnez de Mayolo, Huaraz, Peru, 2019. [Google Scholar]
- Zimmer, A.; Brito, M.; Oropeza, C.; Bullard, J. Implementación de Dos Sistemas de Biorremediación como Estrategia para la Prevención y Mitigación de los Efectos del Drenaje Ácido de Roca en la Cordillera Blanca, Perú. Rev. Glaciares Ecosistemas Montaña 2018, 4, 57–76. [Google Scholar] [CrossRef]
- Servicio Nacional de Meteorología e Hidrología. Escenarios Climáticos en la Cuenca del Río Santa para el año 2030: Resumen Técnico, 1st ed.; Servicio Nacional de Meteorología e Hidrología: Lima, Perú, 2009.
- Servicio Nacional de Meteorología e Hidrología. Estación Recuay, Tipo Automática—Meteorológica. Available online: https://www.senamhi.gob.pe/?p=senamhi (accessed on 19 May 2023).
- Ministerio de Educación. Descarga de Información Espacial del MED. Available online: http://sigmed.minedu.gob.pe/descargas/ (accessed on 2 June 2022).
- Ministerio de Energía y Minas. Inventario de Pasivos Ambientales Mineros, Resolución Ministerial N 335-2022-MINEM/DM; Ministerio de Energía y Minas: Lima, Perú, 2022.
- Ministerio de Energía y Minas. Quinta Actualización del Inventario de Pasivos Ambientales del Subsector Hidrocarburos, Resolución Ministerial N 038-2022-MINEM/DM; Ministerio de Energía y Minas: Lima, Perú, 2022.
- Autoridad Nacional del Agua. Observatorio Nacional del Sistema Nacional de Información de Recursos Hídricos—SNIRH. Available online: https://www.geoidep.gob.pe/autoridad-nacional-del-agua-ana (accessed on 19 May 2023).
- Servicio Nacional de Áreas Protegidas por el Estados. Geo ANP—Visor de las Áreas Naturales Protegidas. Available online: https://geo.sernanp.gob.pe/visorsernanp/ (accessed on 19 May 2023).
- Huanca, E.F.; Llanos, A.; Navarro, A.; Quispe, I.; Rivas, M.; Velasquez, P. Sistema de Consulta de Centros Poblados. Available online: http://sige.inei.gob.pe/test/atlas/ (accessed on 19 May 2023).
- Instituto Nacional de Estadística e Informática. Perú: Crecimiento y Distribución de la Población Total, 2017; Instituto Nacional de Estadística e Informática: Lima, Perú, 2018.
- Autoridad Nacional del Agua. Protocolo Nacional Para el Monitoreo de la Calidad de Recursos Hídricos Superficiales; Autoridad Nacional del Agua: Lima, Perú, 2016.
- US EPA. EPA Method 300.1, Revision 1.0: Determination of Inorganic Anions in Drinking Water by Ion Chromatography. Available online: https://www.epa.gov/esam/epa-method-3001-revision-10-determination-inorganic-anions-drinking-water-ion-chromatography (accessed on 22 February 2023).
- US EPA. EPA Method 200.7: Determination of Metals and Trace Elements in Water and Wastes by Inductively Coupled Plasma-Atomic Emission Spectrometry. Available online: https://www.epa.gov/esam/method-2007-determination-metals-and-trace-elements-water-and-wastes-inductively-coupled (accessed on 22 February 2023).
- US EPA. EPA Method 200.8: Determination of Trace Elements in Waters and Wastes by Inductively Coupled Plasma-Mass Spectrometry. Available online: https://www.epa.gov/esam/epa-method-2008-determination-trace-elements-waters-and-wastes-inductively-coupled-plasma-mass (accessed on 23 February 2023).
- Ministerio del Ambiente. Estándares de Calidad Ambiental (ECA), Decreto Supremo N 004-2017-MINAM-Perú (10 p.); Ministerio del Ambiente: Lima, Perú, 2017.
- Mohan, S.V.; Nithila, P.; Reddy, S.J. Estimation of heavy metals in drinking water and development of heavy metal pollution index. J. Environ. Sci. Health Part A 1996, 31, 283–289. [Google Scholar] [CrossRef]
- World Health Organization. Guidelines for Drinking-Water Quality: Fourth Edition Incorporating the First and Second Addenda. Ginebra: World Health Organization; World Health Organization: Geneva, Switzerland, 2022.
- US EPA. National Primary Drinking Water Regulations. Available online: https://www.epa.gov/ground-water-and-drinking-water/national-primary-drinking-water-regulations (accessed on 23 February 2023).
- Qu, L.; Huang, H.; Xia, F.; Liu, Y.; Dahlgren, R.A.; Zhang, M.; Mei, K. Risk analysis of heavy metal concentration in surface waters across the rural-urban interface of the Wen-Rui Tang River, China. Environ. Pollut. 2018, 237, 639–649. [Google Scholar] [CrossRef] [PubMed]
- Li, K.; Cui, S.; Zhang, F.; Hough, R.; Fu, Q.; Zhang, Z.; Gao, S.; An, L. Concentrations, Possible Sources and Health Risk of Heavy Metals in Multi-Media Environment of the Songhua River, China. Int. J. Environ. Res. Public Health 2020, 17, 1766. [Google Scholar] [CrossRef] [PubMed]
- Wanda, E.M.M.; Gulula, L.C.; Phiri, G. Determination of characteristics and drinking water quality index in Mzuzu City, Northern Malawi. Phys. Chem. Earth Parts A/B/C 2012, 50–52, 92–97. [Google Scholar] [CrossRef]
- Kwaya, M.; Hassan, H.; Abdullahi, I.; Yelwa, N.A.; Ibrahim, H.; Grema, H.; Mohammed, D.; Halilu, F.; Mohammad Kana, A. Heavy Metals Pollution Indices and Multivariate Statistical Evaluation of Groundwater Quality of Maru town and environs. J. Mat. Environ. Sci. 2019, 10, 32–44. [Google Scholar]
- Karunanidhi, D.; Aravinthasamy, P.; Subramani, T.; Setia, R. Effects of COVID-19 pandemic lockdown on microbial and metals contaminations in a part of Thirumanimuthar River, South India: A comparative health hazard perspective. J. Hazard. Mater. 2021, 416, 125909. [Google Scholar] [CrossRef] [PubMed]
- Chakraborty, B.; Bera, B.; Adhikary, P.P.; Bhattacharjee, S.; Roy, S.; Saha, S.; Sengupta, D.; Shit, P. Effects of COVID-19 Lockdown and Unlock on the Health of Tropical Large River with Associated Human Health Risk. Environ. Sci. Pollut. Res. 2022, 29, 37041–37056. [Google Scholar] [CrossRef] [PubMed]
- Zhang, X.; Wu, Q.; Gao, S.; Wang, Z.; He, S. Distribution, Source, Water Quality and Health Risk Assessment of Dissolved Heavy Metals in Major Rivers in Wuhan, China. PeerJ 2021, 9, e11853. [Google Scholar] [CrossRef] [PubMed]
- Tiwari, A.K.; Singh, P.K.; Singh, A.K.; De Maio, M. Estimation of Heavy Metal Contamination in Groundwater and Development of a Heavy Metal Pollution Index by Using GIS Technique. Bull. Environ. Contam. Toxicol. 2016, 96, 508–515. [Google Scholar] [CrossRef]
- Tengku, T.N.; Othman, F.; Mahmood, N. Baseline Study of Heavy Metal Pollution in a Tropical River in a Developing Country. Sains Malays. 2020, 49, 729–742. [Google Scholar] [CrossRef]
- Razak, M.R.; Aris, A.Z.; Zakaria, N.A.; Wee, S.Y.; Ismail, N.A. Accumulation and risk assessment of heavy metals employing species sensitivity distributions in Linggi River, Negeri Sembilan, Malaysia. Ecotoxicol. Environ. Saf. 2021, 211, 111905. [Google Scholar] [CrossRef] [PubMed]
- US Environmental Protection Agency (US EPA). Risk Assessment Guidance for Superfund. Volume I. Human Health Evaluation Manual (Part A); US Environmental Protection Agency: Washington, DC, USA, 1989.
- US Environmental Protection Agency (US EPA). Risk Assessment Guidance for Superfund Volume I: Human Health Evaluation Manual (Part E, Supplemental Guidance for Dermal Risk Assessment); US Environmental Protection Agency: Washington, DC, USA, 2004.
- Ministerio del Ambiente. Guía Para la Elaboración de Estudios de Riesgos Para la Salud y el Ambiente (ERSA) en Sitios Contaminados, 1st ed.; Ministerio del Ambiente: Lima, Perú, 2015.
- Rodriguez-Proteau, R.; Grant, R.L. Toxicity Evaluation and Human Health Risk Assessment of Surface and Ground Water Contaminated by Recycled Hazardous Waste Materials. Water Pollut. 2005, 2, 133–189. [Google Scholar] [CrossRef]
- Asante-Duah, K. Public Health Risk Assessment for Human Exposure to Chemicals, 2nd ed.; Springer Netherlands: Dordrecht, The Netherland, 2017; pp. 289–329. [Google Scholar]
- US Environmental Protection Agency (US EPA). Regional Screening Levels (RSLs)—Generic Tables. Available online: https://www.epa.gov/risk/regional-screening-levels-rsls-generic-tables (accessed on 28 February 2023).
- Li, S.; Zhang, Q. Risk Assessment and Seasonal Variations of Dissolved Trace Elements and Heavy Metals in the Upper Han River, China. J. Hazard. Mater. 2010, 181, 1051–1058. [Google Scholar] [CrossRef]
- Kamunda, C.; Mathuthu, M.; Madhuku, M. Health Risk Assessment of Heavy Metals in Soils from Witwatersrand Gold Mining Basin, South Africa. Int. J. Environ. Res. Public Health 2016, 13, 663. [Google Scholar] [CrossRef] [PubMed]
- Xu, S.; Lang, Y.; Zhong, J.; Xiao, M.; Ding, H. Coupled controls of climate, lithology and land use on dissolved trace elements in a karst river system. J. Hydrol. 2020, 591, 125328. [Google Scholar] [CrossRef]
- US Environmental Protection Agency (US EPA). Provisional Peer-Reviewed Toxicity Values (PPRTVs). Available online: https://www.epa.gov/pprtv (accessed on 28 February 2023).
- Autoridad Nacional del Agua. Evaluación de la Calidad del Agua y de los Sedimentos en la Cuenca del río Santa, Noviembre 2013: Informe Técnico; Autoridad Nacional del Agua: Nuevo Chimbote, Perú, 2013.
- Autoridad Nacional del Agua. Evaluación de la Calidad del Agua y de los Sedimentos en la Cuenca del río Santa, Abril 2014: Informe Técnico; Autoridad Nacional del Agua: Nuevo Chimbote, Perú, 2014.
- Autoridad Nacional del Agua. Resultados del 3er Monitoreo Participativo de la Calidad del Agua Superficial en la Cuenca del río Santa 2015; Autoridad Nacional del Agua: Nuevo Chimbote, Perú, 2016.
- Leyssens, L.; Vinck, B.; Van Der Straeten, C.; Wuyts, F.; Maes, L. Cobalt toxicity in humans—A review of the potential sources and systemic health effects. Toxicology 2017, 387, 43–56. [Google Scholar] [CrossRef] [PubMed]
- Danzeisen, R.; Williams, D.; Viegas, V.; Dourson, M.; Verberckmoes, S.; Burzlaff, A. Bioelution, Bioavailability, and Toxicity of Cobalt Compounds Correlate. Toxicol. Sci. 2020, 174, 311–325. [Google Scholar] [CrossRef] [PubMed]
- Zhang, N.; Yang, S.; Yang, J.; Deng, Y.; Li, S.; Li, N.; Chen, X.; Yu, P.; Liu, Z.; Zhu, J. Association between Metal Cobalt Exposure and the Risk of Congenital Heart Defect Occurrence in Offspring: A Multi-Hospital Case-Control Study. Environ. Health Prev. Med. 2020, 25, 38. [Google Scholar] [CrossRef] [PubMed]
- Tarnacka, B.; Jopowicz, A.; Maślińska, M. Copper, Iron, and Manganese Toxicity in Neuropsychiatric Conditions. Int. J. Mol. Sci. 2021, 22, 7820. [Google Scholar] [CrossRef] [PubMed]
- Dev, S.; Babittd, J.L. Overview of Iron Metabolism in Health and Disease. Hemodial. Int. Int. Symp. Home Hemodial. 2017, 21, S6. [Google Scholar] [CrossRef] [PubMed]
- Araya, P.; Martínez, C.; Barros, J. Lithium in Drinking Water as a Public Policy for Suicide Prevention: Relevance and Considerations. Front. Public Health 2022, 10, 805774. [Google Scholar] [CrossRef] [PubMed]
- Eyre-Watt, B.; Mahendran, E.; Firth, J.; Kisely, S.; Siskind, D. The Association between Lithium in Drinking Water and Neuropsychiatric Outcomes: A Systematic Review and Meta-Analysis from across 2678 Regions Containing 113 Million People. Aust. N. Z. J. Psychiatry 2021, 55, 139–152. [Google Scholar] [CrossRef] [PubMed]
- McKnight, R.F.; Adida, M.; Budge, K.; Goodwin, G.M.; Geddes, J.R. Lithium Toxicity Profile: A Systematic Review and Meta-Analysis. Lithium Toxicity Profile: A Systematic Review and Meta-Analysis. Lancet 2012, 379, 721–728. [Google Scholar] [CrossRef] [PubMed]
- Müller-Oerlinghausen, B.; Bauer, M.; Grof, P. Commentary on a Recent Review of Lithium Toxicity: What Are Its Implications for Clinical Practice? BMC Med. 2012, 10, 132. [Google Scholar] [CrossRef] [PubMed]
- O’Neal, S.L.; Zheng, W. Manganese Toxicity Upon Overexposure: A Decade in Review. Curr. Environ. Health Rep. 2015, 2, 315–328. [Google Scholar] [CrossRef]
- Nyarko-Danquah, I.; Pajarillo, E.; Digman, A.; Soliman, K.F.; Aschner, M.; Lee, E. Manganese Accumulation in the Brain via Various Transporters and Its Neurotoxicity Mechanisms. Molecules 2020, 25, 5880. [Google Scholar] [CrossRef]
- Fairbrother, A.; Wenstel, R.; Sappington, K.; Wood, W. Framework for Metals Risk Assessment. Ecotoxicol. Environ. Saf. 2007, 68, 147–227. [Google Scholar] [CrossRef]
- Instituto Geológico, Minero y Metalúrgico (INGEMMET). Geocatmin. Available online: https://geocatmin.ingemmet.gob.pe/geocatmin/ (accessed on 3 March 2023).
- León, H.A. Línea de Congelamiento Como Probable Límite de la Extensión del Permafrost y su Relación con la Cobertura de Nieve en la Cordillera Blanca de Los Andes de Perú, 2019. Bachelor’s Thesis, Universidad Nacional Santiago Antúnez de Mayolo, Huaraz, Peru, 2020. [Google Scholar]
- Ilyashuk, B.P.; Ilyashuk, E.A.; Psenner, R.; Tessadri, R.; Koinig, K. Rock Glaciers in Crystalline Catchments: Hidden Permafrost-Related Threats to Alpine Headwater Lakes. Glob. Change Biol. 2018, 24, 1548–1562. [Google Scholar] [CrossRef]
- Tolotti, M.; Cerasino, L.; Donati, C.; Pindo, M.; Rogora, M.; Seppi, R.; Albanese, D. Alpine Headwaters Emerging from Glaciers and Rock Glaciers Host Different Bacterial Communities: Ecological Implications for the Future. Sci. Total Environ. 2020, 717, 137101. [Google Scholar] [CrossRef]
- Zarroca, M.; Roqué, C.; Linares, R.; Salminci, J.G.; Gutiérrez, F. Natural Acid Rock Drainage in Alpine Catchments: A Side Effect of Climate Warming. Sci. Total Environ. 2021, 778, 146070. [Google Scholar] [CrossRef]
- Lacelle, D.; Léveillé, R. Acid drainage generation and associated Ca–Fe–SO4 minerals in a periglacial environment, Eagle Plains, Northern Yukon, Canada: A potential analogue for low-temperature sulfate formation on Mars. Planet. Space Sci. 2010, 58, 509–521. [Google Scholar] [CrossRef]
- Lacelle, D.; Doucet, A.; Clark, I.D.; Lauriol, B. Acid Drainage Generation and Seasonal Recycling in Disturbed Permafrost near Eagle Plains, Northern Yukon Territory, Canada. Chem. Geol. 2007, 243, 157–177. [Google Scholar] [CrossRef]


| Exposure Parameters | Unit | Reference | |
|---|---|---|---|
| Children | Adults | ||
| Intake rate (IR) [59] | L day−1 | 1 | 2 |
| Gastrointestinal absorption factor (ABSg) [48,58,60] | - | 20% (Zn), 6% (Mn), 4% (Ni) and 20% (Fe, Li, Al and Co) | |
| Exposure frequency (EF) [59] | day year−1 | 365 | |
| Exposure duration (ED) [59] | year | 6 | 30 |
| Average weight body weight (BW) [59] | kg | 15 | 65 |
| Average lifetime (AT) [59] | day | 2094 | 1815 |
| Skin-surface area (SA) [59] | cm2 | 8750 | 19,400 |
| Permeability coefficient (Kp) [58] | cm day−1 | 6 × 10⁻⁴ (Zn), 4 × 10⁻⁴ (Co), 1 × 10⁻³ (Fe, Li, Al, Mn and Ni) | |
| Dermal absorption factor (ABSd) [48,58] | - | 0.1% (Fe, Li, Al, Co, Mn, Ni and Zn) | |
| Exposure time (ET) [61] | hour day−1 | 0.14 | 0.25 |
| Conversion factor (CF) [47,61] | L cm−3 | 10−3 | |
| Parameters | Unit | Range | Mean | Median | SD | Coefficient of Variation |
|---|---|---|---|---|---|---|
| pH | unidad pH | 2.708–6.912 | 4.077 | 2.998 | 1.71 | 41.945% |
| DO | mg/L | 4.972–7.784 | 6.610 | 6.538 | 0.846 | 12.800% |
| EC | µS/cm | 69.4–1848.6 | 826.653 | 997.6 | 589.037 | 71.256% |
| TDS | ppm | 34.4–924.6 | 413.432 | 499 | 294.936 | 71.338% |
| Salinity | PSU | 0.03–0.948 | 0.413 | 0.5 | 0.300 | 72.528% |
| Temperature | °C | 1.268–14.35 | 9.260 | 9.682 | 3.688 | 39.823% |
| Turbidity | NTU | 0.071–0.323 | 0.128 | 0.095 | 0.075 | 58.593% |
| Cl− | mg/L | 0.1–1.8 | 0.637 | 0.6 | 0.512 | 80.503% |
| SO42− | mg/L | 1.6–493.8 | 156.726 | 167.3 | 133.647 | 85.274% |
| Fe | mg/L | 0.110–160.85 | 28.597 | 17.54 | 38.863 | 135.897% |
| Al | mg/L | 0.022–10.573 | 3.832 | 3.761 | 3.486 | 90.978% |
| Cu | mg/L | 0.001–0.008 | 0.005 | 0.006 | 0.003 | 55.017% |
| Co | mg/L | 0.000–0.181 | 0.053 | 0.0479 | 0.055 | 103.991% |
| Li | mg/L | 0.000–0.305 | 0.036 | 0.0265 | 0.066 | 181.658% |
| Mn | mg/L | 0.003–3.258 | 1.085 | 1.0997 | 0.980 | 90.230% |
| Ni | mg/L | 0.000–0.237 | 0.085 | 0.088 | 0.078 | 91.704% |
| Pb | mg/L | 0.000–0.004 | 0.002 | 0.0013 | 0.001 | 62.836% |
| S | mg/L | 0.9–191.4 | 61.253 | 63.5 | 52.972 | 86.482% |
| Zn | mg/L | 0.008–0.555 | 0.234 | 0.249 | 0.184 | 78.666% |
Disclaimer/Publisher’s Note: The statements, opinions and data contained in all publications are solely those of the individual author(s) and contributor(s) and not of MDPI and/or the editor(s). MDPI and/or the editor(s) disclaim responsibility for any injury to people or property resulting from any ideas, methods, instructions or products referred to in the content. |
© 2024 by the authors. Licensee MDPI, Basel, Switzerland. This article is an open access article distributed under the terms and conditions of the Creative Commons Attribution (CC BY) license (https://creativecommons.org/licenses/by/4.0/).
Share and Cite
Bravo-Zevallos, W.; Fernández-Jerí, Y.; Torres-Lázaro, J.C.; Zuñiga-Bardales, K. Assessment of Human Health Risk Indices Due to Metal Contamination in the Surface Water of the Negro River Sub-Basin, Áncash. Int. J. Environ. Res. Public Health 2024, 21, 733. https://doi.org/10.3390/ijerph21060733
Bravo-Zevallos W, Fernández-Jerí Y, Torres-Lázaro JC, Zuñiga-Bardales K. Assessment of Human Health Risk Indices Due to Metal Contamination in the Surface Water of the Negro River Sub-Basin, Áncash. International Journal of Environmental Research and Public Health. 2024; 21(6):733. https://doi.org/10.3390/ijerph21060733
Chicago/Turabian StyleBravo-Zevallos, Walter, Yadira Fernández-Jerí, Juan C. Torres-Lázaro, and Karol Zuñiga-Bardales. 2024. "Assessment of Human Health Risk Indices Due to Metal Contamination in the Surface Water of the Negro River Sub-Basin, Áncash" International Journal of Environmental Research and Public Health 21, no. 6: 733. https://doi.org/10.3390/ijerph21060733