

A Review of Data Mining Strategies by Data Type, with a Focus on Construction Processes and Health and Safety Management

 , and
, and 
Abstract
:1. Introduction
2. Materials and Methods
2.1. Selection and Inclusion Criteria
2.2. Risk of Bias for Selected Studies
2.3. Data Quality and Items
2.4. Study Design
3. Results
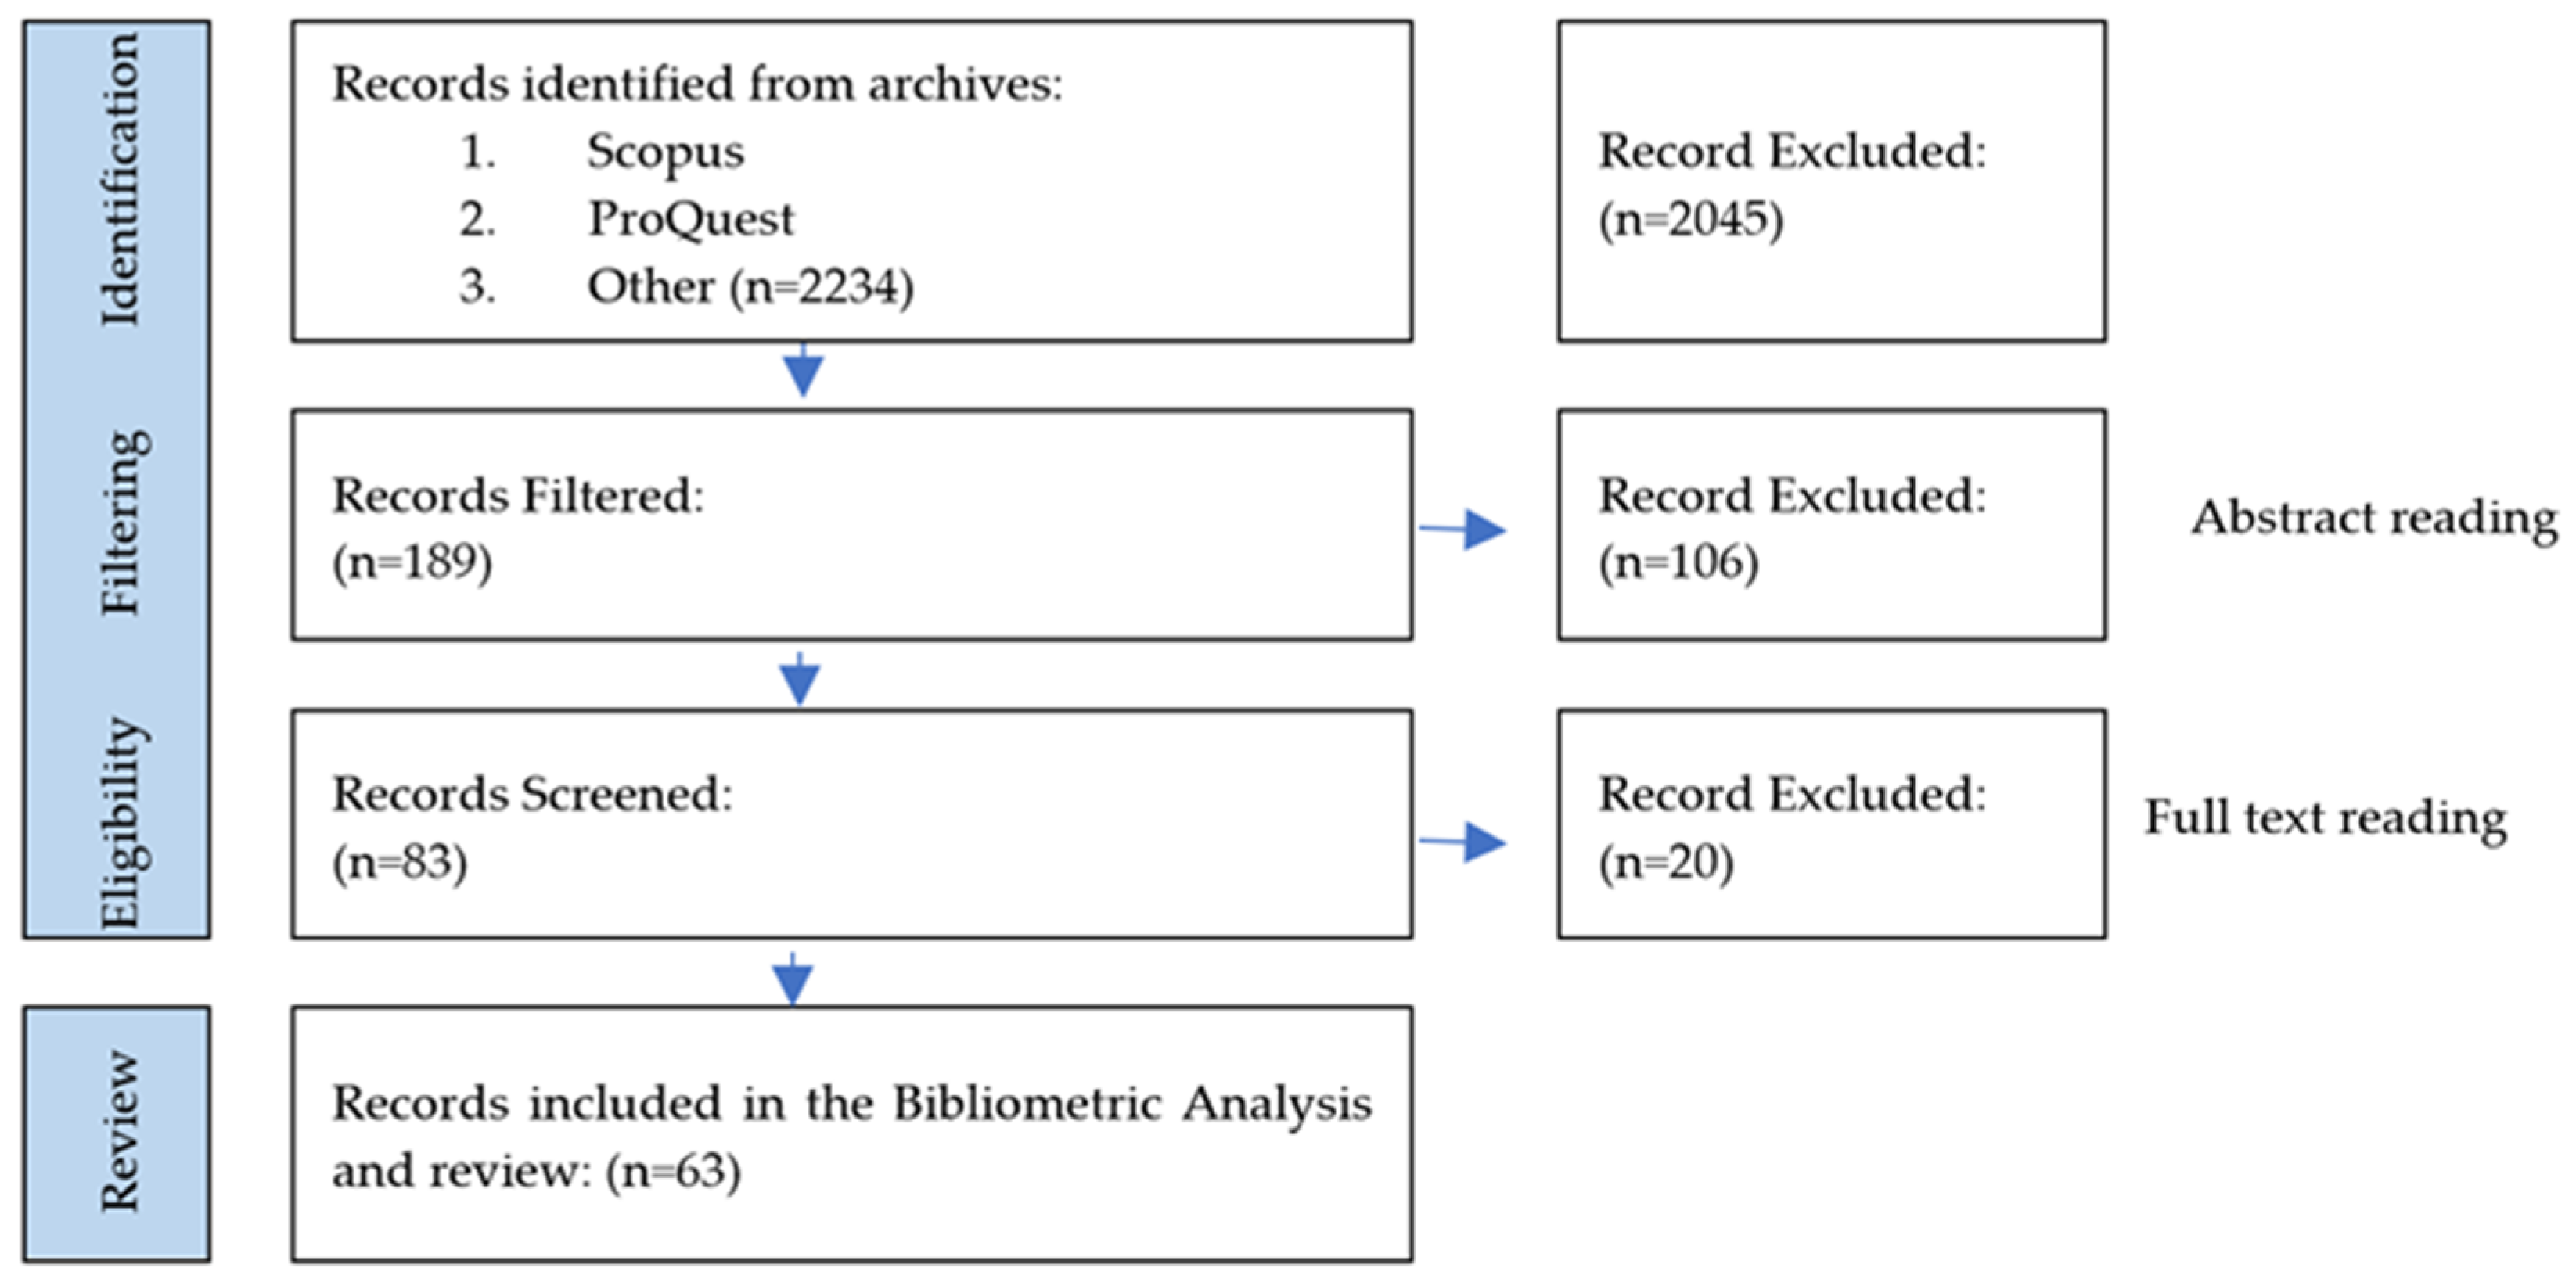
3.1. Study Selection and Bibliometric Analysis
3.2. Classes of Data and DM Methods
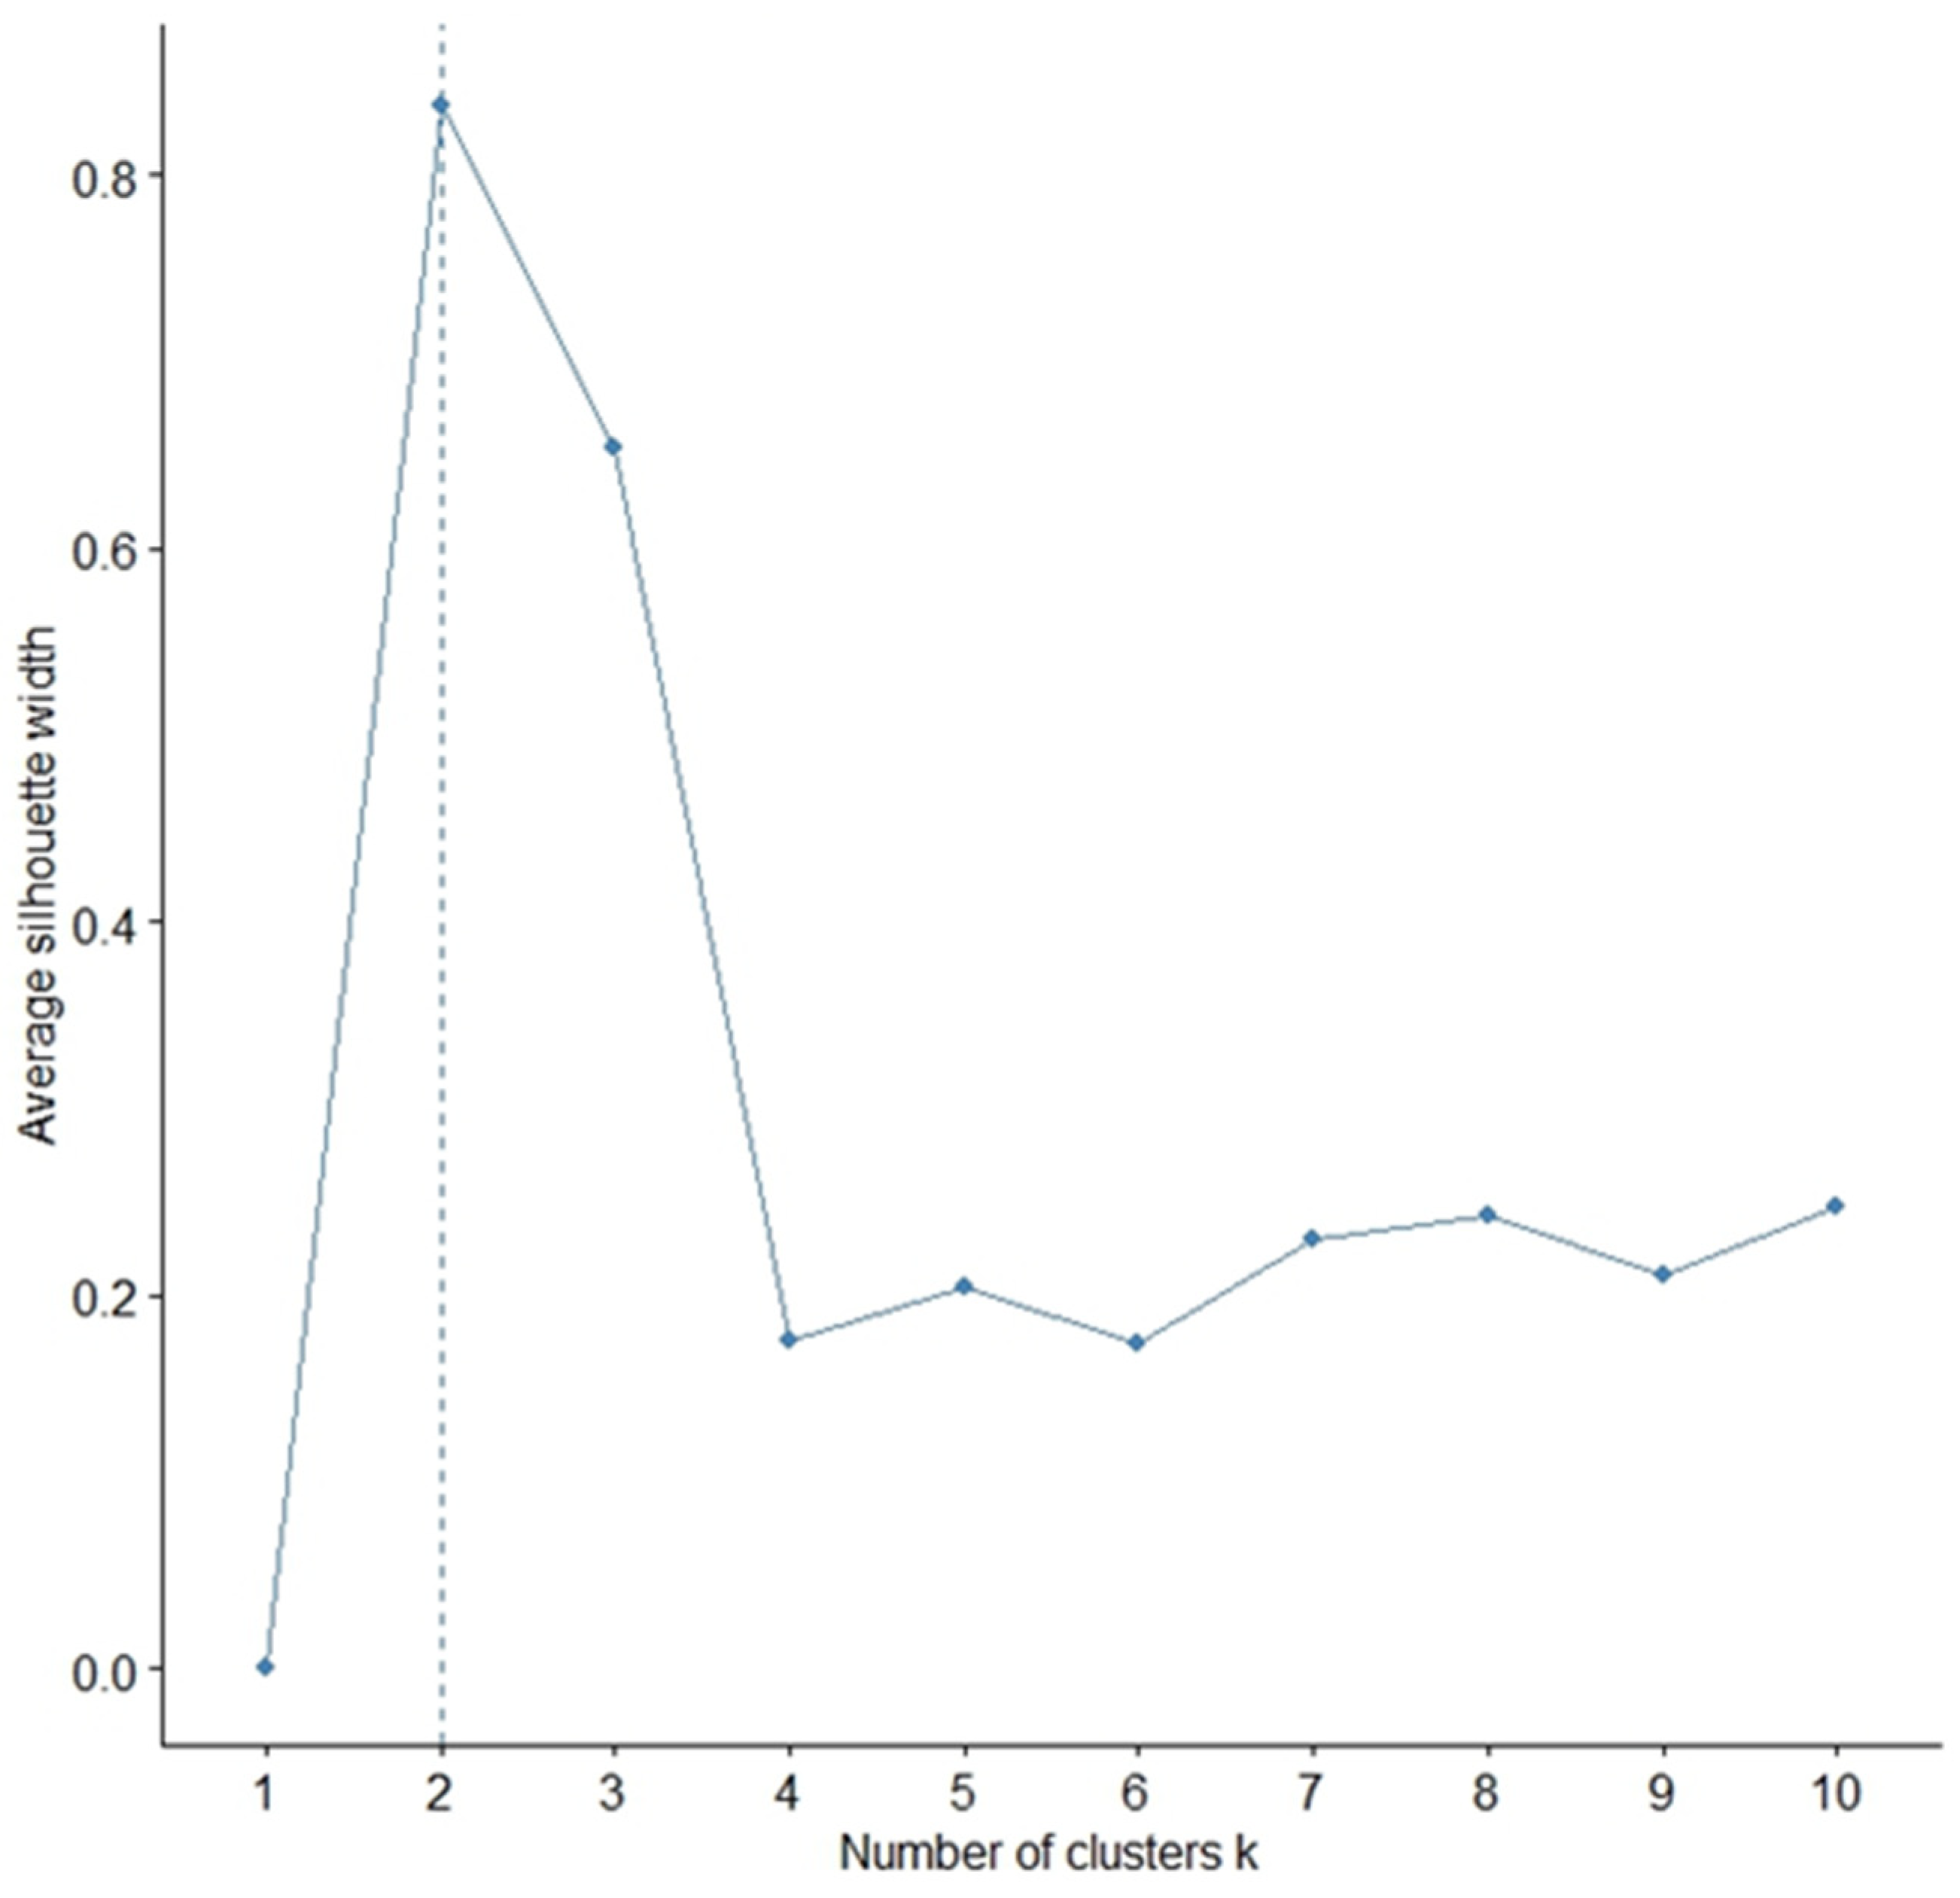
3.3. Cluster Analysis
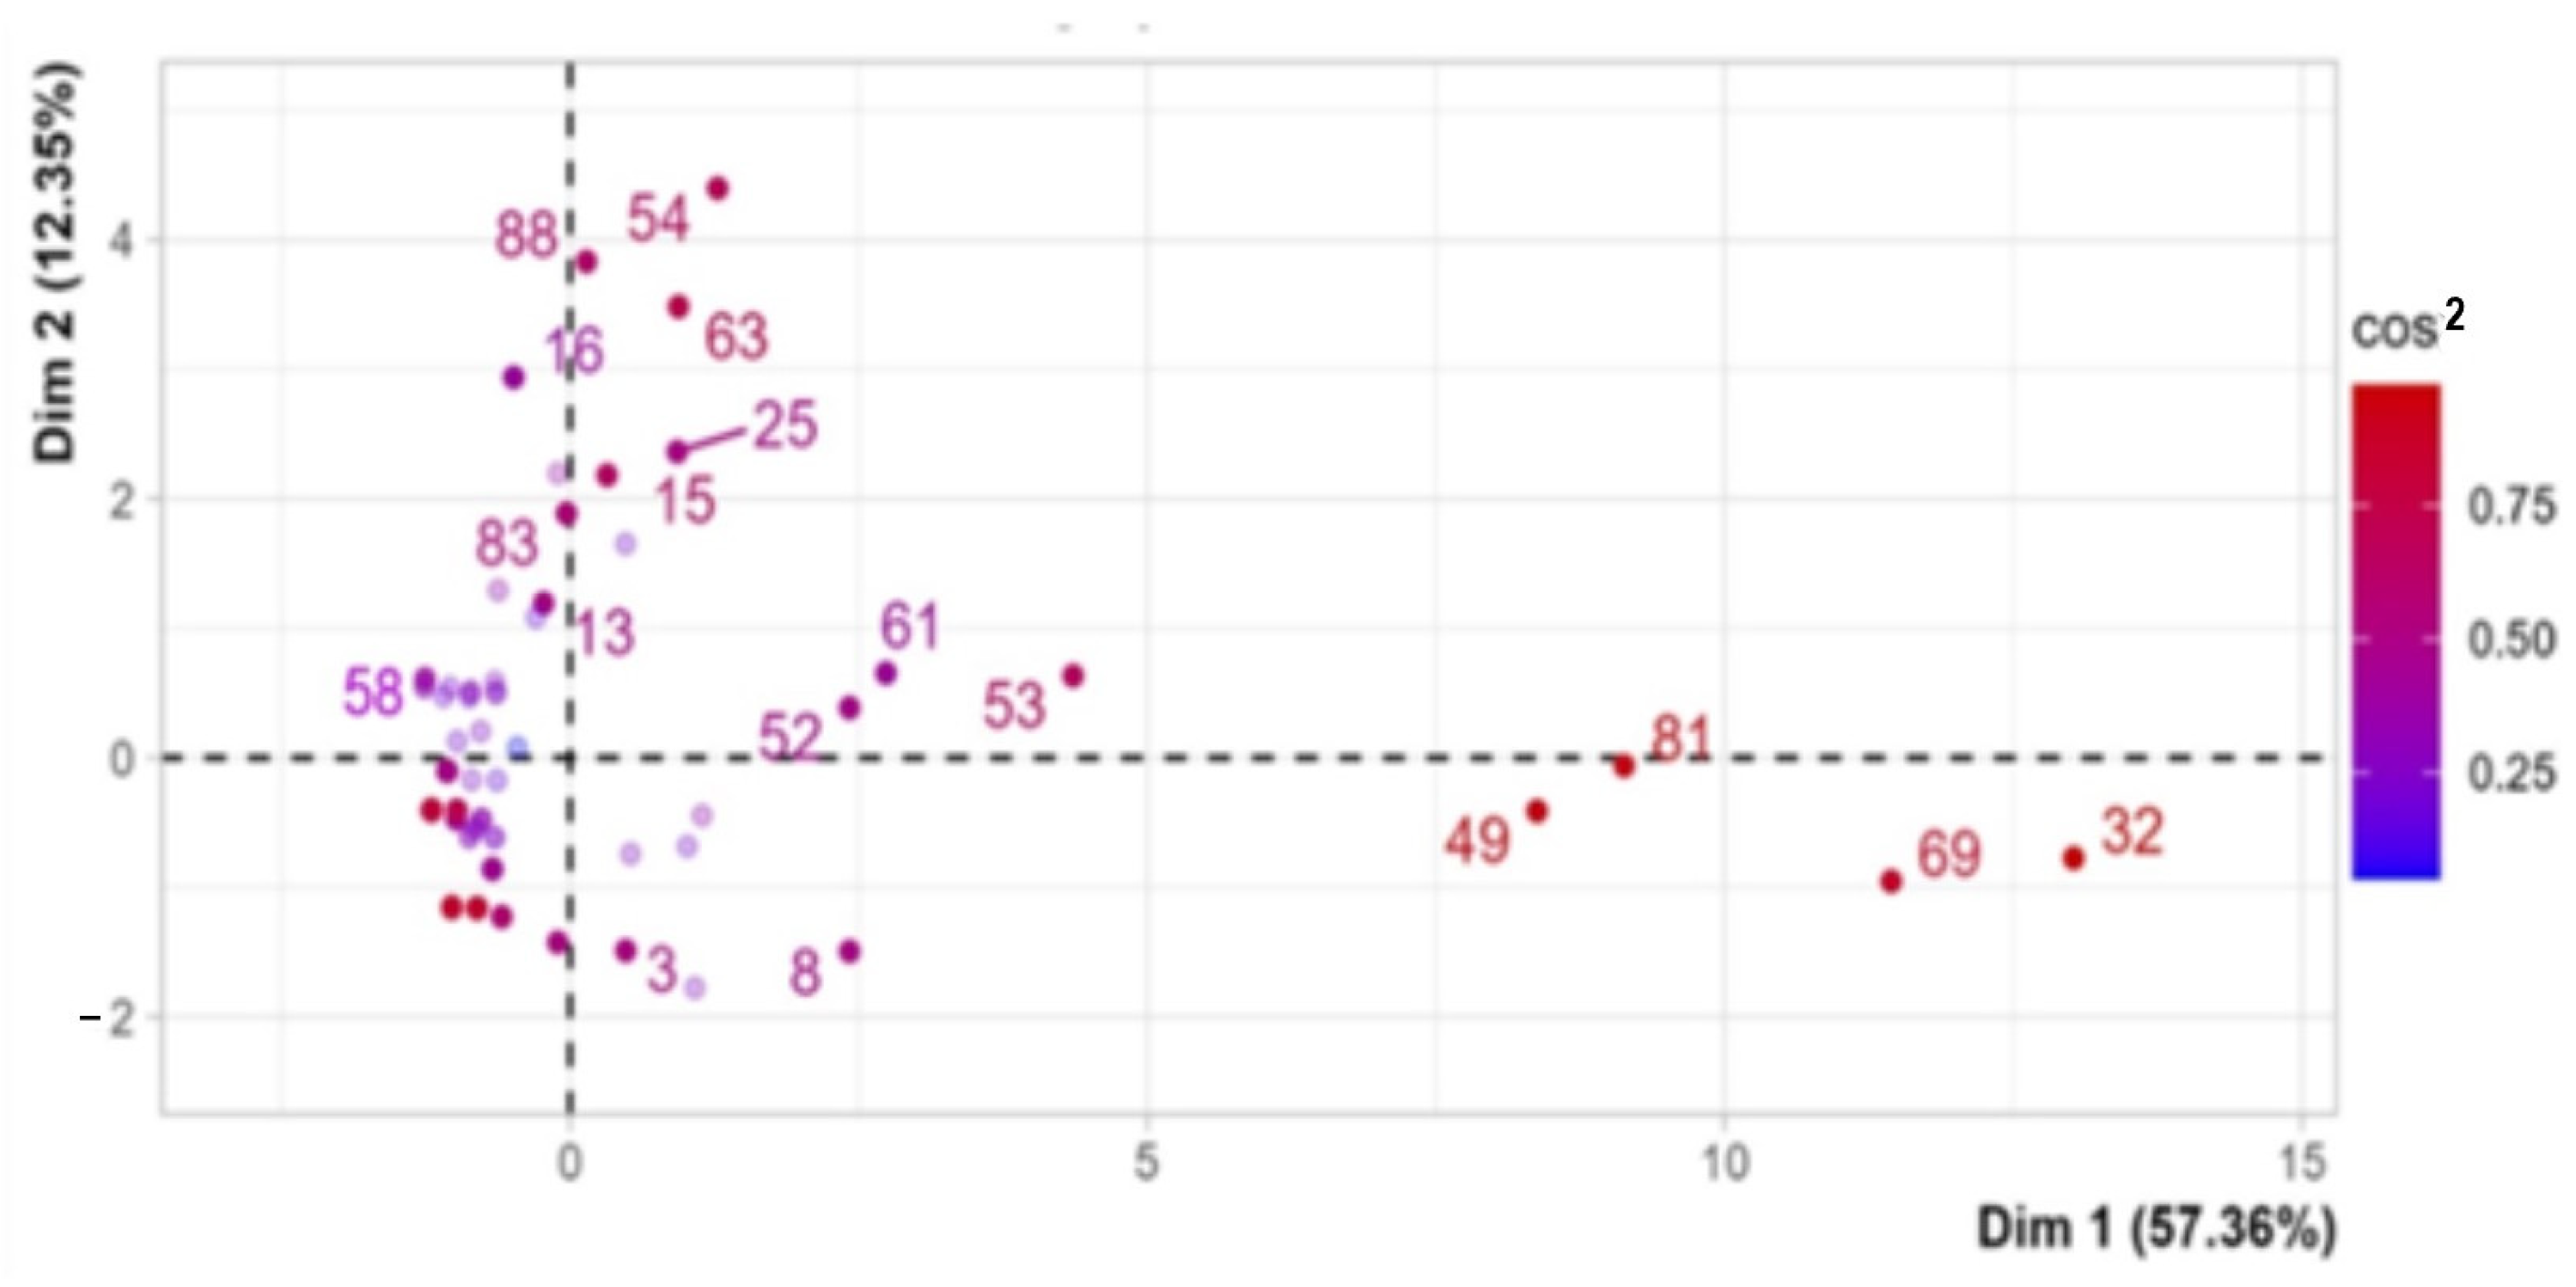
3.4. Principal Component Analysis (PCA)
3.4.1. Inertia Distribution
3.4.2. Axes Descriptions
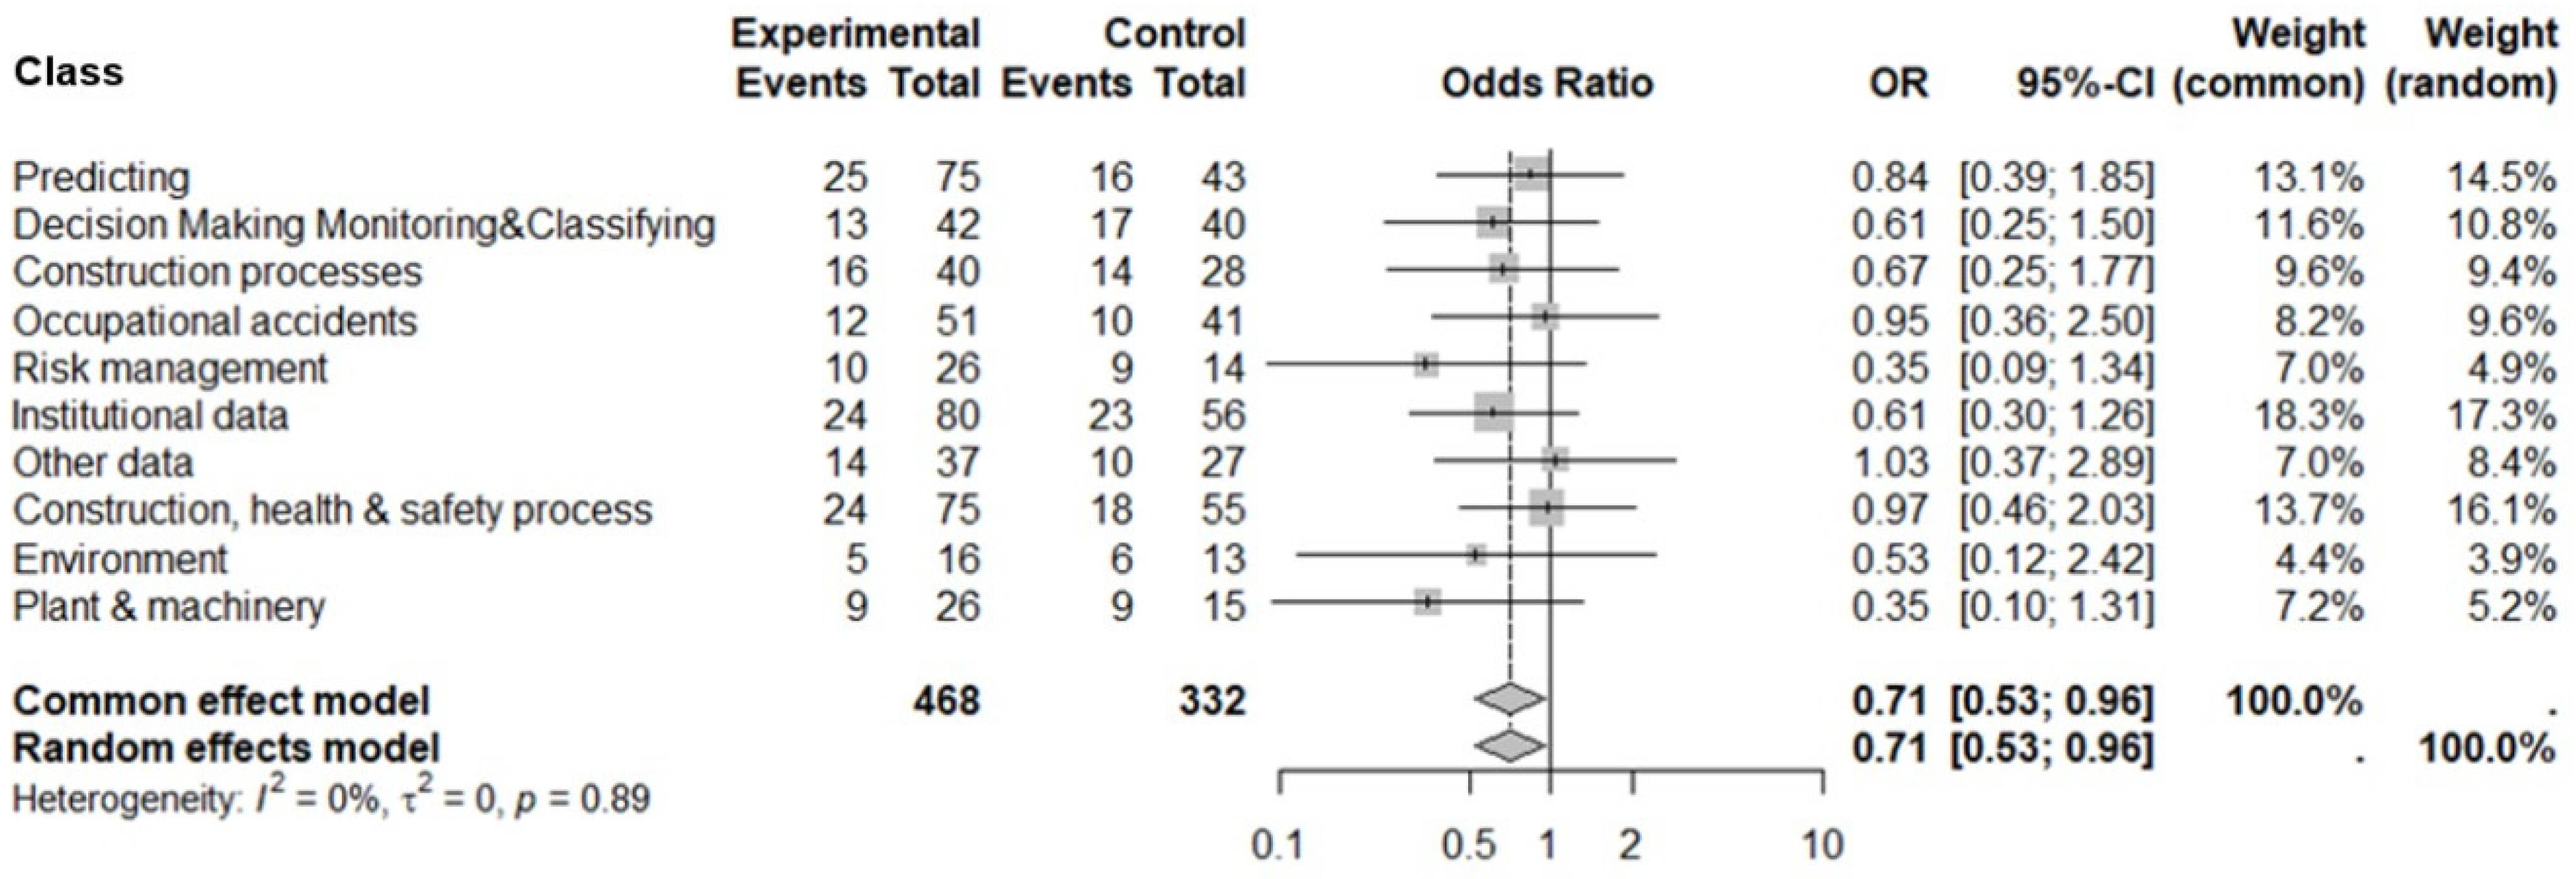
3.5. Meta-Analysis
4. Discussion and Future Directions
5. Conclusions
Author Contributions
Funding
Institutional Review Board Statement
Informed Consent Statement
Conflicts of Interest
Appendix A

| Subject | n. |
|---|---|
| “machine learning” | 526.288 |
| “machine learning” AND work | 122.958 |
| “machine learning” AND work AND safety | 11.752 |
| “machine learning” AND construction AND work OR safety | 2.280 |
| subject area | 2.234 |
| abstract reading | 189 |
| full text reading | 81 |
| selected papers | 63 |
Appendix B
| Country/Region | Class |
|---|---|
| Austria [55], Brazil [57], Cyprus [65], India [71], Iran [54], Iraq [38], Italy [58], Japan [44], Jordan [31], New Zealand [69], Poland [14], Republic of Korea [13], Saudi Arabia [66], Singapore [12], Spain [45], Sweden [25], Taiwan [51], United Arab Emirates [64]. | 1 |
| Australia [34,59], Hong Kong [24,37], Pakistan [32,33], South Korea [16,21], Turkey [3,29], United Kingdom [20,70]. | 2 |
| Malaysia [4,46,48,49,61,67]. | 6 |
| United States [22,23,30,40,47,52,53,56]. | 8 |
| China [2,15,17,18,19,26,27,28,35,36,37,41,42,43,50,60,62,63,68]. | 19 |
Appendix C
| DM Method | DM Method Description | DM Method | DM Method Description |
|---|---|---|---|
| abc | approximate bayesian computation | it2f–ahp | interval type-2 (IT2) fuzzy-analytic hierarchy process |
| adaboost | adaptive boosting (ensemble) | it2fd | interval type-2 (IT2) fuzzy Delphi |
| afdd | automated fault detection and diagnostics | k-means | k-means clustering |
| ahp | analytic hierarchy process | knn | k-nearest neighbour |
| al | ml-based active learning framework | ksvm | support vector machines in kernlab |
| anfis | adaptive neuro-fuzzy inference system | lcca | ml based life-cycle cost analysis |
| ann | artificial neural network | lin r | linear regression |
| ar | augmented reality | log r | logistic regression |
| autokeras | automl system based on keras | lstm | long short-term memory |
| auto-sklearn | automatic scikit-learn | mlaeld | machine learning architecture for excavators’ location detection |
| bagging | bootstrap aggregating | mlp | multilayer perceptron |
| bert | bidirectional encoder represent. for transformers | monte carlo | montecarlo method |
| bi-bert | binarized bidirectional encoder represent. for transformers | mcda-c | multicriteria methodology for decision aiding-constructivist |
| bi-lstm | bi-directional long short-term memory | mosma | multi-objective slime mould algorithm |
| bim | building information modeling | nb | naïve bayes |
| bnn | binarized neural network | nbc | naive bayes classifier |
| bns | bayesian networks | nlp | natural language processing |
| bpnn | back propagation in neural network | nltk | natural language toolkit |
| catboost | gradient boosting on decision trees | onehotencoding | onehotencoding in scikit-learn |
| c-bilstm | convolutional bi-directional long short-term memory | pca | principal components analysis |
| cbow | continuous bag of words | pca-ahp | analytic hierarchy process-principal component analysis) |
| chi-square | chi-square | pls-sem | partial-least-squares structural-equation modeling |
| clustering | clustering | rf | random forest |
| cnn | convolutional neural network | rl | reinforcement learning |
| cpbt | cognitive psychology and bloom’s taxonomy | ros | robot operating system |
| cramer’s v | cramer’s v | sae | sparse autoencorder |
| cv | computer vision process | satellite-based meas. | satellite-based measurements |
| deepar | autoregressive recurrent networks | scibert | scientific bidirectional encoder represent. for transformers |
| dl | deep learning | scikit-learn | key library for pyton programming language |
| dnn | deep neural network | sd | system dynamics |
| dt | decision tree learning | swpl | smart work package learning |
| ebt | ensemble of boosted tree | smote | synthetic minority over-sampling technique |
| ensemble | ensemble | sqp | sequential quadratic programming |
| epsram | ensemble predictive safety risk assessment model | srvm | smooth relevance vector machines |
| faxtext | faxtext | svm | support vector machines |
| ffn | feed-forward neural network | svr | support vector regression |
| flac3d | flac3d | tf-idf | term frequency-inverse document frequency |
| fuz | fuzzy approaches | tokenitation | split sentences into small units |
| gbdt | gradient boosted decision trees | topsis | technique for order of preference by similarity to ideal solution |
| gcn | graph convolutional networks | 3d motion | 3d motion |
| glove | global vectors for words representation | vr | virtual reality |
| gru | gated recurrent unit (recurrent neural network) | wbs-rbs | work breakdown structure-resource breakdown structure |
| hcpc | hierarchical clustering on principal components | word2vec | word2vec (nlp) |
| ica | independent component analysis | yolo-v5 | you only look once |
Appendix D
| Method | F | BM | x1 | x2 | x3 | x4 | x5 | x6 | x7 | x8 | x9 | x10 | x11 | x12 | x13 | x14 | x15 | x16 | x17 | x18 | x19 | x20 |
|---|---|---|---|---|---|---|---|---|---|---|---|---|---|---|---|---|---|---|---|---|---|---|
| abc | 1 | 1 | 0 | 0 | 0 | 1 | 1 | 0 | 0 | 0 | 1 | 0 | 0 | 0 | 0 | 0 | 0 | 1 | 0 | 0 | 0 | 1 |
| adaboost | 3 | 0 | 0 | 0 | 1 | 2 | 1 | 1 | 1 | 0 | 3 | 0 | 0 | 0 | 0 | 0 | 3 | 0 | 0 | 1 | 1 | 3 |
| afdd | 1 | 1 | 0 | 0 | 0 | 1 | 0 | 0 | 1 | 0 | 1 | 0 | 0 | 0 | 0 | 0 | 1 | 0 | 0 | 1 | 0 | 1 |
| ahp | 2 | 2 | 0 | 1 | 0 | 1 | 0 | 1 | 1 | 0 | 2 | 0 | 0 | 0 | 0 | 0 | 0 | 2 | 0 | 0 | 1 | 2 |
| al | 1 | 1 | 0 | 0 | 0 | 1 | 1 | 0 | 0 | 1 | 0 | 0 | 0 | 0 | 0 | 0 | 0 | 0 | 1 | 1 | 0 | 1 |
| anfis | 1 | 1 | 0 | 1 | 0 | 0 | 0 | 0 | 1 | 0 | 0 | 0 | 1 | 0 | 0 | 0 | 1 | 0 | 0 | 1 | 0 | 1 |
| ann | 5 | 4 | 0 | 0 | 0 | 5 | 4 | 1 | 0 | 0 | 4 | 0 | 0 | 0 | 1 | 0 | 5 | 0 | 0 | 1 | 1 | 5 |
| ar | 1 | 0 | 0 | 1 | 0 | 0 | 0 | 1 | 0 | 0 | 0 | 0 | 0 | 0 | 0 | 1 | 0 | 0 | 1 | 1 | 0 | 1 |
| autokeras | 1 | 0 | 0 | 0 | 1 | 0 | 0 | 0 | 1 | 0 | 1 | 0 | 0 | 0 | 0 | 0 | 0 | 0 | 1 | 1 | 0 | 1 |
| auto-sklearn | 1 | 0 | 0 | 0 | 1 | 0 | 0 | 0 | 1 | 0 | 1 | 0 | 0 | 0 | 0 | 0 | 0 | 0 | 1 | 1 | 0 | 1 |
| bagging | 1 | 0 | 0 | 0 | 0 | 1 | 1 | 0 | 0 | 0 | 1 | 0 | 0 | 0 | 0 | 0 | 1 | 0 | 0 | 0 | 1 | 1 |
| bert | 2 | 1 | 1 | 0 | 0 | 1 | 1 | 1 | 0 | 0 | 1 | 0 | 0 | 1 | 0 | 0 | 0 | 2 | 0 | 1 | 1 | 2 |
| bi-bert | 1 | 0 | 0 | 0 | 0 | 1 | 1 | 0 | 0 | 0 | 1 | 0 | 0 | 0 | 0 | 0 | 0 | 1 | 0 | 0 | 1 | 1 |
| bi-lstm | 3 | 1 | 2 | 0 | 0 | 1 | 1 | 2 | 0 | 0 | 2 | 0 | 0 | 1 | 0 | 0 | 0 | 0 | 3 | 2 | 1 | 3 |
| bim | 3 | 1 | 0 | 2 | 0 | 1 | 1 | 1 | 1 | 0 | 2 | 0 | 0 | 0 | 0 | 1 | 0 | 0 | 3 | 1 | 1 | 3 |
| bnn | 1 | 1 | 0 | 0 | 0 | 1 | 1 | 0 | 0 | 1 | 0 | 0 | 0 | 0 | 0 | 0 | 1 | 0 | 0 | 0 | 0 | 1 |
| bns | 1 | 1 | 0 | 0 | 0 | 1 | 0 | 1 | 0 | 0 | 1 | 0 | 0 | 0 | 0 | 0 | 1 | 0 | 0 | 1 | 0 | 1 |
| bpnn | 3 | 3 | 0 | 0 | 0 | 3 | 2 | 0 | 1 | 0 | 2 | 0 | 1 | 0 | 0 | 0 | 3 | 0 | 0 | 2 | 0 | 3 |
| catboost-mo. | 1 | 1 | 1 | 0 | 0 | 0 | 0 | 0 | 1 | 0 | 1 | 0 | 0 | 0 | 0 | 0 | 1 | 0 | 0 | 1 | 0 | 1 |
| c-bilstm | 1 | 1 | 1 | 0 | 0 | 0 | 0 | 1 | 0 | 0 | 0 | 0 | 0 | 1 | 0 | 0 | 0 | 0 | 1 | 1 | 0 | 1 |
| cbow | 1 | 0 | 0 | 0 | 0 | 1 | 0 | 1 | 0 | 0 | 1 | 0 | 0 | 0 | 0 | 0 | 0 | 1 | 0 | 1 | 0 | 1 |
| chi-square | 1 | 0 | 0 | 0 | 0 | 1 | 0 | 1 | 0 | 0 | 1 | 0 | 0 | 0 | 0 | 0 | 0 | 1 | 0 | 1 | 0 | 1 |
| clustering | 1 | 0 | 0 | 0 | 0 | 1 | 0 | 1 | 0 | 0 | 1 | 0 | 0 | 0 | 0 | 0 | 0 | 1 | 0 | 1 | 0 | 1 |
| cnn | 4 | 1 | 1 | 0 | 1 | 2 | 3 | 1 | 0 | 0 | 3 | 0 | 0 | 1 | 0 | 0 | 0 | 0 | 4 | 1 | 0 | 4 |
| cpbt | 1 | 1 | 0 | 1 | 0 | 0 | 0 | 1 | 0 | 0 | 1 | 0 | 0 | 0 | 0 | 0 | 0 | 0 | 1 | 1 | 0 | 1 |
| cramer’s v | 2 | 0 | 0 | 0 | 1 | 1 | 0 | 1 | 1 | 0 | 2 | 0 | 0 | 0 | 0 | 0 | 0 | 2 | 0 | 1 | 0 | 2 |
| cv | 2 | 2 | 0 | 0 | 2 | 0 | 0 | 0 | 2 | 0 | 0 | 0 | 0 | 0 | 2 | 0 | 2 | 0 | 0 | 1 | 0 | 2 |
| deepar | 1 | 1 | 0 | 0 | 0 | 1 | 1 | 0 | 0 | 0 | 1 | 0 | 0 | 0 | 0 | 0 | 1 | 0 | 0 | 1 | 0 | 1 |
| dl | 1 | 0 | 1 | 0 | 0 | 0 | 0 | 0 | 1 | 0 | 0 | 0 | 0 | 0 | 1 | 0 | 0 | 0 | 1 | 1 | 0 | 1 |
| dnn | 2 | 1 | 0 | 0 | 0 | 2 | 1 | 1 | 0 | 1 | 1 | 0 | 1 | 1 | 0 | 0 | 2 | 0 | 0 | 1 | 1 | 2 |
| dt | 20 | 3 | 4 | 1 | 3 | 13 | 9 | 8 | 4 | 1 | 1 | 13 | 0 | 1 | 4 | 0 | 20 | 0 | 0 | 2 | 0 | 20 |
| ebt | 1 | 0 | 0 | 0 | 0 | 1 | 0 | 1 | 0 | 0 | 1 | 0 | 0 | 0 | 0 | 0 | 1 | 0 | 0 | 1 | 0 | 1 |
| ensemble | 3 | 2 | 1 | 0 | 0 | 2 | 0 | 2 | 1 | 1 | 1 | 0 | 0 | 1 | 0 | 0 | 3 | 0 | 0 | 12 | 2 | 3 |
| epsram | 1 | 0 | 0 | 1 | 0 | 0 | 0 | 0 | 1 | 0 | 0 | 0 | 1 | 0 | 0 | 0 | 1 | 0 | 0 | 2 | 1 | 1 |
| faxtext | 1 | 0 | 0 | 0 | 0 | 1 | 1 | 0 | 0 | 0 | 1 | 0 | 0 | 0 | 0 | 0 | 0 | 0 | 1 | 1 | 0 | 1 |
| ffn | 1 | 0 | 0 | 0 | 0 | 1 | 0 | 0 | 1 | 0 | 1 | 0 | 0 | 0 | 0 | 0 | 1 | 0 | 0 | 0 | 1 | 1 |
| flac3d | 1 | 1 | 0 | 0 | 0 | 1 | 1 | 0 | 0 | 0 | 0 | 0 | 0 | 0 | 0 | 1 | 0 | 0 | 1 | 1 | 0 | 1 |
| fuzzy appr. | 1 | 1 | 0 | 1 | 0 | 0 | 0 | 0 | 1 | 0 | 1 | 0 | 0 | 0 | 0 | 0 | 0 | 1 | 0 | 0 | 0 | 1 |
| gbdt | 3 | 1 | 0 | 0 | 1 | 2 | 1 | 1 | 1 | 0 | 3 | 0 | 0 | 0 | 0 | 0 | 2 | 1 | 0 | 1 | 0 | 3 |
| gcn | 1 | 1 | 0 | 0 | 0 | 1 | 0 | 0 | 1 | 0 | 1 | 0 | 0 | 0 | 0 | 0 | 0 | 0 | 1 | 1 | 1 | 1 |
| glove | 1 | 0 | 0 | 0 | 0 | 1 | 1 | 0 | 0 | 0 | 1 | 0 | 0 | 0 | 0 | 0 | 0 | 1 | 0 | 1 | 0 | 1 |
| gru | 1 | 1 | 1 | 0 | 0 | 0 | 0 | 1 | 0 | 0 | 1 | 0 | 0 | 0 | 0 | 0 | 1 | 0 | 0 | 0 | 1 | 1 |
| hcpc | 1 | 1 | 0 | 0 | 0 | 1 | 0 | 1 | 0 | 0 | 1 | 0 | 0 | 0 | 0 | 0 | 0 | 1 | 0 | 1 | 0 | 1 |
| ica | 1 | 0 | 0 | 0 | 0 | 1 | 1 | 0 | 0 | 0 | 1 | 0 | 0 | 0 | 0 | 0 | 0 | 1 | 0 | 1 | 0 | 1 |
| it2f–ahp | 1 | 1 | 0 | 1 | 0 | 0 | 0 | 1 | 0 | 0 | 0 | 0 | 0 | 0 | 0 | 1 | 0 | 1 | 0 | 0 | 0 | 1 |
| it2fd | 1 | 0 | 0 | 1 | 0 | 0 | 0 | 1 | 0 | 0 | 0 | 0 | 0 | 0 | 0 | 1 | 0 | 1 | 0 | 1 | 0 | 1 |
| k-means | 1 | 1 | 0 | 0 | 0 | 1 | 0 | 1 | 0 | 0 | 1 | 0 | 0 | 0 | 0 | 0 | 0 | 1 | 0 | 1 | 0 | 1 |
| knn | 13 | 1 | 3 | 0 | 2 | 8 | 5 | 6 | 2 | 0 | 8 | 0 | 0 | 2 | 3 | 0 | 13 | 0 | 0 | 1 | 0 | 13 |
| ksvm | 1 | 1 | 0 | 0 | 0 | 1 | 1 | 0 | 0 | 0 | 1 | 0 | 0 | 0 | 0 | 0 | 1 | 0 | 0 | 8 | 1 | 1 |
| lcca | 1 | 0 | 0 | 0 | 0 | 1 | 0 | 1 | 0 | 0 | 1 | 0 | 0 | 0 | 0 | 0 | 0 | 1 | 0 | 0 | 0 | 1 |
| lin_r | 6 | 1 | 1 | 1 | 0 | 4 | 1 | 3 | 2 | 0 | 4 | 0 | 1 | 0 | 1 | 0 | 6 | 0 | 0 | 1 | 0 | 6 |
| log_r | 7 | 1 | 4 | 0 | 1 | 3 | 1 | 5 | 2 | 0 | 6 | 0 | 0 | 2 | 0 | 0 | 7 | 0 | 0 | 1 | 0 | 7 |
| lstm | 4 | 1 | 3 | 0 | 0 | 1 | 0 | 4 | 0 | 0 | 1 | 0 | 0 | 3 | 0 | 0 | 0 | 0 | 4 | 4 | 0 | 4 |
| mlaeld | 1 | 0 | 0 | 0 | 0 | 1 | 1 | 0 | 0 | 0 | 0 | 0 | 0 | 0 | 1 | 0 | 0 | 0 | 1 | 6 | 1 | 1 |
| mlp | 1 | 0 | 0 | 0 | 0 | 1 | 1 | 0 | 0 | 0 | 1 | 0 | 0 | 0 | 0 | 0 | 1 | 0 | 0 | 4 | 0 | 1 |
| montecarlo | 1 | 1 | 0 | 0 | 0 | 1 | 1 | 0 | 0 | 0 | 1 | 0 | 0 | 0 | 0 | 0 | 0 | 1 | 0 | 1 | 0 | 1 |
| mcda-c | 1 | 1 | 0 | 1 | 0 | 0 | 0 | 0 | 1 | 0 | 1 | 0 | 0 | 0 | 0 | 0 | 0 | 1 | 0 | 0 | 0 | 1 |
| mosma | 1 | 0 | 0 | 0 | 0 | 1 | 0 | 1 | 0 | 0 | 1 | 0 | 0 | 0 | 0 | 0 | 1 | 0 | 0 | 0 | 1 | 1 |
| nb | 3 | 1 | 0 | 0 | 1 | 2 | 1 | 1 | 1 | 1 | 0 | 2 | 0 | 0 | 0 | 0 | 3 | 0 | 0 | 1 | 0 | 3 |
| nbc | 6 | 0 | 3 | 0 | 0 | 3 | 3 | 3 | 0 | 0 | 4 | 0 | 0 | 2 | 0 | 0 | 6 | 0 | 0 | 2 | 0 | 6 |
| nd | 2 | 2 | 0 | 1 | 1 | 0 | 1 | 0 | 1 | 0 | 2 | 0 | 0 | 0 | 0 | 0 | 0 | 0 | 2 | 4 | 1 | 2 |
| nlp | 4 | 1 | 2 | 0 | 0 | 2 | 0 | 4 | 0 | 0 | 2 | 0 | 0 | 2 | 0 | 0 | 0 | 4 | 0 | 1 | 0 | 4 |
| nltk | 1 | 0 | 1 | 0 | 0 | 0 | 0 | 1 | 0 | 0 | 0 | 0 | 0 | 1 | 0 | 0 | 0 | 1 | 0 | 4 | 0 | 1 |
| one hot enc. | 2 | 0 | 1 | 0 | 0 | 1 | 0 | 1 | 1 | 0 | 2 | 0 | 0 | 0 | 0 | 0 | 0 | 2 | 0 | 1 | 0 | 2 |
| pca | 5 | 2 | 0 | 0 | 0 | 5 | 2 | 3 | 0 | 1 | 1 | 4 | 1 | 0 | 0 | 0 | 0 | 5 | 0 | 3 | 0 | 5 |
| pca-ahp | 1 | 1 | 0 | 0 | 0 | 1 | 1 | 0 | 0 | 0 | 0 | 0 | 1 | 0 | 0 | 0 | 0 | 1 | 0 | 3 | 0 | 1 |
| pls-sem | 1 | 1 | 0 | 0 | 1 | 0 | 0 | 0 | 1 | 0 | 1 | 0 | 0 | 0 | 0 | 0 | 0 | 1 | 0 | 1 | 0 | 1 |
| rf | 15 | 9 | 4 | 0 | 2 | 9 | 5 | 6 | 4 | 0 | 10 | 0 | 0 | 1 | 4 | 0 | 15 | 0 | 0 | 0 | 1 | 15 |
| rl | 1 | 1 | 0 | 1 | 0 | 0 | 1 | 0 | 0 | 0 | 1 | 0 | 0 | 0 | 0 | 0 | 0 | 0 | 1 | 9 | 2 | 1 |
| ros | 1 | 0 | 0 | 0 | 0 | 1 | 0 | 1 | 0 | 0 | 1 | 0 | 0 | 0 | 0 | 0 | 0 | 0 | 1 | 0 | 0 | 1 |
| sae | 1 | 0 | 0 | 0 | 0 | 1 | 1 | 0 | 0 | 0 | 1 | 0 | 0 | 0 | 0 | 0 | 0 | 1 | 0 | 1 | 0 | 1 |
| satellite-based meas. | 1 | 1 | 0 | 0 | 0 | 1 | 1 | 0 | 0 | 0 | 1 | 0 | 0 | 0 | 0 | 0 | 0 | 0 | 1 | 0 | 0 | 1 |
| scibert | 1 | 0 | 0 | 0 | 0 | 1 | 1 | 0 | 0 | 0 | 1 | 0 | 0 | 0 | 0 | 0 | 0 | 1 | 0 | 0 | 0 | 1 |
| scikit-learn | 1 | 0 | 1 | 0 | 0 | 0 | 0 | 1 | 0 | 0 | 1 | 0 | 0 | 0 | 0 | 0 | 0 | 0 | 1 | 0 | 1 | 1 |
| sd | 1 | 1 | 0 | 0 | 0 | 1 | 1 | 0 | 0 | 1 | 0 | 0 | 0 | 0 | 0 | 0 | 0 | 1 | 0 | 1 | 0 | 1 |
| swpl | 1 | 1 | 1 | 0 | 0 | 0 | 0 | 0 | 1 | 0 | 0 | 0 | 0 | 0 | 1 | 0 | 0 | 0 | 1 | 0 | 0 | 1 |
| smote | 1 | 0 | 1 | 0 | 0 | 0 | 0 | 0 | 1 | 0 | 1 | 0 | 0 | 0 | 0 | 0 | 0 | 0 | 1 | 1 | 0 | 1 |
| sqp | 1 | 0 | 1 | 0 | 0 | 0 | 0 | 1 | 0 | 0 | 0 | 0 | 0 | 1 | 0 | 0 | 0 | 1 | 0 | 1 | 0 | 1 |
| srvm | 1 | 1 | 0 | 0 | 0 | 1 | 1 | 0 | 0 | 1 | 0 | 0 | 0 | 0 | 0 | 0 | 1 | 0 | 0 | 0 | 0 | 1 |
| svm | 15 | 2 | 4 | 0 | 2 | 8 | 3 | 8 | 3 | 0 | 11 | 0 | 0 | 2 | 1 | 0 | 15 | 0 | 0 | 10 | 2 | 15 |
| svr | 1 | 0 | 0 | 0 | 0 | 1 | 0 | 1 | 0 | 0 | 0 | 0 | 0 | 1 | 0 | 0 | 1 | 0 | 0 | 1 | 0 | 1 |
| tf-idf | 3 | 0 | 1 | 0 | 0 | 2 | 1 | 2 | 0 | 0 | 2 | 0 | 0 | 1 | 0 | 0 | 0 | 3 | 0 | 1 | 0 | 3 |
| tokenitation | 1 | 0 | 1 | 0 | 0 | 0 | 0 | 1 | 0 | 0 | 1 | 0 | 0 | 0 | 0 | 0 | 0 | 1 | 0 | 3 | 1 | 1 |
| topsis | 1 | 0 | 0 | 0 | 0 | 1 | 1 | 0 | 0 | 0 | 1 | 0 | 0 | 0 | 0 | 0 | 0 | 1 | 0 | 1 | 0 | 1 |
| 3d motion | 1 | 1 | 0 | 0 | 1 | 0 | 0 | 1 | 0 | 0 | 0 | 0 | 0 | 0 | 1 | 0 | 0 | 0 | 1 | 1 | 0 | 1 |
| vr | 3 | 0 | 1 | 1 | 0 | 0 | 0 | 0 | 0 | 0 | 2 | 0 | 0 | 0 | 0 | 2 | 0 | 2 | 1 | 0 | 1 | 3 |
| wbs-rbs | 1 | 1 | 1 | 0 | 0 | 0 | 0 | 0 | 1 | 0 | 0 | 0 | 1 | 0 | 0 | 0 | 0 | 1 | 0 | 1 | 0 | 1 |
| word2vec | 4 | 2 | 1 | 2 | 0 | 0 | 0 | 2 | 0 | 1 | 0 | 0 | 0 | 1 | 0 | 0 | 1 | 3 | 0 | 1 | 0 | 4 |
| yolo-v5 | 2 | 0 | 0 | 0 | 1 | 0 | 0 | 1 | 0 | 0 | 0 | 0 | 0 | 0 | 0 | 0 | 0 | 1 | 1 | 2 | 1 | 2 |
Appendix E
| Variable | x1 | x2 | x3 | x4 | x5 | x6 | x7 | x8 | x9 | x10 | x11 | x12 | x13 | x14 | x15 | x16 | x17 | x18 | x19 | x20 |
|---|---|---|---|---|---|---|---|---|---|---|---|---|---|---|---|---|---|---|---|---|
| x1 | 1.0 | −0.1 | 0.5 | 0.7 | 0.6 | 0.9 | 0.6 | −0.1 | 0.4 | 0.8 | −0.1 | 0.8 | 0.6 | −0.1 | 0.8 | 0.0 | 0.1 | 0.2 | 0.1 | 0.0 |
| x2 | −0.1 | 1.0 | −0.1 | −0.2 | −0.2 | −0.1 | 0.1 | 0.1 | −0.1 | −0.1 | 0.2 | −0.1 | −0.1 | 0.5 | −0.1 | 0.1 | 0.2 | 0.0 | 0.1 | 0.2 |
| x3 | 0.5 | −0.1 | 1.0 | 0.6 | 0.6 | 0.6 | 0.7 | −0.1 | 0.5 | 0.7 | −0.1 | 0.3 | 0.7 | −0.1 | 0.7 | −0.2 | 0.0 | 0.1 | 0.1 | −0.1 |
| x4 | 0.7 | −0.2 | 0.6 | 1.0 | 0.9 | 0.8 | 0.6 | 0.0 | 0.6 | 0.9 | 0.0 | 0.4 | 0.8 | −0.1 | 0.9 | −0.1 | −0.2 | 0.1 | 0.1 | 0.0 |
| x5 | 0.6 | −0.2 | 0.6 | 0.9 | 1.0 | 0.6 | 0.5 | 0.0 | 0.6 | 0.8 | 0.0 | 0.3 | 0.8 | −0.1 | 0.8 | −0.2 | 0.0 | 0.1 | 0.1 | 0.0 |
| x6 | 0.9 | −0.1 | 0.6 | 0.8 | 0.6 | 1.0 | 0.6 | −0.1 | 0.5 | 0.9 | −0.1 | 0.7 | 0.6 | −0.1 | 0.8 | 0.1 | 0.0 | 0.2 | 0.1 | 0.0 |
| x7 | 0.6 | 0.1 | 0.7 | 0.6 | 0.5 | 0.6 | 1.0 | −0.1 | 0.3 | 0.7 | 0.2 | 0.2 | 0.7 | −0.1 | 0.8 | −0.2 | −0.1 | 0.1 | 0.2 | 0.0 |
| x8 | −0.1 | 0.1 | −0.1 | 0.0 | 0.0 | −0.1 | −0.1 | 1.0 | 0.0 | −0.2 | −0.1 | 0.0 | −0.1 | −0.1 | 0.0 | 0.0 | −0.1 | 0.1 | 0.0 | 0.2 |
| x9 | 0.4 | −0.1 | 0.5 | 0.6 | 0.6 | 0.5 | 0.3 | 0.0 | 1.0 | 0.5 | 0.0 | 0.1 | 0.6 | 0.0 | 0.6 | −0.1 | −0.1 | 0.0 | −0.1 | −0.1 |
| x10 | 0.8 | −0.1 | 0.7 | 0.9 | 0.8 | 0.9 | 0.7 | −0.2 | 0.5 | 1.0 | −0.1 | 0.5 | 0.7 | −0.1 | 0.9 | −0.1 | −0.1 | 0.1 | 0.2 | 0.0 |
| x11 | −0.1 | 0.2 | −0.1 | 0.0 | 0.0 | −0.1 | 0.2 | −0.1 | 0.0 | −0.1 | 1.0 | −0.1 | 0.0 | −0.1 | 0.0 | −0.1 | −0.1 | 0.0 | −0.1 | 0.0 |
| x12 | 0.8 | −0.1 | 0.3 | 0.4 | 0.3 | 0.7 | 0.2 | 0.0 | 0.1 | 0.5 | −0.1 | 1.0 | 0.3 | −0.1 | 0.5 | 0.1 | 0.2 | 0.3 | 0.1 | 0.0 |
| x13 | 0.6 | −0.1 | 0.7 | 0.8 | 0.8 | 0.6 | 0.7 | −0.1 | 0.6 | 0.7 | 0.0 | 0.3 | 1.0 | −0.1 | 0.8 | −0.2 | −0.1 | 0.0 | 0.1 | 0.0 |
| x14 | −0.1 | 0.5 | −0.1 | −0.1 | −0.1 | −0.1 | −0.1 | −0.1 | 0.0 | −0.1 | −0.1 | −0.1 | −0.1 | 1.0 | −0.1 | 0.1 | 0.2 | −0.1 | 0.1 | −0.1 |
| x15 | 0.8 | −0.1 | 0.7 | 0.9 | 0.8 | 0.8 | 0.8 | 0.0 | 0.6 | 0.9 | 0.0 | 0.5 | 0.8 | −0.1 | 1.0 | −0.2 | −0.2 | 0.2 | 0.2 | 0.1 |
| x16 | 0.0 | 0.1 | −0.2 | −0.1 | −0.2 | 0.1 | −0.2 | 0.0 | −0.1 | −0.1 | −0.1 | 0.1 | −0.2 | 0.1 | −0.2 | 1.0 | −0.3 | −0.1 | −0.2 | −0.2 |
| x17 | 0.1 | 0.2 | 0.0 | −0.2 | 0.0 | 0.0 | −0.1 | −0.1 | −0.1 | −0.1 | −0.1 | 0.2 | −0.1 | 0.2 | −0.2 | −0.3 | 1.0 | 0.1 | 0.1 | 0.1 |
| x18 | 0.2 | 0.0 | 0.1 | 0.1 | 0.1 | 0.2 | 0.1 | 0.1 | 0.0 | 0.1 | 0.0 | 0.3 | 0.0 | −0.1 | 0.2 | −0.1 | 0.1 | 1.0 | 0.5 | 0.6 |
| x19 | 0.1 | 0.1 | 0.1 | 0.1 | 0.1 | 0.1 | 0.2 | 0.0 | −0.1 | 0.2 | −0.1 | 0.1 | 0.1 | 0.1 | 0.2 | −0.2 | 0.1 | 0.5 | 1.0 | 0.4 |
| x20 | 0.0 | 0.2 | −0.1 | 0.0 | 0.0 | 0.0 | 0.0 | 0.2 | −0.1 | 0.0 | 0.0 | 0.0 | 0.0 | −0.1 | 0.1 | −0.2 | 0.1 | 0.6 | 0.4 | 1.0 |
Appendix F
| Reference | x1 | x2 | x3 | x4 | x5 | x6 | x7 | x8 | x9 | x10 | x11 | x12 | x13 | x14 | x15 | x16 | x17 | x18 | x19 | x20 |
|---|---|---|---|---|---|---|---|---|---|---|---|---|---|---|---|---|---|---|---|---|
| [2] | 0 | 0 | 0 | 1 | 1 | 0 | 0 | 0 | 0 | 0 | 1 | 0 | 0 | 0 | 0 | 1 | 0 | 1 | 0 | 0 |
| [3] | 0 | 0 | 0 | 1 | 0 | 0 | 1 | 0 | 1 | 0 | 0 | 0 | 0 | 0 | 1 | 0 | 1 | 1 | 0 | 0 |
| [4] | 0 | 0 | 1 | 0 | 1 | 0 | 0 | 0 | 0 | 1 | 0 | 0 | 0 | 0 | 1 | 0 | 0 | 1 | 0 | 0 |
| [38] | 0 | 0 | 0 | 1 | 1 | 0 | 0 | 0 | 1 | 0 | 0 | 0 | 0 | 0 | 2 | 0 | 0 | 1 | 0 | 0 |
| [21] | 0 | 0 | 1 | 0 | 1 | 0 | 0 | 0 | 0 | 0 | 0 | 0 | 1 | 0 | 4 | 0 | 0 | 0 | 0 | 1 |
| [41] | 1 | 0 | 0 | 0 | 0 | 0 | 1 | 0 | 0 | 0 | 0 | 0 | 1 | 0 | 2 | 0 | 0 | 0 | 0 | 1 |
| [45] | 0 | 1 | 0 | 0 | 1 | 0 | 0 | 0 | 0 | 0 | 0 | 0 | 0 | 1 | 0 | 0 | 2 | 0 | 0 | 1 |
| [13] | 0 | 0 | 1 | 0 | 0 | 0 | 1 | 0 | 1 | 0 | 0 | 0 | 0 | 0 | 1 | 0 | 0 | 0 | 0 | 1 |
| [44] | 0 | 1 | 0 | 0 | 1 | 0 | 0 | 0 | 1 | 0 | 0 | 0 | 0 | 0 | 0 | 0 | 1 | 0 | 0 | 1 |
| [50] | 0 | 0 | 0 | 1 | 0 | 1 | 0 | 0 | 1 | 0 | 0 | 0 | 0 | 0 | 0 | 1 | 0 | 0 | 0 | 1 |
| [24] | 0 | 0 | 1 | 0 | 0 | 1 | 0 | 0 | 1 | 0 | 0 | 0 | 0 | 0 | 0 | 0 | 1 | 1 | 0 | 0 |
| [55] | 0 | 0 | 0 | 1 | 0 | 0 | 1 | 1 | 0 | 0 | 0 | 0 | 0 | 0 | 1 | 0 | 0 | 0 | 1 | 0 |
| [51] | 0 | 0 | 0 | 1 | 1 | 0 | 0 | 0 | 1 | 0 | 0 | 0 | 0 | 0 | 6 | 6 | 2 | 0 | 1 | 0 |
| [56] | 0 | 0 | 0 | 1 | 1 | 0 | 0 | 1 | 0 | 0 | 0 | 0 | 0 | 0 | 0 | 0 | 1 | 1 | 0 | 0 |
| [58] | 0 | 0 | 0 | 1 | 1 | 0 | 0 | 0 | 0 | 0 | 0 | 0 | 0 | 1 | 0 | 0 | 1 | 0 | 0 | 1 |
| [42] | 0 | 0 | 0 | 1 | 1 | 0 | 0 | 0 | 1 | 0 | 0 | 0 | 0 | 0 | 2 | 0 | 1 | 0 | 0 | 1 |
| [37] | 0 | 0 | 1 | 0 | 1 | 0 | 0 | 0 | 1 | 0 | 0 | 0 | 0 | 0 | 0 | 0 | 1 | 0 | 0 | 1 |
| [19] | 0 | 0 | 0 | 1 | 1 | 0 | 0 | 0 | 1 | 0 | 0 | 0 | 0 | 0 | 1 | 0 | 0 | 0 | 0 | 1 |
| [26] | 1 | 0 | 0 | 0 | 0 | 1 | 0 | 0 | 1 | 0 | 0 | 0 | 0 | 0 | 0 | 2 | 0 | 1 | 0 | 0 |
| [70] | 0 | 0 | 0 | 1 | 1 | 0 | 0 | 0 | 1 | 0 | 0 | 0 | 0 | 0 | 0 | 0 | 1 | 0 | 0 | 1 |
| [27] | 0 | 0 | 0 | 1 | 1 | 0 | 0 | 0 | 1 | 0 | 0 | 0 | 0 | 0 | 1 | 3 | 0 | 0 | 0 | 1 |
| [71] | 0 | 0 | 0 | 1 | 1 | 0 | 0 | 0 | 0 | 0 | 0 | 0 | 1 | 0 | 4 | 0 | 1 | 0 | 0 | 1 |
| [43] | 0 | 0 | 0 | 1 | 1 | 0 | 1 | 0 | 0 | 0 | 0 | 0 | 1 | 0 | 0 | 1 | 0 | 0 | 0 | 1 |
| [15] | 0 | 0 | 0 | 1 | 1 | 0 | 0 | 0 | 1 | 0 | 0 | 0 | 0 | 0 | 4 | 1 | 1 | 0 | 0 | 1 |
| [59] | 0 | 0 | 0 | 1 | 0 | 1 | 0 | 0 | 1 | 0 | 0 | 0 | 0 | 0 | 3 | 2 | 1 | 1 | 0 | 0 |
| [12] | 1 | 0 | 0 | 0 | 0 | 1 | 0 | 0 | 1 | 0 | 0 | 0 | 0 | 0 | 6 | 1 | 1 | 1 | 0 | 0 |
| [52] | 0 | 0 | 0 | 1 | 0 | 1 | 0 | 0 | 0 | 0 | 0 | 1 | 0 | 0 | 4 | 0 | 1 | 1 | 0 | 0 |
| [14] | 0 | 1 | 0 | 0 | 1 | 0 | 0 | 0 | 1 | 0 | 0 | 0 | 0 | 0 | 0 | 0 | 1 | 1 | 0 | 0 |
| [46] | 0 | 0 | 0 | 1 | 0 | 1 | 0 | 0 | 1 | 0 | 0 | 0 | 0 | 0 | 6 | 0 | 0 | 1 | 0 | 0 |
| [16] | 0 | 0 | 0 | 1 | 0 | 1 | 0 | 0 | 1 | 0 | 0 | 0 | 0 | 0 | 3 | 5 | 0 | 1 | 0 | 0 |
| [40] | 1 | 0 | 0 | 0 | 0 | 1 | 0 | 0 | 1 | 0 | 0 | 0 | 0 | 0 | 1 | 0 | 0 | 1 | 0 | 0 |
| [28] | 0 | 0 | 0 | 1 | 0 | 1 | 0 | 0 | 1 | 0 | 0 | 0 | 0 | 0 | 7 | 0 | 0 | 1 | 0 | 0 |
| [22] | 1 | 0 | 0 | 0 | 0 | 1 | 0 | 0 | 0 | 0 | 0 | 1 | 0 | 0 | 0 | 1 | 0 | 1 | 0 | 0 |
| [23] | 0 | 0 | 0 | 1 | 0 | 1 | 0 | 0 | 1 | 0 | 0 | 0 | 0 | 0 | 0 | 4 | 1 | 1 | 0 | 0 |
| [29] | 0 | 0 | 1 | 0 | 0 | 0 | 1 | 0 | 1 | 0 | 0 | 0 | 0 | 0 | 6 | 0 | 2 | 1 | 0 | 0 |
| [25] | 1 | 0 | 0 | 0 | 0 | 1 | 0 | 0 | 0 | 0 | 0 | 1 | 0 | 0 | 6 | 4 | 0 | 1 | 0 | 0 |
| [17] | 1 | 0 | 0 | 0 | 0 | 1 | 0 | 0 | 0 | 0 | 0 | 1 | 0 | 0 | 3 | 2 | 5 | 1 | 0 | 0 |
| [47] | 0 | 0 | 0 | 1 | 0 | 1 | 0 | 0 | 1 | 0 | 0 | 0 | 0 | 0 | 4 | 4 | 0 | 1 | 0 | 0 |
| [20] | 1 | 0 | 0 | 0 | 0 | 1 | 0 | 0 | 1 | 0 | 0 | 0 | 0 | 0 | 1 | 0 | 2 | 1 | 0 | 0 |
| [30] | 1 | 0 | 0 | 0 | 1 | 0 | 0 | 0 | 0 | 0 | 0 | 0 | 1 | 0 | 3 | 0 | 0 | 1 | 0 | 0 |
| [64] | 0 | 0 | 1 | 0 | 0 | 0 | 1 | 0 | 1 | 0 | 0 | 0 | 0 | 0 | 0 | 0 | 1 | 1 | 0 | 0 |
| [31] | 0 | 0 | 0 | 1 | 0 | 1 | 0 | 0 | 1 | 0 | 0 | 0 | 0 | 0 | 1 | 0 | 0 | 1 | 0 | 0 |
| [32] | 0 | 0 | 1 | 0 | 0 | 0 | 1 | 0 | 1 | 0 | 0 | 0 | 0 | 0 | 1 | 0 | 0 | 1 | 0 | 0 |
| [57] | 0 | 1 | 0 | 0 | 0 | 0 | 1 | 0 | 1 | 0 | 0 | 0 | 0 | 0 | 0 | 1 | 0 | 1 | 0 | 0 |
| [48] | 0 | 1 | 0 | 0 | 0 | 0 | 1 | 0 | 0 | 0 | 1 | 0 | 0 | 0 | 3 | 0 | 0 | 1 | 0 | 0 |
| [65] | 0 | 1 | 0 | 0 | 0 | 0 | 1 | 0 | 1 | 0 | 0 | 0 | 0 | 0 | 0 | 1 | 0 | 1 | 0 | 0 |
| [60] | 0 | 0 | 0 | 1 | 1 | 0 | 0 | 1 | 0 | 0 | 0 | 0 | 0 | 0 | 2 | 1 | 0 | 0 | 0 | 1 |
| [68] | 0 | 0 | 0 | 1 | 1 | 0 | 0 | 0 | 0 | 0 | 1 | 0 | 0 | 0 | 1 | 1 | 0 | 1 | 0 | 0 |
| [33] | 0 | 0 | 1 | 0 | 0 | 0 | 1 | 0 | 1 | 0 | 0 | 0 | 0 | 0 | 0 | 1 | 0 | 0 | 1 | 0 |
| [18] | 0 | 0 | 0 | 1 | 1 | 0 | 0 | 0 | 1 | 0 | 0 | 0 | 0 | 0 | 8 | 1 | 0 | 0 | 1 | 0 |
| [63] | 0 | 0 | 0 | 1 | 1 | 0 | 0 | 0 | 1 | 0 | 0 | 0 | 0 | 0 | 1 | 0 | 0 | 0 | 1 | 0 |
| [49] | 0 | 1 | 0 | 0 | 0 | 1 | 0 | 0 | 1 | 0 | 0 | 0 | 0 | 0 | 0 | 0 | 1 | 1 | 0 | 0 |
| [34] | 0 | 1 | 0 | 0 | 0 | 1 | 0 | 0 | 0 | 0 | 0 | 0 | 0 | 1 | 0 | 2 | 2 | 1 | 0 | 0 |
| [62] | 0 | 0 | 0 | 1 | 0 | 0 | 1 | 0 | 1 | 0 | 0 | 0 | 0 | 0 | 1 | 0 | 0 | 1 | 0 | 0 |
| [35] | 0 | 0 | 0 | 1 | 0 | 0 | 1 | 0 | 1 | 0 | 0 | 0 | 0 | 0 | 4 | 0 | 0 | 1 | 0 | 0 |
| [36] | 1 | 0 | 0 | 0 | 0 | 0 | 1 | 0 | 1 | 0 | 0 | 0 | 0 | 0 | 4 | 1 | 1 | 1 | 0 | 0 |
| [39] | 1 | 0 | 0 | 0 | 0 | 0 | 1 | 0 | 0 | 0 | 0 | 0 | 1 | 0 | 0 | 0 | 2 | 1 | 0 | 0 |
| [69] | 0 | 0 | 0 | 1 | 0 | 1 | 0 | 0 | 1 | 0 | 0 | 0 | 0 | 0 | 1 | 0 | 0 | 1 | 0 | 0 |
| [66] | 0 | 0 | 1 | 0 | 0 | 0 | 1 | 0 | 1 | 0 | 0 | 0 | 0 | 0 | 0 | 1 | 0 | 0 | 1 | 0 |
| [67] | 0 | 1 | 0 | 0 | 0 | 0 | 1 | 0 | 1 | 0 | 0 | 0 | 0 | 0 | 0 | 1 | 1 | 0 | 1 | 0 |
| [61] | 0 | 0 | 0 | 1 | 0 | 1 | 0 | 0 | 1 | 0 | 0 | 0 | 0 | 0 | 7 | 0 | 0 | 0 | 0 | 1 |
| [53] | 0 | 1 | 0 | 0 | 1 | 1 | 0 | 1 | 0 | 0 | 0 | 0 | 0 | 0 | 1 | 0 | 0 | 1 | 0 | 0 |
| [54] | 0 | 0 | 0 | 1 | 1 | 0 | 0 | 0 | 1 | 0 | 1 | 1 | 0 | 0 | 0 | 1 | 1 | 0 | 1 | 0 |
References
- ILOSTAT. International Labour Organization. Statistics on Safety and Health at Work. Available online: https://ilostat.ilo.org/topics/safety-and-health-at-work/ (accessed on 18 July 2023).
- Zhang, X.; Huang, S.; Yang, S.; Tu, R.; Jin, L. Safety Assessment in Road Construction Work System Based on Group AHP-PCA. Math. Probl. Eng. 2020, 2020, 6210569. [Google Scholar] [CrossRef]
- Mostofi, F.; Toğan, V.; Ayözen, Y.E.; Tokdemir, O.B. Construction Safety Risk Model with Construction Accident Network: A Graph Convolutional Network Approach. Sustainability 2022, 14, 15906. [Google Scholar] [CrossRef]
- Razi, P.Z.; Sulaiman, S.K.; Ali, M.I.; Ramli, N.I.; Saad, M.S.H.; Jamaludin, O.; Doh, S.I. How Artificial Intelligence Changed the Construction Industry in Safety Issues. In IOP Conference Series: Earth and Environmental Science; Volume Editors: Putra Jaya R. Duraisamy Y.; Institute of Physics: London, UK, 2023; ISSN 17551307. [Google Scholar] [CrossRef]
- Reis, B.L.; Rosa, A.C.F.; Machado, A.A.; Wencel, S.L.S.S.; Leal, G.C.L.; Galdamez, E.V.C.; Souza, R.C.T. Data mining in occupational safety and health: A systematic mapping and roadmap. Production 2021, 31, e20210048. [Google Scholar] [CrossRef]
- Prisma Flow Diagram. Available online: https://www.prisma-statement.org//PRISMAStatement/FlowDiagram (accessed on 21 March 2023).
- Elsevier Scopus Document Search. Available online: https://www.scopus.com (accessed on 18 November 2022).
- Baas, J.; Schotten, M.; Plume, A.; Côté, G.; Karimi, R. Scopus as a curated, high-quality bibliometric data source for academic research in quantitative science studies. Quant. Sci. Stud. 2020, 1, 377–386. [Google Scholar] [CrossRef]
- Clarivate ProQuest Document Search. Available online: https://www.proquest.com (accessed on 18 November 2022).
- Falagas, M.E.; Pitsouni, E.I.; Malietzis, G.A.; Pappas, G.; Kouranos, V.D.; Arencibia-Jorge, R.; Karageorgopoulos, D.E.; Reagan-Shaw, S.; Nihal, M.; Ahmad, N.; et al. Comparison of PubMed, Scopus, Web of Science, and Google Scholar: Strengths and weaknesses. FASEB J. 2007, 22, 338–342. [Google Scholar] [CrossRef] [PubMed]
- Vosviewer. Visualizing Scientific Landscapes. Available online: https://www.vosviewer.com/ (accessed on 21 March 2023).
- Goh, Y.M.; Ubeynarayana, C.U. Construction accident narrative classification: An evaluation of text mining techniques. Accid. Anal. Prev. 2017, 108, 122–130. [Google Scholar] [CrossRef] [PubMed]
- Lim, J.; Jung, D.G.; Park, C.; Kim, D.Y. Computer Vision Process Development regarding Worker’s Safety Harness and Hook to Prevent Fall Accidents: Focused on System Scaffolds in South Korea. Adv. Civ. Eng. 2022, 2022, 4678479. [Google Scholar] [CrossRef]
- Hoła, B.; Szóstak, M. Modeling of the Accidentality Phenomenon in the Construction Industry. Appl. Sci. 2019, 9, 1878. [Google Scholar] [CrossRef]
- Liu, Y.; Huang, S.; Wang, D.; Zhu, G.; Zhang, D. Prediction Model of Tunnel Boring Machine Disc Cutter Replacement Using Kernel Support Vector Machine. Appl. Sci. 2022, 12, 2267. [Google Scholar] [CrossRef]
- Lee, J.Y.; Yoon, Y.G.; Oh, T.K.; Park, S.; Ryu, S.I. A study on data pre-processing and accident prediction modelling for occupational accident analysis in the construction industry. Appl. Sci. 2020, 10, 7949. [Google Scholar] [CrossRef]
- Zhang, J.; Zi, L.; Hou, Y.; Deng, D.; Jiang, W.; Wang, M. A C-BiLSTM approach to classify construction accident reports. Appl. Sci. 2020, 10, 5754. [Google Scholar] [CrossRef]
- Bai, G.; Hou, Y.; Wan, B.; An, N.; Yan, Y.; Tang, Z.; Yan, M.; Zhang, Y.; Sun, D. Performance Evaluation and Engineering Verification of Machine Learning Based Prediction Models for Slope Stability. Appl. Sci. 2022, 12, 7890. [Google Scholar] [CrossRef]
- Lin, P.; Wu, M.; Zhang, L. Probabilistic safety risk assessment in large-diameter tunnel construction using an interactive and explainable tree-based pipeline optimization method. Appl. Soft Comput. 2023, 143, 110376. [Google Scholar] [CrossRef]
- Antwi-Afari, M.F.; Qarout, Y.; Herzallah, R.; Anwer, S.; Umer, W.; Zhang, Y.; Manu, P. Deep learning-based networks for automated recognition and classification of awkward working postures in construction using wearable insole sensor data. Autom. Constr. 2022, 136, 104181. [Google Scholar] [CrossRef]
- Choo, H.; Lee, B.; Kim, H.; Choi, B. Automated detection of construction work at heights and deployment of safety hooks using IMU with a barometer. Autom. Constr. 2023, 147, 104714. [Google Scholar] [CrossRef]
- Tixier, A.J.-P.; Hallowell, M.R.; Rajagopalan, B.; Bowman, D. Automated content analysis for construction safety: A natural language processing system to extract precursors and outcomes from unstructured injury reports. Autom. Constr. 2016, 62, 45–56. [Google Scholar] [CrossRef]
- Tixier, A.J.-P.; Hallowell, M.R.; Rajagopalan, B.; Bowman, D. Construction Safety Clash Detection: Identifying Safety Incompatibilities among Fundamental Attributes using Data Mining. Autom. Constr. 2017, 74, 39–54. [Google Scholar] [CrossRef]
- Yu, Y.; Li, H.; Yang, X.; Kong, L.; Luo, X.; Wong, A.Y.L. An automatic and non-invasive physical fatigue assessment method for construction workers. Autom. Constr. 2019, 103, 1–12. [Google Scholar] [CrossRef]
- Zhang, F.; Fleyeh, H.; Wang, X.; Lu, M. Construction site accident analysis using text mining and natural language processing techniques. Autom. Constr. 2019, 99, 238–248. [Google Scholar] [CrossRef]
- Liu, Y.; Wang, J.; Tang, S.; Zhang, J.; Wan, J. Integrating Information Entropy and Latent Dirichlet Allocation Models for Analysis of Safety Accidents in the Construction Industry. Buildings 2023, 13, 1831. [Google Scholar] [CrossRef]
- Wang, J.; Mohammed, A.S.; Macioszek, E.; Ali, M.; Ulrikh, D.V.; Fang, Q. A Novel Combination of PCA and Machine Learning Techniques to Select the Most Important Factors for Predicting Tunnel Construction Performance. Buildings 2022, 12, 919. [Google Scholar] [CrossRef]
- Shuang, Q.; Zhang, Z. Determining Critical Cause Combination of Fatality Accidents on Construction Sites with Machine Learning Techniques. Buildings 2023, 13, 345. [Google Scholar] [CrossRef]
- Toğan, V.; Mostofi, F.; Ayözen, Y.E.; Tokdemir, O.B. Customized AutoML: An Automated Machine Learning System for Predicting Severity of Construction Accidents. Buildings 2022, 12, 1933. [Google Scholar] [CrossRef]
- Dutta, A.; Breloff, S.P.; Mahmud, D.; Dai, F.; Sinsel, E.W.; Warren, C.M.; Wu, J.Z. Automated Classification of the Phases Relevant to Work-Related Musculoskeletal Injury Risks in Residential Roof Shingle Installation Operations Using Machine Learning. Buildings 2023, 13, 1552. [Google Scholar] [CrossRef]
- Al-Kasasbeh, M.; Mujalli, R.O.; Abudayyeh, O.; Liu, H.; Altalhoni, A. Bayesian Network Models for Evaluating the Impact of Safety Measures Compliance on Reducing Accidents in the Construction Industry. Buildings 2022, 12, 1980. [Google Scholar] [CrossRef]
- Khan, N.; Alam Zaidi, S.F.; Yang, J.; Park, C.; Lee, D. Construction Work-Stage-Based Rule Compliance Monitoring Framework Using Computer Vision (CV) Technology. Buildings 2023, 13, 2093. [Google Scholar] [CrossRef]
- Maqsoom, A.; Ashraf, H.; Alaloul, W.S.; Salman, A.; Ullah, F.; Ghufran, M.; Musarat, M.A. The Relationship between Error Management, Safety Climate, and Job-Stress Perception in the Construction Industry: The Mediating Role of Psychological Capital. Buildings 2023, 13, 1528. [Google Scholar] [CrossRef]
- Shringi, A.; Arashpour, M.; Golafshani, E.M.; Dwyer, T.; Kalutara, P. Enhancing Safety Training Performance Using Extended Reality: A Hybrid Delphi–AHP Multi-Attribute Analysis in a Type-2 Fuzzy Environment. Buildings 2023, 13, 625. [Google Scholar] [CrossRef]
- Gao, Y.; González, V.A.; Yiu, T.W.; Cabrera-Guerrero, G.; Deng, R. Predicting Construction Workers’ Intentions to Engage in Unsafe Behaviours Using Machine Learning Algorithms and Taxonomy of Personality. Buildings 2022, 12, 841. [Google Scholar] [CrossRef]
- Yin, S.; Wu, Y.; Shen, Y.; Rowlinson, S. Development of a Classification Framework for Construction Personnel’s Safety Behavior Based on Machine Learning. Buildings 2023, 13, 43. [Google Scholar] [CrossRef]
- Li, L.; Tao, J.-F.; Yu, H.-D.; Huang, Y.-X.; Liu, C.-L. Online Condition Monitoring of Gripper Cylinder in TBM Based on EMD Method. Chin. J. Mech. Eng. 2017, 30, 1325–1337. [Google Scholar] [CrossRef]
- Erzaij, K.R.; Burhan, A.M.; Hatem, W.A.; Ali, R.H. Prediction of the Delay in the Portfolio Construction Using Naive Bayesian Classification Algorithms. Civ. Environ. Eng. 2021, 17, 673–680. [Google Scholar] [CrossRef]
- Li, X.; Zeng, J.; Chen, C.; Chi, H.-L.; Shen, G.Q. Smart work package learning for decentralized fatigue monitoring through facial images. Comput.-Aided Civ. Infrastruct. Eng. 2023, 38, 799–817. [Google Scholar] [CrossRef]
- Passmore, D.; Chae, C.; Borkovskaya, V.; Baker, R.; Yim, J.-H. Severity of U.S. Construction Worker Injuries, 2015–2017. E3S Web Conf. 2019, 97, 06038. [Google Scholar] [CrossRef]
- Duan, P.; Zhou, J.; Tao, S. Risk events recognition using smartphone and machine learning in construction workers’ material handling tasks. Eng. Constr. Arch. Manag. 2023, 30, 3562–3582. [Google Scholar] [CrossRef]
- Leng, S.; Lin, J.-R.; Hu, Z.-Z.; Shen, X. A Hybrid Data Mining Method for Tunnel Engineering Based on Real-Time Monitoring Data from Tunnel Boring Machines. IEEE Access 2020, 8, 90430–90449. [Google Scholar] [CrossRef]
- Lin, P.; Li, Q.; Fan, Q.; Gao, X.; Hu, S. A Real-Time Location-Based Services System Using WiFi Fingerprinting Algorithm for Safety Risk Assessment of Workers in Tunnels. IEEE Access 2014, 2014, 371456. [Google Scholar] [CrossRef]
- Osa, T.; Osajima, N.; Aizawa, M.; Harada, T. Learning Adaptive Policies for Autonomous Excavation Under Various Soil Conditions by Adversarial Domain Sampling. IEEE Robot. Autom. Lett. 2023, 8, 5536–5543. [Google Scholar] [CrossRef]
- Fernández, A.; Rivera, F.M.-L.; Mora-Serrano, J. Virtual Reality Training for Occupational Risk Prevention: Application Case in Geotechnical Drilling Works. Int. J. Comput. Methods Exp. Meas. 2023, 11, 55–63. [Google Scholar] [CrossRef]
- Khairuddin, M.Z.F.; Hui, P.L.; Hasikin, K.; Razak, N.A.A.; Lai, K.W.; Saudi, A.S.M.; Ibrahim, S.S. Occupational Injury Risk Mitigation: Machine Learning Approach and Feature Optimization for Smart Workplace Surveillance. Int. J. Environ. Res. Public Health 2022, 19, 13962. [Google Scholar] [CrossRef]
- Yedla, A.; Kakhki, F.D.; Jannesari, A. Predictive modeling for occupational safety outcomes and days away from work analysis in mining operations. Int. J. Environ. Res. Public Health 2020, 17, 7054. [Google Scholar] [CrossRef] [PubMed]
- Sadeghi, H.; Mohandes, S.R.; Hosseini, M.R.; Banihashemi, S.; Mahdiyar, A.; Abdullah, A. Developing an ensemble predictive safety risk assessment model: Case of Malaysian construction projects. Int. J. Environ. Res. Public Health 2020, 17, 8395. [Google Scholar] [CrossRef] [PubMed]
- Rafindadi, A.D.; Shafiq, N.; Othman, I.; Mikić, M. Mechanism Models of the Conventional and Advanced Methods of Construction Safety Training. Is the Traditional Method of Safety Training Sufficient? Int. J. Environ. Res. Public Health 2023, 20, 1466. [Google Scholar] [CrossRef] [PubMed]
- Yao, G.; Sun, W.T.; Yang, Y. Analysis and Identification of Building Construction Accident Risk in China basing Exclusively Database. In IOP Conference Series: Earth and Environmental Science; IOP Publishing Ltd.: Bristol, UK, 2022; Volume 1101, p. 072009. [Google Scholar] [CrossRef]
- Wei, C.-C. Collapse warning system using LSTM neural networks for construction disaster prevention in extreme wind weather. J. Civ. Eng. Manag. 2021, 27, 230–245. [Google Scholar] [CrossRef]
- Goldberg, D.M. Characterizing accident narratives with word embeddings: Improving accuracy richness and generalizability. J. Saf. Res. 2022, 80, 441–455. [Google Scholar] [CrossRef]
- Gondia, A.; Siam, A.; El-Dakhakhni, W.; Nassar, A.H. Machine Learning Algorithms for Construction Projects Delay Risk Prediction. J. Constr. Eng. Manag. 2020, 146, 04019085. [Google Scholar] [CrossRef]
- Shirazi, D.H.; Toosi, H. Deep Multilayer Perceptron Neural Network for the Prediction of Iranian Dam Project Delay Risks. J. Constr. Eng. Manag. 2023, 149, 04023011. [Google Scholar] [CrossRef]
- Sapronova, A.; Unterlass, P.J.; Dickmann, T.; Hecht-Méndez, J.; Marcher, T. Prediction of Geological Conditions Ahead of the Tunnel Face: Comparing the Accuracy of Machine Learning Models Trained on Real and Synthetic Data. In Proceedings of the 3rd International Conference of International Society for Intelligent Construction, ISIC 2022, Guimarães, Portugal, 6–9 September 2022; pp. 76–86. [Google Scholar] [CrossRef]
- Jha, M.K.; Wanko, N.; Bachu, A.K. A Machine Learning-Based Active Learning Framework to Capture Risk and Uncertainty in Transportation and Construction Scheduling. In Proceedings of the 2nd International Conference on Transportation Infrastructure Projects: Conception to Execution, TIPCE 2022, Haridwar, India, 14–17 September 2022. Code 297359. [Google Scholar] [CrossRef]
- Ensslin, L.; Gonçalves, A.; Ensslin, S.R.; Dutra, A.; Longaray, A.A. Constructivist multi-criteria model to support the management of occupational accident risks in civil construction industry. PLoS ONE 2022, 17, e0270529. [Google Scholar] [CrossRef] [PubMed]
- Hasanpour, R.; Rostami, J.; Barla, G. Impact of Advance Rate on Entrapment Risk of a Double-Shielded TBM in Squeezing Ground. Rock Mech. Rock Eng. 2015, 48, 1115–1130. [Google Scholar] [CrossRef]
- Alkaissy, M.; Arashpour, M.; Golafshani, E.M.; Hosseini, M.R.; Khanmohammadi, S.; Bai, Y.; Feng, H. Enhancing construction safety: Machine learning-based classification of injury types. Saf. Sci. 2023, 162, 106102. [Google Scholar] [CrossRef]
- Wang, F.; Ding, L.; Love, P.E.D.; Edwards, D.J. Modeling tunnel construction risk dynamics: Addressing the production versus protection problem. Saf. Sci. 2016, 87, 101–115. [Google Scholar] [CrossRef]
- Zermane, A.; Tohir, M.Z.M.; Zermane, H.; Baharudin, M.R.; Yusoff, H.M. Predicting fatal fall from heights accidents using random forest classification machine learning model. Saf. Sci. 2023, 159, 106023. [Google Scholar] [CrossRef]
- Zhao, F.; Zhang, G.; Wang, Z.; Hao, X. Construction of Higher Education Management Data Analysis Model Based on Association Rules. Sci. Program. 2022, 2022, 5414238. [Google Scholar] [CrossRef]
- Dong, M.; Wu, H.; Hu, H.; Azzam, R.; Zhang, L.; Zheng, Z.; Gong, X. Deformation prediction of unstable slopes based on real-time monitoring and deepar model. Sensors 2021, 21, 14. [Google Scholar] [CrossRef] [PubMed]
- Alhelo, A.A.; Alzubaidi, R.; Rashid, H. A Framework Supporting Health and Safety Practices in the United Arab Emirates’ Construction Projects. Sustainability 2023, 15, 1587. [Google Scholar] [CrossRef]
- Topal, S.; Atasoylu, E. A Fuzzy Risk Assessment Model for Small Scale Construction Work. Sustainability 2022, 14, 4442. [Google Scholar] [CrossRef]
- Alateeq, M.M.; P.P., F.R.; Ali, M.A.S. Construction Site Hazards Identification Using Deep Learning and Computer Vision. Sustainability 2023, 15, 2358. [Google Scholar] [CrossRef]
- Musarat, M.A.; Alaloul, W.S.; Irfan, M.; Sreenivasan, P.; Rabbani, M.B.A. Health and Safety Improvement through Industrial Revolution 4.0: Malaysian Construction Industry Case. Sustainability 2023, 15, 201. [Google Scholar] [CrossRef]
- Zhu, T.; Liu, G. A Novel Hybrid Methodology to Study the Risk Management of Prefabricated Building Supply Chains: An Outlook for Sustainability. Sustainability 2023, 15, 361. [Google Scholar] [CrossRef]
- Yan, R.; Yi, W.; Wang, S. Predicting Maximum Work Duration for Construction Workers. Sustainability 2022, 14, 11096. [Google Scholar] [CrossRef]
- Schindler, S.; Hegemann, F.; Koch, C.; König, M.; Mark, P. Radar interferometry based settlement monitoring in tunnelling: Visualisation and accuracy analyses. Vis. Eng. 2016, 4, 8. [Google Scholar] [CrossRef]
- Kumari, S.; Siwach, V.; Singh, Y.; Barak, D.; Jain, R. A Machine Learning Centered Approach for Uncovering Excavators’ Last Known Location Using Bluetooth and Underground WSN. Wirel. Commun. Mob. Comput. 2022, 2022, 9160031. [Google Scholar] [CrossRef]
- Arockiam, A.J.M.S.; Irudhayaraj, E.S. Reclust: An efficient clustering algorithm for mixed data based on reclustering and cluster validation. Indones. J. Electr. Eng. Comput. Sci. 2023, 29, 545–552. [Google Scholar] [CrossRef]
- Di Franco, G. Tecniche e Modelli di Analisi Multivariata; Franco Angeli Editore: Milano, Italia, 2017; ISBN 978-8891761064. [Google Scholar]
- Bolasco, S. Analisi Multidimensionale dei Dati. Metodi, Strategie e Criteri d’Interpretazione; Carocci: Roma, Italia, 1999; ISBN 8843014013. EAN: 9788843014019. [Google Scholar]
- Chiang, M.M.-T.; Mirkin, B. Intelligent Choice of the Number of Clusters in K-Means Clustering: An Experimental Study with Different Cluster Spreads. J. Classif. 2010, 27, 3–40. [Google Scholar] [CrossRef]
- Kim, Y.-S.; Lee, J.Y.; Yoon, Y.-G.; Oh, T.-K. Effectiveness Analysis for Smart Construction Safety Technology (SCST) by Test Bed Operation on Small- and Medium-Sized Construction Sites. Int. J. Environ. Res. Public Health 2022, 19, 5203. [Google Scholar] [CrossRef] [PubMed]


| Stream | Query |
|---|---|
| tit-abs-key | “machine learning” AND construction AND work OR safety |
| subject area | Engineering AND Social Science AND Environmental Science AND Computational Science |
| publication year | From 2014 to September 2023 |
| document | Article, Conference Paper, Book chapter (Peer reviewed) |
| language | Not restriction |
| Source Title | Author | Papers |
|---|---|---|
| Accident Analysis and Prevention | [12] | 1 |
| Advances in Civil Engineering | [13] | 1 |
| Applied Sciences | [14] | 1 |
| Applied Sciences (Switzerland) | [15,16,17,18] | 4 |
| Applied Soft Computing | [19] | 1 |
| Automation in Construction | [20,21,22,23,24,25] | 6 |
| Buildings | [26,27,28,29,30,31,32,33,34,35,36] | 11 |
| Chinese Journal of Mechanical Engineering (English Ed.) | [37] | 1 |
| Civil and Environmental Engineering | [38] | 1 |
| Computer-Aided Civil and Infrastructure Engineering | [39] | 1 |
| E3S Web of Conferences | [40] | 1 |
| Engineering, Construction and Architectural Management | [41] | 1 |
| IEEE Access | [42,43] | 2 |
| IEEE Robotics and Automation Letters | [44] | 1 |
| International Journal of Computational Methods and Experimental Measurements | [45] | 1 |
| International Journal of Environmental Research and Public Health | [46,47,48,49] | 4 |
| IOP Conference Series. Earth and Environmental Science | [4,50] | 2 |
| Journal of Civil Engineering and Management | [51] | 1 |
| Journal of Safety Research | [52] | 1 |
| Journal of Construction Engineering and Management | [53,54] | 2 |
| Lecture Notes in Civil Engineering | [55,56] | 2 |
| Mathematical Problems in Engineering Volume | [2] | 1 |
| PLoS One | [57] | 1 |
| Rock Mechanics and Rock Engineering | [58] | 1 |
| Safety Science | [59,60,61] | 3 |
| Scientific Programming | [62] | 1 |
| Sensors (Switzerland) | [63] | 1 |
| Sustainability | [64,65,66,67] | 4 |
| Sustainability (Switzerland) | [3,68,69] | 3 |
| Visualization in Engineering | [70] | 1 |
| Wireless Communications and Mobile Computing | [71] | 1 |
| Total | 63 |
| Class | n | Description | Index |
|---|---|---|---|
| dm method | 89 | Appendix C and Appendix D | |
| study objective | 4 | classifying, decision making, monitoring, predicting | x1–x4 |
| field | 3 | construction process, occupational accident, risk management | x5–x7 |
| data type | 7 | project, institutional data, interview, literature, text, signal & video, simulation | x8–x14 |
| dm type | 3 | supervised, unsupervised, other | x15–x17 |
| resource type | 3 | construction and h&s process, environment, plant and machinery | x18–x20 |
| Dim | Eigenvalue | % of Variance | Cumulative % of Variance |
|---|---|---|---|
| Dim1 | 6.31 | 57.36 | 57.36 |
| Dim2 | 1.36 | 12.35 | 69.71 |
| Dim3 | 1.19 | 10.83 | 80.54 |
| Dim4 | 0.68 | 6.16 | 86.71 |
| Dim5 | 0.57 | 5.18 | 91.88 |
| Dim6 | 0.38 | 3.42 | 95.30 |
| Dim7 | 0.33 | 2.97 | 98.27 |
| Dim8 | 0.18 | 1.62 | 99.89 |
| Dim9 | 0.01 | 0.09 | 99.97 |
| Dim10 | 0.00 | 0.03 | 100.00 |
| Dim11 | 0.00 | 0.00 | 100.00 |
| Axes | (+) | (−) | DM Class | Study Objective | Data Type | Resource Type |
|---|---|---|---|---|---|---|
| Dim1 | dt (32), knn (49), svm (81) and rf (69) | MCDA C (58) | supervised | classifying predicting | institutional data, interview-literature-text | - |
| Dim2 | lstm (54), word2vec (88), nlp (63), BIM (16) | ann (8), adaboost (3) | other- supervised (not-supervised) | decision making monitoring | project-simulation-signal; interview-literature-text | machinery environment |
| Dim1 | Correlation (cos2) | p-Value | Dim2 | Correlation (cos2) | p-Value |
|---|---|---|---|---|---|
| frequency | 9.874 × 10⁻¹ | 1.603 × 10−71 | other type | 8.413 × 10⁻¹ | 5.790 × 10⁻²⁵ |
| supervised | 9.694 × 10⁻¹ | 7.675 × 10−55 | decision making | 5.077 × 10⁻¹ | 3.801 × 10⁻⁷ |
| institutional data | 9.412 × 10⁻¹ | 8.809 × 10−43 | interview-literature-text | 4.688 × 10⁻¹ | 3.593 × 10⁻⁶ |
| predicting | 9.361 × 10⁻¹ | 2.984 × 10−41 | classifying | 3.060 × 10⁻¹ | 3.547 × 10⁻³ |
| classifying | 8.181 × 10⁻¹ | 1.286 × 10⁻²² |
Disclaimer/Publisher’s Note: The statements, opinions and data contained in all publications are solely those of the individual author(s) and contributor(s) and not of MDPI and/or the editor(s). MDPI and/or the editor(s) disclaim responsibility for any injury to people or property resulting from any ideas, methods, instructions or products referred to in the content. |
© 2024 by the authors. Licensee MDPI, Basel, Switzerland. This article is an open access article distributed under the terms and conditions of the Creative Commons Attribution (CC BY) license (https://creativecommons.org/licenses/by/4.0/).
Share and Cite
Pireddu, A.; Bedini, A.; Lombardi, M.; Ciribini, A.L.C.; Berardi, D. A Review of Data Mining Strategies by Data Type, with a Focus on Construction Processes and Health and Safety Management. Int. J. Environ. Res. Public Health 2024, 21, 831. https://doi.org/10.3390/ijerph21070831
Pireddu A, Bedini A, Lombardi M, Ciribini ALC, Berardi D. A Review of Data Mining Strategies by Data Type, with a Focus on Construction Processes and Health and Safety Management. International Journal of Environmental Research and Public Health. 2024; 21(7):831. https://doi.org/10.3390/ijerph21070831
Chicago/Turabian StylePireddu, Antonella, Angelico Bedini, Mara Lombardi, Angelo L. C. Ciribini, and Davide Berardi. 2024. "A Review of Data Mining Strategies by Data Type, with a Focus on Construction Processes and Health and Safety Management" International Journal of Environmental Research and Public Health 21, no. 7: 831. https://doi.org/10.3390/ijerph21070831