
Trends in Complementary Feeding Indicators in Children Aged 6–23 Months According to Participation in a Conditional Cash Transfer Program: Data from the Brazilian Food and Nutrition Surveillance System, 2015–2019

 ,
,  , and
, and 
Abstract
:1. Introduction
2. Materials and Methods
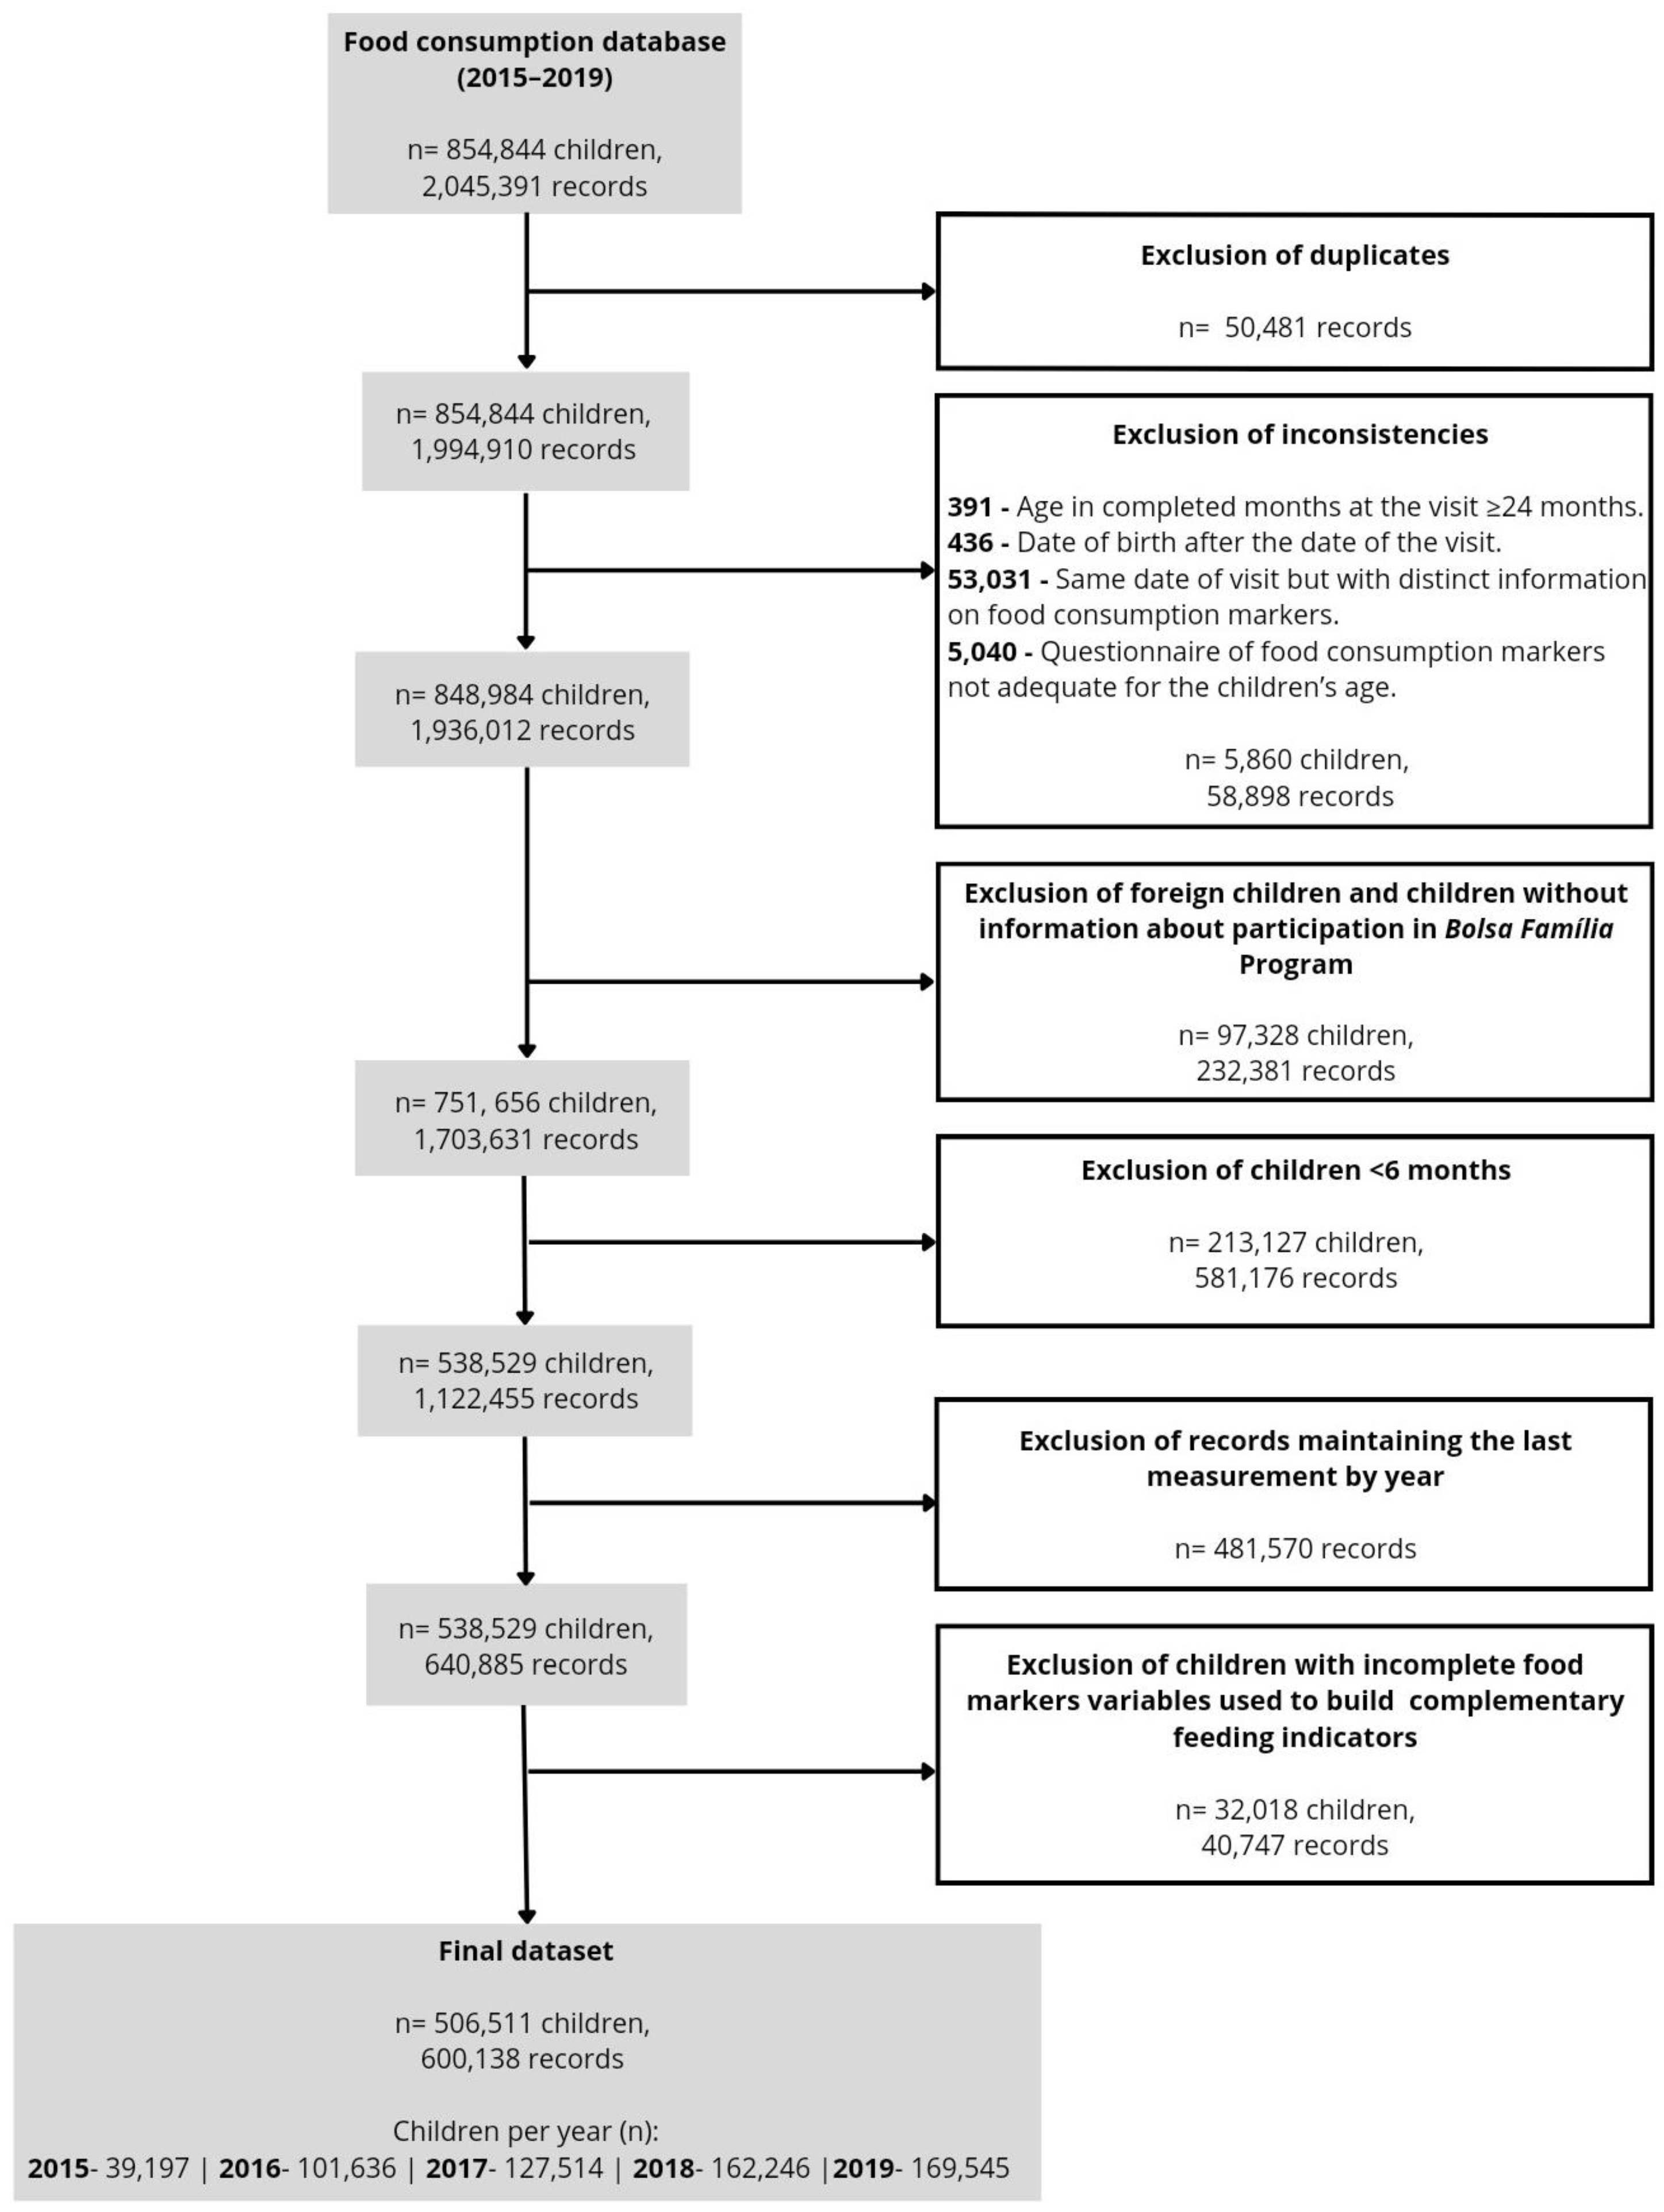
2.1. Design and Study Population
2.2. Database Linkage and Data Cleaning Process
2.3. Complementary Feeding Indicators and Sociodemographic Variables
2.4. Statistical Analysis
3. Results
4. Discussion
5. Conclusions
Supplementary Materials
Author Contributions
Funding
Institutional Review Board Statement
Informed Consent Statement
Data Availability Statement
Acknowledgments
Conflicts of Interest
References
- United Nations Children’s Fund. The State of the World’s Children 2019. Children, Food and Nutrition: Growing Well in a Changing World; UNICEF: New York, NY, USA, 2019; ISBN 978-92-806-5003-7. [Google Scholar]
- Lopes, W.C.; Marques, F.K.S.; Oliveira, C.F.D.; Rodrigues, J.A.; Silveira, M.F.; Caldeira, A.P.; Pinho, L.D. Infant feeding in the first two years of life. Rev. Paul. Pediatr. 2018, 36, 164–170. [Google Scholar] [CrossRef] [PubMed]
- Neves, A.M.; Madruga, S.W. Complementary feeding, consumption of industrialized foods and nutritional status of children under 3 years old in Pelotas, Rio Grande do Sul, Brazil, 2016: A descriptive study. Epidemiol. Serv. Saúde 2019, 28, e2017507. [Google Scholar] [CrossRef]
- Bortolini, G.A.; Gubert, M.B.; Santos, L.M.P. Food consumption Brazilian children by 6 to 59 months of age. Cad. Saúde Públ. 2012, 28, 1759–1771. [Google Scholar] [CrossRef]
- Lacerda, E.M.A.; Bertoni, N.; Alves-Santos, N.H.; Carneiro, L.B.V.; Schincaglia, R.M.; Boccolini, C.S.; Castro, I.R.R.; Anjos, L.A.; Berti, T.L.; Kac, G.; et al. Minimum dietary diversity and consumption of ultra-processed foods among Brazilian children 6–23 months of age. Cad. Saúde Pública 2023, 39, e00081422. [Google Scholar] [CrossRef] [PubMed]
- Rebouças, A.G.; Bernardino, Í.d.M.; Dutra, E.R.; Imparato, J.C.P.; Duarte, D.A.; Flório, F.M. Factors associated with feeding practices among brazilian children aged 12 to 23 months old. Rev. Bras. Saúde Mater. Infant. 2020, 20, 1025–1040. [Google Scholar] [CrossRef]
- Kambale, R.M.; Ngaboyeka, G.A.; Kasengi, J.B.; Niyitegeka, S.; Cinkenye, B.R.; Baruti, A.; Mutuga, K.C.; Van der Linden, D. Minimum acceptable diet among children aged 6–23 months in South Kivu, Democratic Republic of Congo: A community-based cross-sectional study. BMC Pediatr. 2021, 21, 239. [Google Scholar] [CrossRef] [PubMed]
- Bortolini, G.A.; Vitolo, M.R.; Gubert, M.B.; Santos, L.M. Social inequalities influence the quality and diversity of diet in Brazilian children 6 to 36 months of age. Cad. Saúde Pública 2015, 31, 2413–2424. [Google Scholar] [CrossRef]
- Dallazen, C.; Silva, S.A.D.; Gonçalves, V.S.S.; Nilson, E.A.F.; Crispim, S.P.; Lang, R.M.F.; Moreira, J.D.; Tietzmann, D.C.; Vítolo, M.R. Introdução de alimentos não recomendados no primeiro ano de vida e fatores associados em crianças de baixo nível socioeconômico. Cad. Saúde Pública 2018, 34, e00202816. [Google Scholar] [CrossRef] [PubMed]
- Bimpong, K.A.; Cheyuo, E.K.E.; Abdul-Mumin, A.; Ayanore, M.A.; Kubuga, C.K.; Mogre, V. Mothers’ knowledge and attitudes regarding child feeding recommendations, complementary feeding practices and determinants of adequate diet. BMC Nutr. 2020, 6, 67. [Google Scholar] [CrossRef]
- MEC Brasil. Lei n. 10.836 de 09 de Janeiro de 2004. In Cria o Programa Bolsa Família e dá Outras Providências; Diário Oficial da União: Brasília, Brazil, 2004. [Google Scholar]
- Ministério da Saúde. Guia para a Organização da Vigilância Alimentar e Nutricional na Atenção Primária à Saúde; Ministério da Saúde: Brasília, Brazil, 2022; ISBN 978-65-5993-350-1.
- Mendes, M.; Marçal, G.; Rinaldi, A.; Bueno, N.; Florêncio, T.; Clemente, A. Dietary patterns of children aged 6–24 months assisted by the Bolsa Família Program. Public Health Nutr. 2022, 25, 2794–2804. [Google Scholar] [CrossRef]
- Saldiva, S.R.D.M.; Silva, L.F.F.; Saldiva, P.H.N. Avaliação antropométrica e consumo alimentar em crianças menores de cinco anos residentes em um município da região do semiárido nordestino com cobertura parcial do programa bolsa família. Rev. Nutr. 2010, 23, 221–229. [Google Scholar] [CrossRef]
- World Health Organization. Global Strategy for Infant and Young Child Feeding; WHO: Geneva, Switzerland, 2003; ISBN 92-4-156221-8. [Google Scholar]
- Ministério da Saúde. Guia Alimentar para Crianças Brasileiras Menores de 2 Anos; Ministério da Saúde: Brasília, Brazil, 2019; ISBN 978-85-334-2737-2.
- World Health Organization. Guideline for Complementary Feeding of Infants and Young Children 6–23 Months of Age; WHO: Geneva, Switzerland, 2023; ISBN 978-92-4-008186-4. [Google Scholar]
- United Nations Children’s Fund. Improving Young Children’s Diets During the Complementary Feeding Period; UNICEF: New York, NY, USA, 2020. [Google Scholar]
- Ministério da Saúde. Orientações para Avaliação de Marcadores de Consumo Alimentar na Atenção Básica; Ministério da Saúde: Brasília, Brazil, 2015; ISBN 978-85-334-2248-3.
- Mrejen, M.; Cruz, M.V.; Rosa, L. O Sistema de Vigilância Alimentar e Nutricional (SISVAN) como ferramenta de monitoramento do estado nutricional de crianças e adolescentes no Brasil. Cad. Saúde Pública 2023, 39, e00169622. [Google Scholar] [CrossRef]
- World Health Organization; United Nations Children’s Fund. Indicators for Assessing Infant and Young Child Feeding Practices: Definitions and Measurement Methods; WHO: Geneva, Switzerland; UNICEF: Geneva, Switzerland, 2021; ISBN 978-92-4-001838-9. [Google Scholar]
- StataCorp. Stata Statistical Software: Release 15; StataCorp LLC: College Station, TX, USA, 2017. [Google Scholar]
- Antunes, J.L.F.; Cardoso, M.R.A. Uso da análise de séries temporais em estudos epidemiológicos. Epidemiol. Serv. Saúde 2015, 24, 565–576. [Google Scholar] [CrossRef]
- Federal University of Rio de Janeiro. Prevalence of Feeding Indicators for Children under 5 Years of Age; Brazilian National Survey on Child Nutrition (ENANI-2019); UFRJ: Rio de Janeiro, Brazil, 2021. [Google Scholar]
- Gatica-Domínguez, G.; Neves, P.A.; Barros, A.J.; Victora, C.G. Complementary Feeding Practices in 80 Low-and Middle-Income Countries: Prevalence of and Socioeconomic Inequalities in Dietary Diversity, Meal Frequency, and Dietary Adequacy. J. Nutr. 2021, 151, 1956–1964. [Google Scholar] [CrossRef] [PubMed]
- Beckerman-Hsu, J.P.; Kim, R.; Sharma, S.; Subramanian, S.V. Dietary Variation among Children Meeting and Not Meeting Minimum Dietary Diversity: An Empirical Investigation of Food Group Consumption Patterns among 73,036 Children in India. J. Nutr. 2020, 150, 2818–2824. [Google Scholar] [CrossRef] [PubMed]
- Heidkamp, R.A.; Kang, Y.; Chimanya, K.; Garg, A.; Matji, J.; Nyawo, M.; Craig, H.; Arimond, M.; Lyman, A.L.T. Implications of Updating the Minimum Dietary Diversity for Children Indicator for Tracking Progress in the Eastern and Southern Africa Region. Curr. Dev. Nutr. 2020, 4, nzaa141. [Google Scholar] [CrossRef] [PubMed]
- Akalu, Y.; Yeshaw, Y.; Tesema, G.A.; Demissie, G.D.; Molla, M.D.; Muche, A.; Diress, M.; Tiruneh, S.A. Iron-rich food consumption and associated factors among children aged 6–23 months in sub-Saharan Africa: A multilevel analysis of Demographic and Health Surveys. PLoS ONE 2021, 16, e0253221. [Google Scholar] [CrossRef] [PubMed]
- Tuan, N.T.; Withers, M.; Frongillo, E.A.; Hajeebhoy, N. Estimates of the quality of complementary feeding among Vietnamese infants aged 6–23 months varied by how commercial baby cereals were classified in 24-h recalls. Matern. Child Nutr. 2017, 13, e12295. [Google Scholar] [CrossRef]
- Khor, G.L.; Tan, S.Y.; Tan, K.L.; Chan, P.S.; Amarra, M.S. Compliance with WHO IYCF Indicators and Dietary Intake Adequacy in a Sample of Malaysian Infants Aged 6–23 Months. Nutrients 2016, 8, 778. [Google Scholar] [CrossRef] [PubMed]
- Castro, I.R.R.; Normando, P.; Farias, D.R.; Berti, T.L.; Schincaglia, R.M.; Andrade, P.; Bertoni, N.; Lacerda, E.M.A.; Anjos, L.A.; Boccolini, C.S.; et al. Factors associated with anemia and vitamin A deficiency in Brazilian children under 5 years old: Brazilian National Survey on Child Nutrition (ENANI-2019). Cad. Saúde Pública 2023, 39, e00194922. [Google Scholar] [CrossRef]
- Souza, J.P.D.O.; Ferreira, C.S.; Lamounier, D.M.B.; Pereira, L.A.; Rinaldi, A.E.M. Characterization of feeding of children under 24 months in units cared by the family health strategy. Rev. Paul. Pediatr. 2020, 38, e2019027. [Google Scholar] [CrossRef]
- Cainelli, E.C.; Gondinho, B.V.C.; Palacio, D.D.C.; Oliveira, D.B.D.; Reis, R.A.; Cortellazzi, K.L.; Guerra, L.M.; Cavalcante, D.F.B.; Pereira, A.C.; Bulgareli, J.V. Consumo de alimentos ultraprocessados por crianças e fatores socioeconômicos e demográficos associados. Einstein 2021, 19, eAO5554. [Google Scholar] [CrossRef] [PubMed]
- Spaniol, A.M.; da Costa, T.H.M.; Souza, A.M.; Gubert, M.B. Early consumption of ultra-processed foods among children under 2 years old in Brazil. Public Health Nutr. 2021, 24, 3341–3351. [Google Scholar] [CrossRef] [PubMed]
- Zahid, N.; Khadka, N.; Ganguly, M.; Varimezova, T.; Turton, B.; Spero, L.; Sokal-Gutierrez, K. Associations between Child Snack and Beverage Consumption, Severe Dental Caries, and Malnutrition in Nepal. Int. J. Environ. Res. Public Health 2020, 17, 7911. [Google Scholar] [CrossRef] [PubMed]
- Costa, C.S.; Del-Ponte, B.; Assunção, M.C.F.; Santos, I.S. Consumption of ultra-processed foods and body fat during childhood and adolescence: A systematic review. Public Health Nutr. 2018, 21, 148–159. [Google Scholar] [CrossRef] [PubMed]
- Rauber, F.; Campagnolo, P.D.B.; Hoffman, D.J.; Vitolo, M.R. Consumption of ultra-processed food products and its effects on children‘s lipid profiles: A longitudinal study. Nutr. Metab. Cardiovasc. Dis. 2015, 25, 116–122. [Google Scholar] [CrossRef] [PubMed]
- Innes-Hughes, C.; Hardy, L.L.; Venugopal, K.; King, L.A.; Wolfenden, L.; Rangan, A. Children‘s consumption of energy-dense nutrient-poor foods, fruit and vegetables: Are they related? An analysis of data from a cross sectional survey. Health Promot. J. Austr. 2011, 22, 210–216. [Google Scholar] [CrossRef] [PubMed]
- Fonseca, P.C.A.; Ribeiro, S.A.V.; Andreoli, C.S.; de Carvalho, C.A.; Pessoa, M.C.; de Novaes, J.F.; Priore, S.E.; Franceschini, S.D.C.C. Association of exclusive breastfeeding duration with consumption of ultra-processed foods, fruit and vegetables in Brazilian children. Eur. J. Nutr. 2019, 58, 2887–2894. [Google Scholar] [CrossRef] [PubMed]
- Marçal, G.; Mendes, M.; Fragoso, M.; Florêncio, T.; Bueno, N.; Clemente, A. Association between the consumption of ultra-processed foods and the practice of breast-feeding in children under 2 years of age who are beneficiaries of the conditional cash transfer programme, Bolsa Família. Public Health Nutr. 2021, 24, 3313–3321. [Google Scholar] [CrossRef] [PubMed]
- Soares, M.M.; Juvanhol, L.L.; Ribeiro, S.A.V.; Franceschini, S.D.C.C.; Araújo, R.M.A. Prevalence of processed and ultra-processed food intake in Brazilian children (6–24 months) is associated with maternal consumption and breastfeeding practices. Int. J. Food Sci. Nutr. 2021, 71, 978–988. [Google Scholar] [CrossRef]
- Vasconcelos, F.D.A.G.D.; Machado, M.L.; Medeiros, M.A.T.D.; Neves, J.A.; Recine, E.; Pasquim, E.M. Public policies of food and nutrition in Brazil: From Lula to Temer. Rev. Nutr. 2019, 32, e180161. [Google Scholar] [CrossRef]
- Ministério da Saúde. Saúde da Criança: Nutrição Infantil: Aleitamento Materno e Alimentação Complementar; Ministério da Saúde: Brasília, Brazil, 2009; ISBN 978-85-334-1561-4.
- Programa das Nações Unidas para o Desenvolvimento; Instituto de Pesquisa Econômica Aplicada; Fundação João Pinheiro. Desenvolvimento Humano nas Macrorregiões Brasileiras: 2016; PNUD: Brasília, Brazil; IPEA: Brasília, Brazil; FJP: Brasília, Brazil, 2016; ISBN 978-85-88201-31-6. [Google Scholar]
- Lignani, J.B.; Sichieri, R.; Burlandy, L.; Salles-Costa, R. Changes in food consumption among the Programa Bolsa Família participant families in Brazil. Public Health Nutr. 2011, 14, 785–792. [Google Scholar] [CrossRef] [PubMed]
- United Nations Children’s Fund. Alimentação na Primeira Infância: Conhecimentos, Atitudes e Práticas de Beneficiários do Programa Bolsa Família; UNICEF: Brasília, Brazil, 2021; ISBN 978-65-89933-01-4. [Google Scholar]
- Secretaria de Avaliação, Gestão da Informação e Cadastro Único (SAGICAD). Percentual de Cobertura das Famílias do Bolsa Família com Base na Estimativa de Famílias Pobres do Censo IBGE 2010. Available online: https://aplicacoes.cidadania.gov.br (accessed on 22 April 2024).
- Neves, J.A.; Vasconcelos, F.D.A.G.D.; Machado, M.L.; Recine, E.; Garcia, G.S.; Medeiros, M.A.T.D. The Brazilian cash transfer program (Bolsa Família): A tool for reducing inequalities and achieving social rights in Brazil. Glob. Public Health 2022, 17, 26–42. [Google Scholar] [CrossRef] [PubMed]
- Diário Oficial da União. Medida Provisória n. 1.164 de 02 de Março de 2023. Institui o Programa Bolsa Família e Altera a Lei nº 8.742, de 7 de Dezembro de 1993, que Dispõe Sobre a Organização da Assistência Social, e a Lei nº 10.820, de 17 de Dezembro de 2003, que Dispõe Sobre a Autorização para Desconto em Folha de Pagamento; Diário Oficial da União: Brasília, Brazil, 2023. [Google Scholar]
- Damião, J.J.; Lobato, E.; Silva, J.P.; Silva, C.V.C.; Castro, L.M.C.; Maldonado, L.A.; Ribeiro, A.A. Condicionalidades de saúde no Programa Bolsa Família e a vigilância alimentar e nutricional: Narrativas de profissionais da atenção primária à saúde. Cad. Saúde Pública 2021, 37, e00249120. [Google Scholar] [CrossRef] [PubMed]
- Ricci, J.M.S.; Romito, A.L.Z.; Silva, S.A.D.; Carioca, A.A.F.; Lourenço, B.H. Marcadores do consumo alimentar do Sisvan: Tendência temporal da cobertura e integração com o e-SUS APS, 2015–2019. Ciênc. Saúde Coletiva 2023, 28, 921–934. [Google Scholar] [CrossRef]
- Instituto Brasileiro de Geografia e Estatística. Pesquisa Nacional por Amostra de Domicílios Contínua 2012/2019: Características Gerais dos Domicílios e dos Moradores 2019; IBGE: Rio de Janeiro, Brazil, 2020; ISBN 978-85-240-4530-1. [Google Scholar]
- Federal University of Rio de Janeiro. Sociodemographic Characteristics: Demographic, Socioeconomic and Food Security Aspects; Brazilian National Survey on Child Nutrition (ENANI-2019); UFRJ: Rio de Janeiro, Brazil, 2021. [Google Scholar]

| Total (n = 600,138) | 2015 (n = 39,197) | 2016 (n = 101,636) | 2017 (n = 127,514) | 2018 (n = 162,246) | 2019 (n = 169,545) | APC (95% CI) | p * | |
|---|---|---|---|---|---|---|---|---|
| Total sample | ||||||||
| BBFP | 43.7 (43.5; 43.8) | 43.4 (42.9; 43.9) | 42.7 (42.4; 43.0) | 39.7 (39.4; 40.0) | 44.0 (43.7; 44.2) | 47.0 (46.8; 47.3) | 4.45 (−9.22; 20.18) | 0.396 |
| NBFP | 56.3 (56.2; 56.4) | 56.6 (56.1; 57.1) | 57.3 (57.0; 57.6) | 60.3 (60.0; 60.5) | 56.0 (55.8; 56.2) | 53.0 (52.7; 53.2) | −3.49 (−13.19; 7.28) | 0.363 |
| Brazilian macroregions | ||||||||
| BBFP | ||||||||
| North | 8.2 (8.1; 8.3) | 15.5 (14.9; 16.0) | 9.9 (9.6; 10.2) | 6.1 (5.9; 6.3) | 7.5 (7.3; 7.7) | 7.7 (7.5; 7.8) | −32.01 (−64.71; 30.66) | 0.156 |
| Northeast | 32.5 (32.3; 32.6) | 35.9 (35.1; 36.6) | 29.1 (28.7; 29.6) | 21.6 (21.3; 22.0) | 31.4 (31.1; 31.8) | 41.4 (41.0; 41.7) | 8.66 (−43.42; 108.69) | 0.713 |
| Southeast | 49.5 (49.3; 49.7) | 33.4 (32.7; 34.1) | 50.3 (49.8; 50.8) | 63.0 (62.6; 63.4) | 50.6 (50.3; 51.0) | 42.9 (42.6; 43.3) | 12.64 (−38.63; 106.76) | 0.577 |
| South | 6.4 (6.3; 6.5) | 7.7 (7.3; 8.1) | 5.7 (5.4; 5.9) | 5.9 (5.7; 6.1) | 7.5 (7.3; 7.7) | 5.7 (5.5; 5.8) | −1.86 (−24.85; 28.16) | 0.837 |
| Midwest | 3.4 (3.4; 3.5) | 7.5 (7.2; 7.9) | 4.9 (4.7; 5.2) | 3.3 (3.1; 3.4) | 2.9 (2.8; 3.0) | 2.4 (2.2; 2.5) | −47.61 (−60.77; −30.03) | 0.006 |
| NBFP | ||||||||
| North | 5.5 (5.4; 5.6) | 10.9 (10.4; 11.3) | 7.0 (6.9; 7.2) | 4.1 (3.9; 4.2) | 4.8 (4.6; 4.9) | 5.1 (5.0; 5.3) | −35.38 (−67.06; 26.77) | 0.131 |
| Northeast | 16.0 (15.8; 16.1) | 15.0 (14.6; 15.5) | 12.8 (12.5; 13.0) | 10.0 (9.8; 10.2) | 15.7 (15.4; 15.9) | 23.6 (23.3; 23.9) | 29.20 (−37.10; 165.39) | 0.340 |
| Southeast | 61.6 (61.5; 61.8) | 46.1 (45.4; 46.7) | 62.5 (62.1; 62.9) | 71.4 (71.1; 71.7) | 61.8 (61.5; 62.1) | 56.3 (56.0; 56.6) | 9.51 (−27.19; 64.71) | 0.530 |
| South | 12.1 (12.0; 12.2) | 14.8 (14.4; 15.3) | 10.2 (9.9; 10.4) | 10.0 (9.8; 10.2) | 13.9 (13.7; 14.1) | 12.6 (12.3; 12.8) | 1.96 (−33.47; 56.26) | 0.894 |
| Midwest | 4.8 (4.8; 4.9) | 13.1 (12.7; 13.6) | 7.5 (7.3; 7.7) | 4.5 (4.4; 4.7) | 3.8 (3.7; 3.9) | 2.3 (2.2; 2.4) | −61.09 (−69.30; −50.67) | 0.001 |
| Age (months) | ||||||||
| BBFP | ||||||||
| 6–11 | 32.5 (32.3; 32.7) | 33.3 (32.6; 34.0) | 32.8 (32.4; 33.2) | 31.4 (31.0; 31.8) | 36.8 (36.4; 37.1) | 29.1 (28.8; 29.4) | 1.68 (−6.40; 10.47) | 0.477 |
| 12–17 | 31.9 (31.7; 32.1) | 32.0 (31.3; 32.7) | 32.2 (31.7; 32.6) | 30.8 (30.4; 31.2) | 30.8 (30.4; 31.1) | 33.4 (33.1; 33.7) | 0.21 (−6.92; 7.88) | 0.934 |
| 18–23 | 35.6 (35.4; 35.8) | 34.7 (34.0; 35.5) | 35.0 (34.5; 35.4) | 37.8 (37.4; 38.2) | 32.4 (32.1; 32.8) | 37.5 (37.2; 37.8) | −0.80 (−7.22; 6.05) | 0.726 |
| NBFP | ||||||||
| 6–11 | 39.8 (39.7; 40.0) | 44.0 (43.3; 44.6) | 42.8 (42.4; 43.2) | 38.0 (37.6; 38.3) | 38.4 (38.0; 38.7) | 40.0 (39.7; 40.3) | −6.85 (−16.84; 4.35) | 0.141 |
| 12–17 | 31.1 (31.0; 31.3) | 31.4 (30.8; 32.0) | 32.0 (31.7; 32.4) | 32.0 (31.7; 32.4) | 30.8 (30.5; 31.1) | 30.0 (29.8; 30.3) | −2.92 (−7.64; 2.04) | 0.155 |
| 18–23 | 29.0 (28.9; 29.2) | 24.6 (24.0; 25.1) | 25.1 (24.8; 25.5) | 30.0 (29.7; 30.3) | 30.8 (30.5; 31.1) | 29.9 (29.7; 30.2) | 15.93 (2.93; 30.57) | 0.029 |
| 2015 (n = 39,197) | 2016 (n = 101,636) | 2017 (n = 127,514) | 2018 (n = 162,246) | 2019 (n = 169,545) | APC (95%CI) | p* | ||||||
|---|---|---|---|---|---|---|---|---|---|---|---|---|
| Food Introduction (at 6–8 months) † | ||||||||||||
| Total Sample | 21.5 | (20.6; 22.4) | 22.7 | (22.1; 23.3) | 24.1 | (23.5; 24.7) | 23.4 | (22.9; 23.9) | 23.6 | (23.1; 24.1) | 5.11 (−2.45; 13.25) | 0.124 |
| Brazilian Macroregions | ||||||||||||
| North | 16.2 | (13.9; 18.9) | 15.3 | (13.6; 17.2) | 17.7 | (15.3; 20.3) | 16.1 | (14.4; 17.9) | 14.1 | (12.6; 15.7) | −4.48 (−19.91; 14.40) | 0.492 |
| Northeast | 14.0 | (12.4; 15.7) | 15.2 | (14.1; 16.4) | 15.1 | (13.8; 16.5) | 15.6 | (14.7; 16.4) | 17.6 | (16.9; 18.4) | 9.96 (3.91; 15.95) | 0.012 |
| Southeast | 24.9 | (23.4; 26.4) | 25.7 | (24.9; 26.5) | 25.3 | (24.6; 25.9) | 26.8 | (26.1; 27.4) | 27.8 | (27.1; 28.5) | 6.11 (1.94; 10.45) | 0.018 |
| South | 21.2 | (18.9; 23.7) | 23.1 | (21.3; 25.1) | 28.6 | (26.7; 30.5) | 26.9 | (25.4; 28.3) | 27.7 | (26.1; 29.3) | 17.24 (−1.30; 39.27) | 0.061 |
| Midwest | 27.4 | (24.8; 30.1) | 26.4 | (24.2; 28.7) | 27.3 | (24.8; 30.0) | 23.2 | (20.8; 25.8) | 22.9 | (19.9; 26.1) | −11.03 (−18.51; −2.86) | 0.024 |
| Minimum Meal Frequency and Appropriate Consistency ‡ | ||||||||||||
| Total Sample | 71.6 | (71.1; 72.1) | 75.6 | (75.4; 75.9) | 77.7 | (77.4; 77.9) | 75.6 | (75.4; 75.8) | 75.6 | (75.3; 75.8) | 2.53 (−3.94; 9.45) | 0.309 |
| Brazilian Macroregions | ||||||||||||
| North | 63.2 | (61.8; 64.5) | 65.1 | (64.0; 66.1) | 65.4 | (64.2; 66.6) | 62.6 | (61.6; 63.5) | 64.1 | (63.2; 65.0) | −0.72 (−4.54; 3.25) | 0.600 |
| Northeast | 54.0 | (53.0; 55.0) | 56.2 | (55.5; 57.0) | 58.0 | (57.3; 58.7) | 58.6 | (58.1; 59.1) | 61.9 | (61.4; 62.3) | 6.90 (5.62; 8.19) | <0.001 |
| Southeast | 80.6 | (80.0; 81.2) | 82.4 | (82.1; 82.7) | 81.9 | (81.6; 82.1) | 82.0 | (81.8; 82.3) | 83.7 | (83.4; 83.9) | 1.23 (−0.02; 2.50) | 0.052 |
| South | 81.0 | (79.8; 82.1) | 81.6 | (80.7; 82.5) | 84.1 | (83.3; 84.8) | 82.5 | (81.9; 83.0) | 84.6 | (84.0; 85.1) | 2.09 (0.46; 3.75) | 0.026 |
| Midwest | 75.9 | (74.6; 77.2) | 78.5 | (77.5; 79.5) | 78.5 | (77.3; 79.6) | 79.5 | (78.4; 80.6) | 81.2 | (80.0; 82.4) | 3.13 (1.89; 4.38) | 0.004 |
| Age (months) | ||||||||||||
| 6–11 | 63.2 | (62.4; 63.9) | 66.8 | (66.4; 67.3) | 69.1 | (68.6; 69.5) | 66.7 | (66.3; 67.1) | 66.1 | (65.7; 66.5) | 2.75 (−5.96; 12.27) | 0.401 |
| 12–17 | 75.5 | (74.8; 76.3) | 79.8 | (79.3; 80.2) | 80.8 | (80.4; 81.2) | 79.1 | (78.7; 79.4) | 78.7 | (78.3; 79.0) | 1.68 (−4.21; 7.94) | 0.440 |
| 18–23 | 78.7 | (77.9; 79.5) | 82.5 | (82.0; 82.9) | 83.7 | (83.4; 84.1) | 82.7 | (82.4; 83.0) | 82.3 | (82.0; 82.6) | 2.12 (−2.79; 7.29) | 0.268 |
| Minimum Dietary Diversity | ||||||||||||
| Total Sample | 43.3 | (42.8; 43.8) | 45.9 | (45.6; 46.2) | 48.5 | (48.2; 48.7) | 45.9 | (45.7; 46.1) | 45.8 | (45.5; 46.0) | 2.60 (−6.75; 12.89) | 0.455 |
| Brazilian Macroregions | ||||||||||||
| North | 28.9 | (27.7; 30.2) | 27.1 | (26.2; 28.1) | 25.1 | (24.0; 26.2) | 24.8 | (24.0; 25.7) | 25.7 | (24.9; 26.5) | −7.14 (−16.04; 2.71) | 0.101 |
| Northeast | 33.0 | (32.1; 34.0) | 33.6 | (33.0; 34.3) | 36.0 | (35.3; 36.7) | 35.2 | (34.7; 35.7) | 35.7 | (35.3; 36.1) | 4.86 (−0.57; 10.03) | 0.051 |
| Southeast | 51.2 | (50.4; 51.9) | 52.3 | (51.9; 52.7) | 53.1 | (52.8; 53.5) | 51.8 | (51.5; 52.2) | 54.0 | (53.6; 54.3) | 1.53 (−0.43; 3.53) | 0.090 |
| South | 46.0 | (44.5; 47.4) | 47.5 | (46.4; 48.5) | 46.9 | (45.9; 47.8) | 48.2 | (47.5; 48.9) | 48.7 | (47.9; 49.5) | 2.74 (1.56; 3.95) | 0.005 |
| Midwest | 51.3 | (49.7; 52.8) | 48.4 | (47.2; 49.6) | 46.1 | (44.8; 47.5) | 47.4 | (46.1; 48.7) | 49.8 | (48.3; 51.4) | −1.81 (−12.06; 9.63) | 0.634 |
| Age (months) | ||||||||||||
| 6–11 | 36.5 | (35.8; 37.3) | 37.9 | (37.4; 38.4) | 40.7 | (40.2; 41.2) | 38.1 | (37.7; 38.4) | 38.0 | (37.6; 38.3) | 1.95 (−7.22; 12.04) | 0.561 |
| 12–17 | 47.7 | (46.8; 48.5) | 51.0 | (50.4; 51.5) | 52.6 | (52.1; 53.1) | 50.4 | (50.0; 50.8) | 49.6 | (49.2; 50.1) | 1.56 (−7.49; 11.51) | 0.633 |
| 18–23 | 47.8 | (46.9; 48.7) | 50.8 | (50.3; 51.4) | 52.8 | (52.3; 53.3) | 50.9 | (50.5; 51.3) | 50.2 | (49.7; 50.6) | 2.36 (−6.24; 11.76) | 0.460 |
| 2015 (n = 39,197) | 2016 (n = 101,636) | 2017 (n = 127,514) | 2018 (n = 162,246) | 2019 (n = 169,545) | APC (95%CI) | p * | ||||||
|---|---|---|---|---|---|---|---|---|---|---|---|---|
| Iron-rich Food Consumption | ||||||||||||
| Total Sample | 90.0 | (89.7; 90.3) | 91.4 | (91.2; 91.6) | 92.6 | (92.5; 92.7) | 91.3 | (91.2; 91.4) | 91.1 | (91.0; 91.2) | 0.54 (−1.98; 3.12) | 0.550 |
| Brazilian Macroregions | ||||||||||||
| North | 83.0 | (81.9; 84.0) | 81.3 | (80.5; 82.2) | 81.8 | (80.9; 82.8) | 81.1 | (80.3; 81.9) | 80.8 | (80.0; 81.5) | −1.10 (−1.84; −0.16) | 0.017 |
| Northeast | 84.2 | (83.4; 84.9) | 85.2 | (84.7; 85.7) | 86.9 | (86.4; 87.3) | 85.7 | (85.4; 86.1) | 86.7 | (86.4; 87.0) | 1.42 (−0.38; 3.24) | 0.087 |
| Southeast | 94.4 | (94.1; 94.8) | 94.8 | (94.6; 95.0) | 94.6 | (94.4; 94.7) | 94.3 | (94.1; 94.4) | 94.8 | (94.6; 94.9) | −0.06 (−0.43; 0.31) | 0.635 |
| South | 92.8 | (92.0; 93.5) | 92.0 | (91.4; 92.6) | 92.8 | (92.3; 93.3) | 92.5 | (92.1; 92.9) | 92.9 | (92.5; 93.3) | 0.26 (−0.10; 0.63) | 0.105 |
| Midwest | 91.7 | (90.8; 92.5) | 92.2 | (91.6; 92.9) | 92.5 | (91.8; 93.2) | 92.8 | (92.1; 93.4) | 93.5 | (92.6; 94.2) | 0.96 (0.73; 1.20) | 0.003 |
| Age (months) | ||||||||||||
| 6–11 | 82.4 | (81.8; 83.0) | 84.6 | (84.2; 85.0) | 86.6 | (86.3; 86.9) | 84.3 | (84.0; 84.6) | 83.6 | (83.3; 83.9) | 0.59 (−4.13; 5.55) | 0.721 |
| 12–17 | 94.3 | (93.9; 94.7) | 95.1 | (94.9; 95.3) | 95.2 | (95.0; 95.4) | 94.7 | (94.6; 94.9) | 94.3 | (94.1; 94.5) | −0.10 (−1.28; 1.09) | 0.810 |
| 18–23 | 95.7 | (95.3; 96.1) | 96.3 | (96.1; 96.5) | 96.5 | (96.3; 96.7) | 96.3 | (96.1; 96.5) | 95.9 | (95.8; 96.1) | 0.10 (−0.80; 1.01) | 0.756 |
| Vitamin A-rich Food Consumption | ||||||||||||
| Total Sample | 63.5 | (63.0; 64.0) | 65.2 | (64.9; 65.5) | 66.2 | (65.9; 66.5) | 63.8 | (63.5; 64.0) | 63.5 | (63.2; 63.7) | −0.53 (−5.20; 4.37) | 0.749 |
| Brazilian Macroregions | ||||||||||||
| North | 50.4 | (49.0; 51.8) | 49.2 | (48.2; 50.3) | 46.5 | (45.3; 47.8) | 46.5 | (45.5; 47.5) | 48.8 | (47.9; 49.8) | −2.81 (−10.21; 5.20) | 0.336 |
| Northeast | 53.6 | (52.5; 54.6) | 53.8 | (53.1; 54.5) | 55.2 | (54.5; 55.9) | 55.5 | (55.0; 56.0) | 54.6 | (54.1; 55.0) | 1.79 (−0.72; 4.35) | 0.109 |
| Southeast | 70.8 | (70.1; 71.5) | 70.8 | (70.4; 71.2) | 70.3 | (70.0; 70.6) | 68.5 | (68.2; 68.8) | 70.5 | (70.2; 70.8) | −1.82 (−3.31; −0.31) | 0.035 |
| South | 66.8 | (65.4; 68.2) | 67.5 | (66.5; 68.5) | 64.3 | (63.4; 65.2) | 65.6 | (64.9; 66.2) | 65.5 | (64.8; 66.2) | −1.80 (−4.62; 1.09) | 0.140 |
| Midwest | 70.5 | (69.1; 71.9) | 68.1 | (67.0; 69.3) | 64.2 | (62.9; 65.5) | 64.5 | (63.3; 65.8) | 66.4 | (64.9; 67.9) | −3.90 (−10.88; 3.63) | 0.192 |
| Age (months) | ||||||||||||
| 6–11 | 61.4 | (60.6; 62.1) | 62.8 | (62.4; 63.3) | 63.9 | (63.5; 64.4) | 61.3 | (60.9; 61.6) | 61.2 | (60.8; 61.6) | −0.77 (−5.33; 4.01) | 0.638 |
| 12–17 | 65.5 | (64.6; 66.3) | 67.5 | (67.0; 68.0) | 67.9 | (67.5; 68.4) | 65.7 | (65.3; 66.2) | 65.3 | (64.9; 65.7) | −0.80 (−5.25; 3.86) | 0.617 |
| 18–23 | 64.3 | (63.4; 65.2) | 65.8 | (65.3; 66.4) | 67.0 | (66.5; 67.4) | 64.9 | (64.4; 65.3) | 64.1 | (63.7; 64.5) | −0.45 (−5.17; 4.50) | 0.787 |
| Ultra-processed Food Consumption | ||||||||||||
| Total Sample | 58.2 | (57.7; 58.7) | 54.8 | (54.4; 55.1) | 52.5 | (52.2; 52.8) | 50.0 | (49.8; 50.3) | 50.4 | (50.2; 50.6) | −8.66 (−11.88; −5.32) | 0.004 |
| Brazilian Macroregions | ||||||||||||
| North | 60.7 | (59.4; 62.1) | 57.3 | (56.3; 58.4) | 56.1 | (54.8; 57.3) | 56.6 | (55.6; 57.6) | 52.6 | (51.7; 53.6) | −5.63 (−8.43; −2.75) | 0.009 |
| Northeast | 53.7 | (52.7; 54.7) | 53.8 | (53.1; 54.5) | 52.0 | (51.3; 52.8) | 48.4 | (47.9; 48.9) | 48.9 | (48.5; 49.3) | −7.37 (−10.52; −4.11) | 0.006 |
| Southeast | 61.1 | (60.3; 61.8) | 54.5 | (54.1; 54.9) | 51.6 | (51.3; 51.9) | 48.4 | (48.1; 48.7) | 49.7 | (49.3; 50.0) | −11.67 (−18.61; −4.14) | 0.017 |
| South | 59.3 | (57.9; 60.7) | 56.5 | (55.4; 57.6) | 57.1 | (56.2; 58.0) | 56.2 | (55.5; 56.9) | 55.7 | (54.9; 56.5) | −2.59 (−4.47; −0.67) | 0.023 |
| Midwest | 53.3 | (51.8; 54.8) | 54.4 | (53.1; 55.6) | 55.4 | (54.1; 56.8) | 57.0 | (55.7; 58.3) | 59.6 | (58.1; 61.1) | 6.39 (4.11; 8.73) | 0.003 |
| Age (months) | ||||||||||||
| 6–11 | 42.2 | (41.4; 43.0) | 37.8 | (37.3; 38.3) | 35.7 | (35.2; 36.1) | 33.4 | (33.1; 33.8) | 32.7 | (32.3; 33.0) | −13.55 (−17.86; −9.01) | 0.003 |
| 12–17 | 64.7 | (63.8; 65.5) | 60.2 | (59.6; 60.7) | 57.1 | (56.6; 57.6) | 55.0 | (54.5; 55.4) | 54.6 | (54.2; 55.0) | −9.43 (−13.90; −4.73) | 0.008 |
| 18–23 | 72.9 | (72.1; 73.7) | 71.2 | (70.6; 71.7) | 66.0 | (65.6; 66.5) | 65.1 | (64.7; 65.5) | 64.9 | (64.6; 65.3) | −7.35 (−11.58; −2.91) | 0.014 |
| Zero Vegetable or Fruit Consumption | ||||||||||||
| Total Sample | 9.0 | (8.7; 9.3) | 8.0 | (7.9; 8.2) | 6.5 | (6.4; 6.7) | 7.2 | (7.0; 7.3) | 7.5 | (7.4; 7.6) | −10.26 (−30.56; 15.99) | 0.272 |
| Brazilian Macroregions | ||||||||||||
| North | 14.6 | (14.6; 16.6) | 15.9 | (15.2; 16.7) | 14.5 | (13.6; 15.4) | 15.4 | (14.7; 16.1) | 14.9 | (14.3; 15.6) | −0.62 (−3.70; 2.56) | 0.574 |
| Northeast | 13.5 | (12.9; 14.2) | 13.7 | (13.3; 14.2) | 11.8 | (11.3; 12.3) | 11.2 | (10.9; 11.5) | 11.1 | (10.8; 11.3) | −14.54 (−19.51; −9.25) | 0.004 |
| Southeast | 5.7 | (5.3; 6.0) | 5.2 | (5.1; 5.4) | 4.8 | (4.7; 5.0) | 4.9 | (4.8; 5.0) | 4.7 | (4.5; 4.8) | −9.68 (−17.10; −1.60) | 0.032 |
| South | 5.9 | (5.3; 6.6) | 6.7 | (6.2; 7.3) | 6.4 | (6.0; 6.9) | 6.0 | (5.6; 6.3) | 5.5 | (5.1; 5.8) | −5.99 (−19.66; 10.00) | 0.299 |
| Midwest | 6.5 | (5.8; 7.3) | 7.0 | (6.4; 7.6) | 7.0 | (6.3; 7.7) | 7.4 | (6.7; 8.1) | 7.2 | (6.5; 8.1) | 6.27 (3.62; 8.99) | 0.005 |
| Age (months) | ||||||||||||
| 6–11 | 11.9 | (11.3; 12.4) | 10.7 | (10.3; 11.0) | 9.0 | (8.8; 9.3) | 10.0 | (9.8; 10.3) | 10.5 | (10.3; 10.8) | −7.06 (−26.80; 18.01) | 0.401 |
| 12–17 | 7.1 | (6.6; 7.5) | 6.4 | (6.1; 6.6) | 5.3 | (5.0; 5.5) | 5.6 | (5.4; 5.8) | 6.2 | (6.0; 6.4) | −8.81 (−29.70; 18.29) | 0.342 |
| 18–23 | 7.1 | (6.7; 7.6) | 6.4 | (6.1; 6.7) | 5.1 | (4.9; 5.3) | 5.2 | (5.0; 5.4) | 5.5 | (5.3; 5.7) | −15.26 (−32.79; 6.84) | 0.108 |
| 2015 (n = 39,197) | 2016 (n = 101,636) | 2017 (n = 127,514) | 2018 (n = 162,246) | 2019 (n = 169,545) | APC (95% CI) | p * | |
|---|---|---|---|---|---|---|---|
| Brazilian Ministry of Health Indicators | |||||||
| Food introduction (at 6–8 months) | |||||||
| BBFP | 17.2 (16.4; 19.2) | 18.7 (17.8; 19.6) | 21.2 (20.3; 22.1) | 20.6 (19.9; 21.3) | 20.8 (20.0; 21.6) | 11.60 (−1.43; 26.37) | 0.067 |
| NBFP | 23.5 (22.4; 24.7) | 24.9 (24.2; 25.6) | 25.6 (24.9; 26.3) | 25.5 (24.9; 26.1) | 25.2 (24.5; 25.8) | 3.85 (−2.47; 10.57) | 0.151 |
| Minimum meal frequency and appropriate consistency | |||||||
| BBFP | 68.2 (67.4; 68.9) | 72.8 (72.4; 73.2) | 75.4 (75.0; 75.8) | 72.5 (72.2; 72.9) | 73.5 (73.2; 73.9) | 3.33 (−4.16; 11.40) | 0.260 |
| NBFP | 74.3 (73.7; 74.9) | 77.8 (77.4; 78.1) | 79.2 (78.9; 79.5) | 78.0 (77.7; 78.3) | 77.4 (77.1; 77.6) | 1.97 (−3.33; 7.56) | 0.329 |
| Minimum dietary diversity | |||||||
| BBFP | 38.5 (37.8; 39.2) | 41.7 (41.2; 42.2) | 44.8 (44.3; 45.2) | 41.9 (41.5; 42.3) | 42.6 (42.2; 42.9) | 4.79 (−6.44; 17.38) | 0.280 |
| NBFP | 47.0 (46.4; 47.7) | 49.0 (48.6; 49.4) | 50.9 (50.3; 51.2) | 49.1 (48.7; 49.4) | 48.5 (48.2; 48.9) | 1.52 (−5.58; 9.16) | 0.555 |
| Iron-rich food consumption | |||||||
| BBFP | 88.9 (88.5; 89.4) | 90.7 (90.5; 91.0) | 92.0 (91.8; 92.2) | 90.3 (90.0; 90.5) | 91.0 (90.8; 91.2) | 0.91 (−1.71; 3.60) | 0.352 |
| NBFP | 90.8 (90.5; 91.2) | 91.9 (91.7; 92.1) | 93.0 (92.8; 93.2) | 92.1 (91.9; 92.3) | 91.2 (91.0; 91.4) | 0.25 (−2.24; 2.81) | 0.771 |
| Vitamin A-rich food consumption | |||||||
| BBFP | 58.2 (57.5; 58.9) | 60.5 (60.0; 60.9) | 62.5 (62.1; 62.9) | 59.8 (59.5; 60.2) | 60.0 (59.6; 60.3) | 1.09 (−5.11; 7.69) | 0.625 |
| NBFP | 67.6 (67.0; 68.2) | 68.8 (68.4; 69.1) | 68.6 (68.3; 69.0) | 66.9 (66.6; 67.2) | 66.6 (66.3; 66.9) | −1.39 (−4.17; 1.46) | 0.216 |
| Ultra-processed food consumption | |||||||
| BBFP | 61.7 (61.0; 62.4) | 59.4 (58.9; 59.9) | 56.5 (56.1; 57.0) | 53.0 (52.6; 53.4) | 54.9 (54.6; 55.3) | −10.02 (−11.56; −8.46) | 0.001 |
| NBFP | 55.6 (54.9; 56.2) | 51.3 (50.9; 51.7) | 49.8 (49.5; 50.2) | 47.7 (47.4; 48.1) | 46.4 (46.1; 46.7) | −9.34 (−11.93; −6.67) | 0.002 |
| World Health Organization indicators | |||||||
| Zero vegetable or fruit consumption | |||||||
| BBFP | 11.2 (10.8; 11.7) | 10.0 (9.7; 10.3) | 8.2 (7.9; 8.4) | 8.9 (8.7; 9.1) | 8.8 (8.6; 9.0) | −12.87 (−28.98; 6.88) | 0.121 |
| NBFP | 7.2 (6.8; 7.6) | 6.6 (6.4; 6.8) | 5.5 (5.3; 5.6) | 5.8 (5.7; 6.0) | 6.3 (6.2; 6.5) | −8.67 (−27.55; 15.12) | 0.301 |
| Introduction of solid, semi-solid or soft food 6–8 months | |||||||
| BBFP | 93.8 (92.8; 94.6) | 93.5 (92.9; 94.0) | 94.1 (93.6; 94.6) | 94.2 (93.8; 94.6) | 94.2 (93.7; 94.6) | 0.46 (0.15; 0.76) | 0.018 |
| NBFP | 94.5 (93.9; 95.1) | 94.7 (94.3; 95.0) | 95.0 (94.7; 95.4) | 94.9 (94.6; 95.2) | 94.6 (94.2; 94.9) | 0.09 (−0.47; 0.67) | 0.635 |
| Unhealthy food consumption | |||||||
| BBFP | 45.9 (45.1; 46.6) | 44.8 (44.4; 45.3) | 42.7 (42.2; 43.1) | 40.2 (39.8; 40.5) | 41.8 (41.4; 42.1) | −8.58 (−11.33; −5.76) | 0.006 |
| NBFP | 40.8 (40.2; 41.5) | 37.6 (37.2; 38.0) | 36.9 (36.6; 37.3) | 35.7 (35.4; 36.0) | 34.5 (34.2; 34.9) | −8.20 (−10.95; −5.36) | 0.003 |
| Egg and/or flesh food consumption | |||||||
| BBFP | 79.6 (79.0; 80.2) | 80.4 (80.1; 80.8) | 81.3 (80.9; 81.6) | 79.9 (79.6; 80.2) | 81.8 (81.5; 82.1) | 0.73 (−0.46; 1.93) | 0.146 |
| NBFP | 82.0 (81.5; 82.5) | 82.3 (82.0; 82.6) | 83.5 (83.2; 83.7) | 83.0 (82.7; 83.2) | 82.2 (81.9; 82.4) | 0.31 (−1.61; 2.27) | 0.644 |
| Egg and/or flesh food consumption (without processed meat) | |||||||
| BBFP | 78.1 (77.5; 78.7) | 79.1 (78.7; 79.4) | 80.1 (79.7; 80.4) | 78.8 (78.5; 79.1) | 80.5 (80.2; 80.8) | 1.02 (−0.39; 2.44) | 0.106 |
| NBFP | 80.9 (80.4; 81.5) | 81.4 (81.0; 81.7) | 82.7 (82.4; 82.9) | 82.2 (81.9; 82.4) | 81.3 (81.1; 81.6) | 0.45 (−1.80; 2.75) | 0.574 |
Disclaimer/Publisher’s Note: The statements, opinions and data contained in all publications are solely those of the individual author(s) and contributor(s) and not of MDPI and/or the editor(s). MDPI and/or the editor(s) disclaim responsibility for any injury to people or property resulting from any ideas, methods, instructions or products referred to in the content. |
© 2024 by the authors. Licensee MDPI, Basel, Switzerland. This article is an open access article distributed under the terms and conditions of the Creative Commons Attribution (CC BY) license (https://creativecommons.org/licenses/by/4.0/).
Share and Cite
Andrade-Silva, A.; Farias, D.R.; Carrilho, T.R.B.; de Castro, I.R.R.; Kac, G.; de Castro, M.B.T. Trends in Complementary Feeding Indicators in Children Aged 6–23 Months According to Participation in a Conditional Cash Transfer Program: Data from the Brazilian Food and Nutrition Surveillance System, 2015–2019. Int. J. Environ. Res. Public Health 2024, 21, 923. https://doi.org/10.3390/ijerph21070923
Andrade-Silva A, Farias DR, Carrilho TRB, de Castro IRR, Kac G, de Castro MBT. Trends in Complementary Feeding Indicators in Children Aged 6–23 Months According to Participation in a Conditional Cash Transfer Program: Data from the Brazilian Food and Nutrition Surveillance System, 2015–2019. International Journal of Environmental Research and Public Health. 2024; 21(7):923. https://doi.org/10.3390/ijerph21070923
Chicago/Turabian StyleAndrade-Silva, Andreia, Dayana Rodrigues Farias, Thais Rangel Bousquet Carrilho, Inês Rugani Ribeiro de Castro, Gilberto Kac, and Maria Beatriz Trindade de Castro. 2024. "Trends in Complementary Feeding Indicators in Children Aged 6–23 Months According to Participation in a Conditional Cash Transfer Program: Data from the Brazilian Food and Nutrition Surveillance System, 2015–2019" International Journal of Environmental Research and Public Health 21, no. 7: 923. https://doi.org/10.3390/ijerph21070923