Abstract
This systematic review investigates the certainty of evidence (CoE) regarding noise annoyance as a determinant of biological changes known to contribute to disease development. We searched PubMed MEDLINE, EMBASE, Cochrane Central, and CINAHL for English-language comparative studies conducted on humans of any age from 1 January 1940, to 28 August 2023. Further, studies that provided quantitative data on the relationship between noise annoyance and biomarkers of interest were included. Where possible, random-effects meta-analyses were used to calculate the odds ratios of noise annoyance on biomarkers and biological conditions considered to be risk factors for developing health effects. The risk of bias of individual studies was assessed using the Risk of Bias of Non-randomized Studies of Exposures (ROBINS-E) instrument. The CoE for each outcome was assessed using the Grading of Recommendations Assessment, Development and Evaluation (GRADE) approach. The search identified 23 primary studies reporting on relevant biomarkers. Although some studies and pooled estimates suggest a possible association between noise annoyance and biological measures, the CoE overall is very low due to concerns with the risk of bias, inconsistency, and imprecision in the estimates of effects. In the context of environmental impact assessment, where guidelines aim to mitigate the prevalence of populations experiencing a high level of noise annoyance, our results suggest that such practices should be grounded in the understanding that annoyance is health-relevant because it reflects an undesirable reaction to noise, rather than a precursor to chronic physical health conditions.
1. Introduction
Noise has been studied in relation to numerous extra-aural stress-related metabolic effects, sleep disturbance, and cardiovascular disease for several decades, yet there remains a great deal of inconsistency in its association with the evaluated outcomes and the magnitude of association [1,2,3,4,5]. According to the World Health Organization (WHO), as many as 1.6 million healthy life years may be lost each year in urban areas across Europe due to noise exposure [6]. While noise thresholds and guidelines have been implemented to reduce adverse health effects, the mechanisms by which noise impacts human health beyond the auditory system are not entirely known. Nevertheless, the annoyance response has long been considered to fall along the indirect pathway between exposure and adverse outcomes [7].
As the most common reaction to an unwanted noise exposure, noise annoyance is characterized as an adverse reaction to environmental noise. Its manifestation at a sustained and high magnitude can be interpreted as an inability to cope with an exposure, leading to stressor reactions, which may contribute to allostatic load. While the body’s stress responses are essential for survival, sustained stress is associated with chronic activation and dysregulation of stress response systems that in turn are associated with an increased risk of disease [8]. This has been conceptualized as allostatic load—essentially the wear and tear on the body from stressor exposure [9,10]. Allostatic load has typically been operationalized by assessing whether measures that represent our stress response systems or their downstream effects—notably endocrine, inflammatory, cardiovascular, and metabolic—surpass risk thresholds. Understanding how noise annoyance may affect these systems would inform how noise annoyance is interpreted in the context of noise policy in general and environmental impact assessment in particular.
Health Canada provides advice on the potential health impacts of noise exposure in support of the federal environmental impact assessment process [11]. Although other population responses are considered (e.g., sleep disturbance), a central facet of Health Canada’s advice on noise and human health emphasizes predicting the change in prevalence of high noise annoyance experienced by a community exposed to project-related changes in noise. Although there exists a variety of Canadian, U.S., and international criteria and targets for noise mitigation with respect to environmental impact assessment, Health Canada’s use of annoyance is consistent with other provincial jurisdictions and precedents from the U.S. and international standard-setting bodies [12,13]. However, noise annoyance in Health Canada’s federal environmental impact assessment evaluation process is largely rooted in its alignment with the expansive World Health Organization (WHO) definition of health, affirmed in the WHO (2020) Constitution as “a state of complete physical, mental and social well-being and not merely the absence of disease or infirmity” (p.1) rather than the strength of its correlation with established biological risk factors, such as those activated in response to stressor exposure [14].
This systematic review presents a comprehensive overview of the available evidence on the relationship of noise annoyance to biomarkers that precede health effects, including those related to cardiovascular diseases. This review aims to inform researchers and policymakers and to support future research and strategies to manage the potential effects of noise annoyance. The authors acknowledge that sustained noise-induced sleep disturbance has been proposed as a pathway to adverse health; however, this falls outside the scope of the current review. In addition, this review does not consider annoyance as a potential precursor to mental health [15,16]. The results of our analysis would only be applicable to depression, anxiety, or other mental illnesses where the biomarkers evaluated are established as risk factors for such conditions.
2. Methods
We conducted a systematic review of the association between noise annoyance and certain biomarkers that may precede adverse health effects. We followed the Preferred Reporting Items for Systematic Reviews and Meta-Analyses (PRISMA) checklist for the development of this review [17]. The protocol is registered in PROSPERO: CRD42023465309.
2.1. Literature Search
An information specialist conducted searches in MEDLINE via PubMed, EMBASE, Cochrane Central, and CINAHL from 1 January 1940, through 28 August 2023, for peer-reviewed primary studies reporting on noise annoyance and biomarkers related to cardiovascular diseases, oxidative stress, and diabetes (Supplemental Table S1). The search was restricted to English-language studies. Additionally, we conducted a search of the references from prior systematic reviews on the effect of noise on stress to identify any additional sources of data on biomarkers [1,2,3].
2.2. Study Selection
The Population, Exposure, Comparator, and Outcomes (PECO) model was applied. Humans of any age made up the population, noise annoyance was considered the exposure, the degree of annoyance the comparator, and biomarkers of interest constituted the outcome. Studies conducted on humans of any age that provided quantitative data on the relationship between noise annoyance and biomarkers of interest were included. Studies reporting any source of noise, duration of noise annoyance, and any self-reported measure of noise annoyance were eligible. Eligible cardiovascular biomarkers include C-reactive protein (CRP), cortisol, brain-derived neurotrophic factor (BDNF), aldosterone, interleukin-6 (IL-6), tumor necrosis factor-alpha (TNF-α), adrenomedullin, endothelin-1 (ET-1), norepinephrine, epinephrine, troponin, lipid profile (elevated total cholesterol, low-density lipoprotein [LDL] cholesterol, and triglycerides, as well as decreased high-density lipoprotein [HDL] cholesterol), fibrinogen, homocysteine, oxidized low-density lipoprotein (ox-LDL), heart rate variability (HRV), systolic blood pressure, diastolic blood pressure, brain natriuretic peptide (BNP), D-dimer, soluble intercellular adhesion molecule-1 (sICAM-1), myeloperoxidase (MPO), pro-atrial natriuretic peptide, and galectin-3. Eligible oxidative stress biomarkers include reactive oxygen species (ROS), malondialdehyde (MDA), superoxide dismutase (SOD), catalase (CAT), glutathione peroxidase, total antioxidant capacity (TAC), nitric oxide (NO), advanced oxidation protein products (AOPPs), and 8-hydroxy-2′-deoxyguanosine (8-OHdG). Eligible biomarkers related to diabetes include fasting plasma glucose (FPG), glycated hemoglobin (HbA1c), oral glucose tolerance test (OGTT), insulin, C-peptide, adiponectin, high-sensitivity C-reactive protein (hsCRP), and lipid profile. This extensive list was considered based on evidence of their association with the development of stress-related adverse health conditions [10].
Two raters reviewed titles and abstracts independently and in duplicate. Studies that met eligibility criteria during the first stage of screening progressed to full-text review, which was also conducted independently and in duplicate using the screening software program Covidence (Covidence systematic review software, Veritas Health Innovation, Melbourne, Australia. Available at www.covidence.org accessed on 31 May 2024). Discrepancies were resolved through discussion among reviewers; if consensus was not achieved, a third reviewer was involved.
2.3. Data Collection
Data extraction was performed by one researcher using a standardized and pilot-tested data extraction form and reviewed by a second reviewer. The following information was collected for each included study: publication information, study design, study population, source of noise, measure of exposure (i.e., noise annoyance for the purpose of this review), measure of outcome, statistical analysis performed, estimates for relevant outcomes, and funding information. Discrepancies were resolved through discussion or consultation with a third reviewer. We abstracted adjusted estimates whenever these were provided, and if multiple estimates were included, we reported both adjusted and unadjusted results in the GRADE summary of findings.
2.4. Data Analysis
When appropriate, data were synthesized quantitatively and pooled in a random-effects meta-analysis. We considered the “highly annoyed” (HA) group from each study to be exposed according to the standardization approach described in ISO/TS 15666:2021 [18]. Separate random-effects meta-analyses were conducted for each outcome. If continuous measures were not available, studies with comparable noise annoyance exposure scales were grouped and analyzed in a random-effects meta-analysis using the generic inverse variance method. When pooling binary outcomes, the odds ratios (ORs) were log-transformed. All meta-analyses were performed using the Cochrane Review Manager (version 5.4, The Cochrane Collaboration, London, UK). Heterogeneity between studies was assessed by visual inspection of the forest plots and the I2 statistic.
When we were unable to pool studies due to differences in measurement of exposure (annoyance) or outcome, or reporting of outcomes, or when only one study was available for a given outcome, findings were tabulated and described narratively. Due to the limited quantitative outputs, we were unable to conduct dose–response analyses. For this reason, it was not possible to evaluate the evidence for how the magnitude of reported annoyance (e.g., slight, moderately, very, extremely) affected the outcomes considered.
2.5. Risk of Bias
Risk of bias assessments were performed using the Risk of Bias Instrument for Non-randomized Studies of Exposures (ROBINS-E) for non-randomized (i.e., observational) studies [19]. ROBINS-E assesses the risk of bias in a study against a well-done target experiment by evaluating the identification and appropriate adjustments of critical confounders. The following confounders were identified as critical for adjustment in the analysis because of their influence on annoyance and/or the outcomes considered: age, sex, noise sensitivity, ethnicity, socioeconomic status (SES), and sleep disturbance. Noise level was not identified as a critical confounder because its putative effects on health are presumed to be mediated through annoyance. It is important to note that the fully adjusted estimate from each of the studies was used. If the original study controlled or adjusted for noise level, that estimate was included in the meta-analysis or reporting of individual study results. Noise level was not identified as a critical confounder for the purposes of risk of bias assessment, but none of the studies adjusted for all other critical confounders, so the addition of noise level would not change any of these judgments. Therefore, the expression of noise annoyance was treated as the “exposure” in the current analysis. Each study was assessed across seven domains for bias resulting from the following: confounding; measurement of the exposure; selection of participants; post-exposure interventions; missing data; measurement of the outcome; and the selection of the reported result. Algorithms for arriving at domain-level judgments are presented in the ROBINS-E manual at https://www.riskofbias.info (accessed on 26 June 2024). In brief, for each domain, reviewers completed signaling questions informing a domain-level judgment of the following: low risk of bias; some concerns; high risk of bias; or very high risk of bias. Low risk of bias means that there was little or no concern about bias with regard to this domain. Some concerns with risk of bias means that there was some concern about bias with regard to this domain, although it was not clear that there was an important risk of bias. High risk of bias means that the study had some important problems in this domain: characteristics of the study give rise to a high risk of bias. Very high risk of bias means that the study was very problematic in this domain: characteristics of the study give rise to a very high risk of bias.
One reviewer performed the initial risk of bias assessment for each study independently, and their judgments were reviewed by a second researcher. All publications or records for a single primary study were considered when making risk of bias judgments. Discrepancies between assessments were resolved by consensus or consultation with a third reviewer. The results from the domain-level risk of bias assessments per study are displayed in a risk of bias matrix (Section 3).
2.6. GRADE Evidence Assessment
The overall certainty of the evidence was assessed across each outcome by study design. For this review, the body of evidence for both random clinical trials (RCTs) and non-randomized studies started at a high initial certainty of evidence (CoE). This was possible, as the risk of bias was assessed using ROBINS-E, which assessed risk of bias in comparison to a well-designed target experiment.
Following the GRADE approach, the CoE for each outcome was assessed for concerns with any of the following five domains leading to rating down at least one level: risk of bias, inconsistency, indirectness, imprecision, or publication bias [20]. For non-randomized studies, if there were no concerns beyond risk of bias, then the certainty for the body of evidence could be rated up due to three domains: large or very large magnitude of effect, dose–response gradient, opposing residual confounding. After the assessment of these domains, the body of evidence for an outcome could have a final certainty level of high (⨁⨁⨁⨁), moderate (⨁⨁⨁), low (⨁⨁), or very low (⨁). High certainty means that we are very confident that the true effect lies close to that of the estimate of the effect. Moderate certainty means that we are moderately confident in the estimate of effect; the true effect is likely to be close to the estimate of effect, but possibly substantially different. Low certainty means that our confidence in the effect is limited; the true effect may be substantially different from the estimate of the effect. Lastly, very low certainty means that we have very little confidence in the effect estimate, and the true effect is likely to be substantially different from the estimate of the effect.
One reviewer initially populated the GRADE evidence profiles and assessed the CoE for each outcome of interest. Judgments were reviewed by a second researcher, and disagreements were resolved through discussion. The results of the GRADE assessment are presented comprehensively in an evidence profile.
3. Results
3.1. Summary of the Literature
Our search identified 1297 records, of which 23 met eligibility criteria (Figure 1). Most of the studies excluded after retrieval of full texts reported investigating the health effects of noise exposure but did not report on the “exposure” of noise annoyance (Table S2). Studies were also excluded if they reported on long-term health outcomes (e.g., myocardial infarction, ischemic heart disease) rather than biomarkers that are known to fall along the causal pathway of developing cardiovascular diseases from stressor exposure. Conference abstracts and protocols were excluded after we searched for a peer-reviewed publication of the results. Narrative reviews and commentaries were excluded based on their study design.
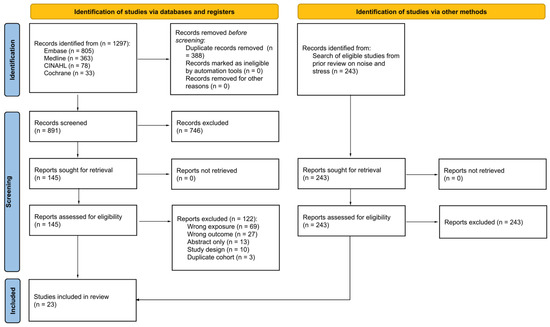
Figure 1.
PRISMA flow diagram.
Our search identified 25 primary research studies that reported on 14 of 48 outcomes of interest (Table 1). Out of 25 eligible studies, 2 (8%) reported the same outcomes from overlapping populations and were ultimately excluded, bringing the total number of included studies to 23. Most of the studies (n = 21, 91.3%) were cross-sectional in design and had large samples drawn from the local population (number of study participants ranging from 20 to 14,639). One study (4.3%) was both cross-sectional and longitudinal [21]; one (4.3%) was a cohort study [22]. Additionally, most of the studies (n = 21) included only adults in their sample, while two studies were focused exclusively on children and adolescents [23,24].

Table 1.
Summary characteristics of eligible studies.
3.2. Measurement of Exposure
All studies used self-reported measures of noise annoyance completed by study participants. Noise annoyance assessment instruments varied across studies from dichotomous (no annoyance, any annoyance) to 12-point scales. The most common measure was an 11-point (0–10) scale using the International Commission on the Biological Effects of Noise (ICBEN) question, “Thinking about the last 12 months, when you are here at home, how much does [type of noise] bother, disturb or annoy you?” (Table 2) [25]. Additional scales used to measure annoyance are described in the results.
Table 2.
Detailed characteristics of eligible studies.
3.3. Measurement and Analysis of Confounders
One of the studies adjusted for all six of the critical confounders, though their measure of ethnicity was dichotomous (Bulgarian or not). Two studies adjusted for four of the six critical confounders. Eight studies adjusted for three of six critical confounders. Three studies adjusted for two critical confounders. One study adjusted for a single critical confounder. Seven studies failed to adjust for any critical confounders. Despite incomplete adjustment for critical confounders, we conducted a full ROBINS-E assessment for all studies. The results of the risk of bias assessment are presented in Table 3 with the associated risk of bias judgement also defined in Table 3.
Table 3.
Risk of bias assessment for eligible studies.
3.4. Outcomes
The included studies reported on outcome measures for cardiovascular, oxidative stress, and diabetes biomarkers. Cardiovascular biomarker outcomes reported in the literature included blood pressure, lipid profile, atrial fibrillation, arterial stiffness, cortisol, heart rate variability (HRV), and pro-atrial natriuretic peptide (pro-ANP). Two studies reported on catecholamines (adrenaline and noradrenaline) for oxidative stress biomarkers. Reported biomarkers associated with diabetes are glomerular filtration rate (GFR), lipid profile, alpha-amylase, and renal plasma flow (RPF). The summary of findings for the body of evidence for each outcome is presented in Table 4.
Table 4.
Evidence profile for noise annoyance and biomarkers of diabetes, cardiovascular disease, and oxidative stress.
3.4.1. Hypertension
Although hypertension is sometimes viewed as a long-term health effect, it is also considered a biological risk factor for cardiovascular and other diseases and was therefore within the scope of the current review. We found ten studies that reported on the impact of noise annoyance on the prevalence of hypertension. Noise annoyance was measured using an 11-point scale [28,29,32,39,40,43], a 3-point scale [41,44], a 10-point scale [31], or a 6-point scale [23].
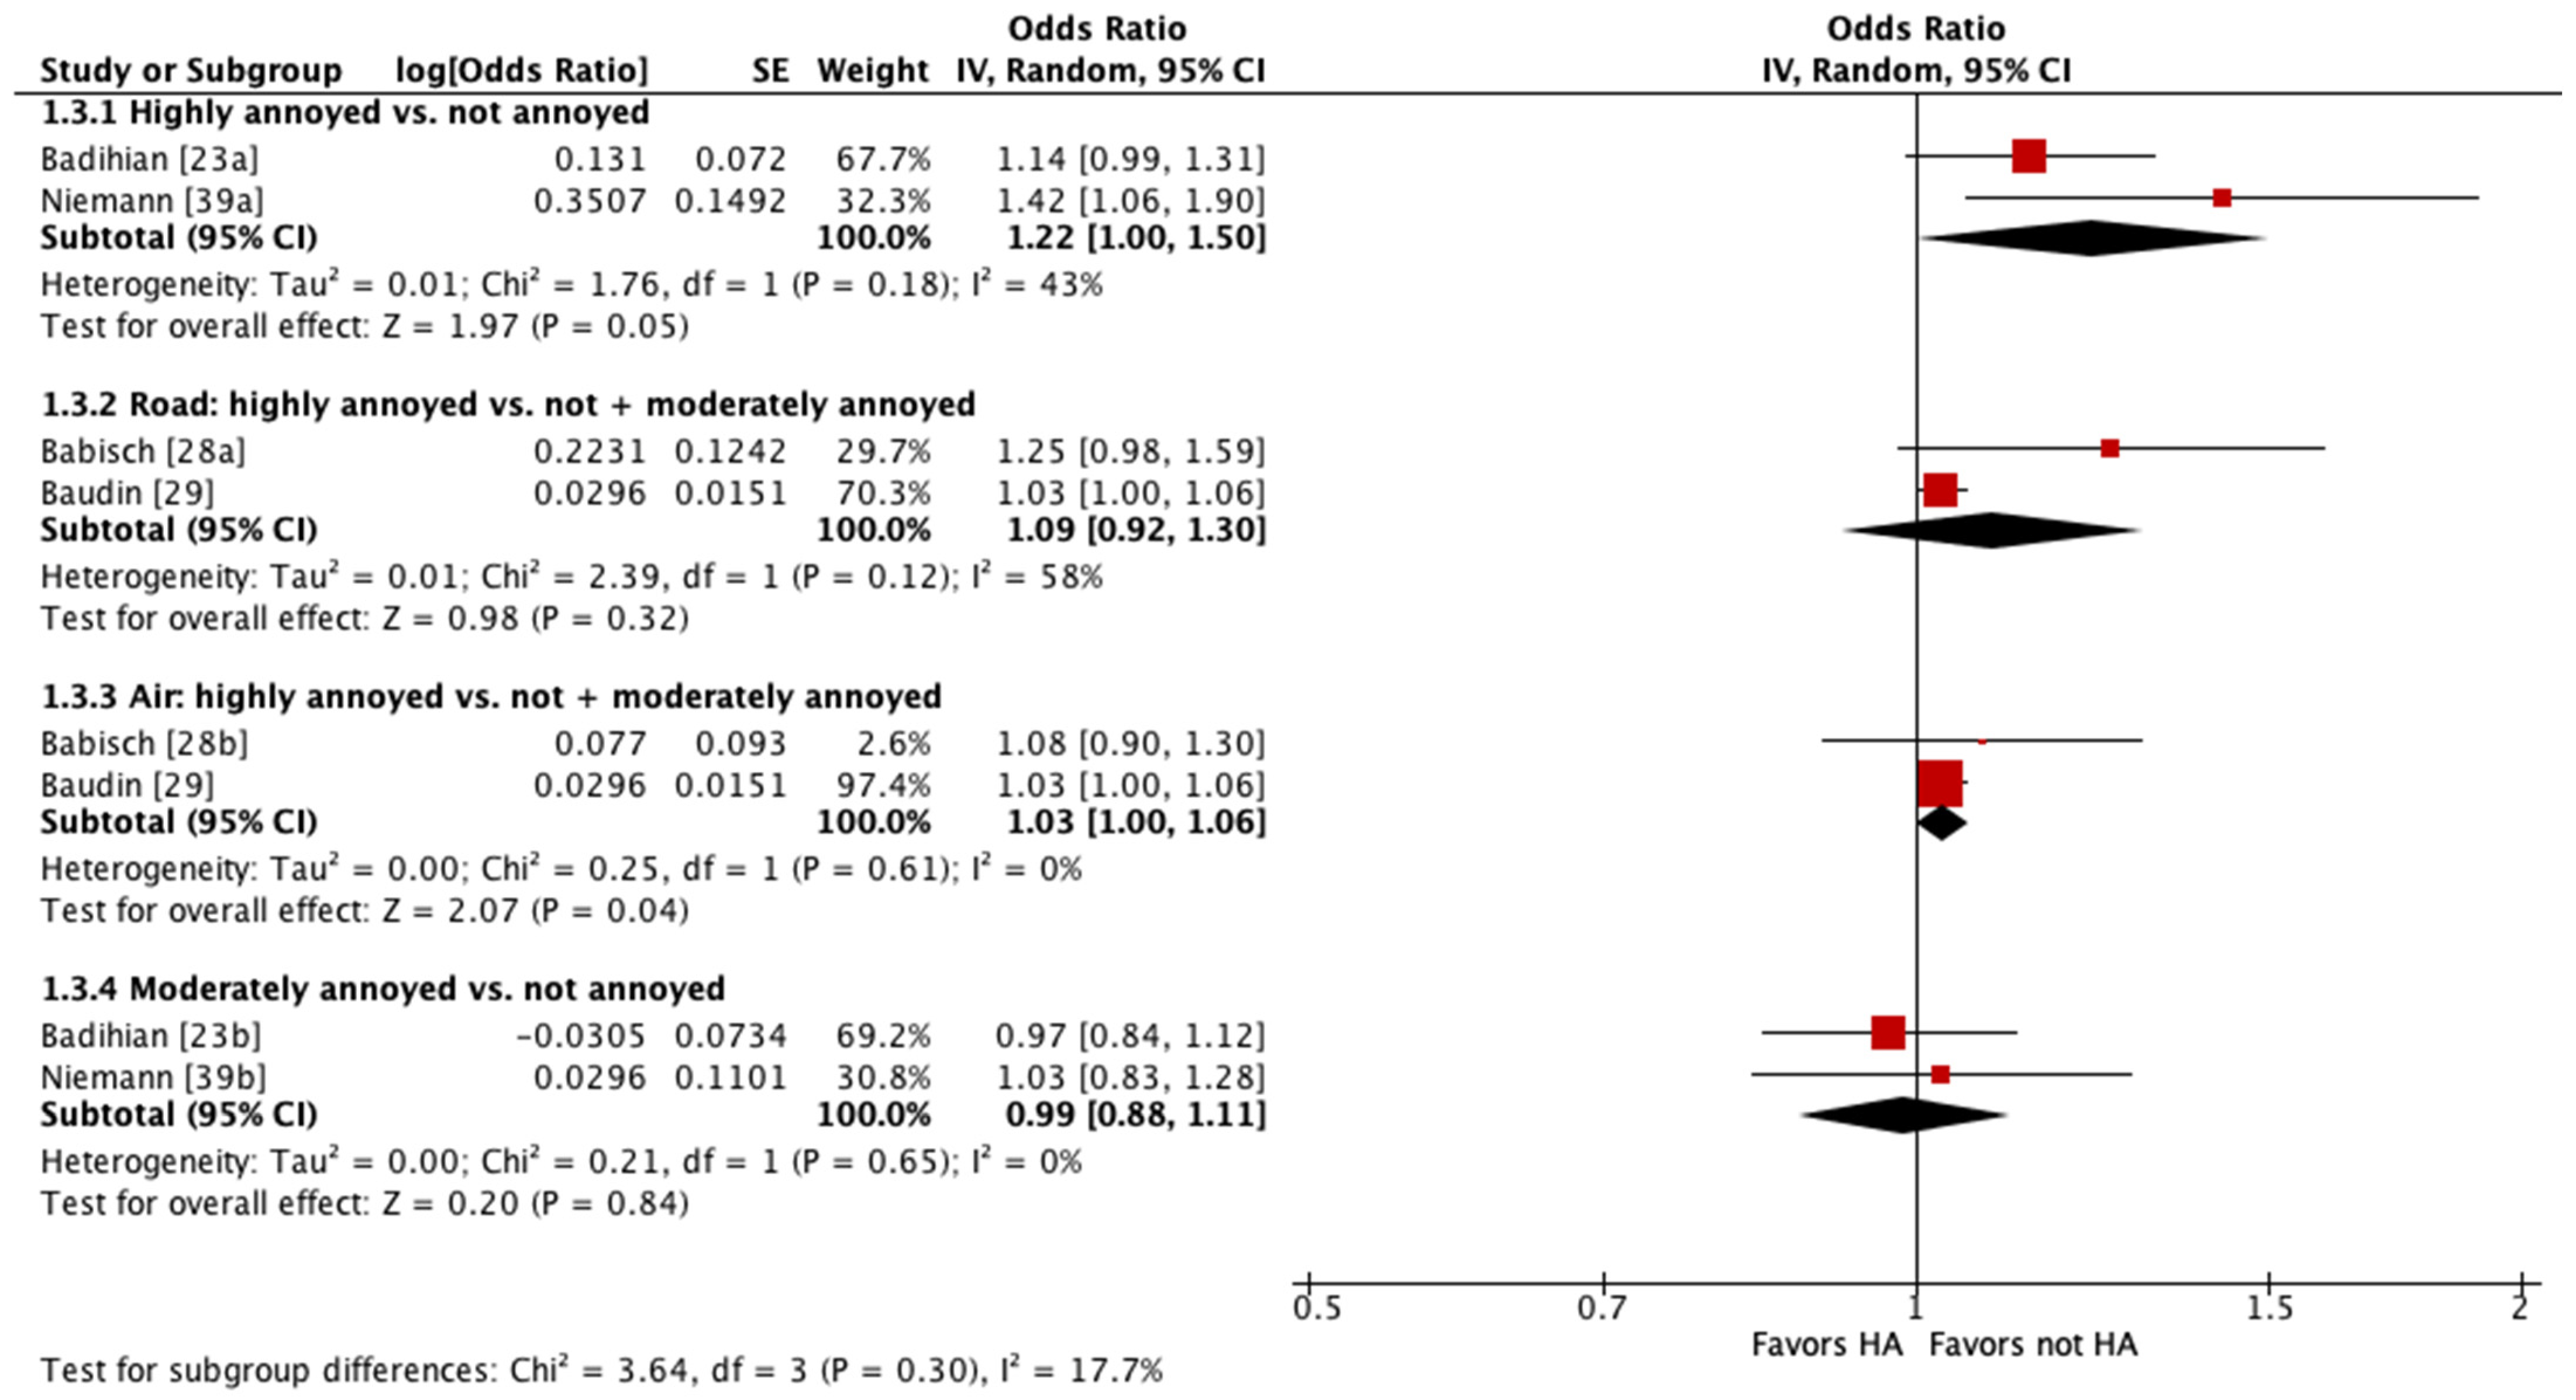
Four of these studies were pooled into meta-analyses (Figure 2 and Figure 3) [23,28,29,39]. When pooling adjusted estimates for highly annoyed vs. not annoyed participants, we found that highly annoyed individuals may be at increased risk of hypertension, yet the 95% confidence interval (CI) indicated the association was tenuous (OR 1.22 [95% CI 1.0 to 1.5]). The unadjusted estimate reported by one of the studies pooled showed a weaker effect to no effect of annoyance on hypertension (OR 1.07 [95% CI 0.96 to 1.19]) [23]. When pooling adjusted estimates for highly annoyed vs. all other participants, including both moderately annoyed and not annoyed, we found that the level of annoyance may have little to no effect on hypertension (OR for road noise 1.09 [95% CI 0.92 to 1.30]; OR for aircraft noise 1.03 [95% CI 1.0 to 1.06]). Finally, we pooled adjusted estimates for moderately annoyed vs. not annoyed participants and found that the magnitude of annoyance may have little to no effect on hypertension (OR 0.99 [95% CI 0.88 to 1.11]). The unadjusted estimate reported by one of the studies pooled is consistent with the pooled adjusted results (OR 0.98 [95% CI 0.88 to 1.09]) [23]. The overall certainty in the evidence is very low due to extremely serious concerns with risk of bias (Table 4).
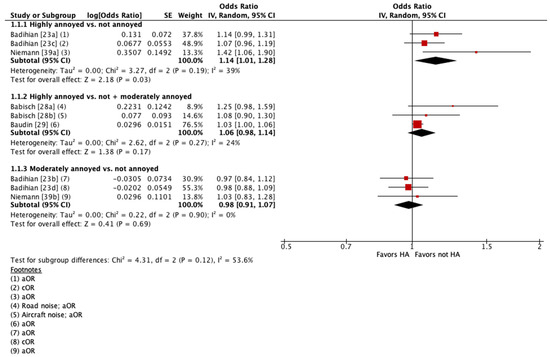
Figure 2.
Meta-analysis of hypertension prevalence (all estimates).

Figure 3.
Meta-analysis of hypertension prevalence (adjusted estimates).
The other six studies could not be pooled because they analyzed noise annoyance as a continuous variable [40,43], did not report the 95% CI for the effect estimate [44], reported prevalence as a percentage difference between groups [41], or did not report any effect estimate and only commented on the statistical significance of the association [31,32].
When comparing the prevalence of hypertension between highly annoyed and not highly annoyed study participants, two cross-sectional studies reported that “no significant effects/relationship” were found; results were not reported quantitatively [31,32]. These studies measured annoyance using an 11-point [32] and a 3-point [31] scale. Four other cross-sectional studies reported that highly annoyed status may be associated with an increased prevalence of hypertension [40,41,43,44]. Petri et al. measured noise annoyance using an 11-point scale and reported an unadjusted OR per 5dB(A) increase in noise of 1.09 (95% CI 0.92–1.11) [40]. Vandasova et al. measured noise annoyance using a 3-point scale and reported an unadjusted OR of 1.5 (no 95% CI reported) [44]. Stosic et al. reported a Spearman R-coefficient for high annoyance measured via a 5-point verbal scale of 0.216 (t = 4.41), and for high annoyance measured via an 11-point numeric scale of 0.211 (t = 4.38) [43]. Pitchika et al. dichotomized the noise annoyance and reported that participants who indicated any annoyance by traffic noise in either their living room or bedroom had a 39% higher prevalence of hypertension (95% CI: 5.9% to 81.2%) compared to participants who were not annoyed in either of the rooms [41]. The overall CoE is very low due to concerns with risk of bias and inconsistency (Table 4).
3.4.2. Blood Pressure
Five cross-sectional studies reported on the impact of noise annoyance on systolic blood pressure (SBP) and diastolic blood pressure (DBP) [26,30,37,38,41]. Three of the studies measured noise annoyance using an 11-point scale [26,30,37,38]. One study measured annoyance using a numerical rating scale from 1 to 10 and then dichotomized responses into “not at all” (1) and “at least some annoyance” (2–10) [41]. One study asked respondents “Do you feel annoyed by that exposure or not?” Noise annoyance was coded as “yes” when the duration of exposure exceeded 50% of working hours [37]. All studies reported a possible association between increasing noise annoyance and increasing DBP.
Dzhambov et al. reported an adjusted SBP change of 0.22 (95% CI—2.82, 3.27) per one interquartile range increase in global noise annoyance [30]. Alimohammadi et al. reported an adjusted Beta estimate for increase in SBP of 3.27 (SD 0.36) with increasing noise annoyance [26]. Michaud et al. reported a geometric mean SBP of 123.02 mmHg (95% CI 119.07 to 127.10) in the highly annoyed group and a geometric mean SBP of 117.99 mmHg (95% CI 116.60 to 119.40) in the low-annoyance group; this difference was not statistically significant [38]. Pitchika et al. reported an adjusted 0.8% mean change in SBP (95% CI -0.6 to 2.1) for the group that reported at least some annoyance in their living room or bedroom compared to the participants who reported no annoyance in either room [41].
Four studies also reported a possible association between increasing noise annoyance and increasing SBP [26,30,38,41]. Dzhambov et al. reported an adjusted DBP change of 0.33 (95% CI—1.56, 2.21) per one interquartile range of increase in global noise annoyance [30]. Alimohammadi et al. reported an adjusted Beta estimate for an increase in DBP of 1.05 (SD 0.27) with increasing noise annoyance [26]. Michaud et al. reported a geometric mean DBP of 76.99 mmHg (95% CI 74.55 to 79.52) in the highly annoyed group and a geometric mean DBP of 73.78 mmHg (95% CI 72.91 to 74.65) in the low-annoyance group; this difference was statistically significant [38]. Pitchika et al. reported an adjusted 0.1% mean change in DBP (95% CI -1.1 to 1.4) for the group that reported at least some annoyance in their living room or bedroom compared to the participants who reported no annoyance in either room [41]. One study reported that noise annoyance may result in an increase or a decrease in SBP (OR 2.1 [95% CI—3.0 to 7.3]) [37]. The overall CoE for both SBP and DBP is very low due to concerns with risk of bias and imprecision (Table 4).
3.4.3. Lipid Profile
One cross-sectional study reported on the impact of noise annoyance on serum lipid profile from a single fasted morning blood sample [21]. Annoyance was measured using a 4-point scale. When comparing highly annoyed males exposed to high noise levels in an occupational setting to those who reported low levels of annoyance in a low-noise setting, the study reported a 15 mg/dL higher mean cholesterol level (95% CI 7.2 to 22.8). When comparing highly annoyed women in a high-noise setting to those who reported low levels of annoyance in a low-noise setting, the study reported a 23 mg/dL higher mean cholesterol level (95% CI 1.5 to 42.9). The CoE is very low due to extremely serious concerns with risk of bias (Table 4). It is also noted that although the authors assessed hearing protection usage (yes/no), they did not report the prevalence of use, nor did they analyze hearing protection as a covariate. Moreover, a potential influence of annoyance alone cannot be disentangled from effects owing to the different settings.
3.4.4. Atrial Fibrillation
One cross-sectional study reported on the impact of noise annoyance on the prevalence of atrial fibrillation (AF) assessed via self-reported medical history and/or documentation of AF on the study electrocardiogram [33]. Annoyance was measured using a 5-point numerical rating scale. They found that study participants who reported “extreme annoyance” had a higher prevalence of AF (23.4%) compared to participants who reported “no annoyance” (14.6%). The certainty in the evidence is very low due to extremely serious concerns with risk of bias (Table 4).
3.4.5. Arterial Stiffness
One cross-sectional study reported on the impact of noise annoyance on arterial stiffness (also known as arterial hypertension [AH]) measured with the carotid–femoral pulse wave velocity and components of blood pressure [42]. Annoyance was measured using a 3-point scale. They reported no association between highly annoyed and moderately annoyed status with AH in all study participants. When the investigators stratified participants into normotensive and hypertensive participants, the normotensive group results indicated a possible positive association between noise annoyance and AH; there was no association in the hypertensive group. The CoE is very low due to extremely serious concerns with risk of bias (Table 4).
3.4.6. Cortisol
Two cross-sectional studies reported on the impact of noise association and cortisol levels [24,38]. Wallas et al. measured annoyance using a 5-point verbal rating scale and determined cortisol concentrations from a morning and evening saliva sample [24]. They found no association between being very annoyed or moderately annoyed and salivary cortisol levels. Michaud et al. measured noise annoyance using an 11-point scale and measured cortisol levels from 3 cm (i.e., ~90-day integrated cortisol) hair samples [38]. In their unadjusted models, they reported a statistically significant difference in hair cortisol levels between highly annoyed participants (geometric mean 169.79 ng/g [95% CI 124.86 to 230.89]) and the not highly annoyed group (geometric mean 127.64 ng/g [95% CI 112.60 to 144.68]). These differences were no longer significant in their fully adjusted models. The CoE is very low due to extremely serious concerns with risk of bias (Table 4).
3.4.7. Heart Rate Variability (HRV)
Two cross-sectional studies reported on the impact of noise annoyance on heart rate variability and found “no significant effects/difference” based on annoyance level; results were not reported quantitatively [32,35]. Gallasch et al. measured HRV using a Task Force Monitor (TFM), which uses a standard three-electrode system for ECG, a four-electrode system for ICG, and two inflatable finger cuffs in combination with a standard arm cuff [32]. Huang et al. measured HRV using heart rate recording [35]. Annoyance was measured using an 11-point interval scale [32] and an 11-point visual analog scale [35]. The overall CoE is very low due to extremely serious concerns with risk of bias (Table 4).
3.4.8. Pro-Atrial Natriuretic Peptide (Pro-ANP)
One cross-sectional study reported on the impact of noise annoyance on pro-ANP levels determined from a single overnight 8-hour fasted venous blood sample [34]. Annoyance was measured using a 5-point numerical rating scale. They found an increase in pro-ANP with each point increase in annoyance of 0.013 pmol/L (95% CI 0.0041 to 0.021). Increasing daytime noise annoyance was associated with an increase of 0.014 pmol/L (95% CI 0.0057 to 0.023) per point; increasing nighttime annoyance was associated with an increase of 0.011 pmol/L (95% CI 0.0019 to 0.020) per point. The CoE is very low due to extremely serious concerns with risk of bias (Table 4).
3.4.9. Catecholamines (Adrenaline and Noradrenaline)
One cross-sectional study [27] and one cohort study [22] reported on the impact of noise annoyance on overnight urinary adrenaline and noradrenaline [27] and prior to and between arithmetic testing during noise [22]. Annoyance was measured using a 5-point numerical rating scale [27] and a verbal category scale with no information reported on the number of categories [22]. When comparing “highly disturbed” individuals with “less disturbed” individuals, Babisch et al. found that increasing disturbance in communication (regression coefficient 1.0 µg/g creatinine), sleep (regression coefficient 5.57 µg/g creatinine), and relaxation (regression coefficient 0.59 µg/g creatinine) may lead to increasing levels of catecholamines [27].
When comparing “quite annoyed” to “not especially annoyed” participants, Arvidsson and Lindvall found that levels of both adrenaline (mean 12.5 ng/min [SD 6.6] vs. mean 17.6 ng/min [SD 7.5]) and noradrenaline (mean 29.3 ng/min [SD 12.1 vs. mean 36.3 ng/min [SD 10.7]) were lower in the “quite annoyed” group. The CoE is very low due to extremely serious concerns with risk of bias (Table 4) [22].
3.4.10. Glomerular Filtration Rate (GFR)
Two cross-sectional studies reported on the impact of noise annoyance on GFR as an estimate of overall kidney function, calculated according to accepted epidemiologic practices [30,36]. Annoyance was measured using an 11-point numerical rating scale [30] and a 7-grade Likert scale [36]. Dzhambov et al. found that for each interquartile range increase in global noise annoyance, eGFR increased by 0.20 mL/min/1.73 m2 (95% CI—3.97 to 4.36) [30]. Kannenkeril et al. reported that annoyed participants (mean 133 mL/min [SD 12]) had slightly lower levels of GFR compared to those who were not annoyed (mean 138 mL/min [SD 15]) [36]. The CoE is very low due to concerns with risk of bias and imprecision (Table 4).
3.4.11. Alpha-Amylase
One cross-sectional study reported on the impact of noise annoyance on salivary alpha-amylase levels collected at rest and after road, rail, and calm conditions [32]. Annoyance was measured using an 11-point interval scale. They found “no significant effects”; however, they did not report findings quantitatively. The CoE is very low due to concerns with risk of bias and imprecision (Table 4).
3.4.12. Renal Plasma Flow (RPF)
One cross-sectional study reported on the impact of noise annoyance on RPF assessed using the constant-infusion input clearance technique with an infusion of para-aminohippuric acid [36]. Annoyance was measured using a 7-grade Likert scale. They found that noise-annoyed individuals showed lower RPF (mean 599 ± 106 vs. mean 663 ± 124 mL/min, p = 0.009), lower renal blood flow (mean 1068 ± 203 vs. mean 1172 ± 225 mL/min, p = 0.047), higher filtration fraction (mean 22.7 ± 3.3 vs. mean 21.3 ± 3.0, p = 0.012), higher renal vascular resistance (mean 88.9 ± 25.6 vs. mean 75.8 ± 22.9 mm Hg/[mL/min], p = 0.002), and higher resistance of afferent arteriole (mean 2439.5 ± 1253.4 vs. mean 1849.9 ± 1242.0 dyn s−1 cm−5, p = 0.001) compared to non-noise-annoyed individuals. The certainty in the evidence is very low due to concerns with risk of bias and imprecision (Table 4).
4. Discussion
A sustained high magnitude of noise annoyance is clearly an undesirable reaction to noise at both the individual and the population level. Yet, the extent to which long-term high noise annoyance may impact one’s health is uncertain, and its relevance to environmental impact assessment would be enhanced if it was also found to contribute to physiological effects that are known to be involved in the development of diseases, particularly those that have been attributed to noise [15]. As an example, on a Canadian national survey on transportation noise, highly annoyed respondents were more likely to report that their annoyance negatively impacted their health compared to their less annoyed counterparts; however, no relationship was observed between the magnitude of noise annoyance and self-reported overall health status [45]. This observation suggests that when weighed against myriad factors that influence health, from diet to exercise and genetic predisposition, noise annoyance, even at high magnitudes, may have a diminutive (if any) contribution to overall health status.
The suggested mechanistic framework that has been proposed is that annoyance is a psychological state that represents a degree of mental distress toward (in this case) noise [8,46]. In greater magnitudes of severity, chronic annoyance may reflect an inability to cope with noise. In this scenario, it would be reasonable to suspect that chronic high annoyance with noise has the potential to increase one’s allostatic load by constantly requiring that one adapts to the noise. In susceptible individuals, this could potentially promote disease [9,10]. Although the theoretical connection between noise annoyance and health seems intuitive, the onset of pathophysiology necessitates deviations in biological systems persisting at levels outside the normal physiological range.
We have identified a comprehensive body of evidence reporting on the effect of noise annoyance on biomarkers that precede health effects that have been studied in relation to noise. These outcomes included but were not limited to cardiovascular disease and diabetes. These results contribute to the investigation of mechanisms by which noise exposure may affect human health outcomes unrelated to noise-induced hearing impairment. However, the CoE of a relationship between noise annoyance and the various biomarkers evaluated is very low due to concerns with risk of bias, inconsistency, and imprecision.
The largest body of evidence reported on the outcome of hypertension prevalence, as informed by blood pressure measurements. While only a portion of the studies (n = 4) could be pooled, this analysis suggests a possible trend of increasing hypertension among highly annoyed groups when compared with not annoyed or moderately and not annoyed groups. The results were not suggestive of an association when moderate annoyance was compared with no annoyance, which does support the relative emphasis placed on “highly annoyed” in guidance [15]. These results are consistent with the six studies that could not be pooled in the analysis. Studies also reported on systolic and diastolic blood pressure separately, with heterogeneity in their estimates of the effect of noise annoyance on both measures of blood pressure. Furthermore, while some, albeit weak, evidence exists for an association between high noise annoyance and hypertension, the cross-sectional nature of these studies does not permit conclusions about causality.
Other studies reported possible trends of increased mean cholesterol levels, increased prevalence of AF, increased arterial stiffness in normotensive participants, increased hair cortisol levels, increased pro-ANP, and decreased renal plasma flow in highly annoyed groups when compared to not highly annoyed groups. The results for arterial stiffness in hypertensive participants, saliva cortisol, heart rate variability, and catecholamines (adrenaline and noradrenaline) suggest that high annoyance may have no effect on these outcomes.
Limitations
This review employed rigorous methods to search for available literature, select relevant studies, collect and analyze data, assess the risk of bias, and assess the overall CoE for each outcome. However, we did not consider biomarkers that may underscore mental health endpoints and did not look at other environmental annoyances like odor, visual, or dust annoyance. Most of the studies (n = 21) in our sample are cross-sectional, with concerns about confounding and measurement of the exposure (noise annoyance). Our overall certainty is very low due to additional concerns with inconsistency between studies and imprecision due to small sample sizes for some outcomes. When considered in their totality, the results do not provide robust support for interpreting high noise annoyance as a determinant of changes in physiology that lead to disease. Future research in this area may prove otherwise, especially in regard to hypertension; however, there needs to be a concerted effort to reduce the heterogeneity in research designs. The analysis shows that there is substantial variation across studies, which undermines the ability to subject the collective body of research to meta-analysis.
5. Conclusion
In the context of environmental impact assessment guidelines that aim to mitigate the prevalence of populations experiencing a high level of noise annoyance, the current state of the scientific literature indicates that such practices should be grounded in the understanding that long-term high noise annoyance is health-relevant because it reflects an undesirable reaction to noise that may affect general well-being, rather than a precursor to chronic physical health conditions.
Supplementary Materials
The following supporting information can be downloaded at https://www.mdpi.com/article/10.3390/ijerph21070956/s1: Table S1: Literature search strategies, Table S2. List of ineligible studies.
Author Contributions
E.S.: methodology, formal analysis, investigation, data curation, writing—original draft, project administration; T.P.: investigation, writing—review and editing; N.T.: investigation, writing—review and editing; B.A.: investigation, writing—review and editing; S.B.: investigation; J.P.M.: funding acquisition, project management, writing—review and editing; D.S.M.: principal investigator, conceptualization, funding acquisition, methodology, writing—original draft, supervision; R.L.M.: conceptualization, methodology, writing—review and editing, supervision. All authors approved the final version of this manuscript.
Funding
This work was funded entirely by Health Canada under contract No. 4500454889 with RL Morgan.
Data Availability Statement
No new data were created or analyzed in this study.
Acknowledgments
We would like to acknowledge Jennifer Ritonja for consulting on the methods used for meta-analysis and Robyn Hocking for assisting with the initial literature search strategy. We would also like to thank Allison Denning for contract coordination.
Conflicts of Interest
The authors declare no conflicts of interest.
References
- Sivakumaran, K.; Ritonja, J.A.; Waseem, H.; AlShenaiber, L.; Morgan, E.; Ahmadi, S.A.; Denning, A.; Michaud, D.; Morgan, R.L. Impact of Noise Exposure on Risk of Developing Stress-Related Metabolic Effects: A Systematic Review and Meta-Analysis. Noise Health 2022, 24, 215–230. [Google Scholar] [CrossRef] [PubMed] [PubMed Central]
- Sivakumaran, K.; Ritonja, J.A.; Waseem, H.; AlShenaiber, L.; Morgan, E.; Ahmadi, S.A.; Denning, A.; Michaud, D.S.; Morgan, R.L. Impact of Noise Exposure on Risk of Developing Stress-Related Health Effects Related to the Cardiovascular System: A Systematic Review and Meta-Analysis. Noise Health 2022, 24, 107–129. [Google Scholar] [CrossRef] [PubMed]
- Sivakumaran, K.; Ritonja, J.A.; Waseem, H.; AlShenaiber, L.; Morgan, E.; Ahmadi, S.A.; Denning, A.; Michaud, D.S.; Morgan, R.L. Impact of Noise Exposure on Risk of Developing Stress-Related Obstetric Health Effects: A Systematic Review and Meta-Analysis. Noise Health 2022, 24, 137–144. [Google Scholar] [CrossRef] [PubMed]
- Basner, M.; McGuire, S. WHO environmental noise guidelines for the European region: A systematic review on environmental noise and effects on sleep. Int. J. Environ. Res. Public Health 2018, 15, 519. [Google Scholar] [CrossRef] [PubMed]
- van Kempen, E.; Casas, M.; Pershagen, G.; Foraster, M. WHO environmental noise guidelines for the European region: A systematic review on environmental noise and cardiovascular and metabolic effects: A summary. Int. J. Environ. Res. Public Health 2018, 15, 379. [Google Scholar] [CrossRef] [PubMed]
- World Health Organization. Burden of Disease from Environmental Noise. 2011. Available online: https://iris.who.int/handle/10665/326424 (accessed on 25 June 2024).
- Guski, R.; Schreckenberg, D.; Schuemer, R. WHO Environmental Noise Guidelines for the European Region: A Systematic Review on Environmental Noise and Annoyance. Int. J. Environ. Res. Public Health 2017, 14, 1539. [Google Scholar] [CrossRef]
- Babisch, W. The noise/stress concept, risk assessment and research needs. Noise Health 2002, 4, 1–11. [Google Scholar]
- McEwen, B.; Lasley, E.N. Allostatic load: When protection gives way to damage. Adv. Mind Body Med. 2003, 19, 28–33. [Google Scholar] [PubMed]
- Anisman, H. Stress and Your Health: From Vulnerability to Resilience; John Wiley & Sons, Ltd.: West Sussex, UK, 2015. [Google Scholar]
- Health Canada. Guidance for Evaluating Human Health Impacts in Environmental Assessment: Noise. Her Majesty the Queen in Right of Canada, as Represented by the Minister of Health. 2023. Available online: https://publications.gc.ca/site/eng/9.832514/publication.html (accessed on 25 June 2024).
- Michaud, D.S.; Bly, S.H.P.; Keith, S.E. Using a change in percent highly annoyed with noise as a potential health effect measure for projects under the Canadian Environmental Assessment Act. Can. Acoust. 2008, 36, 13–28. [Google Scholar]
- Charalampous, P.; Polinder, S.; Wothge, J.; von der Lippe, E.; Haagsma, J.A. A systematic literature review of disability weights measurement studies: Evolution of methodological choices. Arch. Public Health. 2022, 80, 91. [Google Scholar] [CrossRef] [PubMed] [PubMed Central]
- World Health Organization. Basic Documents: Forty-Ninth Edition (Including Amendments Adopted up to 31 May 2019); World Health Organization: Geneva, Switzerland, 2020.
- World Health Organization. Environmental Noise Guidelines for the European Region; WHO Regional Office for Europe: Copenhagen, Denmark, 2018. [Google Scholar]
- Gong, X.; Fenech, B.; Blackmore, C.; Chen, Y.; Rodgers, G.; Gulliver, J.; Hansell, A.L. Association between noise annoyance and mental health outcomes: A systematic review and meta-analysis. Int. J. Environ. Res. Public Health 2022, 19, 2696. [Google Scholar] [CrossRef] [PubMed]
- Page, M.J.; McKenzie, J.E.; Bossuyt, P.M.; Boutron, I.; Hoffmann, T.C.; Mulrow, C.D.; Shamseer, L.; Tetzlaff, J.M.; Akl, E.A.; Brennan, S.E.; et al. The PRISMA 2020 statement: An updated guideline for reporting systematic reviews. BMJ 2021, 372, n71. [Google Scholar] [CrossRef]
- Clark, C.; Gjestland, T.; Lavia, L.; Notley, H.; Michaud, D.; Morinaga, M. Revising ISO/TS 15666—The noise annoyance standard. In Proceedings of the International Commission on Biological Effects of Noise, Stockholm, Sweden, 14–17 June 2021. [Google Scholar]
- Higgins, J.; Morgan, R.; Rooney, A.; Taylor, K.; Thayer, K.; Silva, R.; Lemeris, C.; Akl, A.; Arroyave, W.; Bateson, T.; et al. Risk of Bias in Non-randomized Studies-of Exposure (ROBINS-E). Launch Version. 20 June 2023. Available online: https://www.riskofbias.info/welcome/robins-e-tool (accessed on 25 June 2024).
- Guyatt, G.; Oxman, A.D.; Akl, E.A.; Kunz, R.; Vist, G.; Brozek, J.; Norris, S.; Falck-Ytter, Y.; Glasziou, P.; DeBeer, H.; et al. GRADE guidelines: 1. Introduction-GRADE evidence profiles and summary of findings tables. J. Clin. Epidemiol. 2011, 64, 383–394. [Google Scholar] [CrossRef] [PubMed]
- Melamed, S.; Froom, P.; Kristal-Boneh, E.; Gofer, D.; Ribak, J. Industrial noise exposure, noise annoyance, and serum lipid levels in blue-collar workers—The CORDIS Study. Arch. Environ. Health 1997, 52, 292–298, Erratum in Arch. Environ. Health 1997, 52, 389. [Google Scholar] [CrossRef]
- Arvidsson, O.; Lindvall, T. Subjective annoyance from noise compared with some directly measurable effects. Arch. Environ. Health 1978, 33, 159–166. [Google Scholar] [CrossRef] [PubMed]
- Badihian, N.; Riahi, R.; Qorbani, M.; Motlagh, M.E.; Heshmat, R.; Kelishadi, R. The associations between noise annoyance and psychological distress with blood pressure in children and adolescents: The CASPIAN-V Study. J. Clin. Hypertens. 2020, 22, 1434–1441. [Google Scholar] [CrossRef] [PubMed]
- Wallas, A.; Eriksson, C.; Gruzieva, O.; Lind, T.; Pyko, A.; Sjöström, M.; Ögren, M.; Pershagen, G. Road traffic noise and determinants of saliva cortisol levels among adolescents. Int. J. Hyg. Environ. Health 2018, 221, 276–282. [Google Scholar] [CrossRef] [PubMed]
- Fields, J.M.; Jong, R.G.; Gjestland, T.; Flindell, I.H.; Job, R.F.S.; Kurra, S.; Lercher, P.; Vallet, M.; Yano, T.; Guski, R.; et al. Standardized general-purpose noise reaction questions for community noise surveys: Research and a recommendation. J. Sound Vib. 2001, 242, 641–679. [Google Scholar] [CrossRef]
- Alimohammadi, I.; Kanrash, F.A.; Vosoughi, S.; Shekaftik, S.O.; Rahmani, K.; Chalak, M.H.; Anbari, M. Relationship between Noise Annoyance and High Blood Pressure in Workers Exposed to Chronic Noise Among the Workers of an Automotive Industry. Indian J. Occup. Environ. Med. 2020, 24, 153–156. [Google Scholar] [CrossRef]
- Babisch, W.; Fromme, H.; Beyer, A.; Ising, H. Increased catecholamine levels in urine in subjects exposed to road traffic noise: The role of stress hormones in noise research. Environ. Int. 2001, 26, 475–481. [Google Scholar] [CrossRef]
- Babisch, W.; Pershagen, G.; Selander, J.; Houthuijs, D.; Breugelmans, O.; Cadum, E.; Vigna-Taglianti, F.; Katsouyanni, K.; Haralabidis, A.S.; Dimakopoulou, K.; et al. Noise annoyance—A modifier of the association between noise level and cardiovascular health? Sci. Total Environ. 2013, 452–453, 50–57. [Google Scholar] [CrossRef] [PubMed]
- Baudin, C.; Lefevre, M.; Babisch, W.; Cadum, E.; Champelovier, P.; Dimakopoulou, K.; Houthuijs, D.; Lambert, J.; Laumon, B.; Pershagen, G.; et al. The role of aircraft noise annoyance and noise sensitivity in the association between aircraft noise levels and hypertension risk: Results of a pooled analysis from seven European countries. Environ. Res. 2020, 191, 110179. [Google Scholar] [CrossRef] [PubMed]
- Dzhambov, A.M.; Tokmakova, M.P.; Gatseva, P.D.; Zdravkov, N.G.; Gencheva, D.G.; Ivanova, N.G.; Karastanev, K.I.; Vladeva, S.V.; Donchev, A.T.; Dermendzhiev, S.M. Community Noise Exposure and its Effect on Blood Pressure and Renal Function in Patients with Hypertension and Cardiovascular Disease. Folia Med. 2017, 59, 344–356. [Google Scholar] [CrossRef] [PubMed]
- Fyhri, A.; Klaeboe, R. Road traffic noise, sensitivity, annoyance and self-reported health—A structural equation model exercise. Environ. Int. 2009, 35, 91–97. [Google Scholar] [CrossRef] [PubMed]
- Gallasch, E.; Raggam, R.B.; Cik, M.; Rabensteiner, J.; Lackner, A.; Piber, B.; Marth, E. Road and rail traffic noise induce comparable extra-aural effects as revealed during a short-term memory test. Noise Health 2016, 18, 206–213. [Google Scholar] [CrossRef] [PubMed]
- Hahad, O.; Beutel, M.; Gori, T.; Schulz, A.; Blettner, M.; Pfeiffer, N.; Rostock, T.; Lackner, K.; Sørensen, M.; Prochaska, J.H.; et al. Annoyance to different noise sources is associated with atrial fibrillation in the Gutenberg Health Study. Int. J. Cardiol. 2018, 264, 79–84. [Google Scholar] [CrossRef] [PubMed]
- Hahad, O.; Wild, P.S.; Prochaska, J.H.; Schulz, A.; Lackner, K.J.; Pfeiffer, N.; Schmidtmann, I.; Michal, M.; Beutel, M.; Daiber, A.; et al. Midregional pro atrial natriuretic peptide: A novel important biomarker for noise annoyance-induced cardiovascular morbidity and mortality? Clin. Res. Cardiol. 2021, 110, 29–39. [Google Scholar] [CrossRef]
- Huang, Z.; Aarab, G.; Ravesloot, M.J.L.; de Vries, N.; Hilgevoord, A.A.J.; Lobbezoo, F. The Annoying Nature of Snoring Sounds Is Not Only about Intensity: A Pilot Study on Exposed Test Subjects. J. Clin. Med. 2023, 12, 2630. [Google Scholar] [CrossRef] [PubMed]
- Kannenkeril, D.; Jung, S.; Ott, C.; Striepe, K.; Kolwelter, J.; Schmieder, R.E.; Bosch, A. Association of Noise Annoyance with Measured Renal Hemodynamic Changes. Kidney Blood Press Res. 2021, 46, 323–330. [Google Scholar] [CrossRef]
- Lercher, P.; Hörtnagl, J.; Kofler, W.W. Work noise annoyance and blood pressure: Combined effects with stressful working conditions. Int. Arch. Occup. Environ Health 1993, 65, 23–28. [Google Scholar] [CrossRef]
- Michaud, D.S.; Feder, K.; Keith, S.E.; Voicescu, S.A.; Marro, L.; Than, J.; Guay, M.; Denning, A.; Bower, T.; Villeneuve, P.J.; et al. Self-reported and measured stress related responses associated with exposure to wind turbine noise. J. Acoust. Soc. Am. 2016, 139, 1467–1479. [Google Scholar] [CrossRef] [PubMed]
- Niemann, H.; Bonnefoy, X.; Braubach, M.; Hecht, K.; Maschke, C.; Rodrigues, C.; Robbel, N. Noise-induced annoyance and morbidity results from the pan-European LARES study. Noise Health 2006, 8, 63–79. [Google Scholar] [CrossRef]
- Petri, D.; Licitra, G.; Vigotti, M.A.; Fredianelli, L. Effects of exposure to road, railway, airport and recreational noise on blood pressure and hypertension. Int. J. Environ. Res. Public Health 2021, 18, 9145. [Google Scholar] [CrossRef]
- Pitchika, A.; Hampel, R.; Wolf, K.; Kraus, U.; Cyrys, J.; Babisch, W.; Peters, A.; Schneider, A. Long-term associations of modeled and self-reported measures of exposure to air pollution and noise at residence on prevalent hypertension and blood pressure. Sci. Total Environ. 2017, 593–594, 337–346. [Google Scholar] [CrossRef] [PubMed]
- Rojek, M.; Rajzer, M.W.; Wojciechowska, W.; Drozdz, T.; Skalski, P.; Pizon, T.; Januszewicz, A.; Czarnecka, D. Relationship among long-term aircraft noise exposure, blood pressure profile, and arterial stiffness. J. Hypertens. 2019, 37, 1350–1358. [Google Scholar] [CrossRef] [PubMed]
- Stošić, L.; Stojanović, D.; Lazarević, K. The relationship between community noise and arterial hypertension in the population of the city of Niš. Acta Fac. Medicae Naissensis 2022, 39, 484–490. [Google Scholar] [CrossRef]
- Vandasova, Z.; Vencálek, O.; Puklová, V. Specific and combined subjective responses to noise and their association with cardiovascular diseases. Noise Health 2016, 18, 338–346. [Google Scholar] [CrossRef] [PubMed]
- Michaud, D.S.; Keith, S.E.; McMurchy, D. Annoyance and disturbance of daily activities from road traffic noise in Canada. J. Acoust. Soc. Am. 2008, 123, 784–792. [Google Scholar] [CrossRef]
- Kirschbaum, C.; Hellhammer, D.H. Noise and Stress-Salivary cortisol as a non-invasive measure of allostatic load. Noise Health 1999, 1, 57–66. [Google Scholar]
Disclaimer/Publisher’s Note: The statements, opinions and data contained in all publications are solely those of the individual author(s) and contributor(s) and not of MDPI and/or the editor(s). MDPI and/or the editor(s) disclaim responsibility for any injury to people or property resulting from any ideas, methods, instructions or products referred to in the content. |
© 2024 by the authors. Licensee MDPI, Basel, Switzerland. This article is an open access article distributed under the terms and conditions of the Creative Commons Attribution (CC BY) license (https://creativecommons.org/licenses/by/4.0/).