Abstract
Introduction: In Ethiopia, a comprehensive smoke-free law that bans smoking in all public areas has been implemented since 2019. This study aimed to evaluate compliance with these laws by measuring the air quality and conducting covert observations at 154 hospitality venues (HVs) in Addis Ababa. Methods: Indoor air quality was measured using Dylos air quality monitors during the peak hours of the venues, with concentrations of particulate matter <2.5 microns in diameter (PM2.5) used as a marker of second-hand tobacco smoke. A standardized checklist was used to assess compliance with smoke-free laws during the same peak hours. The average PM2.5 concentrations were classified as good, moderate, unhealthy for sensitive groups, unhealthy for all, or hazardous using the World Health Organization’s (WHO) standard air quality index breakpoints. Results: Only 23.6% of the venues complied with all smoke-free laws indicators. Additionally, cigarette and shisha smoking were observed at the HVs. Overall, 63.9% (95% confidence interval: 56–72%) of the HVs had PM2.5 concentrations greater than 15 µg/m3. The presence of more than one cigarette smoker in the venue, observing shisha equipment in the indoor space, and the sale of tobacco products in the indoor space were significantly associated with higher median PM2.5 concentration levels (p < 0.005). Hazardous level of PM2.5 concentrations—100 times greater than the WHO standard—were recorded at HVs where several people were smoking shisha and cigarettes. Conclusions: Most HVs had PM2.5 concentrations that exceeded the WHO average air quality standard. Stricter enforcement of smoke-free laws is necessary, particularly for bars and nightclubs/lounges.
1. Background
Second-hand tobacco smoke (SHS) exposes individuals to toxic and carcinogenic components [1]. Particulate matter (PM2.5) is a mixture of solid and liquid particles with a diameter of <2.5 µm, serving as a biomarker for SHS exposure in both indoor and outdoor public places [1,2,3,4,5]. Even short-term exposure to these particles has been linked to increased mortality due to cardiovascular, respiratory, and cerebrovascular diseases [4,6]. Studies measuring airborne nicotine concentrations [7] and PM2.5 concentrations [8] have reported higher SHS concentrations in hospitality venues (HVs) than in other public places. Tobacco smoking is the main source of PM2.5 pollution in indoor spaces, producing far more fine particles than other sources [5]. In Scotland, a study reported a significant reduction in PM2.5 concentration following a ban on smoking in pubs [9].
Article 8 of the World Health Organization (WHO) Framework Convention on Tobacco Control (FCTC) calls upon all parties to implement measures to safeguard the public from SHS exposure in indoor public spaces [10]. Ethiopia enacted a comprehensive tobacco control law in 2019 (Proclamation 1112/2019) [11] to create smoke-free public spaces, including HVs. The aim of such laws is to reduce SHS exposure and, consequently, protect the health of nonsmokers. Studies have shown that comprehensive smoke-free laws can effectively reduce SHS in public venues, increase the demand for smoking cessation, and decrease smoking among young people [12,13].
Studies conducted in African countries have shown a lack of knowledge and low compliance with smoke-free policies in various hospitality venues, such as hotels, bars, nightclubs, pubs, and restaurants [10,14]. A 2016 survey conducted in Ethiopia revealed that 60% of adults were exposed to second-hand smoke in bars and nightclubs and 31% in restaurants [15]. To evaluate the effective implementation of these laws, it is crucial to conduct observations and measure air quality in these establishments. In this study, the researchers used a low-cost air quality monitor, the Dylos1700 (Dylos, Riverside, CA, USA), to measure mass concentrations of PM with sizes ranging from 0.5 µm to 2.5 µm in HVs in Addis Ababa [5,16]. The primary objective of this study was to measure the mass concentration of particles within this range, which is indicative of exposure to second-hand smoke. The findings of this study will be useful for decision making regarding the implementation and enforcement of smoke-free laws in these venues in Ethiopia.
2. Methods
2.1. Study Area and Design
This cross-sectional study was conducted in Addis Ababa, Ethiopia, as part of a larger national study assessing compliance with smoke-free laws. The city administration consists of 11 sub-cities [17] housing nearly five million people [17]. Each sub-city is further divided into woredas, which represent the lowest public administration structure in Ethiopia.
2.2. Sample Size Estimation
The national study had a total sample size of 1300 HVs across 10 major cities in Ethiopia. This sample size was based on a similar study conducted in Uganda, which found that 82% of the surveyed HVs complied with ‘no active smoking’ in venues [18], with a 95% confidence level, 3% margin of error, a design effect of two, and a 5% non-response rate. A total of 285 HVs were allocated to Addis Ababa, and 154 HVs were selected for PM2.5 measurements. Most studies recommend measuring PM2.5 levels in an area or city with between 20 and 100 HVs, with various types of venues, such as bars, hotels, restaurants, cafés, and nightclubs [19].
2.3. Sampling Techniques
The following six-sub cities in Addis Ababa were selected for this study based on the high number of registered HVs: Addis Ketema, Arada, Bole, Kirkos, Lideta, and Nefas-Silk-Lafto. Within each sub-city, the woreda with the highest number of HVs was chosen in consultation with the Tobacco Control Law Enforcement Team of the Addis Ababa Food, Medicine, and Healthcare Administration and Control Authority (FMHACA). The list of HVs at the sub-city’s Bureau of Trade and the Woreda Office was incomplete and inconsistent, so the selection process involved dividing the woreda into clusters and selecting 4–6 clusters with a high density of HVs and multiple streets, following the WHO’s recommended approach for this type of study [20].
We listed the number and types of HVs in the selected clusters by walking through each neighborhood. After compiling the names and categorizing the HVs in the delineated clusters, we allocated a sample size proportional to the various types of HVs (restaurants, cafés, hotels, grocery, bars, and nightclubs/lounges). A systematic random sampling approach was employed to select a subsample of 154 HVs for the air quality measurements.
Data collection was carried out for 10 days using a standardized checklist that was informed by the ‘How-to-Guide for Conducting Compliance Studies’ for the smoke-free law [21] and the provisions of the Ethiopian Tobacco Control Proclamation (1112/2019) [11]. The checklist was translated into Amharic and back-translated into English to ensure consistency. Covert observation of compliance with smoke-free laws in all study HVs was conducted using three pairs of trained data collectors and one supervisor using Open Data Kit (ODK) (https://opendatakit.org)-enabled smartphones. Electronic data were uploaded to a local server at Addis Ababa University (AAU), Addis Ababa, Ethiopia.
2.4. PM2.5 Measurement
At the beginning of each data collection period, the Dylos DC1700 (manufacture: Dylos Corporation, 2900 Adams Street, Unit C38, Riverside, CA 92504, USA) was turned on to start recording the outside PM2.5 for a minimum of 30 min once a day. The device was left in operation, and particle concentrations were continuously measured until the end of the collection period. The purpose of outside air sampling was to establish comparative data for indoor air samples obtained on the same day [19]. Following the measurement of outdoor air quality, the data collectors entered the selected HV and identified the central location within the venue to assess the indoor PM2.5. They placed the Dylos DC1700 equipment away from open doors, windows, mechanical ventilation, open flames, or other sources of SHS to minimize external interference. To ensure accurate indoor measurements, the bag containing the monitor was placed at table or chair level at least 1 m from any smoker, and beverages were ordered for the data collectors. Indoor measurements were performed for a minimum of 30 min.
After each period, the Dylos DC1700 was turned off, and the data were downloaded to a PC using Dylos Logger software version 3. The start and end times for each venue’s PM2.5 recording were also recorded, along with the type of venue, entrance and exit times, room size, number of people present, number of people using tobacco products, presence of mechanical ventilation, presence of any source of smoke, and whether doors/windows were open. The peak hours for HVs were considered to be between 18:00 and 24:00 h East Africa Time (EAT) for observation and measurement of PM2.5 levels.
2.5. Data Analysis
Data cleaning and analysis were performed using SPSS version 26 and STATA version 14. Descriptive statistics, such as frequencies, proportions, mean, median, interquartile range (IQR), and standard deviations (SDs), were used to summarize the data. Seven specific smoke-free law indicators were used to assess indoor space compliance, including the absence of smoking, ashtrays, lighters, shisha equipment, and tobacco products within 10 m of any door, window, or air intake mechanism.
For each HV type, the overall average compliance with the smoke-free law was determined using a method employed in previous studies [16,21,22], where the compliance percentages for each smoke-free law indicator were added and the sum was divided by the total number of indicators. Differences between groups were assessed using a t-test, with the level of statistical significance set at p < 0.05 for.
The Dylos DC1700 measures particle number concentrations up to 0.5 µm (small particles) and 2.5 µm and above (large particles) in 0.01 cubic foot of air for each minute of measurement. The objective of this study was to determine the particle number concentrations between large and small particles, and the large-particle reading was subtracted from the small-particle reading. These values were multiplied by 100 to obtain the number of particles per cubic foot of air. Finally, the particle number concentrations were converted to PM2.5, using a formula proposed in previous studies [5,16].
In addition to the indoor PM2.5 measurements, 26 outside air measurements were conducted to provide comparative data; however, one measurement was incomplete and excluded from the analysis. PM2.5 data were analyzed using MS Excel and SPSS version 24. The average PM2.5 concentration data for each minute’s number of particle concentrations reported by the Dylos DC1700 was generated for each HV. The means and medians of the average PM2.5 concentration were compared based on venue type, size of the venue, compliance status (compliant vs. non-compliant), active tobacco smoke, and other sources of smoke. Statistical significance was set at p < 0.05. Additionally, the indoor PM2.5 concentrations (µg/m3) in the current study were compared with the standard air quality index breakpoints over a 24 h average. The WHO five air quality categories are good (0.0–15.0 µg/m3), moderate (15.1–40.0 µg/m3), unhealthy for sensitive groups (40.1–65.0 µg/m3), unhealthy for all (65.1–250 µg/m3), and hazardous (>250 µg/m3) [6]. For each type of venue, the percentage (%) greater than the average WHO 24 h level (15 µg/m3) was calculated with a 95% confidence interval (CI). As a checklist for the submission of this manuscript, we used STROBE cross-sectional reporting guidelines [23].
3. Results
3.1. General Characteristics of the HVs
Data from only 144 (93.5%) of the 154 HVs were used for the final analysis, as four venues were measured for less than 30 min, and six were measured incorrectly. Most of the HVs included in this study were selected from Bole sub-city, Woreda 03 (n = 38, 26%); Nifas-Silk-Lafto sub-city, Woreda 01 (n = 26, 18.1%); and Kirkos sub-city, Woreda 02 (n = 24, 16.7%) (Table 1). Approximately 27% (n = 39) were bars and restaurants, 17.4% (n = 25) were bars, and 15.3% (n = 22) were nightclubs. Most venues (88.9%, n = 128) had only indoor facilities, whereas 11.1% (n = 16) had both indoor and outdoor facilities. Considering the potential accommodation size of the venues, 42.4% (n = 61) were categorized as large (>45 persons), 34.7% (n = 50) as medium (30–45 persons), and the remaining 22.9% (n = 33) as small (<30 persons) (Table 1).

Table 1.
Characteristics of hospitality venues by sub-city and woreda.
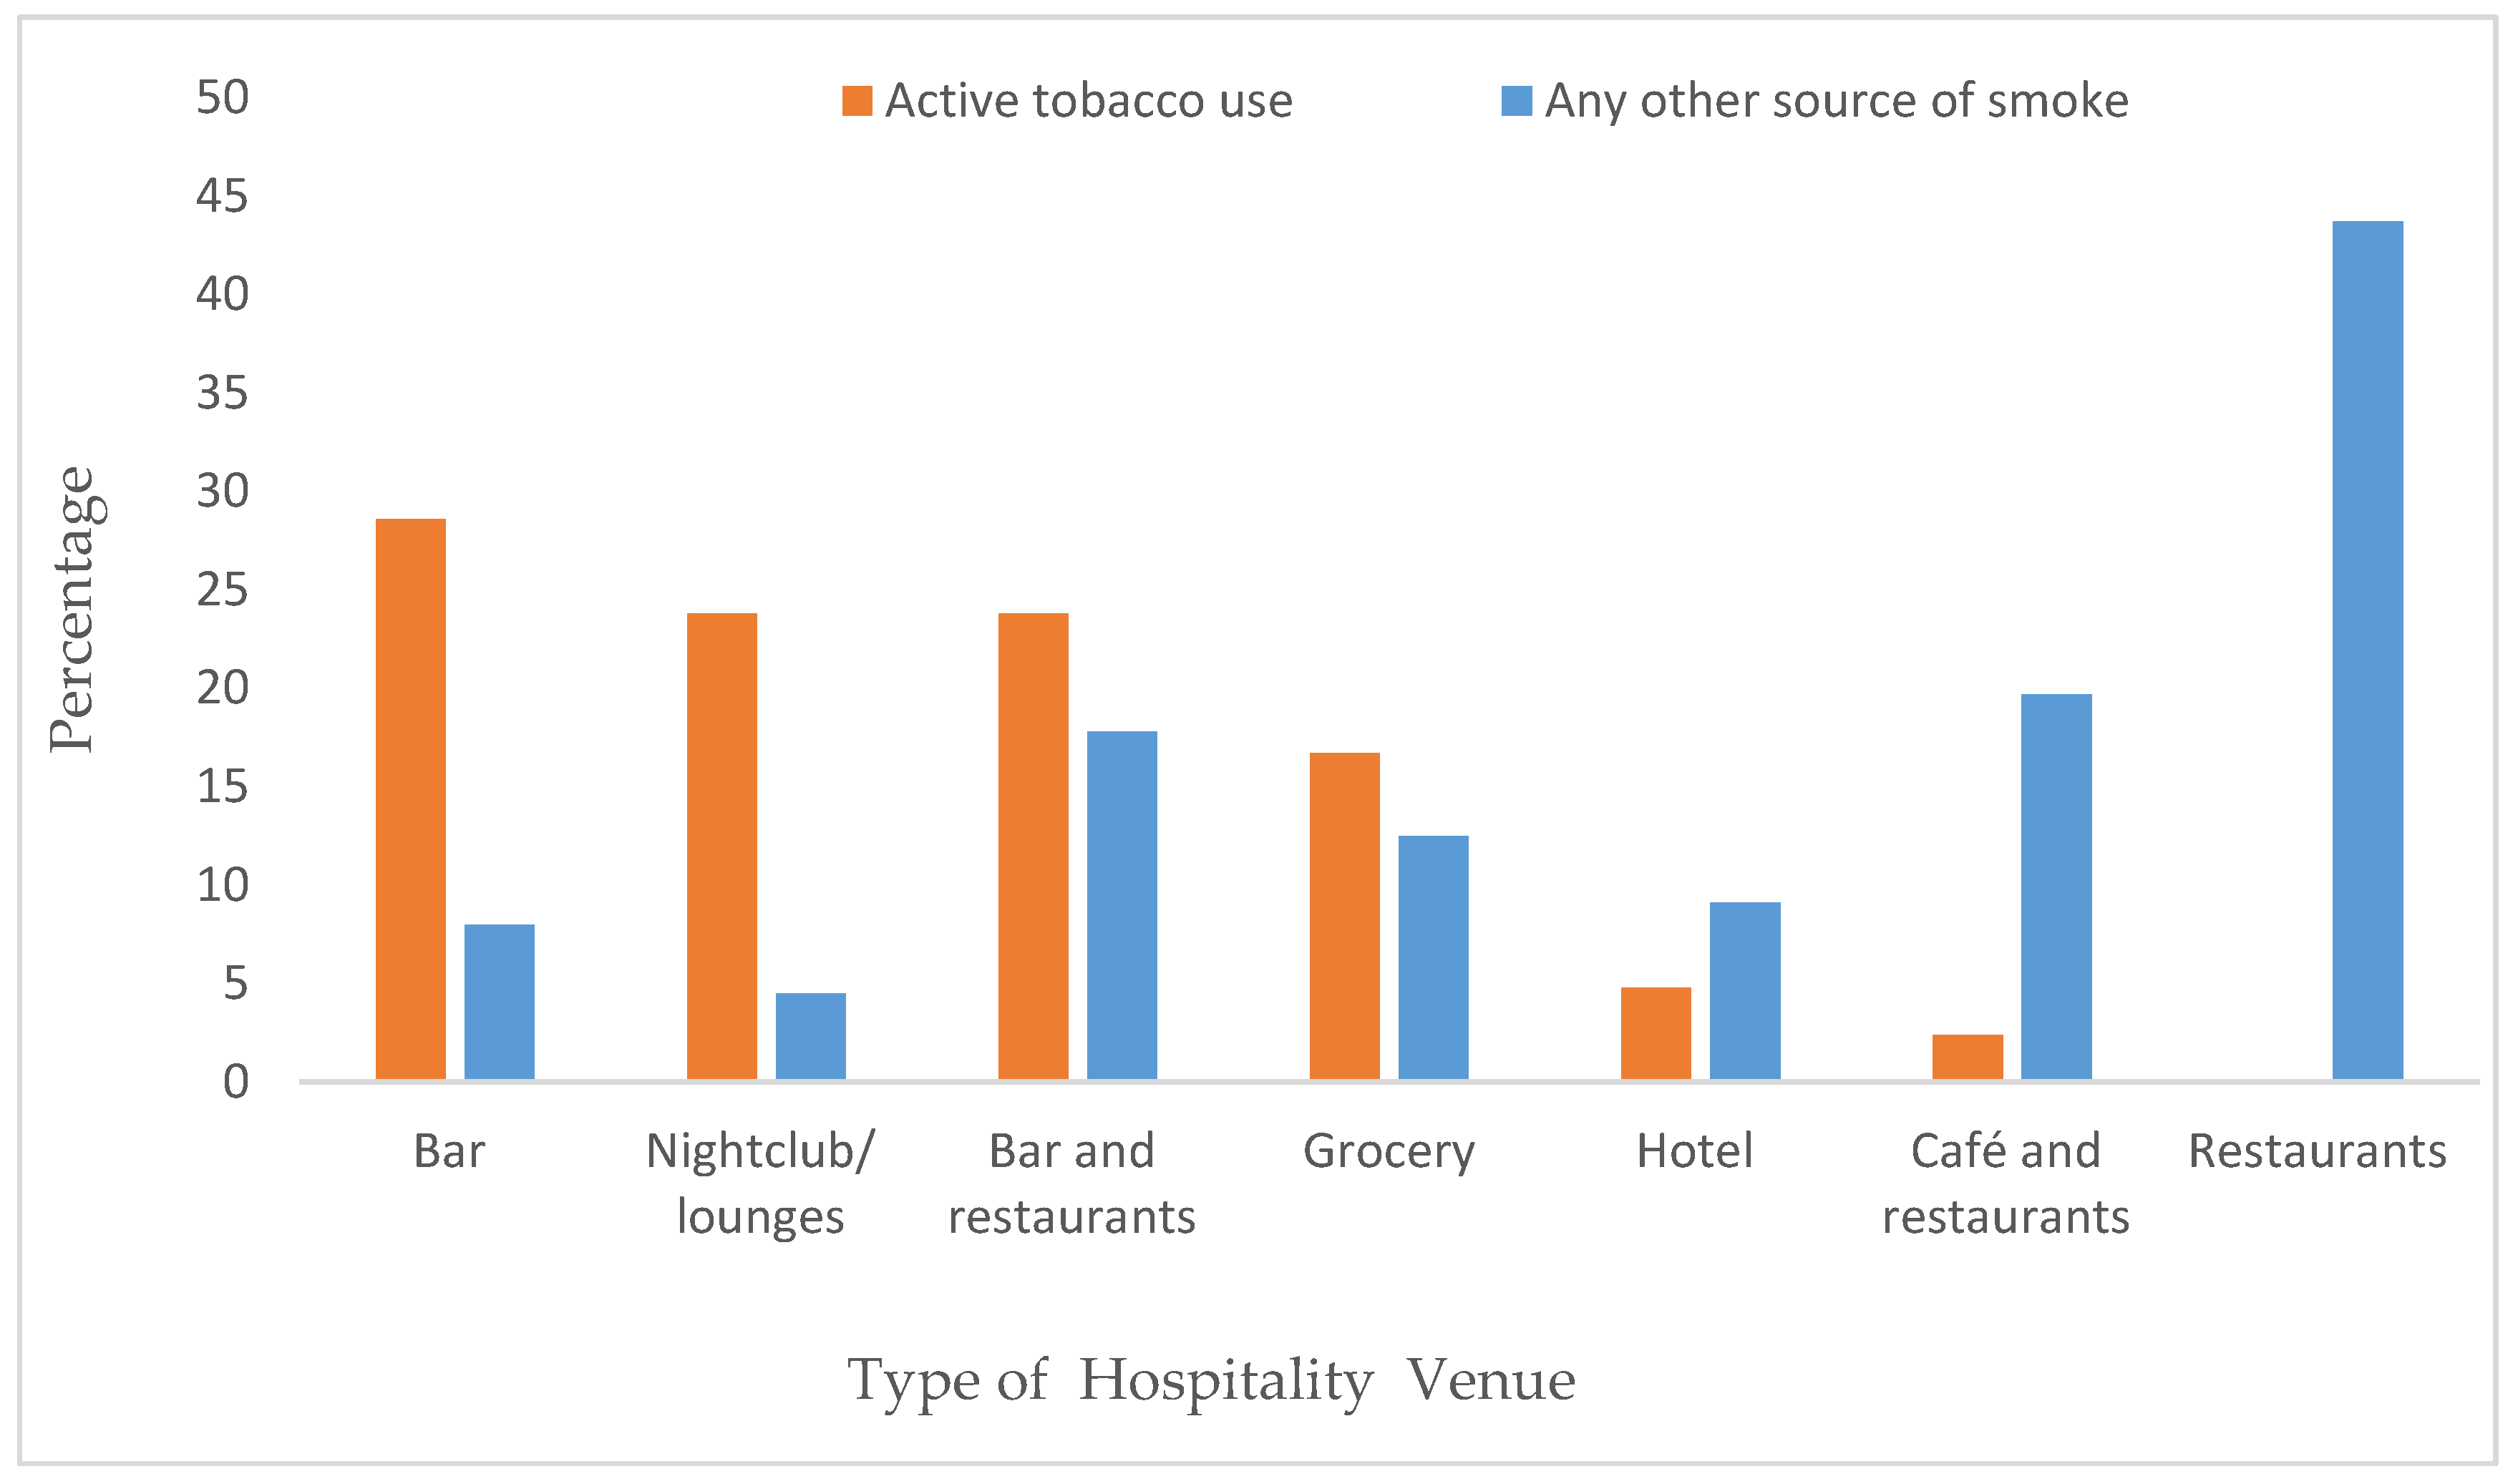
Active tobacco smoking was observed in various HVs, with the highest prevalence observed in bars (28.6%) followed by nightclubs/lounges (23.8%). No active tobacco use was observed in restaurants. Additionally, at least one other source of smoke, such as an open kitchen, coal, or candle, was present in 43.7% of restaurants and 19.7% of cafés and restaurants (Figure 1).
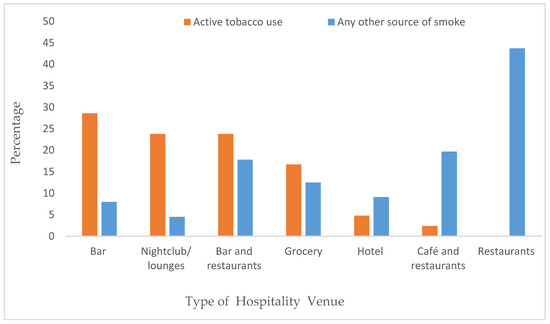
Figure 1.
Source of smoke in hospitality venues in Addis Ababa.
3.2. PM2.5 Concentrations in Indoor HVs
The overall mean and median PM2.5 concentrations for indoor measurements were 37.23 µg/m3 and 18.92 µg/m3 (IQR: 23.26), respectively, and those for outside measurements were 15.89 µg/m3 and 14.53 µg/m3 (IQR: 8.44), respectively. The outside PM2.5 concentrations (15.92 µg/m3) in our study were almost equivalent to the WHO’s 24 h average PM2.5 level (15 µg/m3). Table 2 shows the PM2.5 levels according to type of HV, nature, and size of the venue. The median concentrations of PM2.5 were highest in restaurants (21.91 µg/m3, IQR: 29.45), bars (21.61 µg/m3, IQR: 28.85), and grocery stores (21.39 µg/m3, IQR: 11.43). Interestingly, the median PM2.5 level in nightclubs/lounges (12.12 µg/m3, IQR: 48.07) was lower than in the other HV categories, despite their mean PM2.5 level (45.28 µg/m3) being higher, except for restaurants, which had a mean of 60.4 µg/m3. The median PM2.5 concentrations were similar across the three sizes of HVs.
Table 2.
Indoor PM2.5 concentrations (µg/m3) by the type and size of hospitality venue.
3.3. Compliance with Smoke-Free Law in HVs
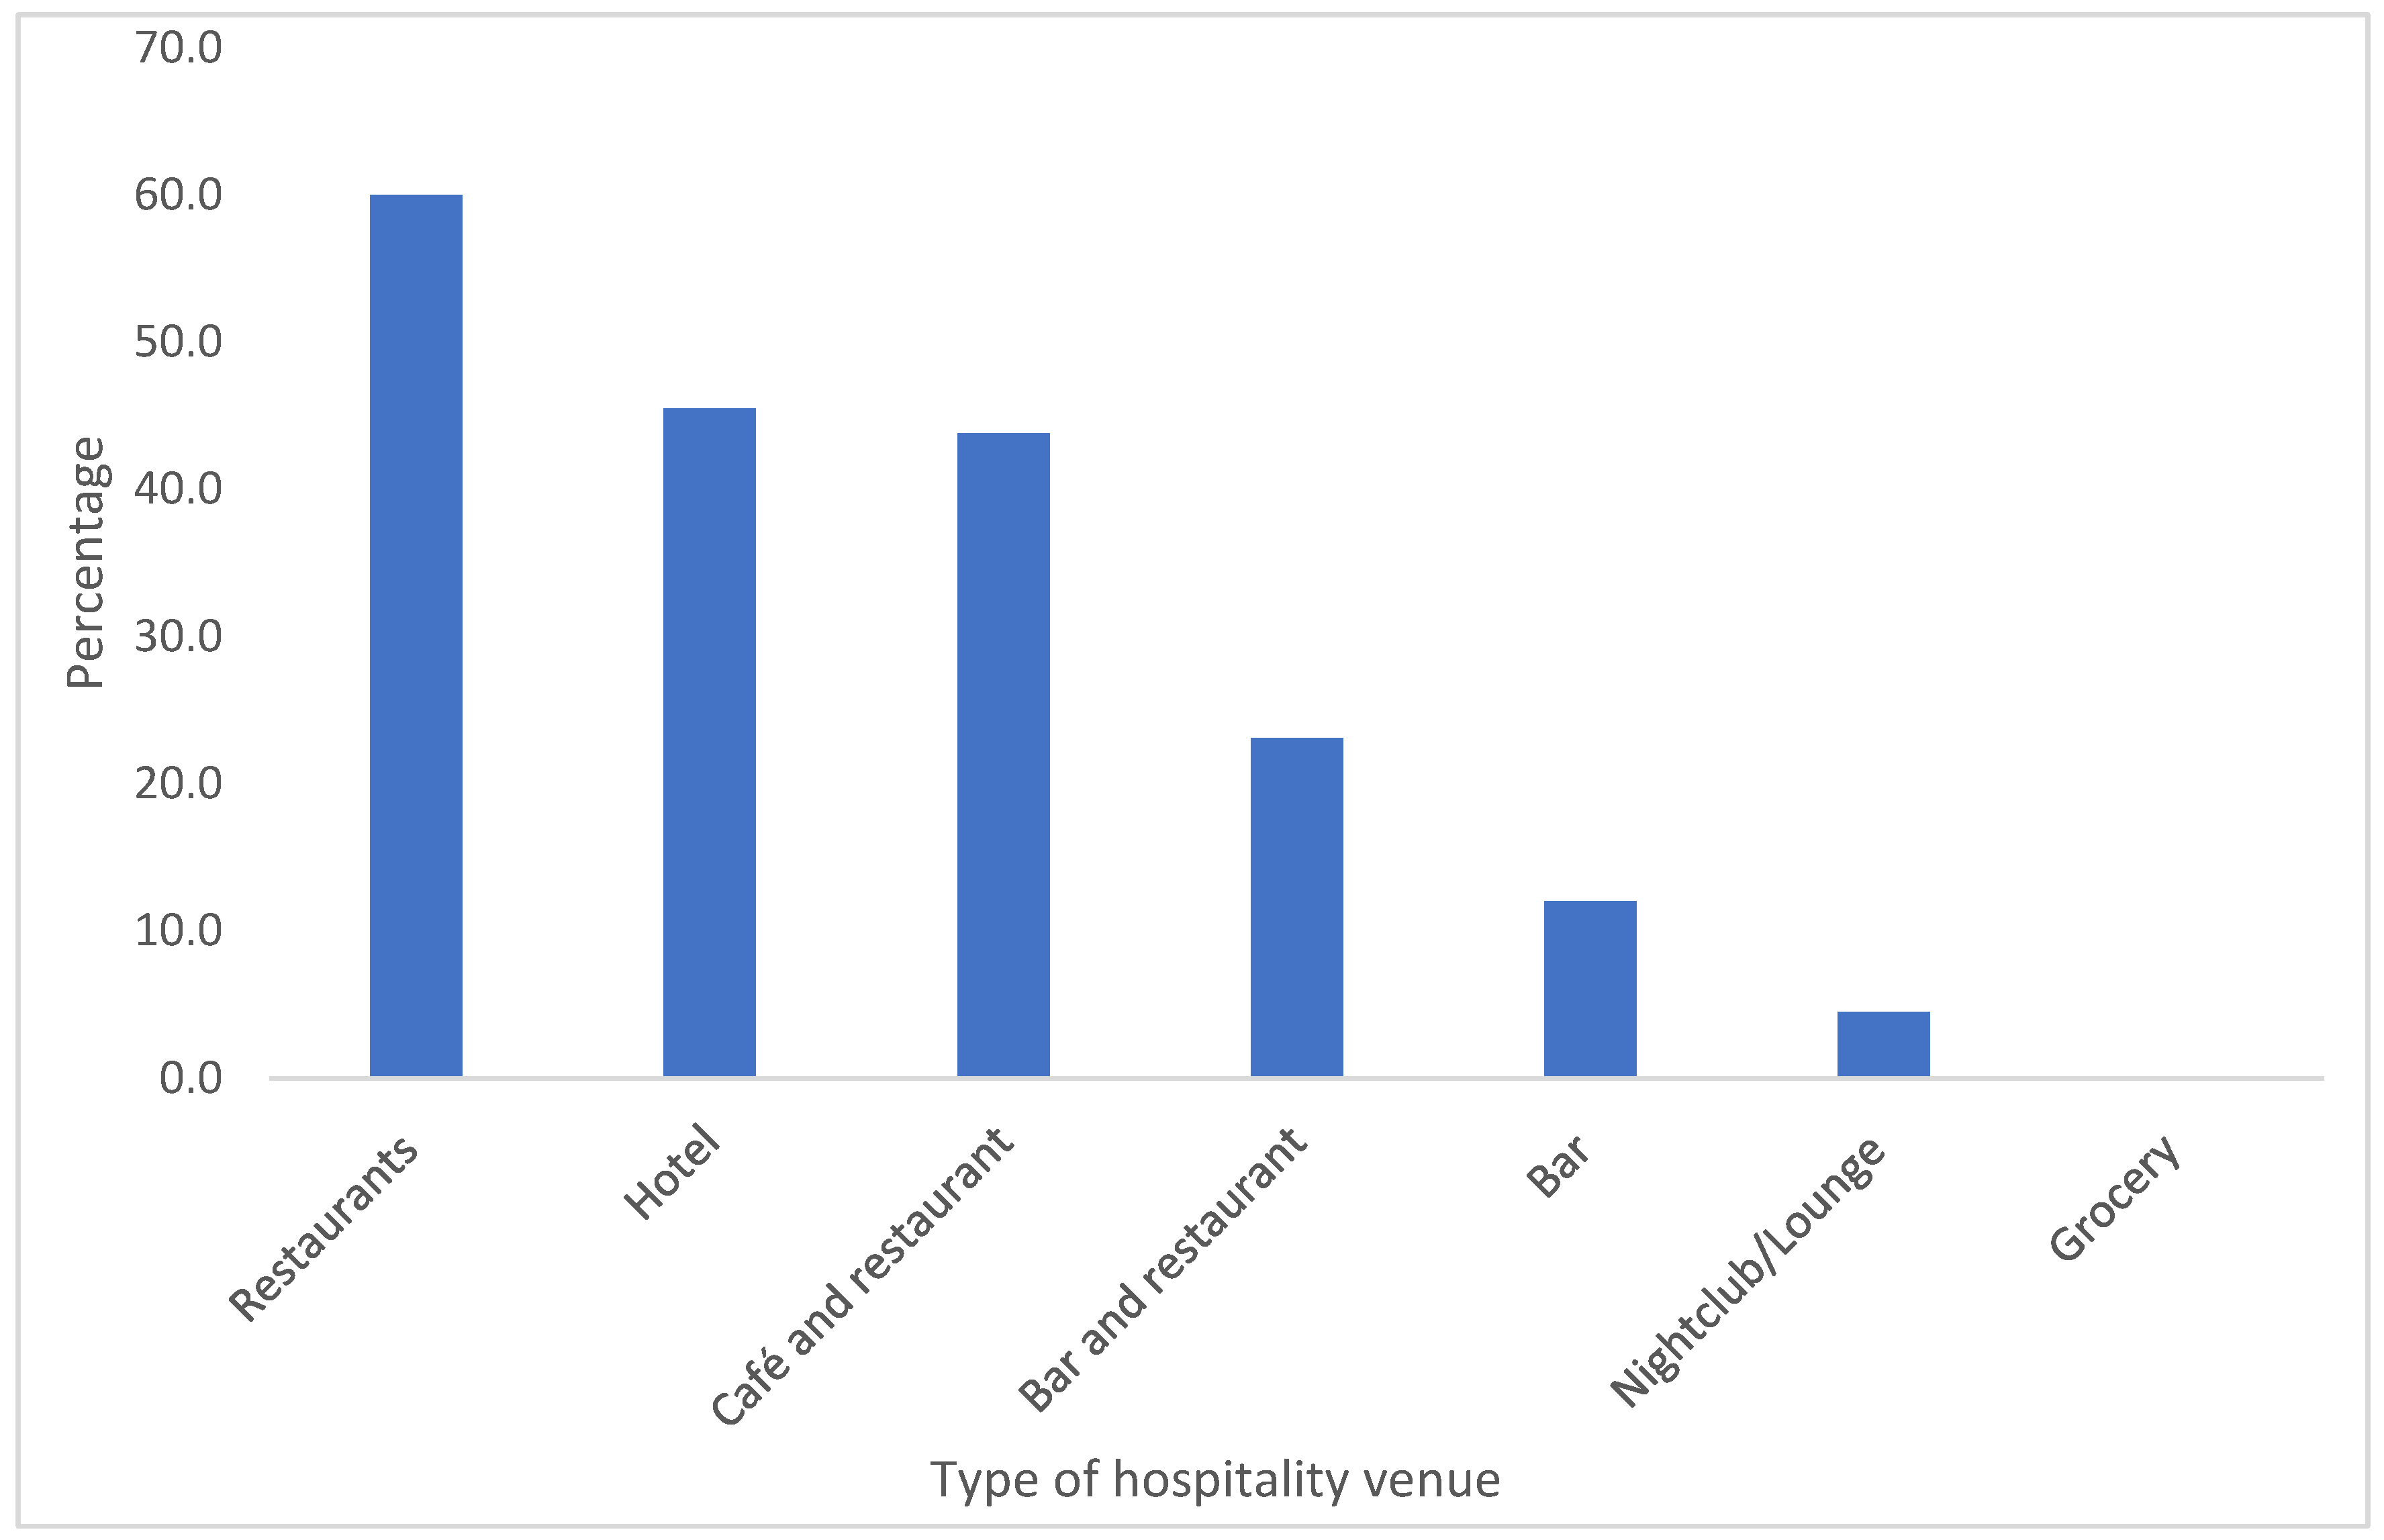
Average compliance to smoke free laws indicators in HVs, restaurants (60%), hotel (45.5%) and café and restaurants (43.8%) had the highest proportion, while grocery, nightclubs/lounges, and bars showed the lowest compliance rates, at 0%, 4.5%, and 12%, respectively. Across all HVs, only 23.6% demonstrated full compliance with smoke-free laws (Figure 2).

Figure 2.
Indicators of compliance with smoke-free laws by type of hospitality venue in Addis Ababa.
The percentage of HVs with indoor PM2.5 concentrations (µg/m3) exceeding the WHO’s 24 h average (>15 µg/m3) and their respective 95% CIs. Overall, 63.9% (95% CI: 56–72%) of HVs had PM2.5 concentrations greater than 15 µg/m3. Grocery (81.3%) had the highest proportion, followed by cafés and restaurants (73.3%), bars and restaurants (69.2%), and restaurants (68.8%). The 95% CIs overlapped, suggesting that there were no significant differences. The proportion of HVs with indoor PM2.5 concentrations greater than the WHO’s 24 h average was 75% in venues with both indoor and outdoor facilities, compared to 62.5% in venues with only indoor facilities, with no statistically significant difference observed. In terms of venue size, similar percentages (62.0–66.7%) of the three venue sizes surpassed the WHO’s 24 h average PM2.5 (µg/m3) (Table 3).
Table 3.
Comparison of indoor PM2.5 concentrations (µg/m3) of the venues with the WHO’s 24 h average.
Table 4 indicates that 36.1% (n = 52) of HVs had PM2.5 concentrations below 15 µg/m3, which is considered good, while 40.3% (n = 58) had PM2.5 concentrations between 15.1 and 40 µg/m3, categorized as moderate. Approximately 11% (n = 16) and 10.4% (n = 15) of the venues had PM2.5, which is considered unhealthy for sensitive groups and all people, respectively. The air quality in two restaurants and one nightclub/lounge was deemed hazardous. Furthermore, 11.7% (n = 15) of HVs with only indoor facilities, 16% (n = 4) of bars, and two nightclubs/lounges had unhealthy air quality levels.
Table 4.
Comparison of indoor PM2.5 concentrations (µg/m3) of the venues with standard air quality index breakpoints (Addis Ababa, December 2022).
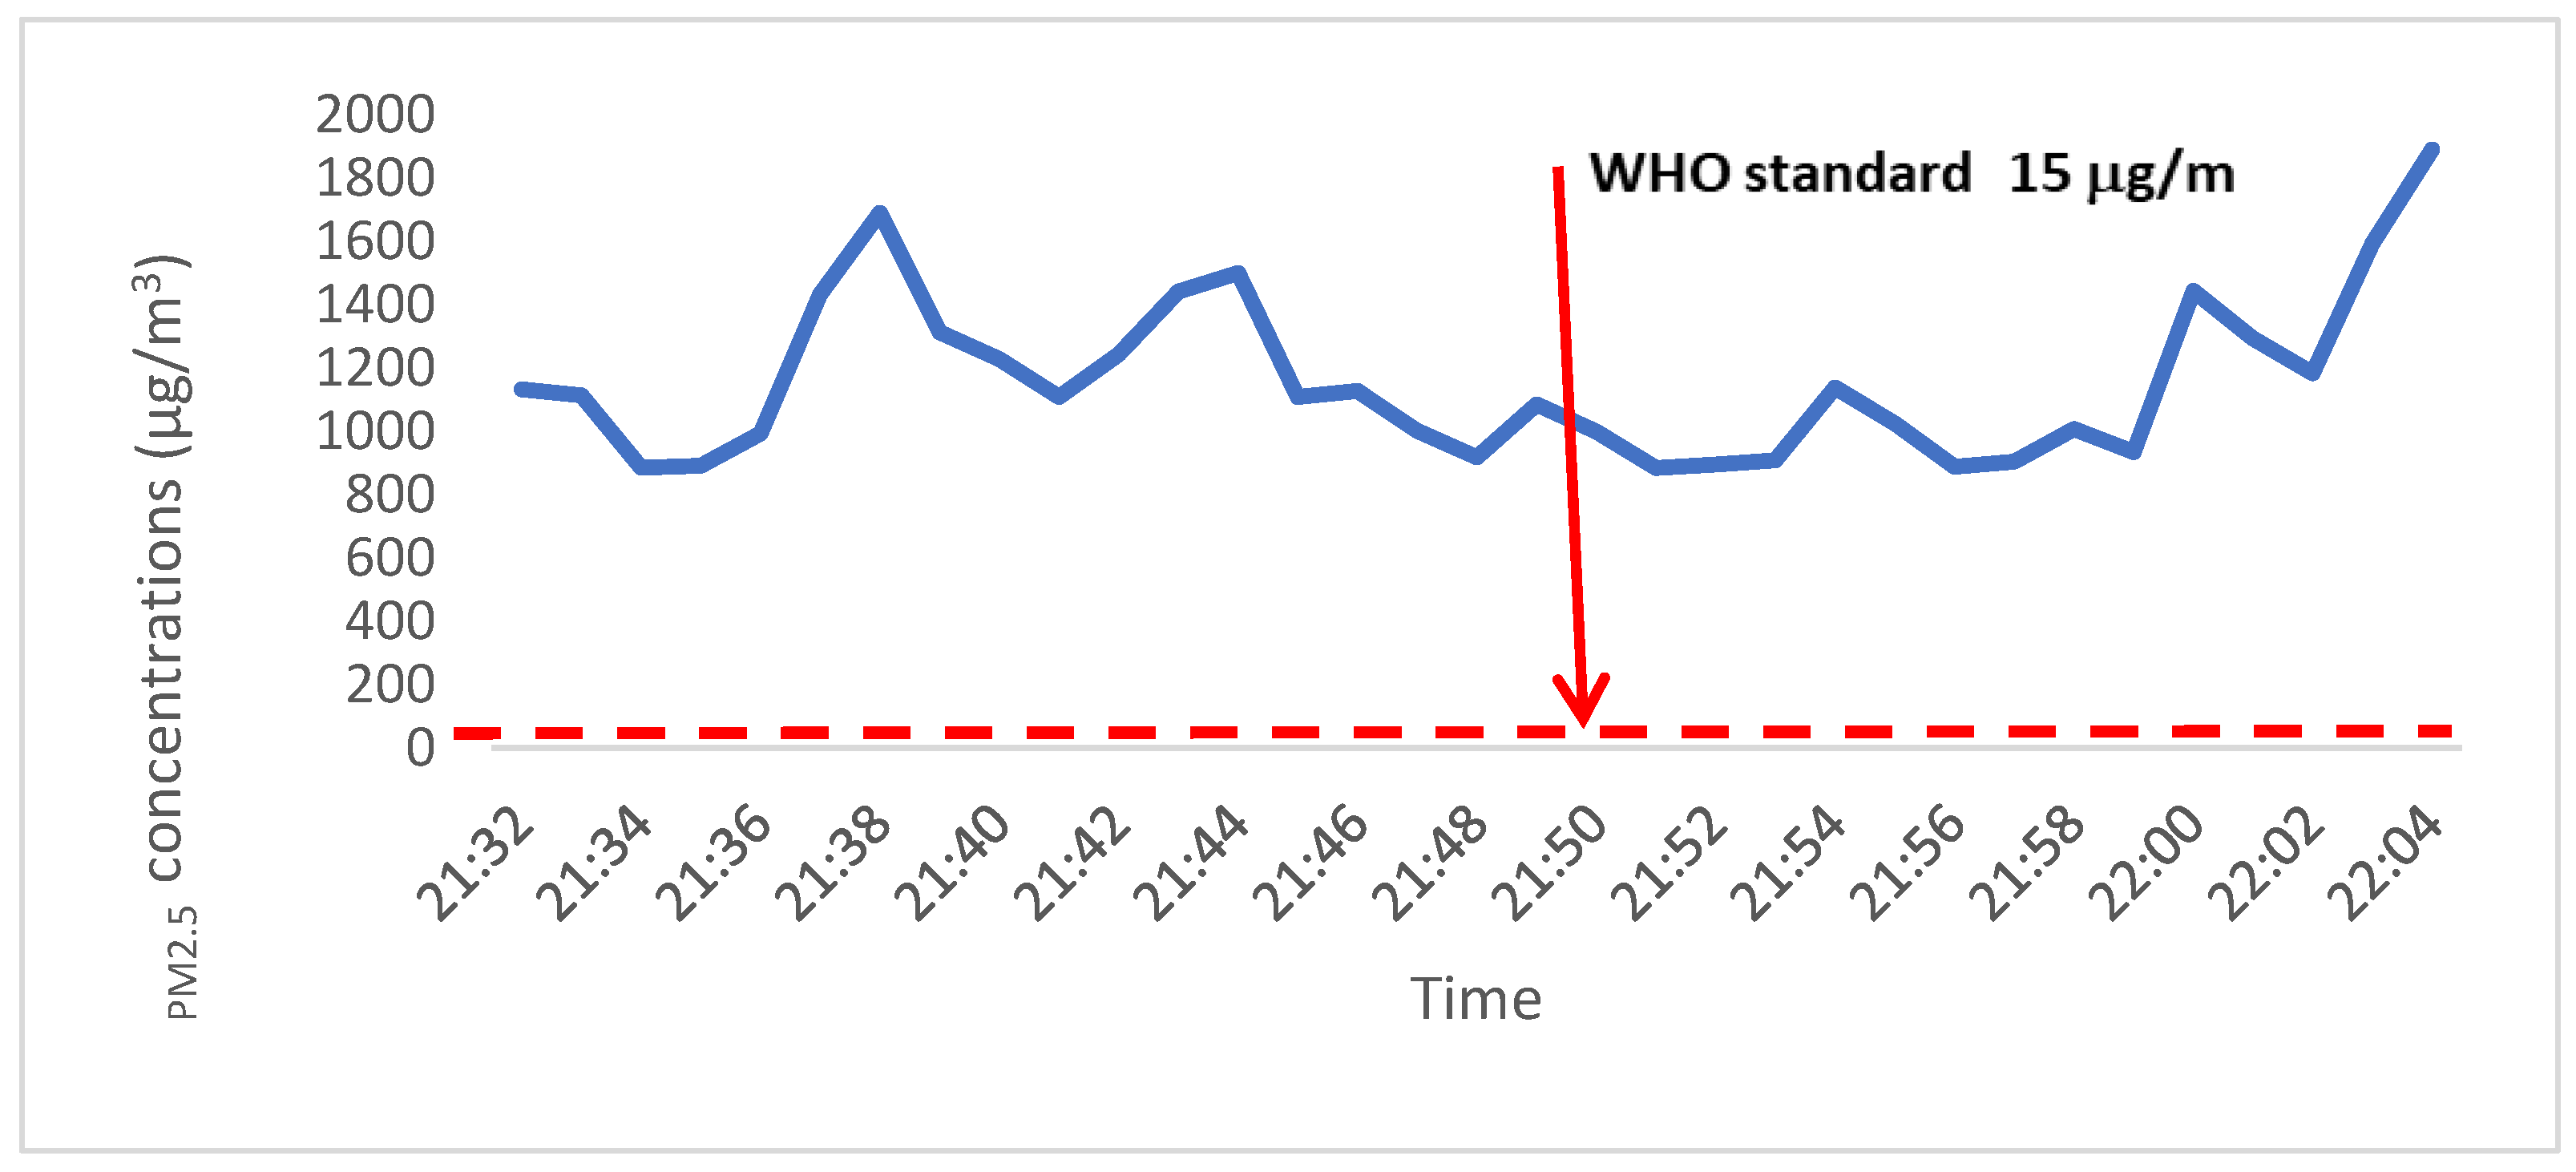
Figure 3 shows a PM2.5 concentration (µg/m3) measurement in one of the nightclubs/lounges where several people were using tobacco products. This HV recorded a hazardous level of PM2.5 concentration (>250 µg/m3) at the time of indoor data collection.
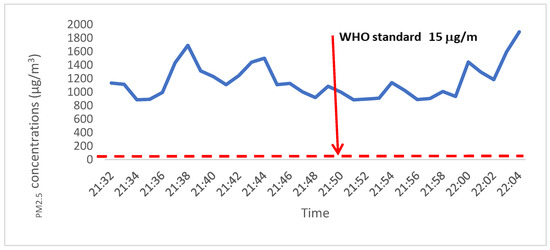
Figure 3.
PM2.5 (µg/m3) measurement at a nightclub with several tobacco users (Addis Ababa, December 2022).
Table 5 shows the PM2.5 concentrations (µg/m3) inside the HVs based on compliance with smoke-free laws. Venues where smoking was observed had a median PM2.5 concentration of 22.56 µg/m3 (IQR: 48.41), which is greater than the median concentration of 17.06 µg/m3 (IQR: 17.54) in venues without smoking. Although the difference was not statistically significant (p = 0.099), smoking venues had higher median PM2.5 values. The presence of multiple smokers, shisha equipment, and the sale of tobacco products in indoor spaces were all significantly associated with higher PM2.5 concentrations (p < 0.005). Although open kitchens and coal smoke contributed to an increase in PM2.5, none of these associations was statistically significant.
Table 5.
Indoor PM2.5 concentrations (µg/m3) by smoke-free law indicators and other sources of smoking (Addis Ababa, December 2022).
4. Discussion
This study is the first to be conducted in Ethiopia in accordance with smoke-free laws that measures PM2.5 concentration in HVs. The mean and median PM2.5 concentrations for indoor measurements were 37.23 µg/m3 and 18.92 µg/m3, respectively, compared to outdoor measurements of 15.89 µg/m3 and 14.53 µg/m3, respectively. Approximately 36% of HVs had PM2.5 concentrations below 15 µg/m3, while 40.3% had concentrations between 15.1 µg/m3 and 40 µg/m3. Approximately 11% and 10.4% of the venues had PM2.5 values considered unhealthy for sensitive groups and unhealthy for all people, respectively. Two restaurants and one nightclub had PM2.5 levels above 250 µg/m3, posing a health risk to both employees and customers in these establishments. Evidence of tobacco use in the indoor space of HVs was significantly associated with higher median PM2.5 concentrations (p < 0.005).
The average outdoor PM2.5 concentration was comparable to the WHO’s 24 h average outdoor measurement (15 µg/m3) [6], but it was significantly lower than the indoor measurements, indicating potential PM2.5 emissions in indoor HVs. Previous research in different settings has also reported higher indoor PM2.5 concentrations than outdoor measurements [18,24]. In our study, the presence of multiple smokers and shisha equipment, as well as the sale of tobacco products in indoor spaces, was significantly associated with a higher median PM2.5. We also found hazardous levels of PM2.5 in a nightclub/lounge during new year celebrations, where several people were smoking tobacco products. Our findings align with a study conducted in Ghana [25] that reported higher PM2.5 concentrations (28.3 μg/m3) in HVs with indoor tobacco smoking compared to smoke-free spaces (12.3 μg/m3). Consistent with other studies, our research demonstrates an increase in PM2.5 concentrations in the presence of tobacco smoke [9,25,26].
In this study, 63.9% of HVs had indoor PM2.5 concentrations (µg/m3) higher than the WHO’s 24 h average (>15 µg/m3) [6]. These estimates are notably high in countries with comprehensive smoke-free laws. However, no studies have been conducted in Ethiopia before or after the approval of smoke-free laws, and we lack a reference with which to compare our findings. A study conducted in Turkey reported that cigarette smoking was observed in 67.5% of HVs, with a median PM2.5 five times higher than ours, even after the implementation of smoke-free laws [3]. Conversely, studies conducted in Michigan [27] and Scotland [9] reported a significant decline in active indoor smoking and PM2.5 concentration following the implementation of such laws. This suggests a potential impact of strong regulatory measures in reducing SHS exposure.
Although no active tobacco smoking was observed in restaurants, 68.8% had PM2.5 concentrations exceeding 15 µg/m3. This can be explained by PM2.5 emissions resulting from biomass fuel combustion, fuel combustion for heating, vehicular traffic, and other human activities [28,29]. Studies conducted in rural Malawi, Ethiopia, and Uganda [28,29,30] also have reported similar results.
Approximately 24% of HVs complied with all smoke-free law indicators, although cigarette smoking (29.2%) and shisha smoking (6.2%) were observed. Notably, bars and nightclubs/lounges had the lowest smoke-free compliance rates, and active tobacco use was observed. This finding aligns with previous studies that reported higher tobacco use and poorer compliance with smoke-free laws in bars and pubs than in hotels and other HVs [13,30]. Ethiopia has strong tobacco control laws, as evidenced by the comprehensive tobacco control law enacted in 2019 and reinforced by the Tobacco Control Directive (Number 771/2021) of 2021 [26]. The Proclamation mandates that indoor public spaces, public transport, and workplaces be completely free of smoke [11]. However, our study reveals suboptimal implementation of these laws in HVs, particularly in bars and nightclubs/lounges where law enforcement activities are limited.
5. Limitations
The PM2.5 concentration was measured over a 30 min period, while the WHO’s air quality standard employs data from a 24 h measurement. This difference in duration might affect comparability of the results. However, the results of this study indicate that the measured average outdoor PM2.5 concentration was comparable to the WHO’s 24 h average outdoor measurement. This increases our confidence that the higher average indoor PM2.5 concentration measurement was due to a potential source of PM2.5 emissions in indoor HV environments. Although tobacco is the main source of PM2.5 emissions, biomass fuels, fuel combustion for heating, vehicles, and similar human activities can also be sources [5,28,29,30].
6. Conclusions
Compliance of HVs in Addis Ababa with smoke-free law indicators was found to be suboptimal. Active tobacco smoking is more common in bars and nightclubs than other types of HVs. In 64% of HVs, PM2.5 concentrations exceeded the average WHO air quality standard. Active use of cigarettes and shisha contributes to elevated PM2.5 emissions in HVs. It is crucial to cautiously interpret the high PM2.5 concentrations in smoke-free HVs, surpassing the WHO air quality standard, considering other potential sources of PM2.5. Further research and interventions are needed to address additional contributors to PM2.5 levels in HVs in Addis Ababa. It is recommended that the enforcement of smoke-free laws be strengthened, particularly for bars and nightclubs/lounges. We recommend that similar studies be conducted in other regions of Ethiopia.
Author Contributions
Conceptualization: W.D., S.H., S.A.K., T.G.A., N.D.M. and W.A.; Data curation: W.D., S.H. and T.G.A.; Formal analysis: W.D. and S.H.; Funding acquisition: S.A.K., T.G.A., N.D.M. and W.A.; Methodology: S.H., W.D., T.G.A., N.D.M. and W.A.; Project administration: W.D. and S.H.: Supervision: S.H., W.D. and Y.T.; Writing—original draft: S.H.; Writing—review and editing: S.H., W.D., N.D.M., T.G.A., Y.T., W.A. and S.A.K. All authors have read and agreed to the published version of the manuscript.
Funding
This publication is based on research supported by the Bill & Melinda Gates Foundation (grant number INV-009670). The findings and conclusions presented herein are those of the authors and do not necessarily reflect the positions or policies of the Bill & Melinda Gates Foundation.
Institutional Review Board Statement
This research was approved by the Ethiopian Public Health Association, EPHA/OG/201/22; approved date, 18 November 2022.
Informed Consent Statement
Informed consent was obtained from all subjects involved in the study.
Data Availability Statement
The datasets used and analyzed in the current study will be made available by the corresponding author upon reasonable request.
Acknowledgments
We thank the Addis Ababa University School of Public Health, Development Gateway, Tobacco Control Data Initiative Ethiopia, Ethiopian Food and Drug Authority, Addis Ababa City, Food, Medicine, and the Health Care Administration. We also extend our gratitude to all the data collectors, data managers, supervisors, and coordinators who worked dedicatedly on this project.
Conflicts of Interest
The authors declare no conflicts of interest.
Operational Definitions
| Active smoking | Possession or control of a lit tobacco product, including cigarettes, cigars, and shisha, inside or outside HVs at the time of data collection. |
| Hospitality venue | An establishment registered under the regulation of the Government of Ethiopia where food and beverages are sold and consumed, namely hotels, restaurants, bars, bars and restaurants, cafés and restaurants, butcher houses and restaurants, grocery, nightclubs, and lounges. |
| Bar | An establishment where alcoholic drinks and (sometimes) food are served to clients. |
| Café | An establishment where simple meals and drinks (such as tea, coffee, and milk) are served to clients. |
| Compliance | The degree to which HVs fully implement tobacco control laws under the 2019 Ethiopian Tobacco Control Law (Proclamation No. 1112/2019). |
| Grocery | A small pub where individuals buy and drink alcoholic beverages. Most of these establishments are informal, neighborhood-based, and serve a variety of local and commercial alcoholic drinks. |
| Hotel | An establishment offering lodging, food, beverages, as well as recreational, conference, and similar facilities, to clients. |
| Lounge | A place where customers enjoy alcoholic beverages while listening to soothing music or watching television. In this study, however, lounges serve as nightclubs, since the latter is regarded as illegal. |
| Nightclub | A place of entertainment open to clients at night, usually serving food and liquor and providing music and space for dancing. |
| Restaurant | An establishment offering food and beverage services to clients. |
| Tobacco product | A product entirely or partly made of tobacco leaf as a raw material that is manufactured for use in smoking, chewing, sucking, or snuffing. |
List of Abbreviations
| AAU | Addis Ababa University |
| DSA | Designated smoking area |
| EAT | East Africa Time |
| FCTC | Framework Convention on Tobacco Control |
| GATS | Global Adult Tobacco Survey |
| HVs | Hospitality Venues |
| IQR | Interquartile Range |
| ODK | Open Data Kit |
| SD | Standard Deviation |
| SF | Smoke-free |
| SHS | Second-hand Smoke |
| PM | Particulate Matter |
| WHO | World Health Organization |
References
- Avila-Tang, E.; Elf, J.L.; Cummings, K.M.; Fong, G.T.; Hovell, M.F.; Klein, J.D.; McMillen, R.; Winickoff, J.P.; Samet, J.M. Assessing secondhand smoke exposure with reported measures. Tob. Control 2013, 22, 156–163. [Google Scholar] [CrossRef]
- Robertson, L.; Nyamurungi, K.N.; Gravely, S.; Rusatira, J.C.; Oginni, A.; Kabwama, S.N.; Ndikum, A.E.; Bianco, E.; Yusuf, S.; Huffman, M.D. Implementation of 100% smoke-free law in Uganda: A qualitative study exploring civil society’s perspective. BMC Public Health 2018, 18, 927. [Google Scholar] [CrossRef] [PubMed]
- Kaplan, B.; Carkoglu, A.; Ergor, G.; Hayran, M.; Sureda, X.; Cohen, J.E.; Navas-Acien, A. Evaluation of Secondhand Smoke Using PM2.5 and Observations in a Random Stratified Sample in Hospitality Venues from 12 Cities. Int. J. Environ. Res. Public Health 2019, 16, 1381. [Google Scholar] [CrossRef]
- Thangavel, P.; Park, D.; Lee, Y.C. Recent Insights into Particulate Matter (PM2.5)-Mediated Toxicity in Humans: An Overview. Int. J. Environ. Res. Public Health 2022, 19, 7511. [Google Scholar] [CrossRef] [PubMed]
- Dobson, R.; Semple, S. “How do you know those particles are from cigarettes?”: An algorithm to help differentiate second-hand tobacco smoke from background sources of household fine particulate matter. Environ. Res. 2018, 166, 344–347. [Google Scholar] [CrossRef]
- World Health Organization (WHO). WHO Global Air Quality Guidelines. Particulate Matter (PM2.5 and PM10), Ozone, Nitrogen Dioxide, Sulfur Dioxide and Carbon Monoxide. Geneva: 2021. Available online: https://www.who.int/publications (accessed on 8 February 2022).
- Barnoya, J.; Monzon, J.C.; Briz, P.; Navas-Acien, A. Compliance to the smoke-free law in Guatemala 5-years after implementation. BMC Public Health 2016, 16, 318. [Google Scholar] [CrossRef] [PubMed]
- Apsley, A.; Semple, S. Secondhand smoke levels in Scottish bars 5 years on from the introduction of smoke-free legislation. Tob. Control 2012, 21, 511–513. [Google Scholar] [CrossRef] [PubMed]
- Semple, S.; Creely, K.S.; Naji, A.; Miller, B.G.; Ayres, J.G. Secondhand smoke levels in Scottish pubs: The effect of smoke-free legislation. Tob. Control 2007, 16, 127–132. [Google Scholar] [CrossRef] [PubMed]
- World Health Organization (WHO). WHO Frame Work Convention on Tobacco Control WHO Document Production Services; World Health Organization (WHO): Geneva, Switzerland, 2005. [Google Scholar]
- Federal Democratic Republic of Ethiopia. Food and Medicine Administration Proclamation No. 1112/2019 [Internet]. 2019. Available online: https://www.tobaccocontrollaws.org/files/live/Ethiopia (accessed on 17 June 2023).
- Bakhturidze, G.; Peikrishvili, N.; Gvinianidze, K. Impact of comprehensive smoke-free policy compliance on SHS exposure and health condition of the Georgian population. Tob. Prev. Cessat. 2021, 7, 70. [Google Scholar] [CrossRef]
- Singh, A.; Dobbie, F.; Kinnunen, T.; Okello, G.; Semple, S.; Boakye Okyere, P.; Logo, D.D.; Lartey, K.F.; McNeil, A.; Britton, J.; et al. Adherence to smoke-free policies in Ghana: Findings from a cross-sectional survey of hospitality venue owners and staff. Tob. Prev. Cessat. 2021, 7, 4. [Google Scholar] [CrossRef]
- Karimi, K.J.; Ayah, R.; Olewe, T. Adherence to the Tobacco Control Act, 2007: Presence of a workplace policy on tobacco use in bars and restaurants in Nairobi, Kenya. BMJ Open 2016, 6, e012526. [Google Scholar] [CrossRef] [PubMed]
- Global Adult Tobacco Survey (GATS). Executive Summary 2016. Available online: http://www.fmhaca.gov.et/wp-content/uploads/2019/03/Ethiopia_GATS_FactSheet_Aug_2017.pdf (accessed on 8 April 2021).
- Semple, S.; Ibrahim, A.E.; Apsley, A.; Steiner, M.; Turner, S. Using a new, low-cost air quality sensor to quantify second-hand smoke (SHS) levels in homes. Tob. Control 2013, 24, 153–158. [Google Scholar] [CrossRef] [PubMed]
- Berhe, A.E.D.; Hassen, I.; Mamaru, T.; Soressa, Y. City Profile: Addis Ababa. 2017. Available online: http://moodle.donau-uni.ac.at/ses/ (accessed on 25 July 2024).
- Gravely, S.; Nyamurungi, K.N.; Kabwama, S.N.; Okello, G.; Robertson, L.; Heng, K.K.C.; Ndikum, A.E.; Oginni, A.S.; Rusatira, J.C.; Kakoulides, S.; et al. Knowledge, opinions and compliance related to the 100% smoke-free law in hospitality venues in Kampala, Uganda: Cross-sectional results from the KOMPLY Project. BMJ Open 2018, 8, e017601. [Google Scholar] [CrossRef] [PubMed]
- Angela, J.-M.; Sean, S.; Ruaraidh, D. Air Quality Monitoring Toolkit: Assessing Second-Hand Smoke in Hospitality Venues 2014. Available online: https://theunion.org/sites/default/files/2020-08/pubtc_ToolkitforAirQualityMonitoring.pdf (accessed on 15 May 2022).
- Birckmayer, J.; Feighery, E.; Carmona, M.; Friend, K.; Apelberg, B.; Hepp, L.; Avila-Tang, E.; Selin, H. Assessing Compliance with Smoke-Free Laws. A “How-to” Guide for Conducting Compliance Studies: Tobacco Free Kids, Johns Hopkins Bloomberg School of Public Health, and the International Union Against Tuberculosis and Lung Disease (The Union). 2014. Available online: https://theunion.org/sites/default/files/2020-08/compliance-guide_v4smallerfile.pdf (accessed on 6 August 2022).
- Chowdhury, S.R.; Sunna, T.C.; Das, D.C.; Chowdhury, M.R.; Mahmud, H.M.M.; Hossain, A. Compliance with smoke-free legislation in public places: An observational study in a northeast city of Bangladesh. PLoS ONE 2023, 18, e0283650. [Google Scholar] [CrossRef] [PubMed]
- Navas-Acien, A.; Carkoglu, A.; Ergor, G.; Hayran, M.; Erguder, T.; Kaplan, B.; Susan, J.; Magid, H.; Pollak, J.; Cohen, J.E. Compliance with smoke-free legislation within public buildings: A cross-sectional study in Turkey. Bull. World Health Organ. 2016, 94, 92–102. [Google Scholar] [CrossRef] [PubMed]
- Von Elm, E.; Altman, D.G.; Egger, M.; Pocock, S.J.; Gotzsche, P.C.; Vandenbroucke, J.P. The Strengthening the Reporting of Observational Studies in Epidemiology (STROBE) Statement: Guidelines for reporting observational studies. BMJ 2007, 335, 806–808. [Google Scholar] [CrossRef] [PubMed] [PubMed Central]
- Hoe, C.; Ahsan, H.; Ning, X.; Wang, X.; Li, D.; Wright, K.; Kennedy, R.D. Enforcement agencies and smoke-free policy compliance: An observational study in Qingdao, China. Tob. Induc. Dis. 2021, 19, 26. [Google Scholar] [CrossRef] [PubMed]
- Singh, A.; Okello, G.; Semple, S.; Dobbie, F.; Kinnunen, T.I.; Lartey, K.F.; Logo, D.D.; Bauld, L.; Ankrah, S.T.; McNeill, A.; et al. Exposure to secondhand smoke in hospitality settings in Ghana: Evidence of changes since implementation of smoke-free legislation. Tob. Induc. Dis. 2020, 18, 44. [Google Scholar] [CrossRef] [PubMed]
- Ethiopian Food and Drug Administration (EFDA). Tobacco Control Directive No. 771/2021; Ethiopian Food and Drug Administration (EFDA): Addis Ababa, Ethiopia, 2021.
- Shamo, F.; Wilson, T.; Kiley, J.; Repace, J. Assessing the effect of Michigan’s smoke-free law on air quality inside restaurants and casinos: A before-and-after observational study. BMJ Open 2015, 5, e007530. [Google Scholar] [CrossRef]
- Saleh, S.; Sambakunsi, H.; Makina, D.; Chinouya, M.; Kumwenda, M.; Chirombo, J.; Semple, S.; Mortimer, K.; Rylance, J. Personal exposures to fine particulate matter and carbon monoxide in relation to cooking activities in rural Malawi. Wellcome Open Res. 2022, 7, 251. [Google Scholar] [CrossRef]
- Tamire, M.; Kumie, A.; Addissie, A.; Ayalew, M.; Boman, J.; Skovbjerg, S.; Andersson, R.; Lärstad, M. High Levels of Fine Particulate Matter (PM2.5) Concentrations from Burning Solid Fuels in Rural Households of Butajira, Ethiopia. Int. J. Environ. Res. Public Health 2021, 18, 6942. [Google Scholar] [CrossRef] [PubMed]
- Nakora, N.; Byamugisha, D.; Birungi, G. Indoor air quality in rural Southwestern Uganda: Particulate matter, heavy metals and carbon monoxide in kitchens using charcoal fuel in Mbarara Municipality. SN Appl. Sci. 2020, 2, 2037. [Google Scholar] [CrossRef]
Disclaimer/Publisher’s Note: The statements, opinions and data contained in all publications are solely those of the individual author(s) and contributor(s) and not of MDPI and/or the editor(s). MDPI and/or the editor(s) disclaim responsibility for any injury to people or property resulting from any ideas, methods, instructions or products referred to in the content. |
© 2024 by the authors. Licensee MDPI, Basel, Switzerland. This article is an open access article distributed under the terms and conditions of the Creative Commons Attribution (CC BY) license (https://creativecommons.org/licenses/by/4.0/).