Article

Green Synthesis of Sodium Cyanide Using Hydrogen Cyanide Extracted under Vacuum from Cassava (Manihot esculenta Crantz) Leaves

1
Department of Chemistry, Durban University of Technology, 51-121 Steve Biko Rd, Musgrave, Berea 4001, South Africa
2
Department of Chemical Sciences, Auckland Park Kingsway Campus, University of Johannesburg, Auckland Park, Johannesburg 2006, South Africa
3
Council for Scientific and Industrial Research (CSIR), Meiring Naudé Road, Brummeria, Pretoria 0001, South Africa
*
Author to whom correspondence should be addressed.
Sustain. Chem. 2022, 3(3), 312-333; https://doi.org/10.3390/suschem3030020
Submission received: 4 May 2022 / Revised: 8 June 2022 / Accepted: 10 June 2022 / Published: 5 July 2022
(This article belongs to the Topic Green and Sustainable Chemistry)

Abstract

:
This study was carried out to develop a green approach to synthesising sodium cyanide (NaCN) using hydrogen cyanide (HCN) extracted from cassava (Manihot esculenta Crantz) leaves after 120 min of maceration at 30 °C and 45 min of recovery under vacuum at 35–40 °C. The CN- ion released via autolysis was reacted with the Na+ ion following vacuum extraction of the former to produce NaCN by saturating the absorbing sodium hydroxide (NaOH) solution. This specific extraction method avoided direct contact between the cassava leaves homogenate and the absorbing solution. NaCN was crystallised by drying the NaCN slurry at 100 °C in an air oven. A total of 15.70 kg of fresh cassava leaves was needed to produce 32.356 g of NaCN (green-NaCN) (% NaCN yield = 0.21%). The results of X-ray diffraction, attenuated total reflectance–Fourier transform infrared spectroscopy and scanning electron microscopy with energy-dispersive X-ray spectroscopy, show that NaCN was successfully prepared using the proposed method. These spectral techniques showed that the control and green-NaCN contained sodium carbonate impurities. The latter was quantified by the titration experiments and was found to be 0.61% and 2.29% in the control and green-NaCN, respectively. Furthermore, the titration experiments revealed that the residual NaOH content was 1.63% in control NaCN and 4.68% in green-NaCN. The aim of modifying the green synthesis route for producing NaCN from cassava, developed by the Attahdaniel research group in 2013 and 2020, was achieved.

1. Introduction

Sodium cyanide (NaCN) is a hygroscopic white crystalline or granular powder that releases a very toxic gas (hydrogen cyanide, HCN) when contacted with acids [1]. Industrially, NaCN was first produced by the Castner process, which is based on the reaction between sodium metal, charcoal and ammonia [1,2], as shown in Scheme 1:
Currently, it is manufactured exclusively by the neutralisation or wet process. This process involves the reaction of sodium hydroxide (NaOH) and liquid or gaseous HCN, as shown in Scheme 2 [1,2]:
Hydrogen cyanide (hydrocyanic acid or prussic acid), a clear poisonous liquid or gas, can be directly or indirectly prepared. It was first prepared in solution by Scheele in 1782 [3]. HCN can be produced when enough energy is supplied to any system containing carbon, hydrogen and nitrogen [3] using one of the following processes:

1.1. Direct Synthesis of HCN

1.1.1. Andrussow Process

According to Scheme 3, this widely used method, created around 1930, involves the reaction between methane, ammonia and air over platinum metals used as catalysts [1,3].

1.1.2. Methane–Ammonia Process or Blausaure Methane Anlage (BMA)

HCN is prepared by reacting methane and ammonia in the absence of oxygen [1,3], as shown in Scheme 4.

1.1.3. Shawinigan Process

This HCN production method, developed in 1960, is also called the Fluohmic process. HCN is prepared by reacting hydrocarbon gases (mainly propane) with ammonia in an electrically heated fluidised bed of coke and in the absence of catalysts [1,3], as shown in Scheme 5.

1.2. Indirect Synthesis of HCN

Sohio Process

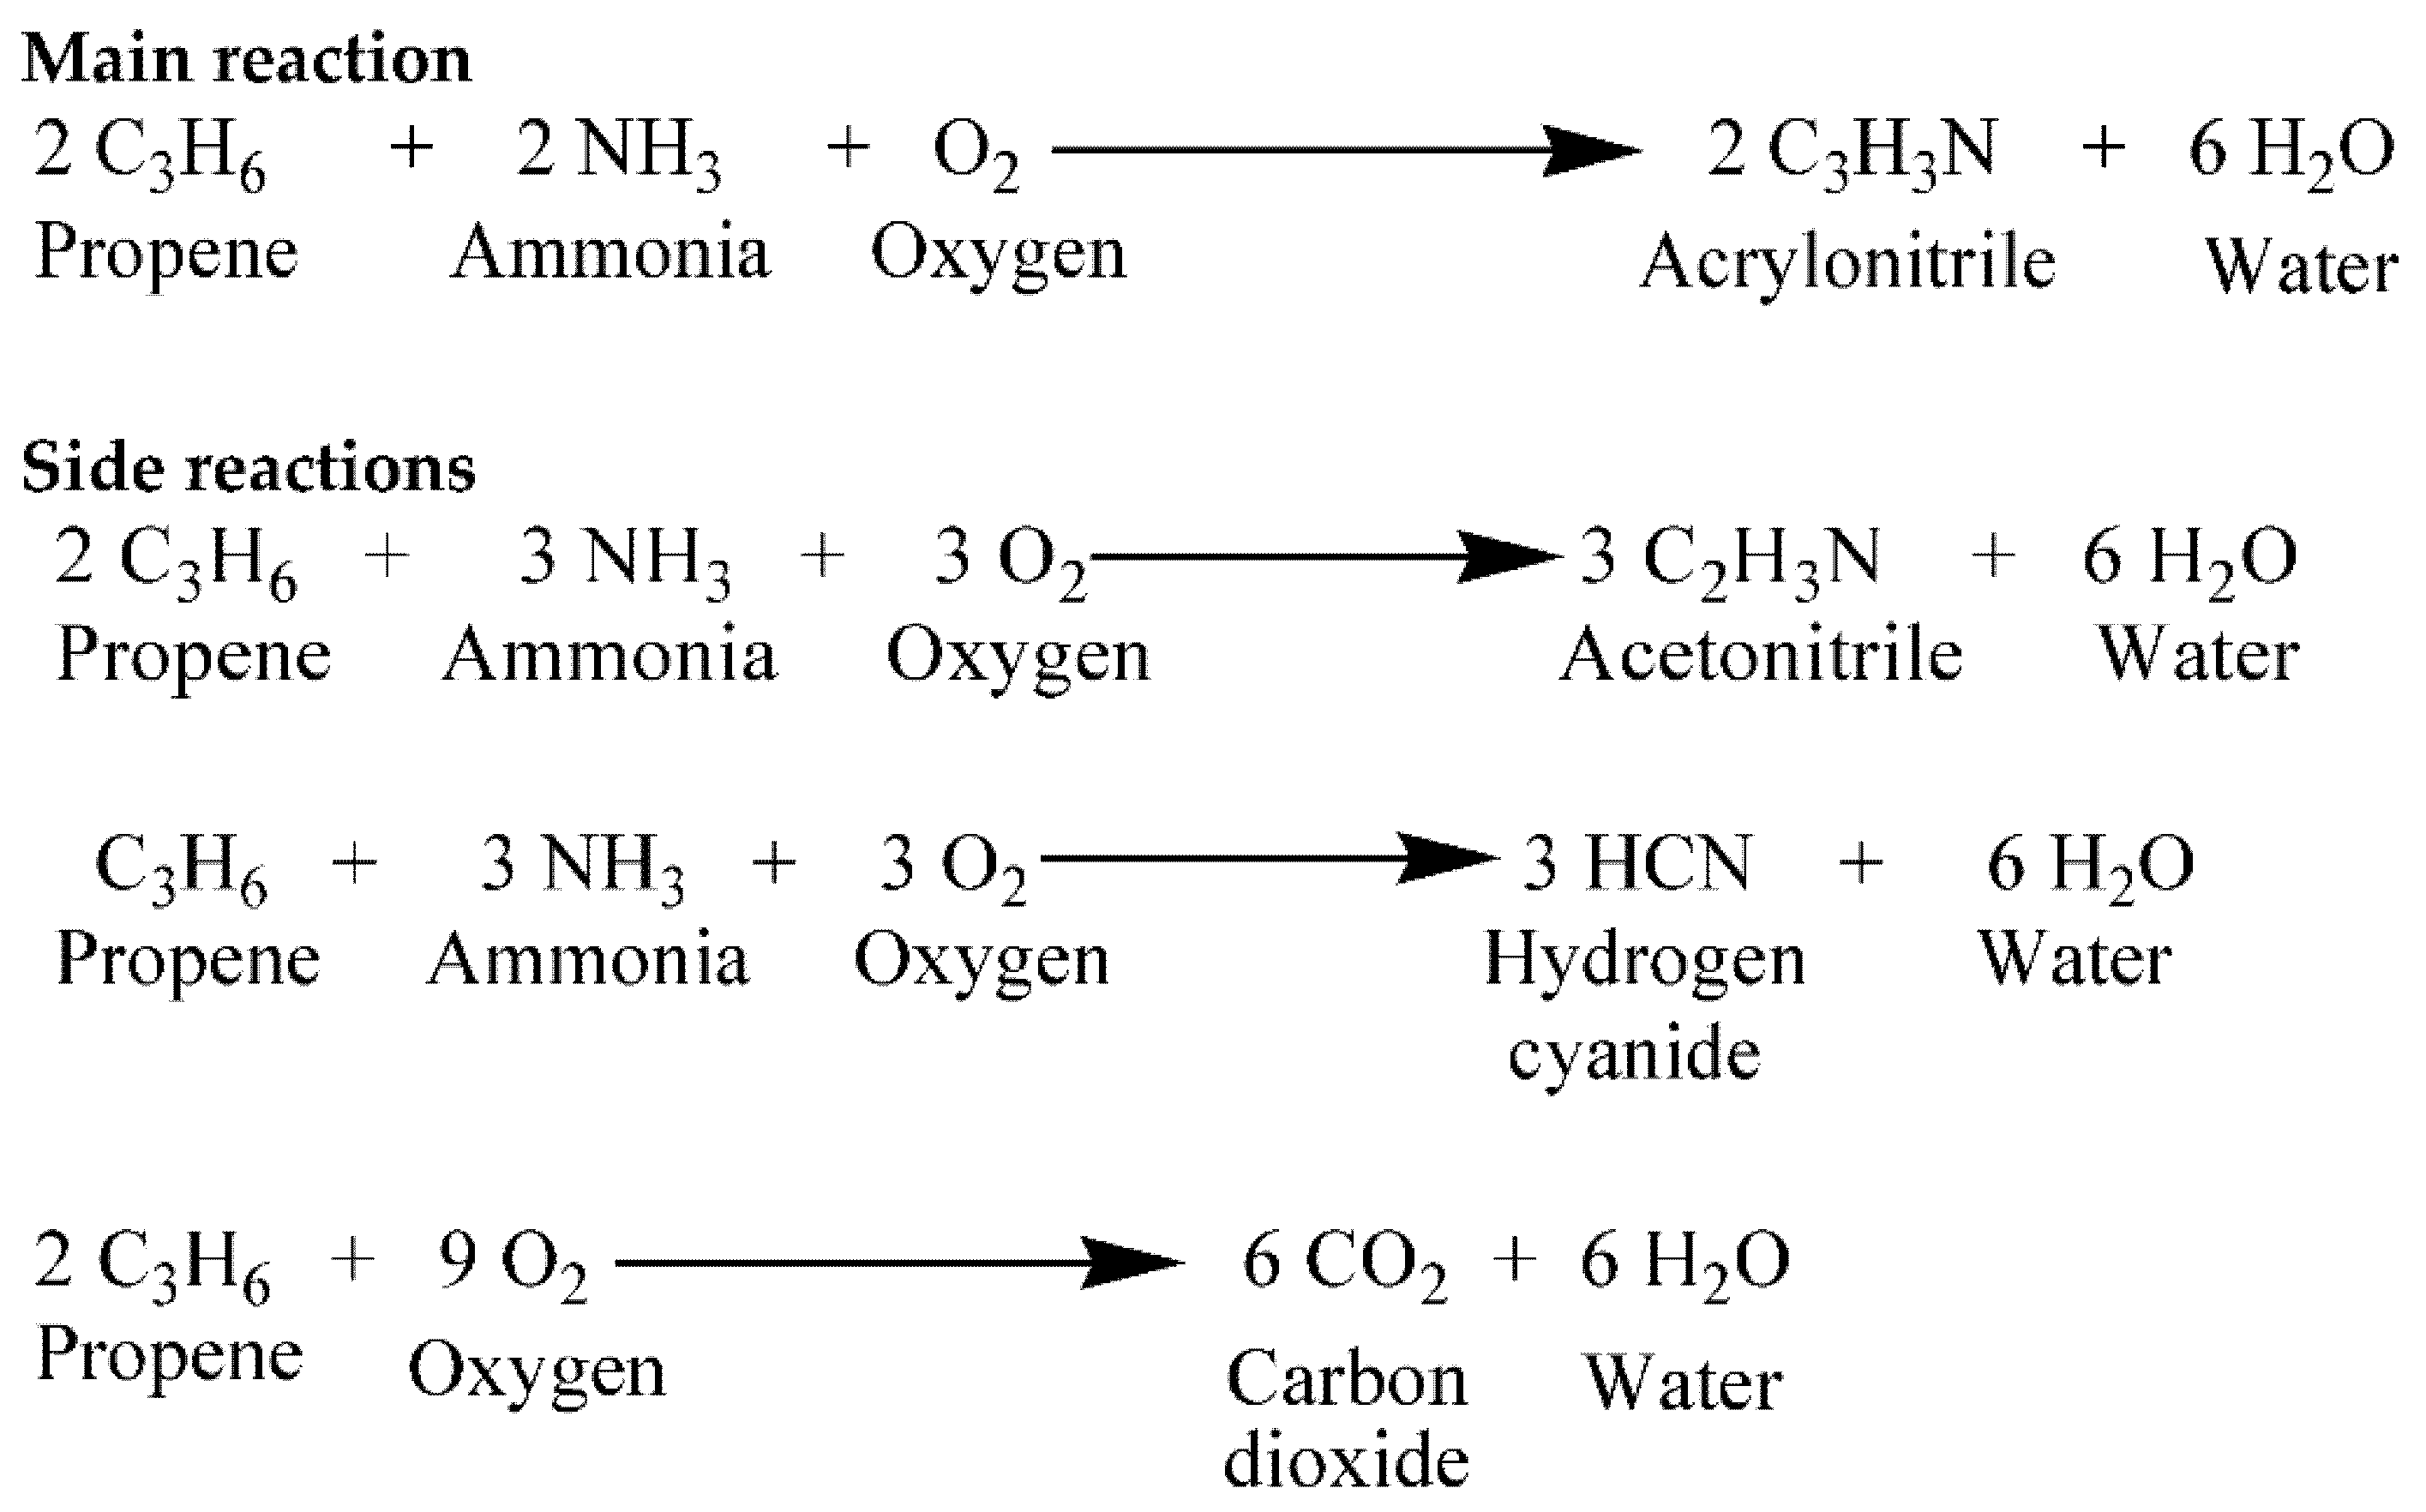
HCN is produced as a by-product of the manufacturing of acrylonitrile during the reaction of propene and ammonia [1,4] according to Scheme 6.
From environmental management and sustainable perspectives, it is crucial to find alternative routes for the production of HCN to reduce the global energy and environmental problems associated with the use of hydrocarbons.
For this reason, since HCN is also known to naturally occur [3], further research was conducted by [2] and [5] to develop a green way to produce NaCN from cassava. The significant difference between these two studies is the method used to release HCN from cassava. In the study done by [2], HCN was released by the acid hydrolysis method, while the direct hydrolysis method was used in the study done by [5]. In both studies, the cassava extract was directly contacted with a 3.6 mol/L NaOH absorbing solution to form NaCN.
HCN is naturally produced by several organisms, such as bacteria, algae, fungi, plants [6,7], and some animals [6,8]. These organisms release HCN through the cyanogenic process as a defensive and offensive mechanism [7]. Plants are the primary natural source of HCN, with more than 2000 species producing it as cyanogenic glycosides (CNGs) [9,10].
Cassava, a staple food for more than half a billion people [5,11,12], is such a plant [13]. Cassava (Manihot esculenta Crantz), also called manioc or yuca [14], originated from Latin America. Although Portuguese merchants introduced it into western Africa in the 16th century [15,16], it became a staple food that was widely cultivated across the African continent in the middle of the 19th century [16]. Cassava was introduced in South Africa (SA) in the 1830s and 1860s during the Tsonga tribe’s migrations. The Tsonga tribes adopted cassava as a food crop following its introduction into Mozambique by the Portuguese in the 17th century. Their migration routes took them westwards into Mpumalanga province (old Eastern Transvaal) and Swaziland, southwards into the North of KwaZulu-Natal province [17,18,19].
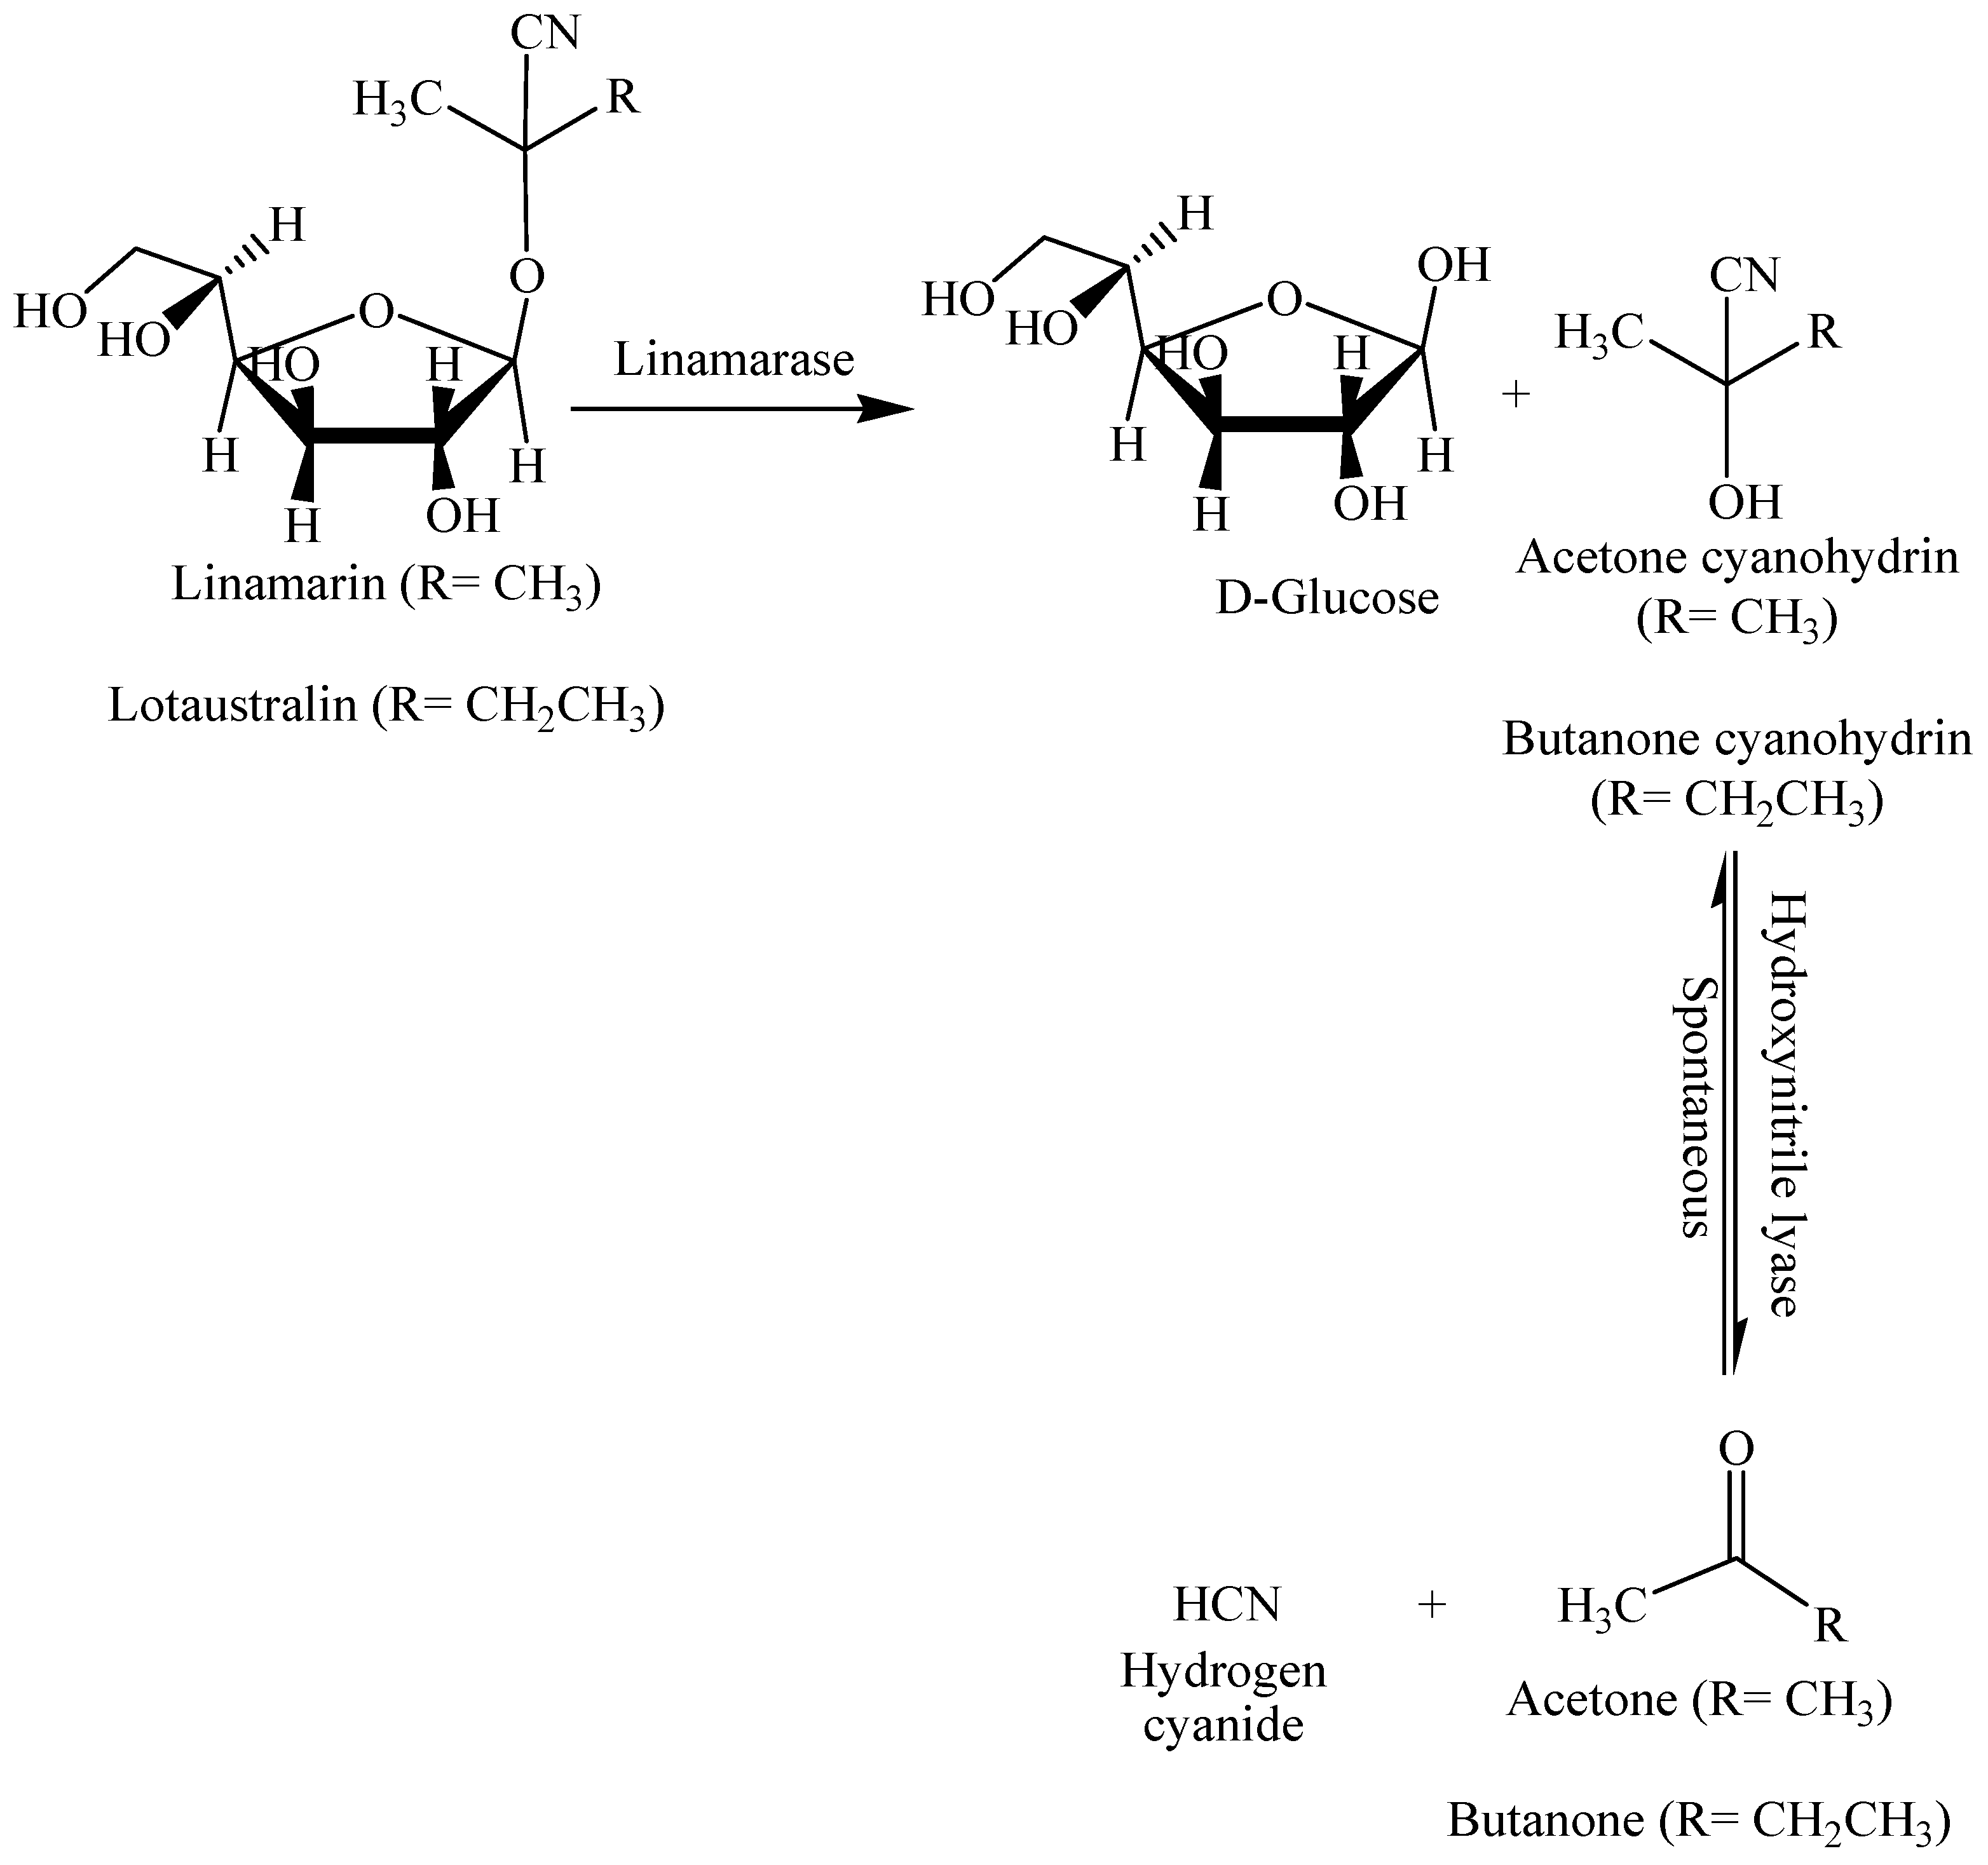
The two CNGs found in cassava, linamarin (93%) and lotaustralin (7%) [20,21], are called cyanogenic glucosides, since the cyano group is attached to a glucose molecule (Figure 1).
HCN is produced following the release of hydrolytic enzymes during either the maceration of plant tissues or ingestion by the gut microflora [13], according to the reaction shown in Scheme 7:
This study extracted the HCN released from cassava leaves under vacuum at 35–40 °C, and then trapped it in a 3.6 mol/L NaOH absorbing solution to prepare NaCN. This extraction method was chosen as a competitive method to the ones used by [2] and [5] to prepare NaCN salt. The method developed in this study allowed the preparation of NaCN salt (green-NaCN) devoid of any plant contaminants arising from the direct contact between the plant homogenate and the absorbing solution.

2. Materials and Methods

2.1. Materials

2.1.1. Sample Collection

Fresh cassava leaves were purchased in Johannesburg, South Africa.

2.1.2. Chemicals

Chemicals used: 37% hydrochloric acid (HCl), 95% sodium cyanide * (NaCN, Product No 205222/Sigma-Aldrich, Johannesburg, South Africa), 99.5% sodium carbonate (Na2CO3, Product No 222321/Sigma-Aldrich, Johannesburg, South Africa), moist picric acid **, sodium hydroxide (NaOH), 95% sulphuric acid (H2SO4), Milli-Q water, phenolphthalein and methyl orange indicators.
Caution:
* Sodium cyanide and all other cyanides are deadly poisons, and extreme care must be taken in their use.
** Moist picric acid (2,4,6-Trinitrophenol) is dangerously explosive if it is allowed to dry out.

2.2. Methods

2.2.1. Optimisation of Maceration Time and Temperature and HCN Recovery Time

The cassava leaves samples (80 g of washed leaves grounded in 200 mL of cold Milli-Q water for 3 min) were macerated at different times (60, 120, 180 and 240 min) and temperatures (18 °C or room temperature, 30 °C and 37 °C) to determine the optimum conditions for autolysis to give the maximum amount of HCN. The optimal time for the HCN recovery under vacuum at 35–40 °C was also investigated after 30, 45 and 60 min of extraction.
The quantity of cassava leaves and Milli-Q water, given above, was tripled during the optimisation of the maceration temperature and quadrupled to optimise the other two parameters. The prepared homogenate was evenly divided into three or four portions before being subjected to the respective optimisation experiment. The four portions used to optimise the maceration time were macerated at 30 °C, while the ones used to optimise the % recovery of the released HCN were macerated at 30 °C for 120 min. Of the four homogenates prepared for the HCN recovery study, three were subjected to the optimisation process, and the fourth flask was used to determine the initial concentration. The three portions used to optimise the maceration temperature were macerated for 120 min. The liberated HCN was collected in 25 mL of a 3.6 mol/L solution. All optimisation experiments were done in quadruplicate.
The percentage (%) recovery of the released HCN was calculated as follows:
%   H C N   r e c o v e r e d = F i n a l   A v e r a g e   H C N   c o n c e n t r a t i o n I n i t i a l   H C N   c o n c e n t r a t i o n × 100 %

2.2.2. Sample Preparation

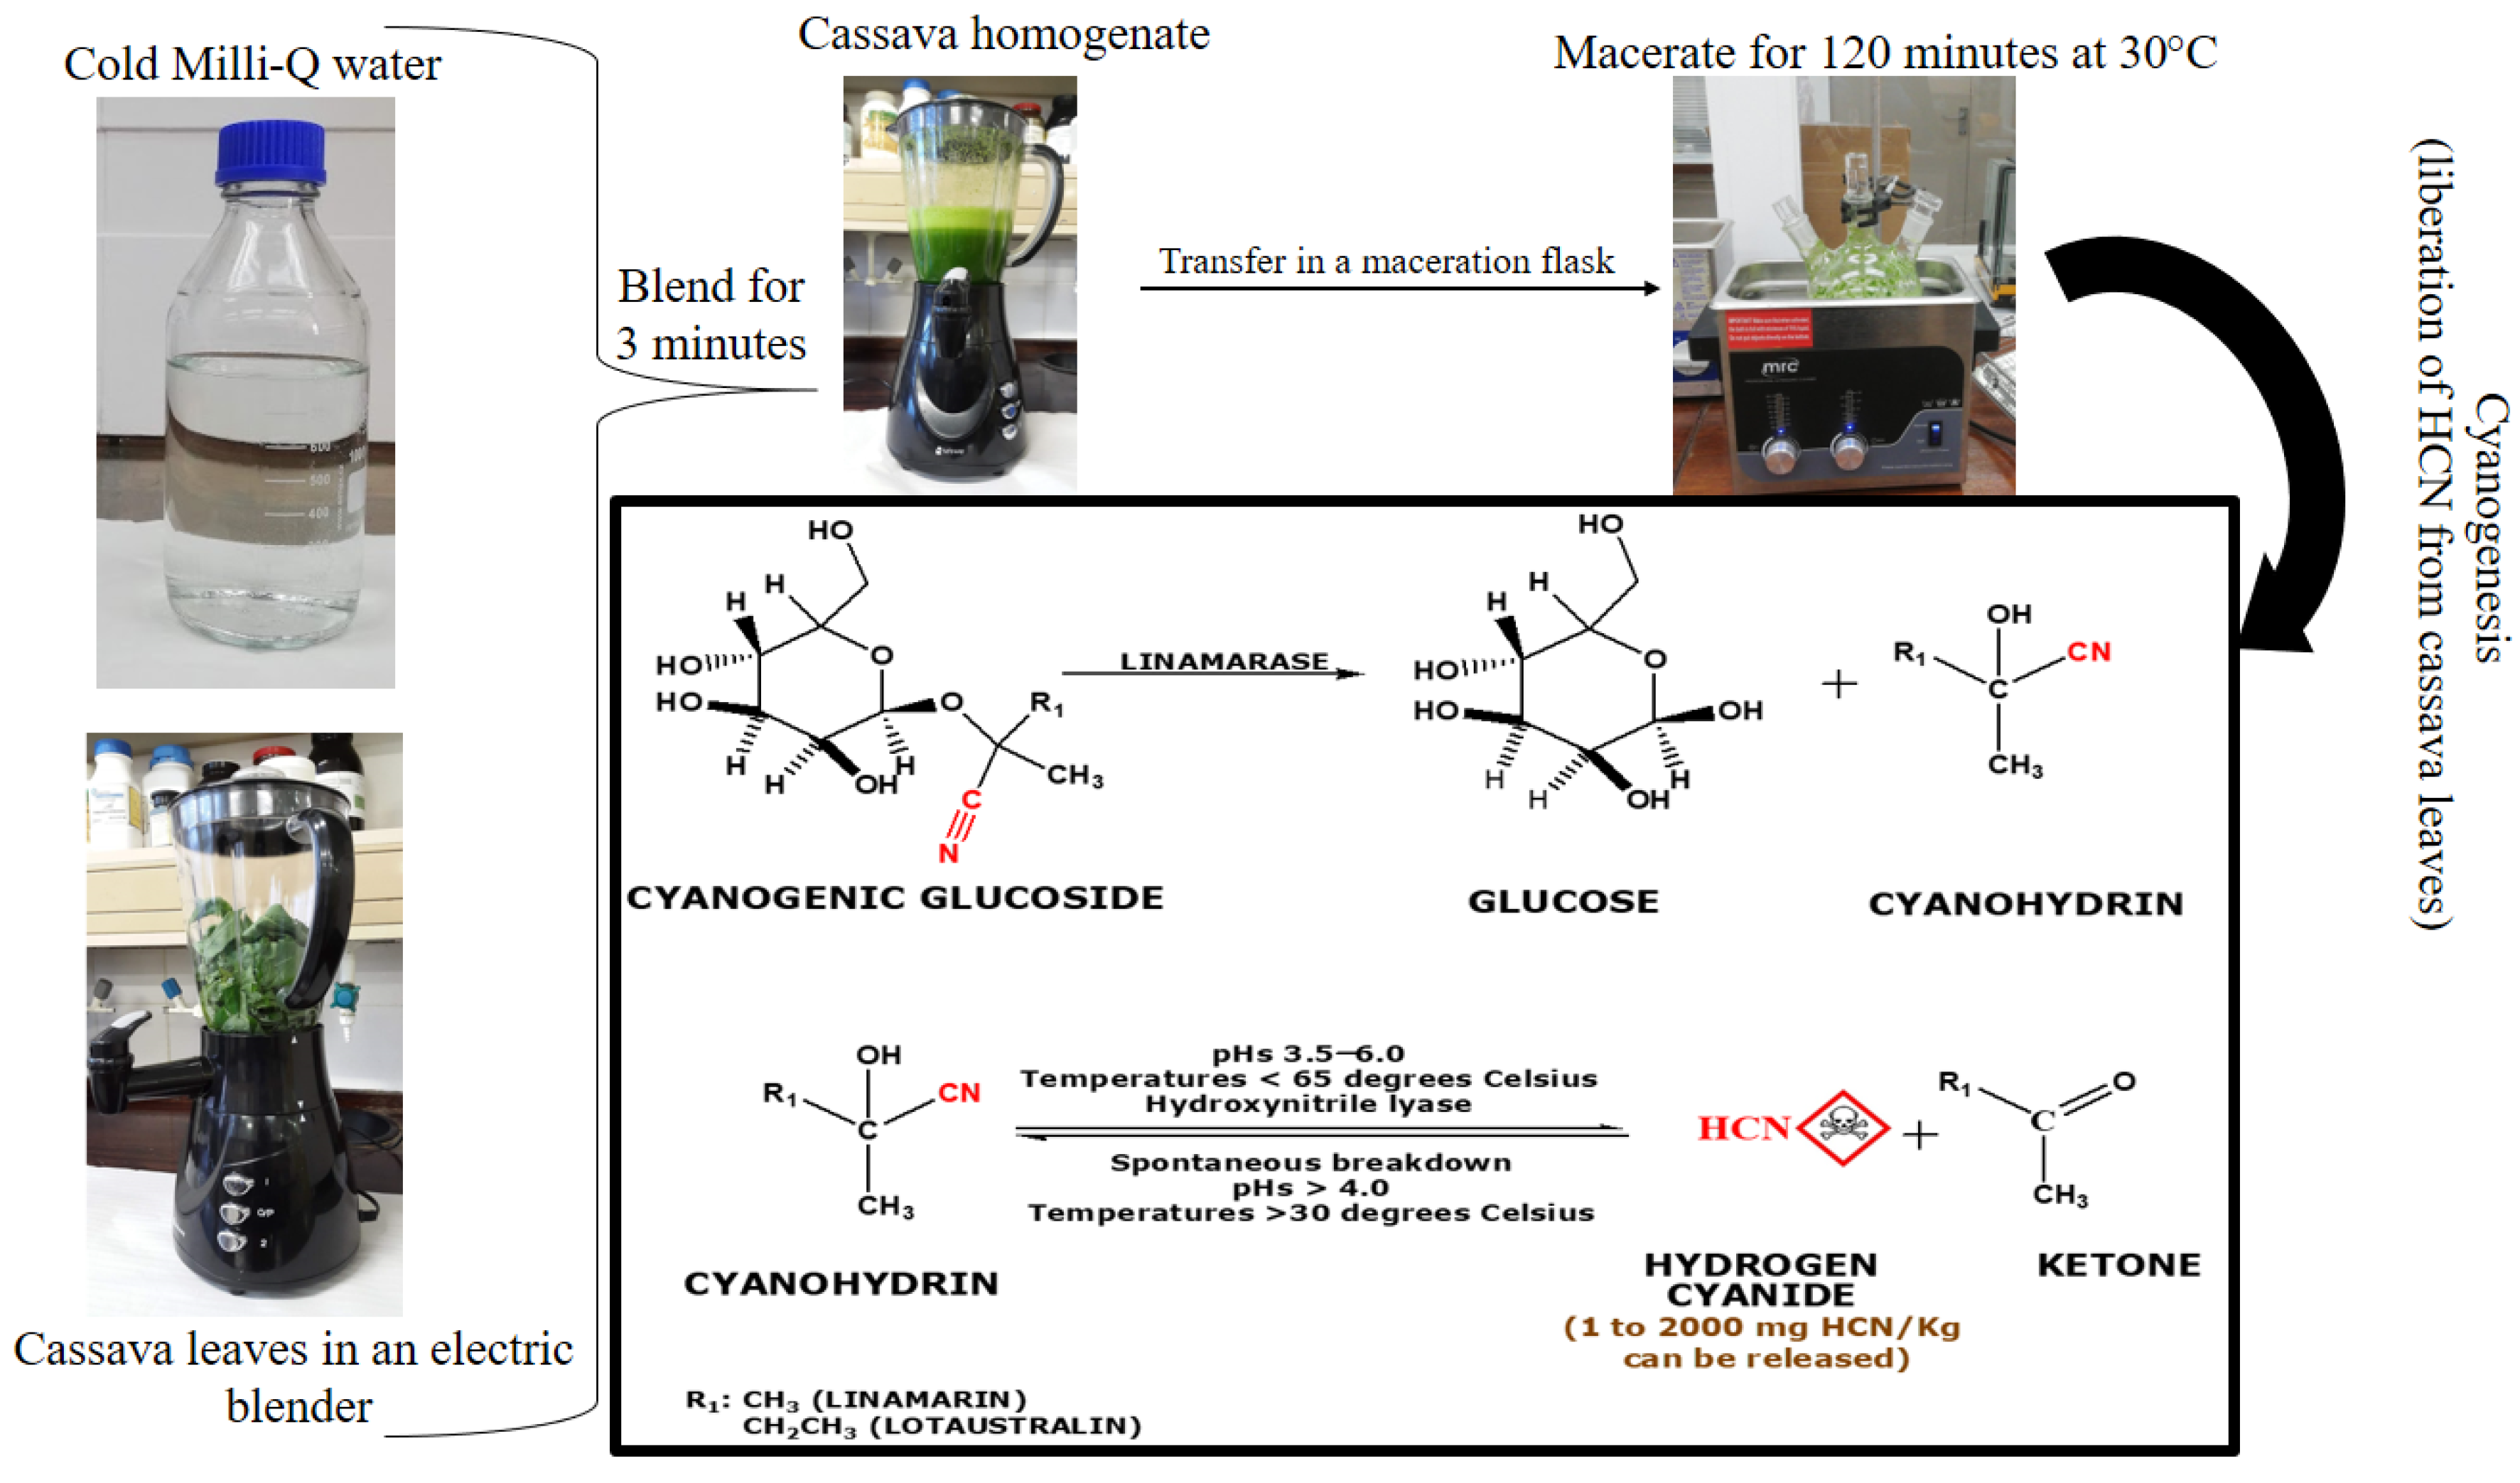
The sample preparation process is illustrated in Figure 2. A total of 250 g of washed cassava leaves were ground in a blender for 3 min in 1000 mL of cold Milli-Q water. Cold water was used to avoid the loss of the HCN gas released from the cassava leaves. The homogenate was immediately transferred to a stoppered distillation flask and macerated under optimum conditions.

2.2.3. Saturation of 3.6 mol/L NaOH Solution

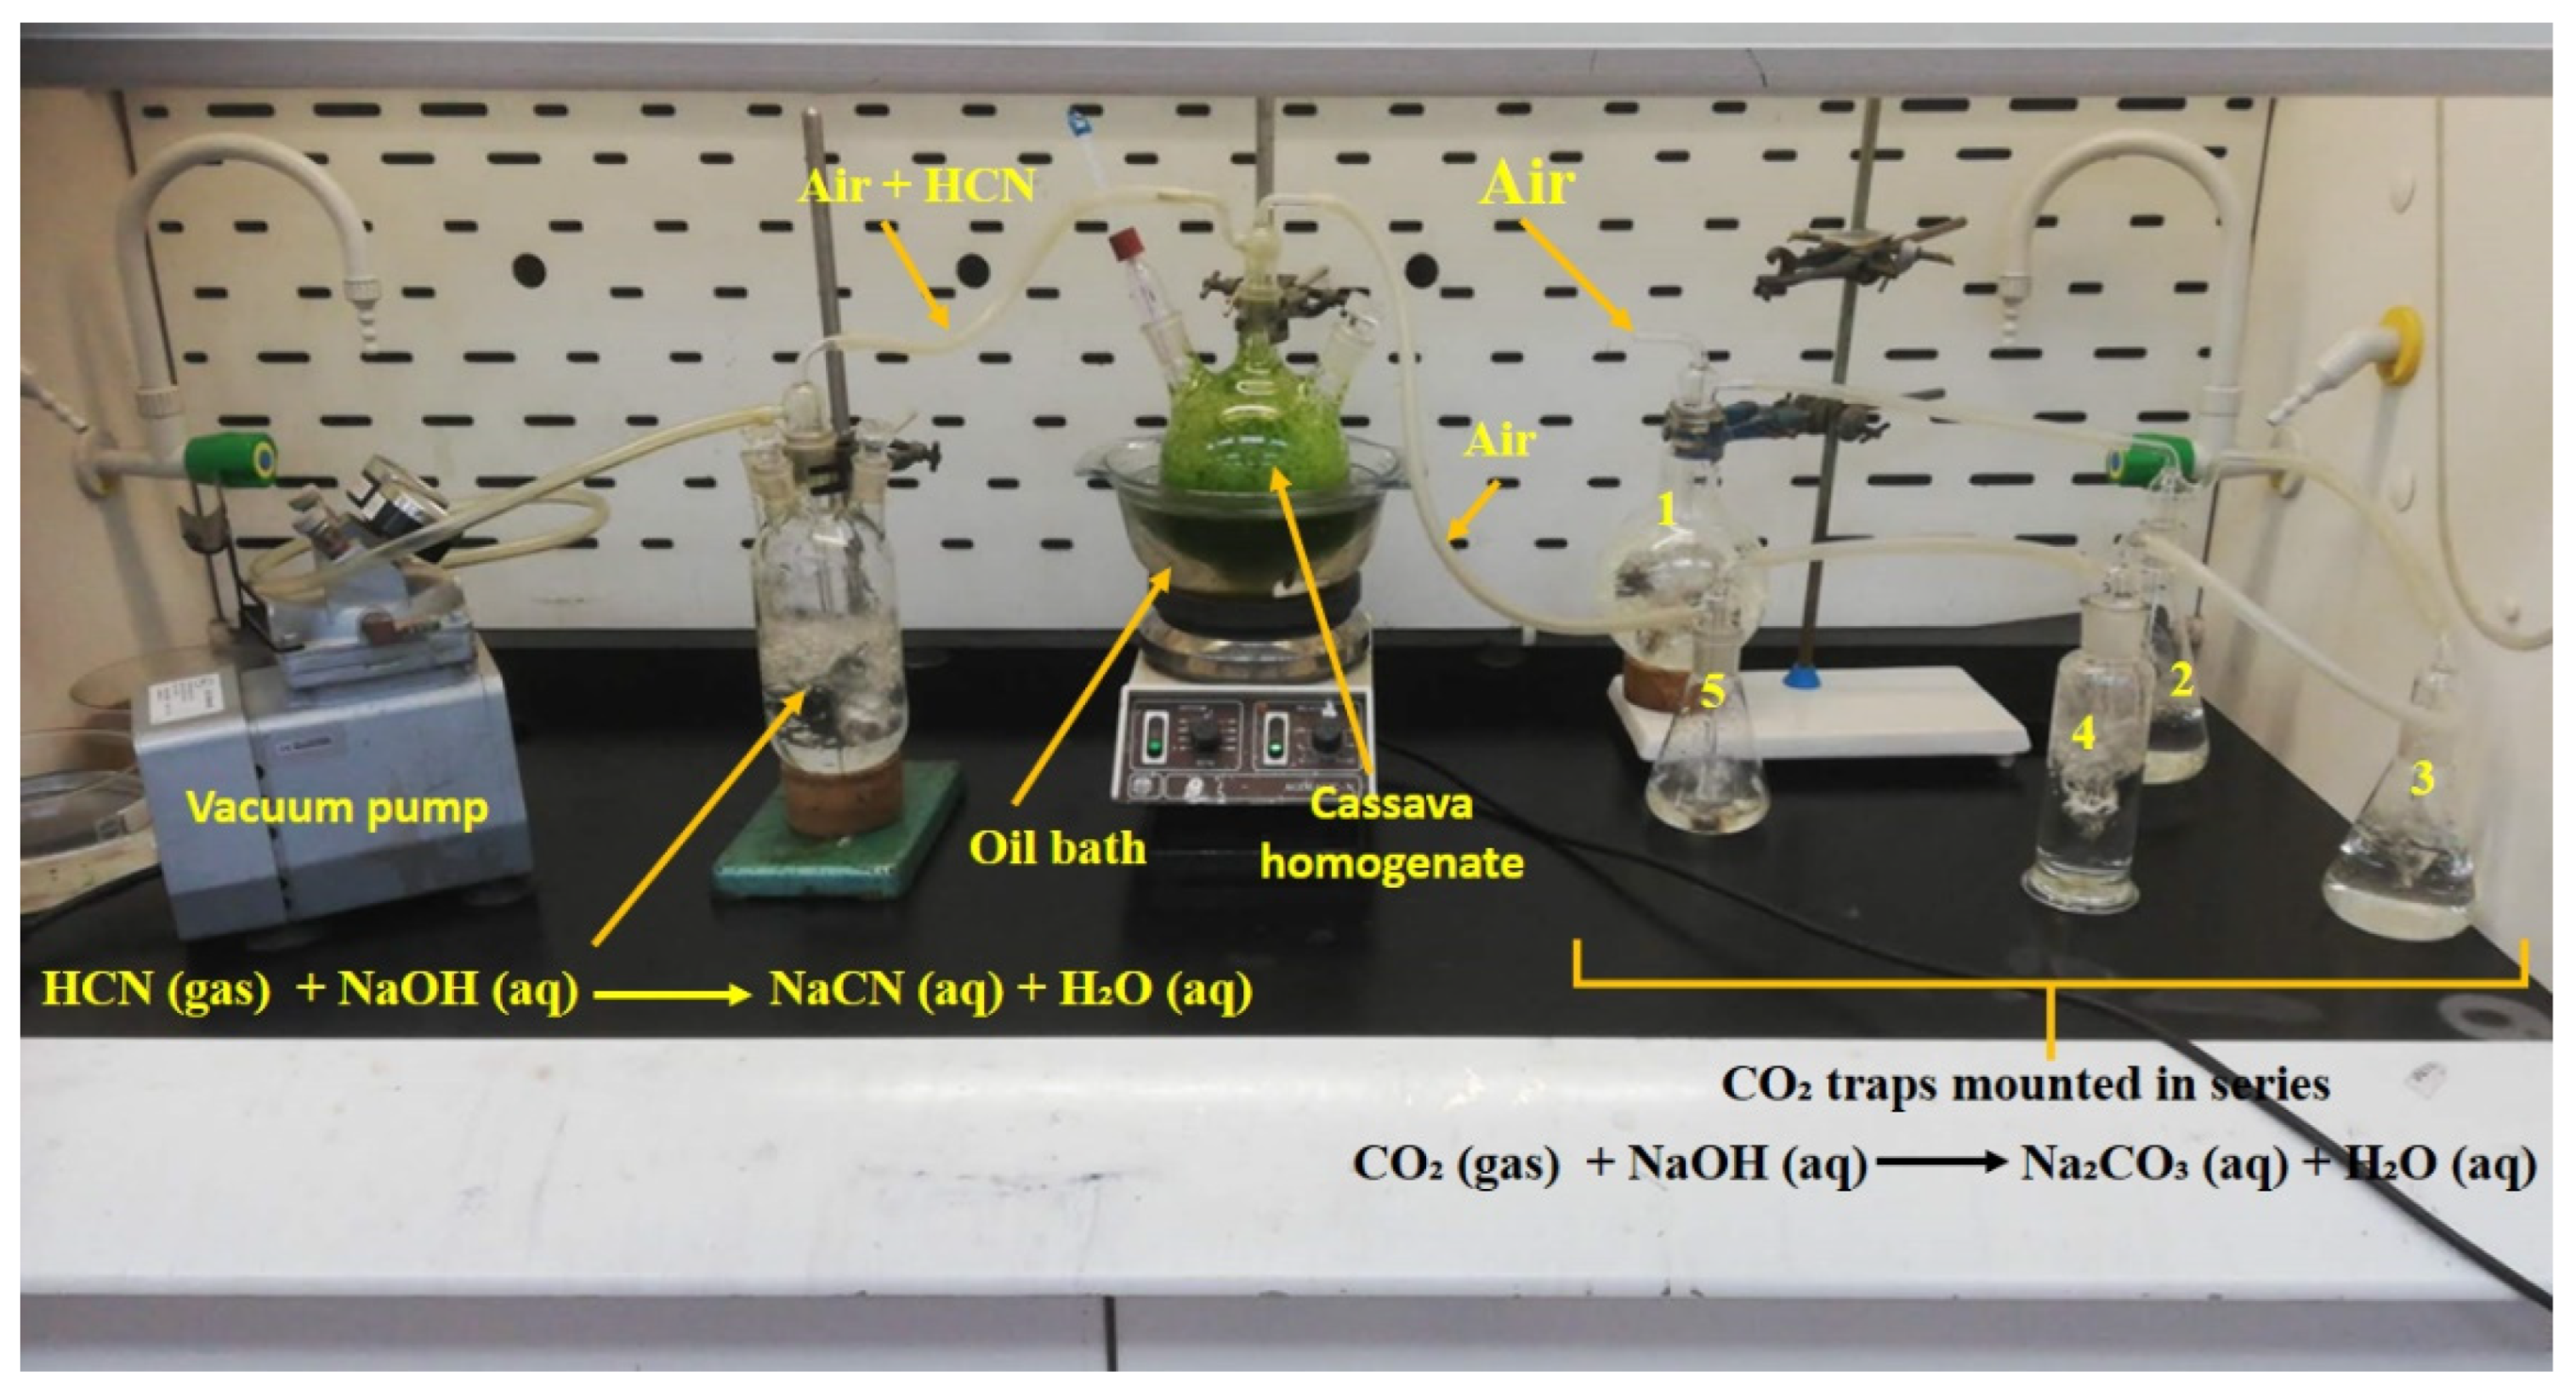
This process was achieved by connecting the flask containing the homogenate to a gas-tight system, as shown in Figure 3. The released HCN was recovered at 35–40 °C under a vacuum using optimum extraction conditions. Atmospheric air was used to agitate the homogenate and carry the liberated HCN into 250 mL of 3.6740 mol/L NaOH solution to form NaCN. Before reaching the homogenate flask, the air was passed through a carbon dioxide (CO2) remover system. The CO2 remover system consisted of five vessels mounted in series, containing 10 mol/L NaOH. The saturation of the 3.6 mol/L NaOH absorbing solution was done until the plateauing of the NaCN concentration occurred. The minimal change in the NaCN concentration caused the plateau formation observed during the saturation process.

2.2.4. Quantification of NaCN Solution

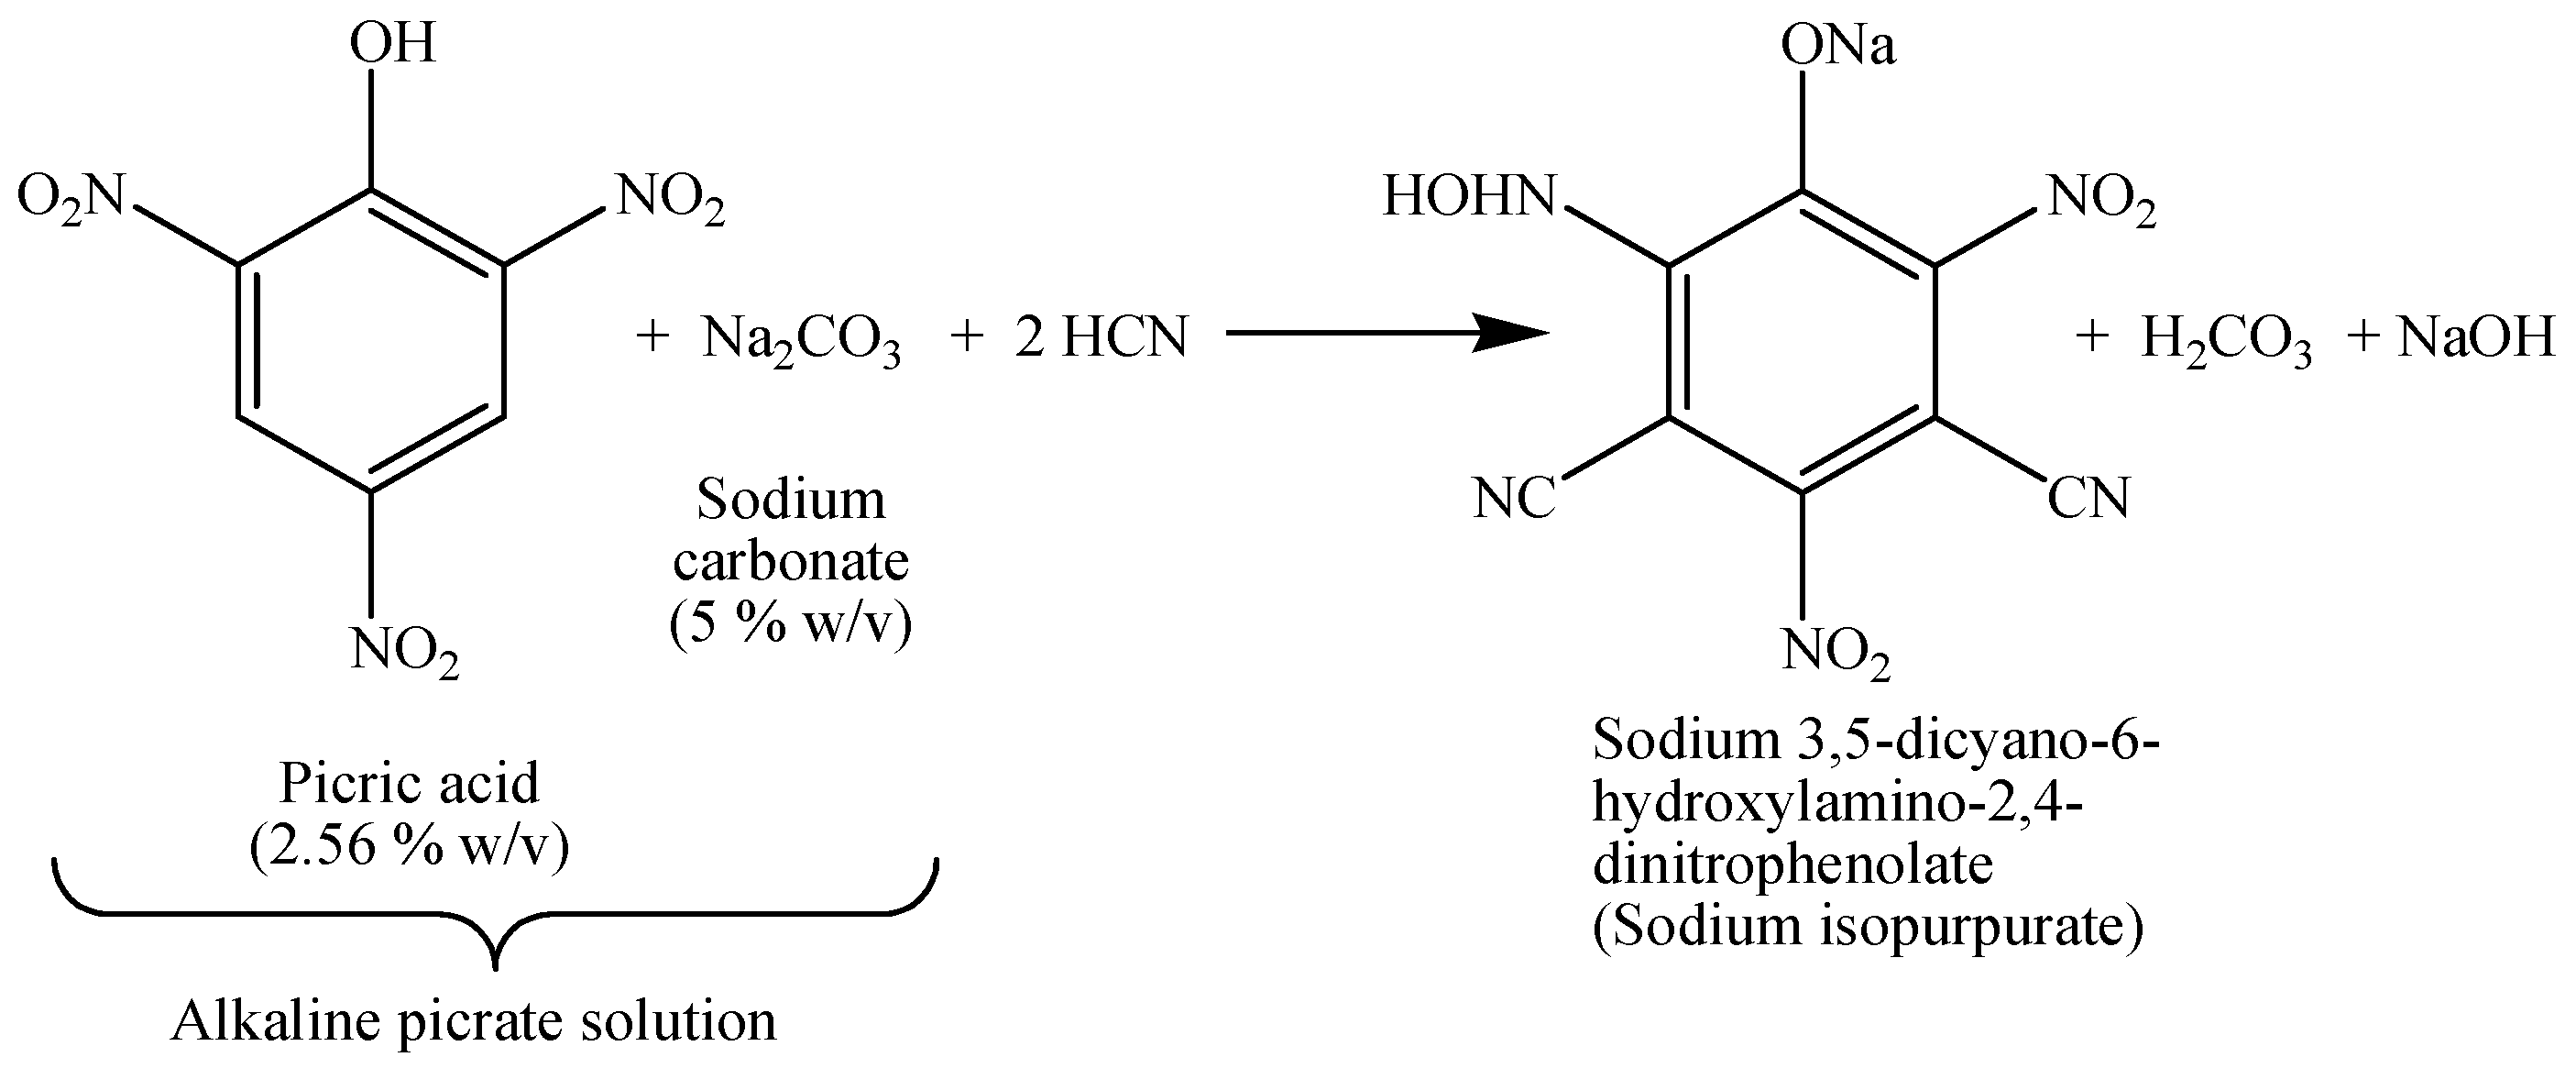
The alkaline picrate method, used to determine the concentrations of NaCN, is based on the reaction between the cyanide and alkaline picrate solution (prepared by mixing equal volumes of 2.56% picric acid and 5% sodium carbonate) [22], as shown in Scheme 8:
The cyanide concentration in the samples was determined after appropriate dilution. The absorbance of the HCN standard solutions, ranging from 0.5 to 10 µg HCN/mL, prepared with 0.01 mol/L sulphuric acid (H2SO4), was measured on a Shimadzu UV-1800 UV/Visible spectrometer at 485 nm. The results were used to draw the calibration curve, from which the cyanide content of the sample was extrapolated.
The sodium isopurpurate was formed by adding 2 mL of alkaline picrate solution to 2 mL of the standard and green-NaCN solutions. The resulting solutions were incubated for 15 min in a water bath set at 37 °C. A total of 15 µL of concentrated H2SO4 was added to the cold solutions to terminate the reaction and stabilise the readings before measurements were taken (Figure 4). The absorbances were measured against a blank containing only 0.01 mol/L H2SO4 and the alkaline picrate solution.
The concentration of the released HCN was calculated using the following equation:
H C N   m g k g = C × V m w
Where C is the concentration in mg/L (the same as µg/mL) from the curve, Vm (L) is the volume of Milli-Q water used to macerate the sample, and W (kg) is the weight of the sample used to prepare the homogenate.
The concentration of NaCN (mol/L) was determined from the HCN concentration and the molecular weights (g/mol) of NaCN and HCN using the equation shown below:
NaCN   ( mol / L ) = H C N   g L × ( M o l e c u l a r   w e i g h t   o f   N a C N / M o l e c u l a r   w e i g h t   o f   H C N ) M o l e c u l a r   w e i g h t   o f   N a C N

2.2.5. Determination of Sodium Carbonate and Residual Sodium Hydroxide in Standard and Green-Sodium Cyanide Solutions

Sodium carbonate (Na2CO3) and residual sodium hydroxide (NaOH) were determined using the indicator method against a standardised 0.1 mol/L HCl solution. The complete neutralisation of NaOH and the half neutralisation of Na2CO3 were detected with phenolphthalein, while the neutralisation of the bicarbonate was detected with methyl orange.

2.2.6. Drying of Green-Sodium Cyanide Solution

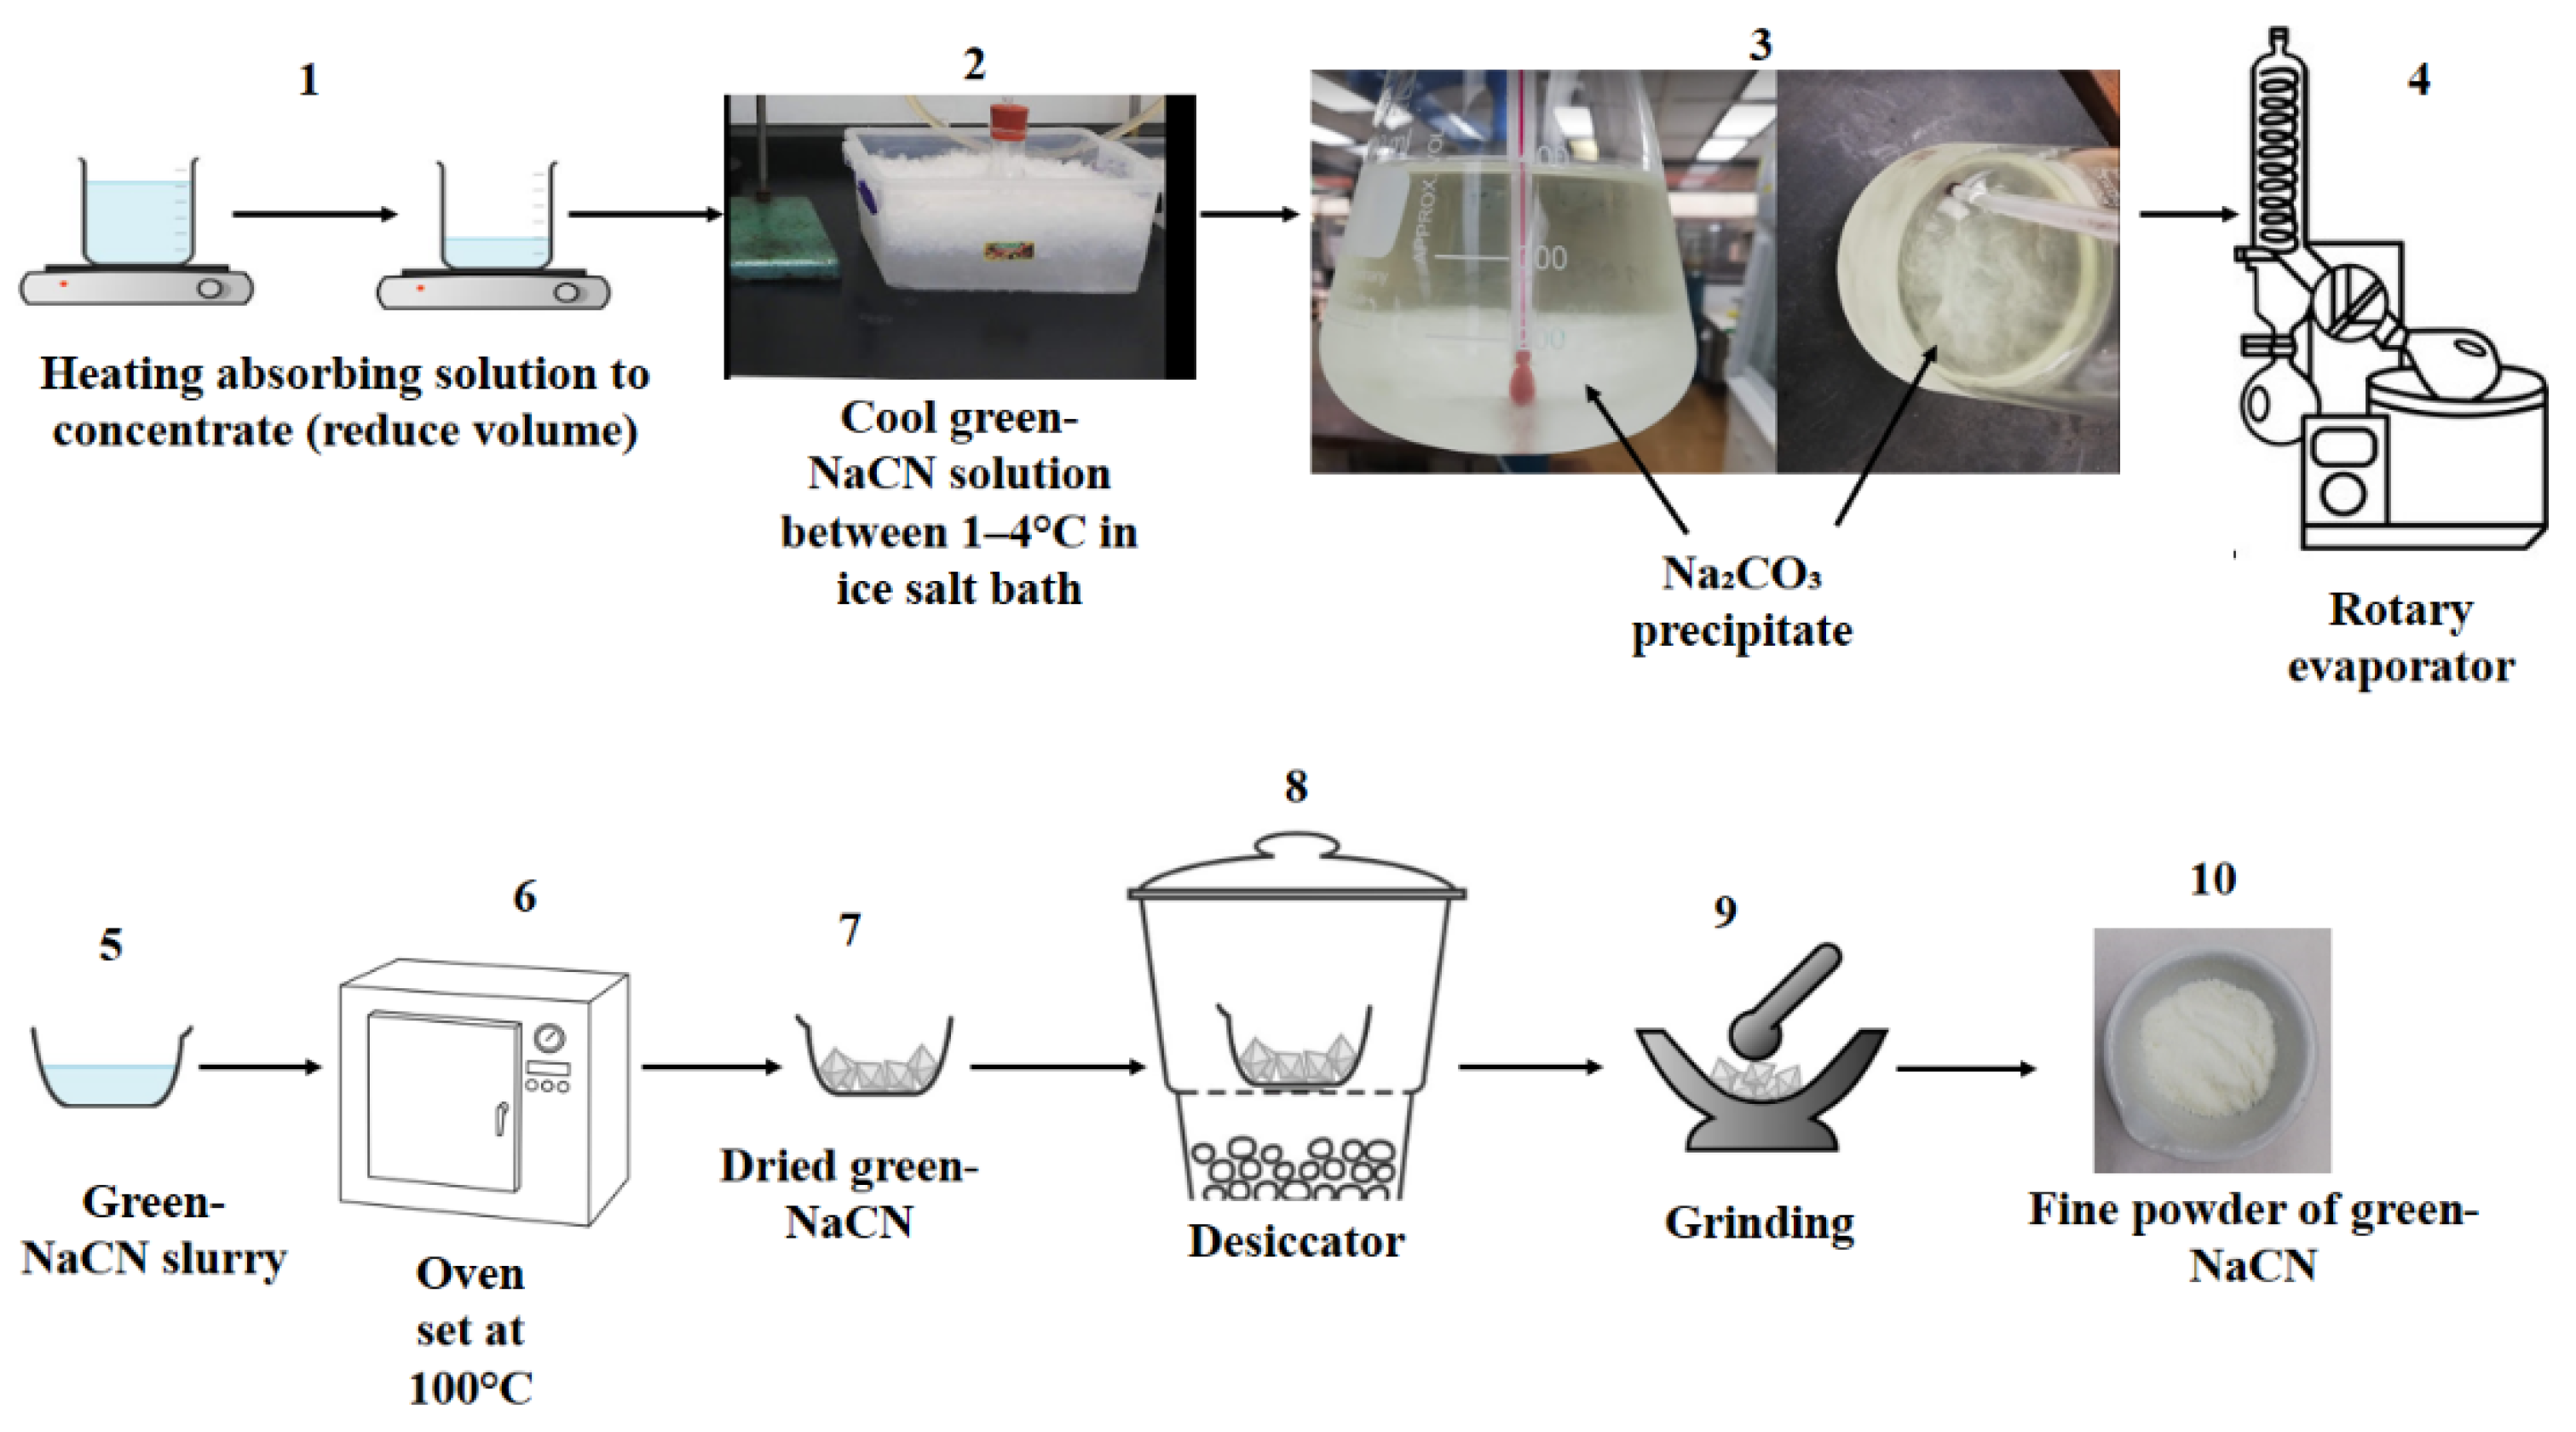
The drying process was achieved following the steps described in Figure 5. The Na2CO3 present in the concentrated green-NaCN solution, obtained in step 1, was removed by the freezing-out carbonates method [24]. The NaCN concentrate was cooled to a temperature close to zero (1–4 °C) to remove Na2CO3 as a precipitate. The supernatant was removed after decantation and subjected to the rest of the drying process. The green-NaCN slurry and any precipitated Na2CO3 were dried in an oven at 100 °C.
The percentage yield of green-NaCN was calculated as follows:
%   y i e l d   o f   N a C N = M a s s   o f   g r e e n   N a C N M a s s   o f   c a s s a v a   l e a v e s × 100 %

2.2.7. Structural Confirmation of Synthesised Sodium Cyanide Salt

The identity, crystal structure and purity of the NaCN solid (green-NaCN), obtained as described in Section 2.2.6, were compared against a control sample (NaCN standard) by attenuated total reflectance–Fourier transform infrared spectroscopy (ATR–FTIR), powder X-ray diffraction analysis (XRD) and scanning electron microscopy with energy-dispersive X-ray spectroscopy (SEM/EDS).
  • Attenuated total reflectance–Fourier transform infrared spectroscopy (ATR–FTIR)
The ATR–FTIR spectra of both the NaCN standard and green-NaCN were recorded in the wavenumber range of 4000–400 cm−1 on a Shimadzu QART-S single reflectance ATR accessory attached to an IR Spirit Shimadzu spectrophotometer. The precipitated Na2CO3 was also examined under the same parameters and compared against the control Na2CO3.
  • X-ray diffraction analysis (XRD)
This technique determined the crystal structure and phase purity of finely crushed and homogeneous green-NaCN and precipitated Na2CO3. The XRD patterns were recorded at 25 °C and an angle of 2θ on a PANalytical X’Pert PRO X-ray diffractometer using CuKα radiation with a wavelength of 1.54060 Å. The PANalytical X’Pert Highscore software was used to analyse all samples in a range of 4.0124 to 89.9814°2θ with a step size of 0.0170°/step. The data were processed using the Match! Software (Version 3.8.2.148).
  • Scanning electron microscopy with energy-dispersive X-ray spectroscopy (SEM-EDS)
SEM-EDS was used to examine the morphology and determine the elemental composition of finely crushed green-NaCN and precipitated Na2CO3 using the JEOL 7800F Field Emission Scanning Electron Microscope (FE-SEM).

3. Results and Discussion

3.1. Optimisation of Maceration Time and Temperature and Recovery Time for Maximum Release of Hydrogen Cyanide from Cassava Leaves

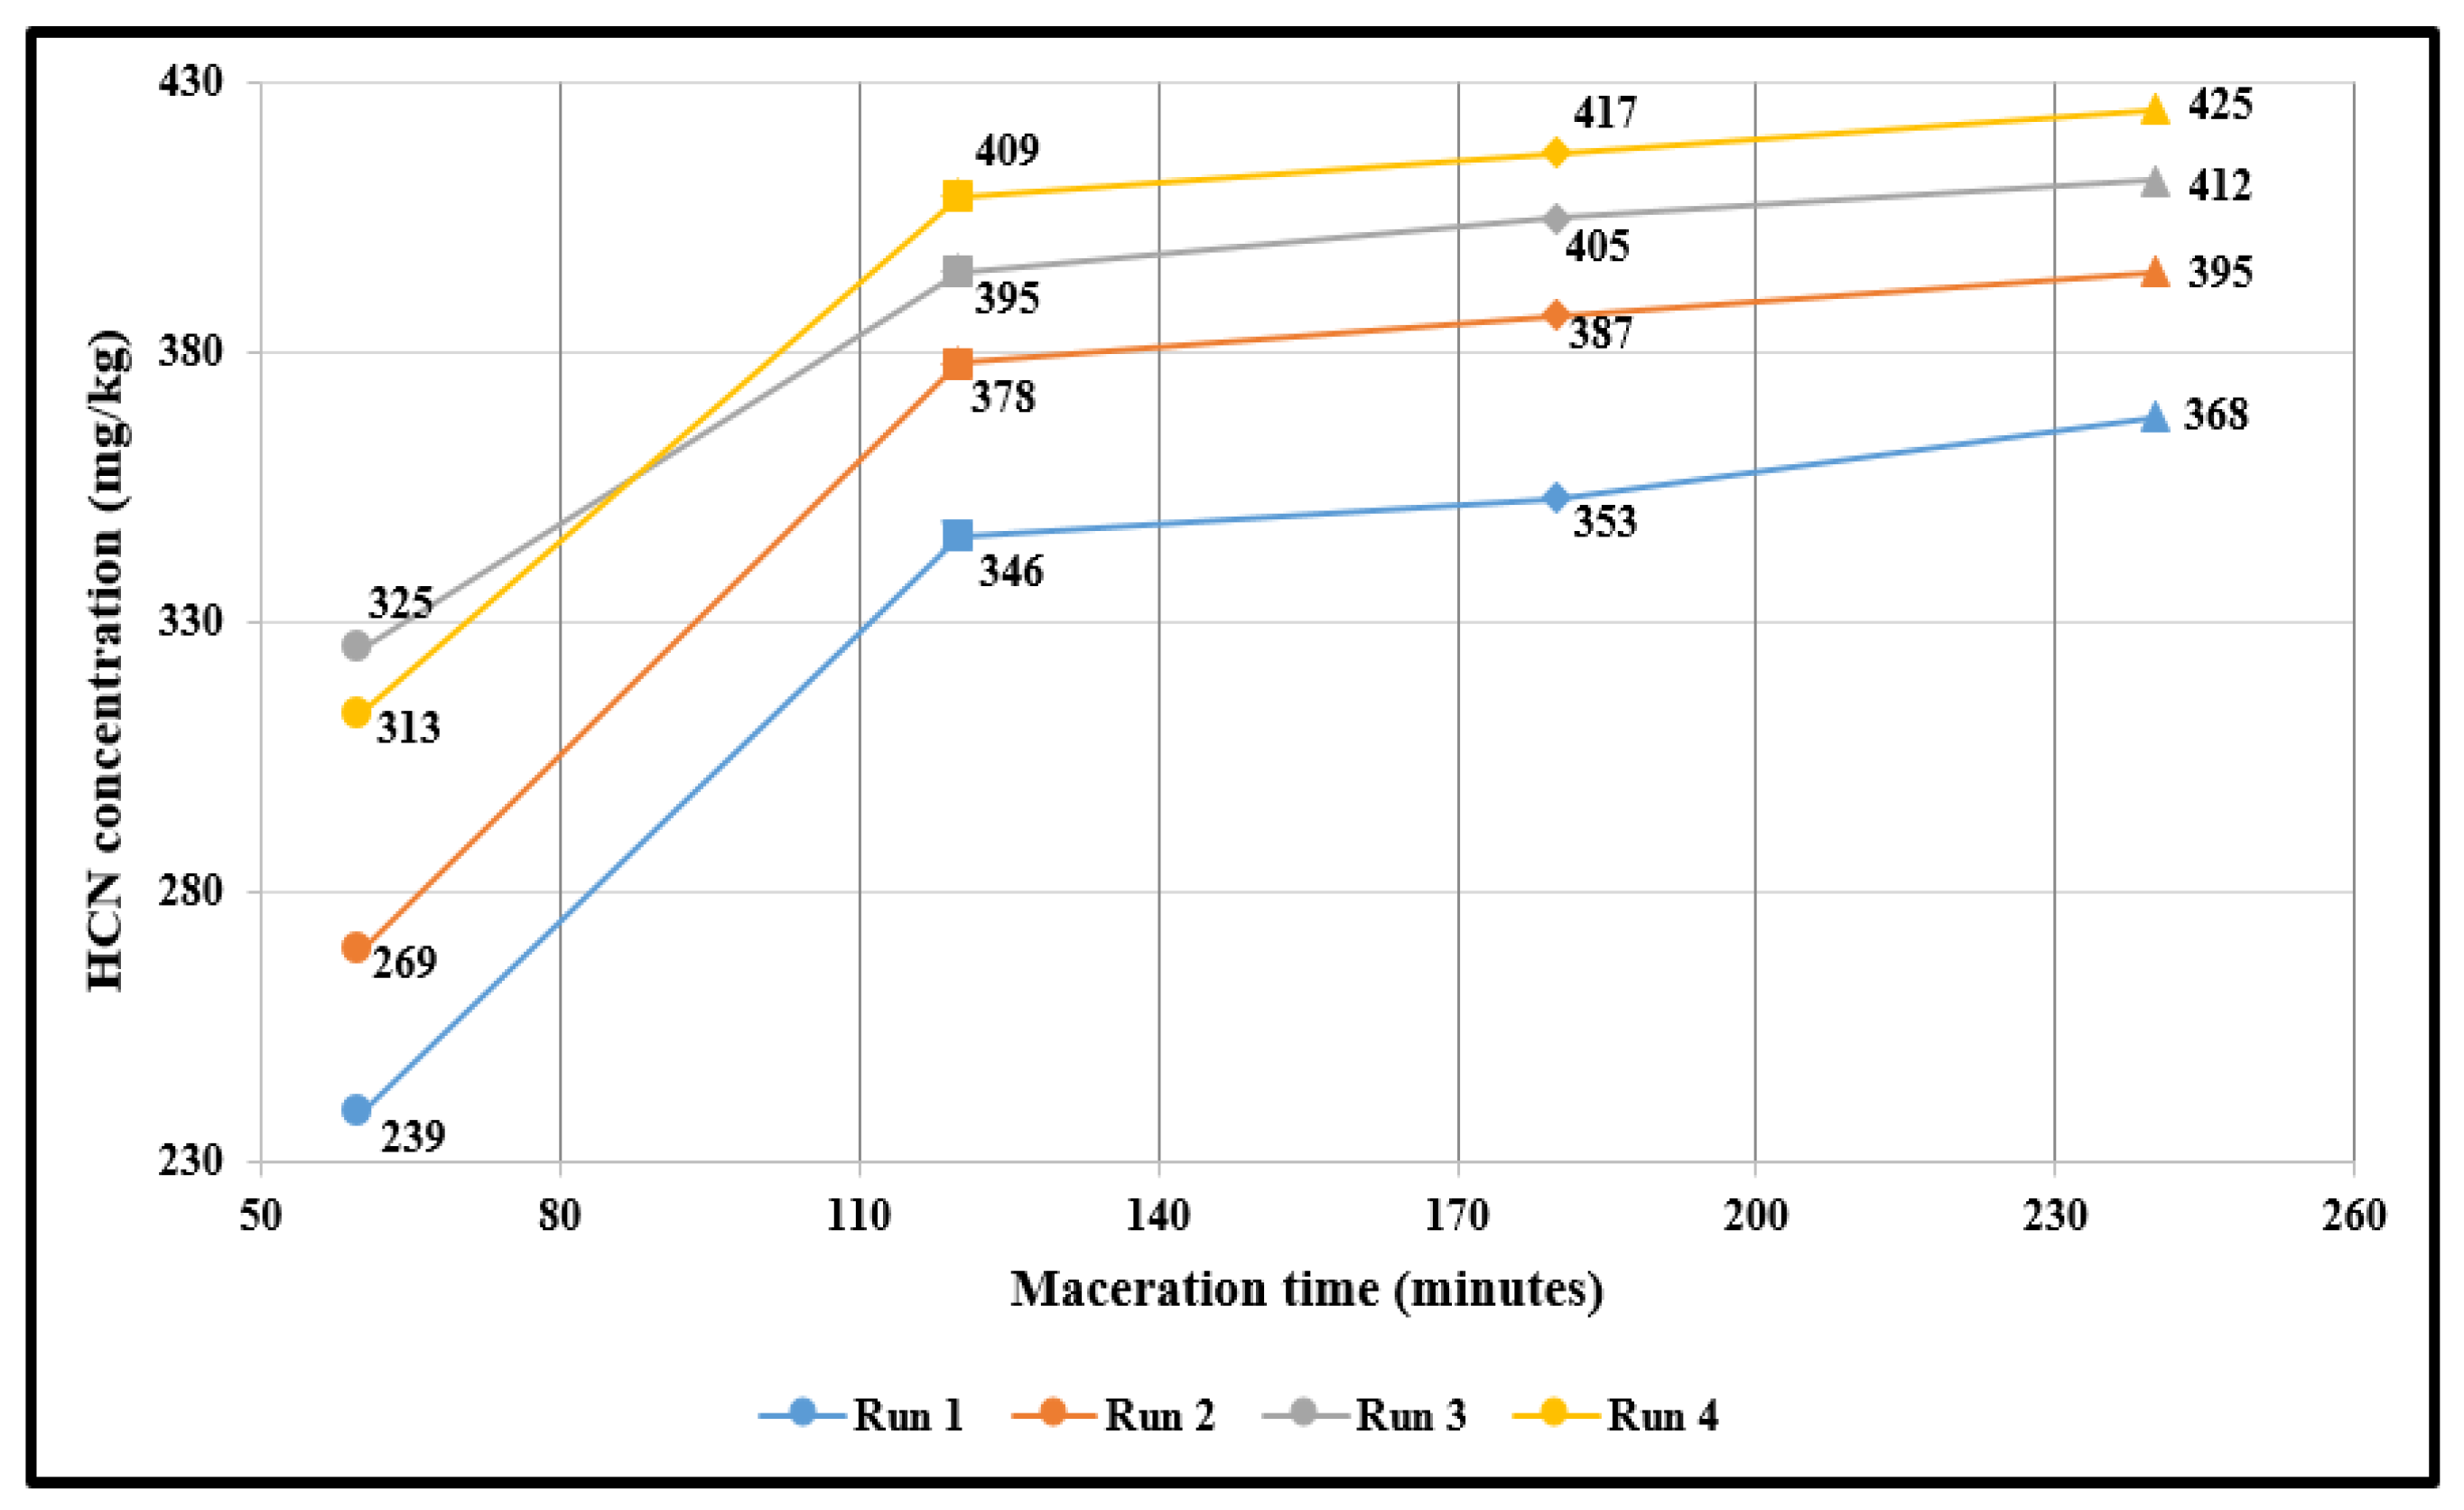
Figure 6 shows the concentration of the HCN released after 60, 120, 180 and 240 min of maceration. The HCN concentration increased with time. However, it is interesting to note that the increase in released HCN from 120 to 240 min is minimal, rather than the abrupt cyanide increase observed from 60 to 120 min. This trend was seen across the board in all replicate experiments.
These findings are similar to the study results by [25]. According to this study, linseed was macerated for 120 to 240 min to release HCN. Therefore, since the increase in the HCN concentration was minimal in this range, 120 min of maceration time was used throughout the study.
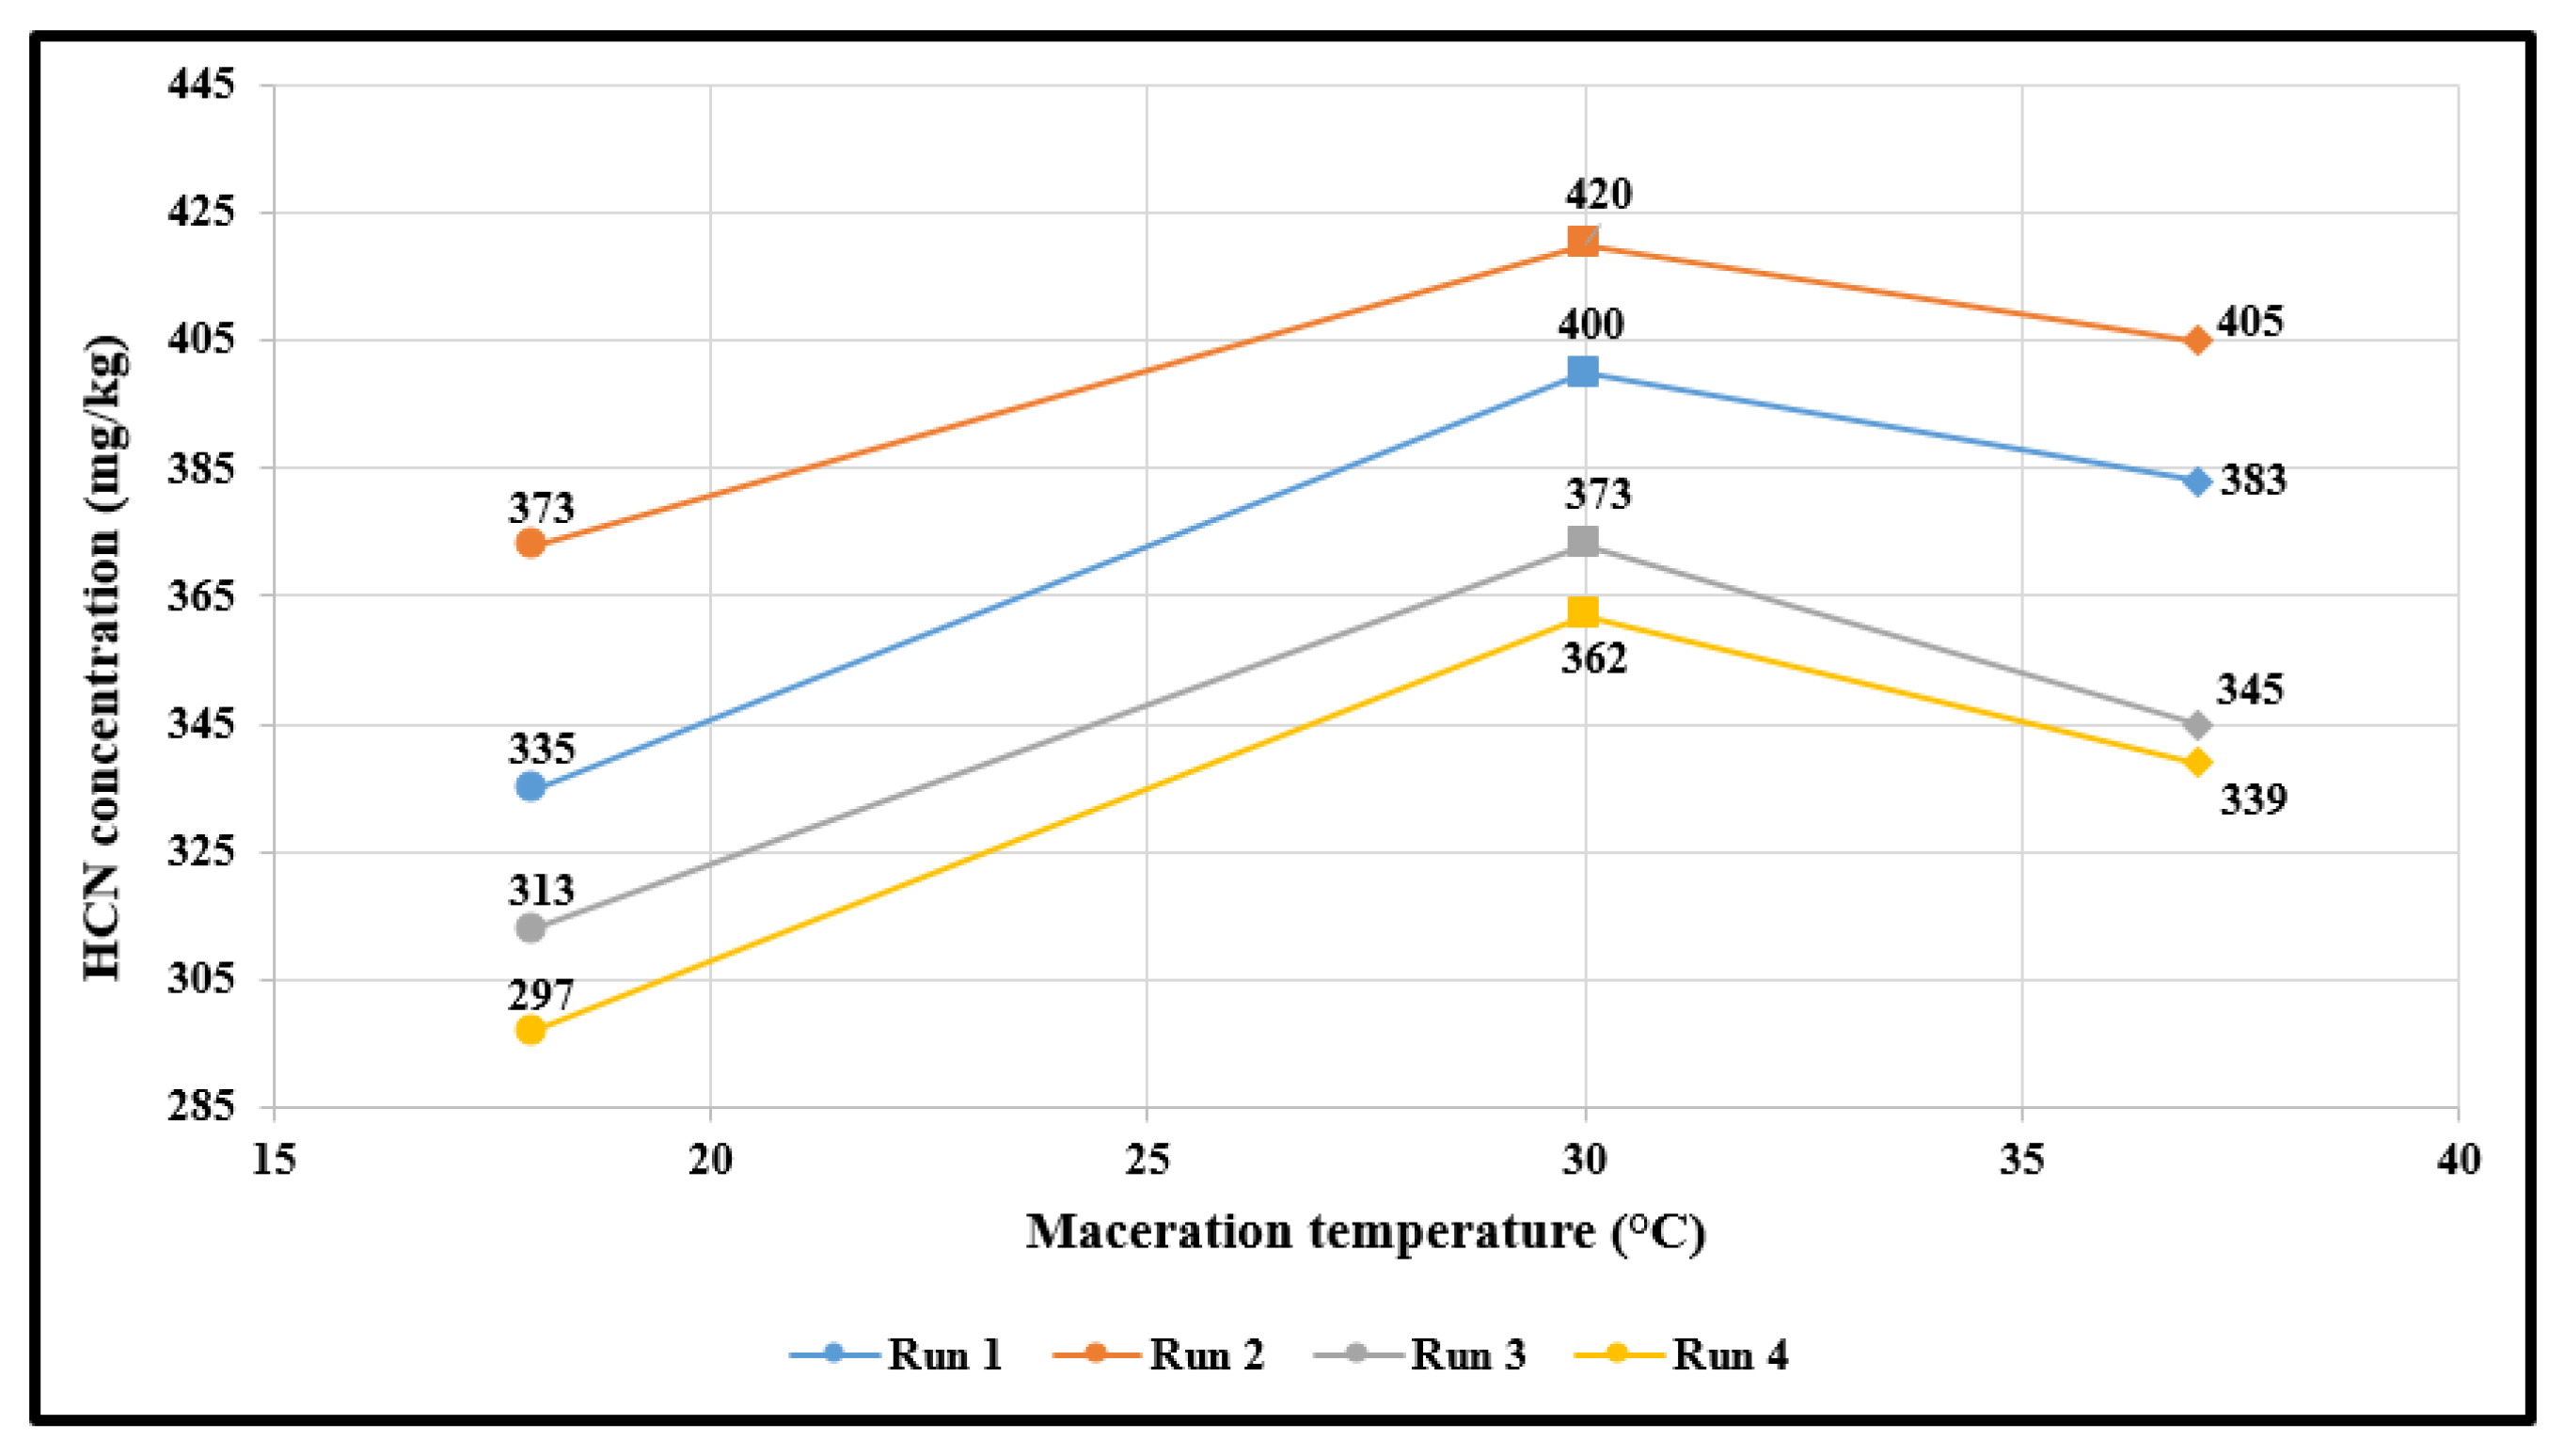
Figure 7 shows the concentration of the HCN released after 120 min of maceration at 18 °C (room temperature), 30 °C and 37 °C. The HCN concentration increased from 18 to 30 °C before decreasing. All replicate experiments revealed the same trend. The decrease in the HCN concentration could be explained by a reduction in enzymatic activities [26]. These results suggest that the optimum temperature for the maximum HCN release is 30 °C.
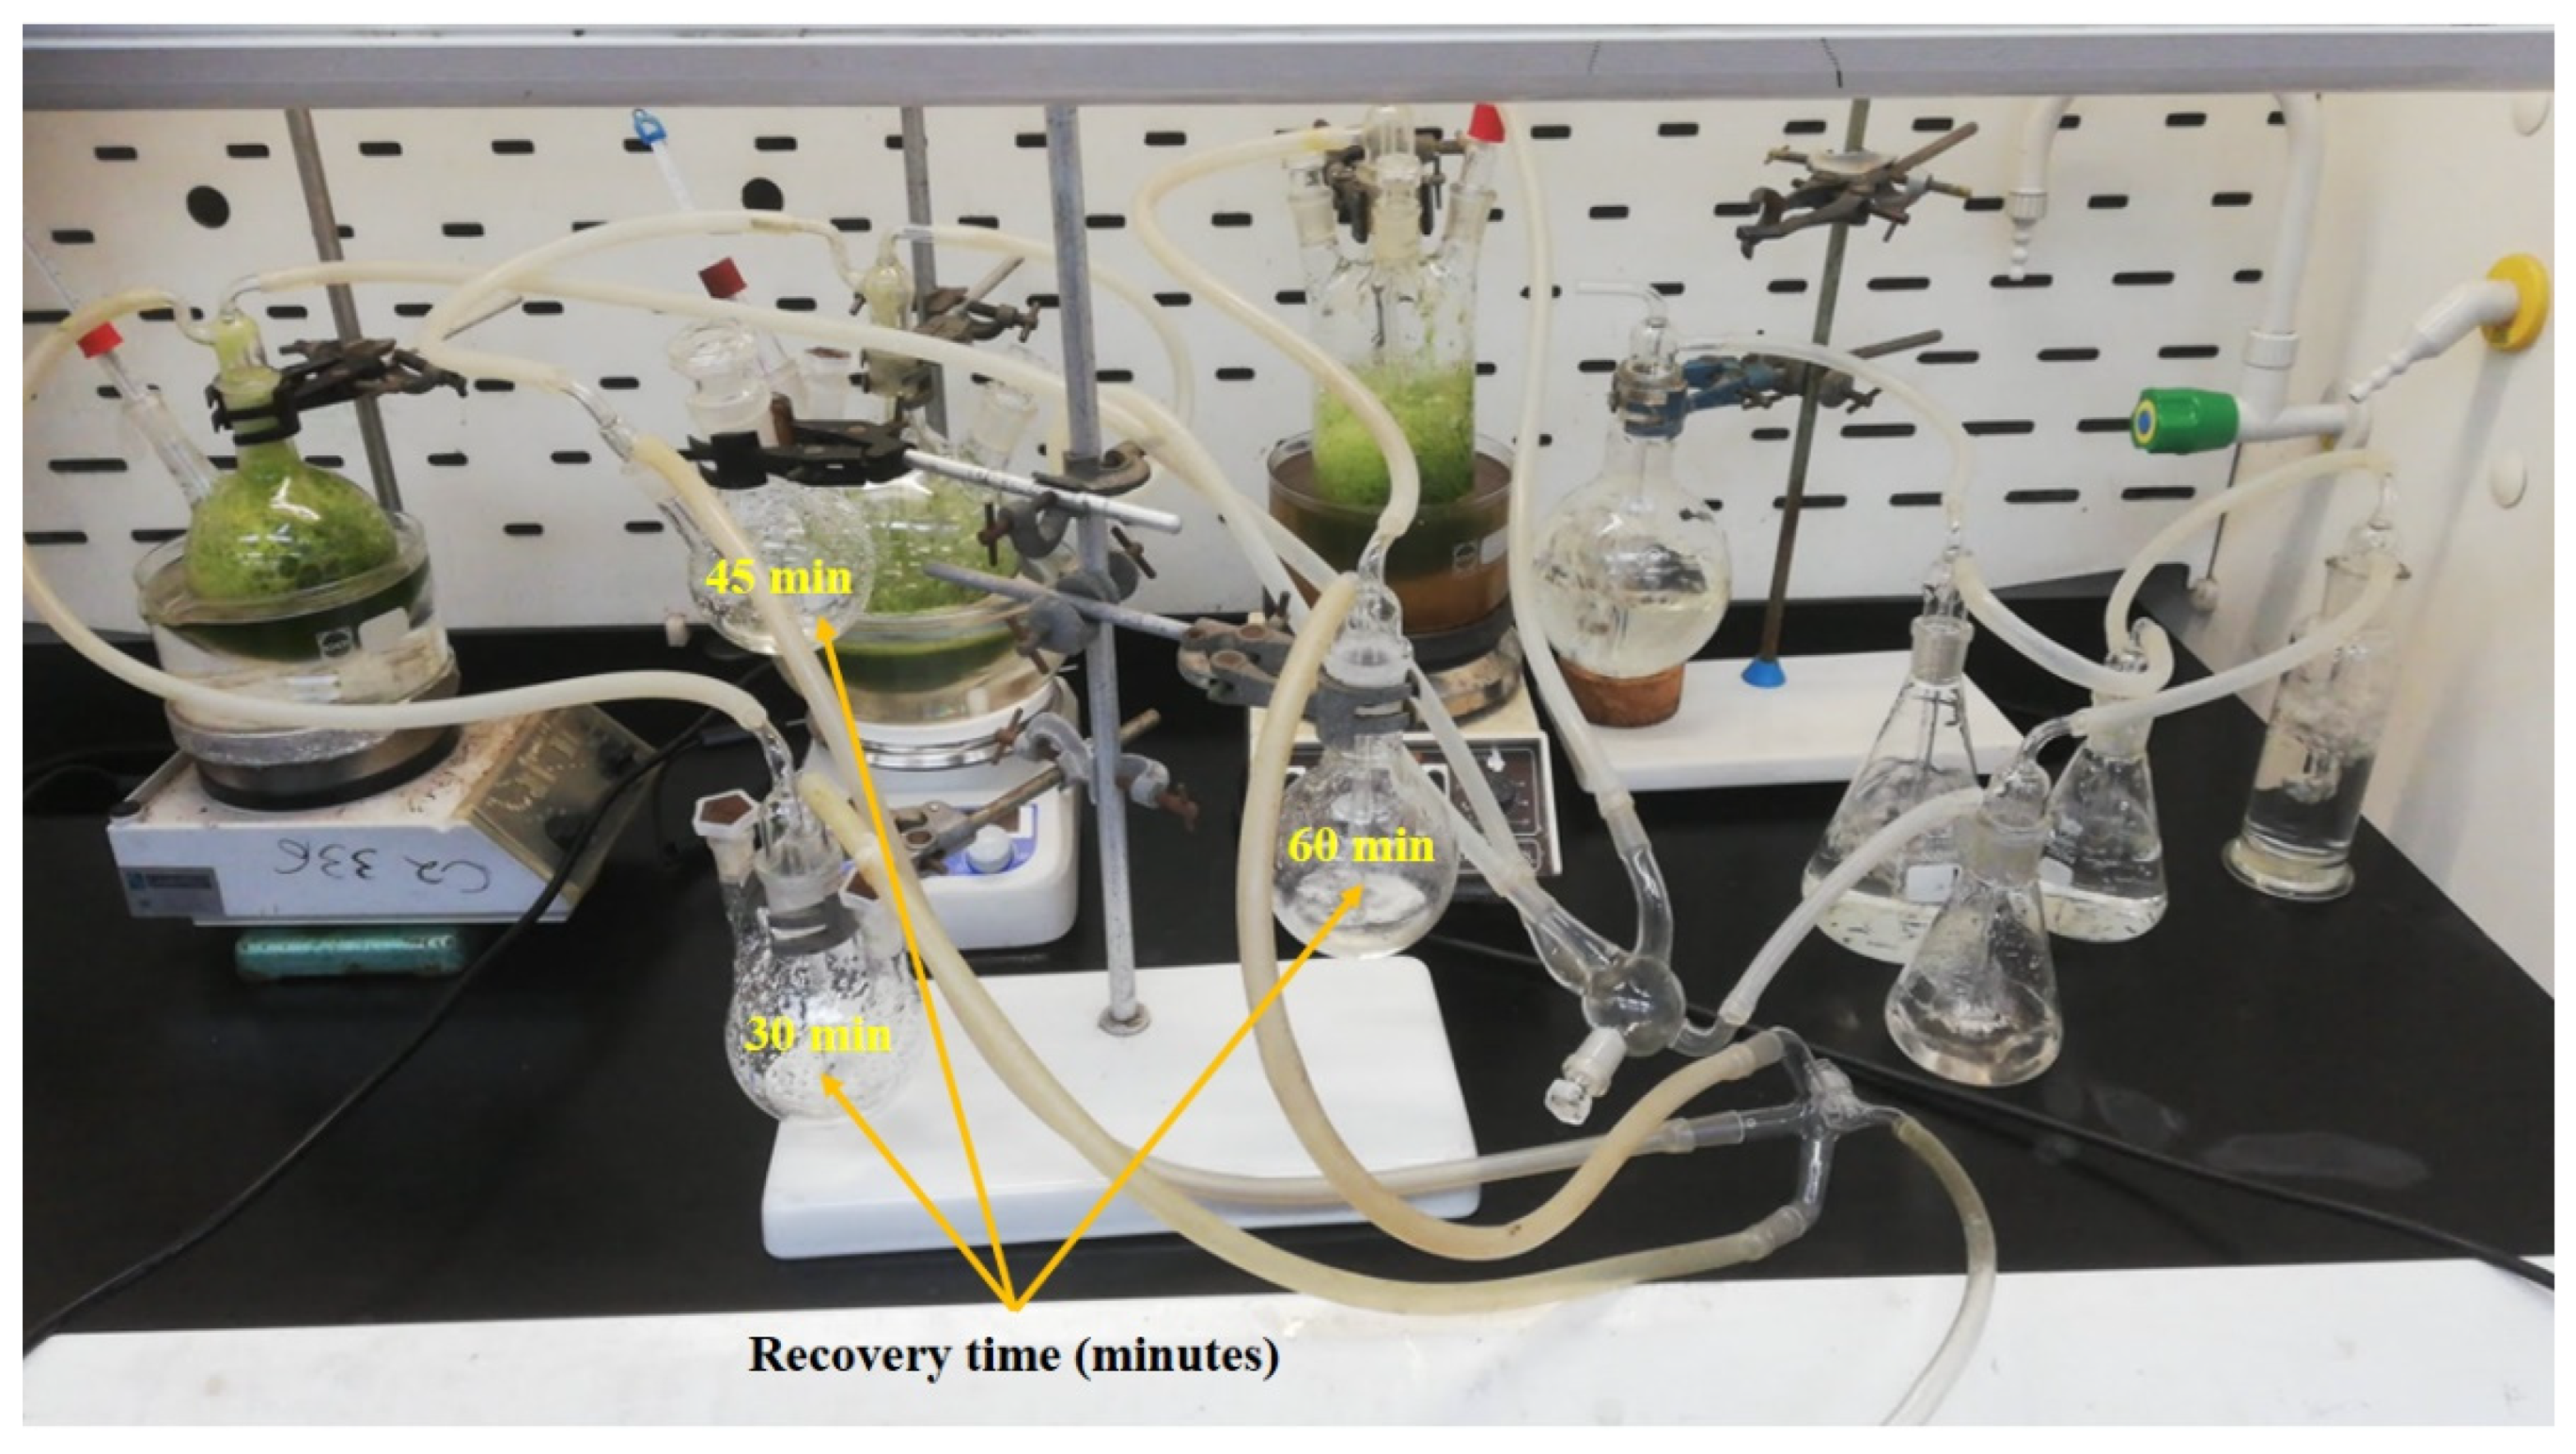
The concentrations of the HCN released after macerating the cassava leaves for 120 min at 30 °C and recovered after 30, 45 and 60 min of extraction under vacuum at 35–40 °C, are shown in Table 1. The experimental setup is depicted in Figure 8.
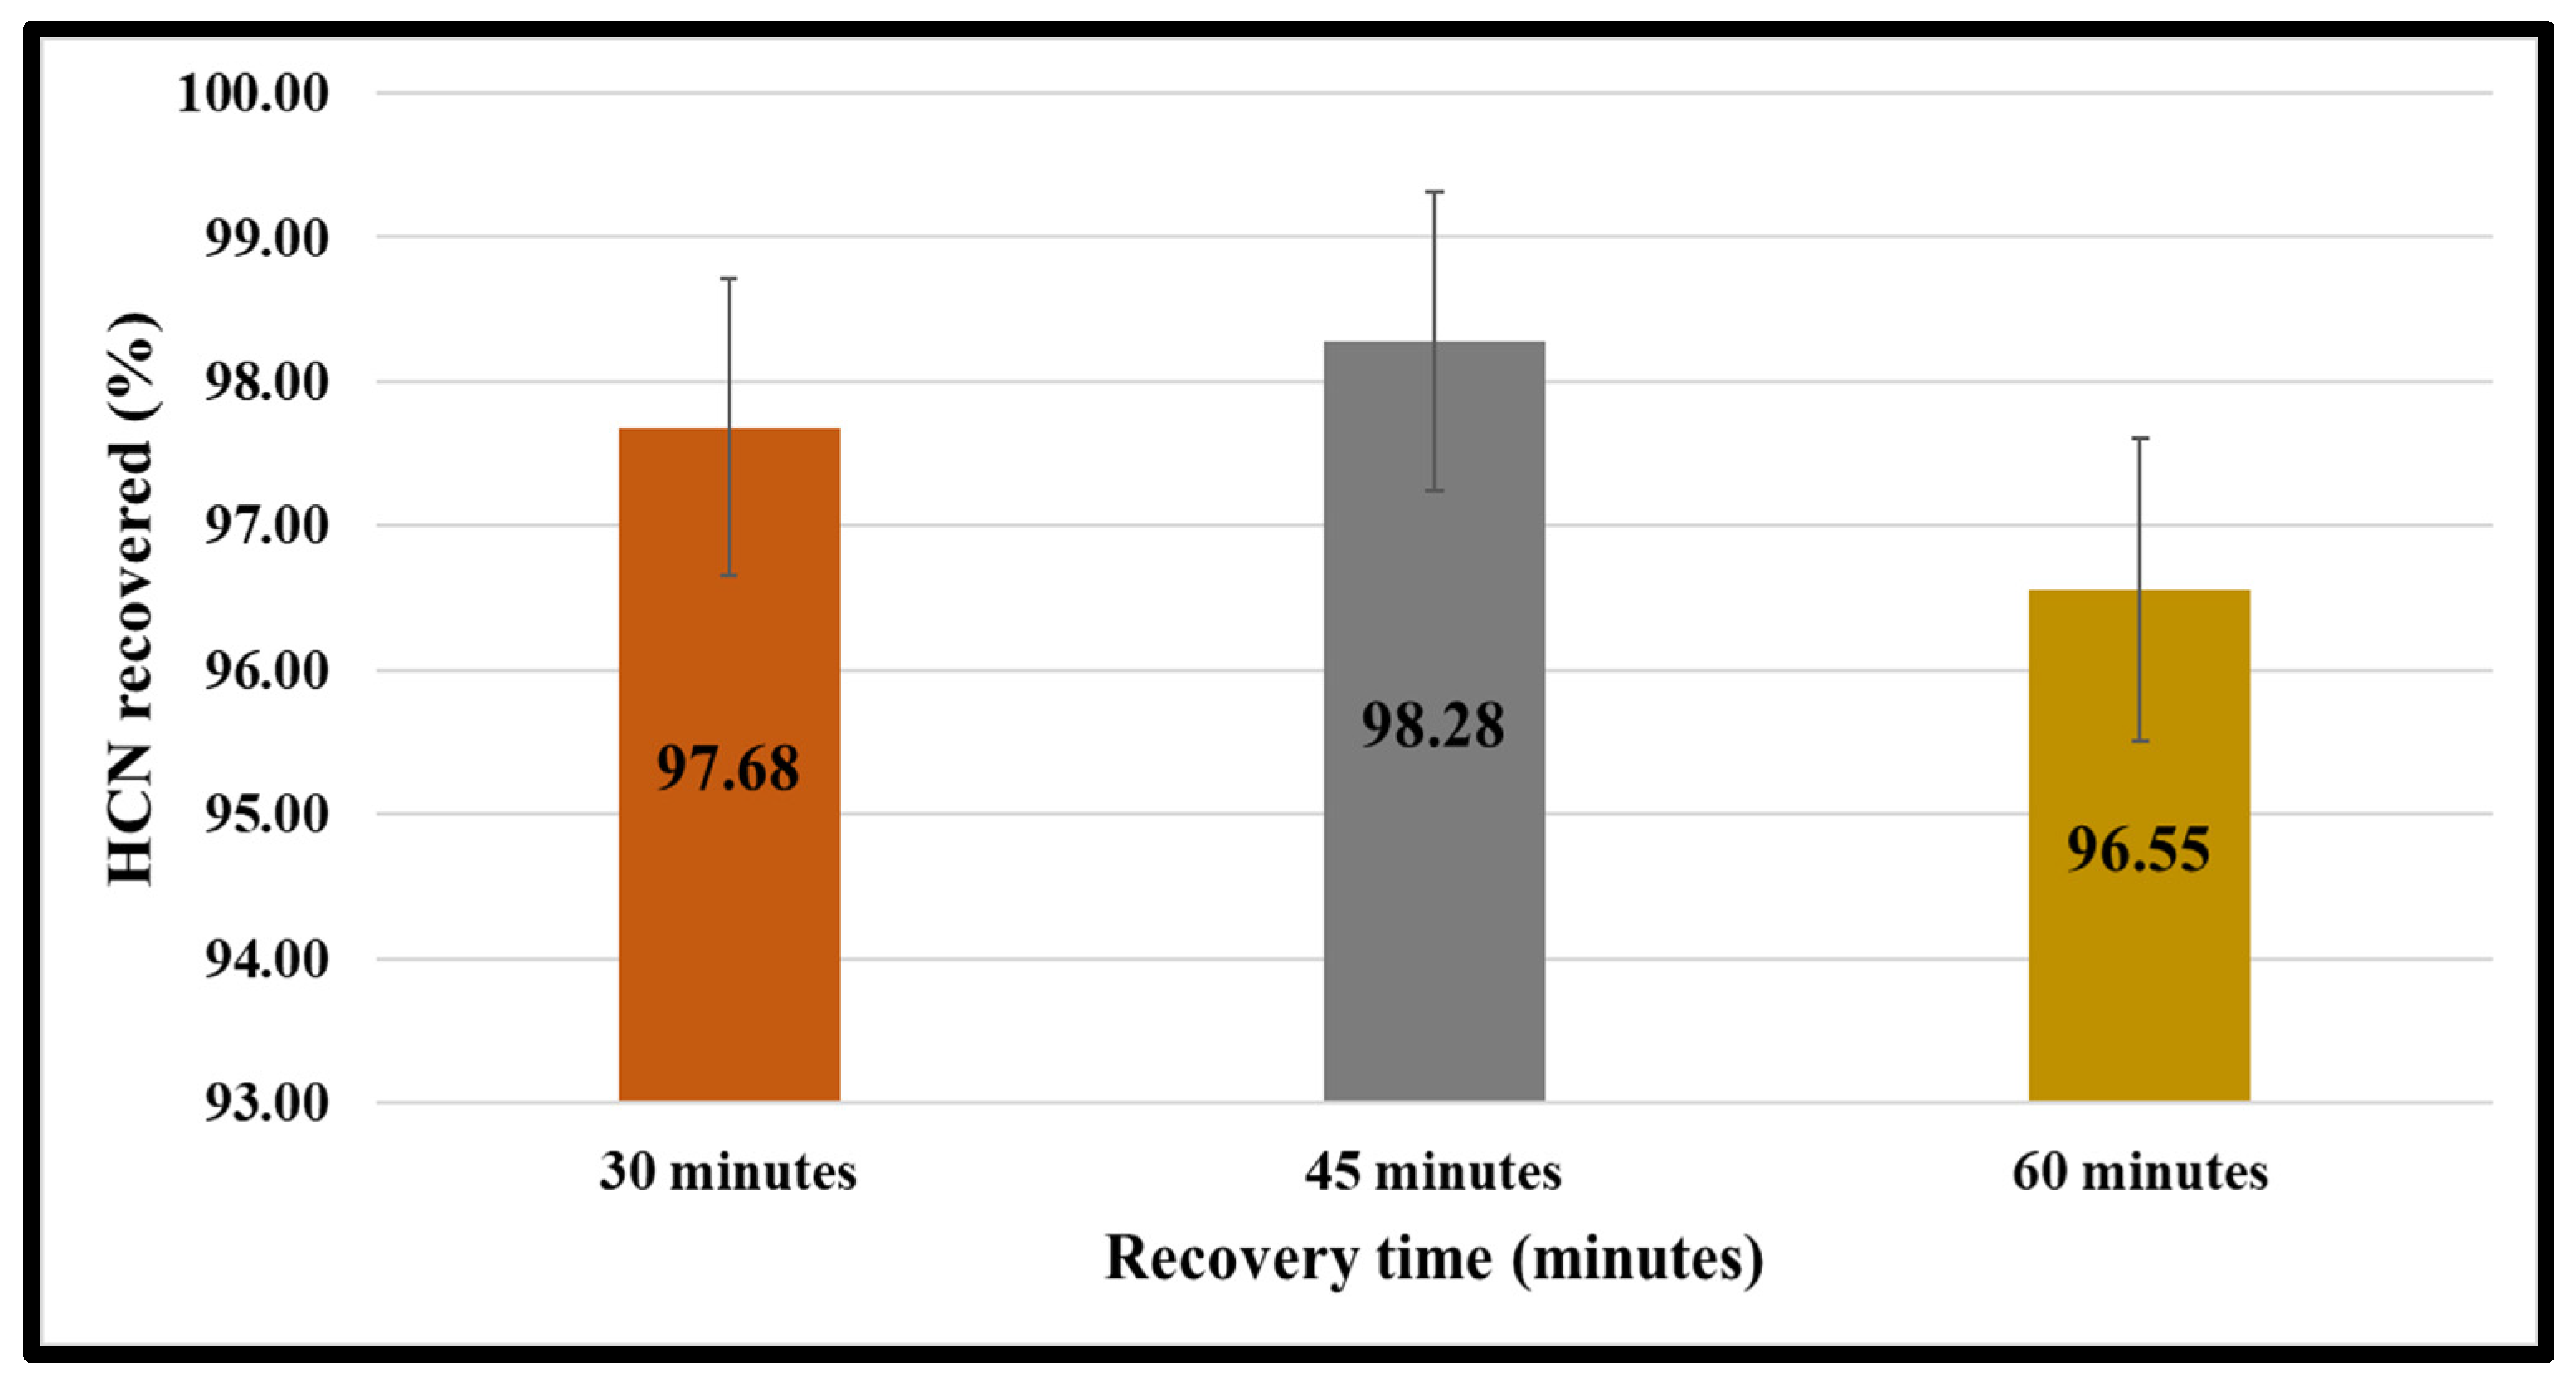
The percentage recoveries were 97.68 ± 1.03%, 98.28 ± 1.04% and 96.55 ± 1.05% after 30, 45 and 60 min of extraction, respectively, as shown in Figure 9. Irrespective of the cassava leaves batch used, the % recoveries were approximately the same at each extraction time and within the acceptable analytical range. These percentage recoveries were calculated using Equation (1). From these results, we can see that the maximum HCN recovery was achieved after 45 min of extraction.
Thus, the optimum conditions for the succeeding experiments were maceration at 30 °C for 120 min followed by 45 min of extraction under vacuum at 35–40 °C.

3.2. Saturation of 3.6740 mol/L Absorbing Solution

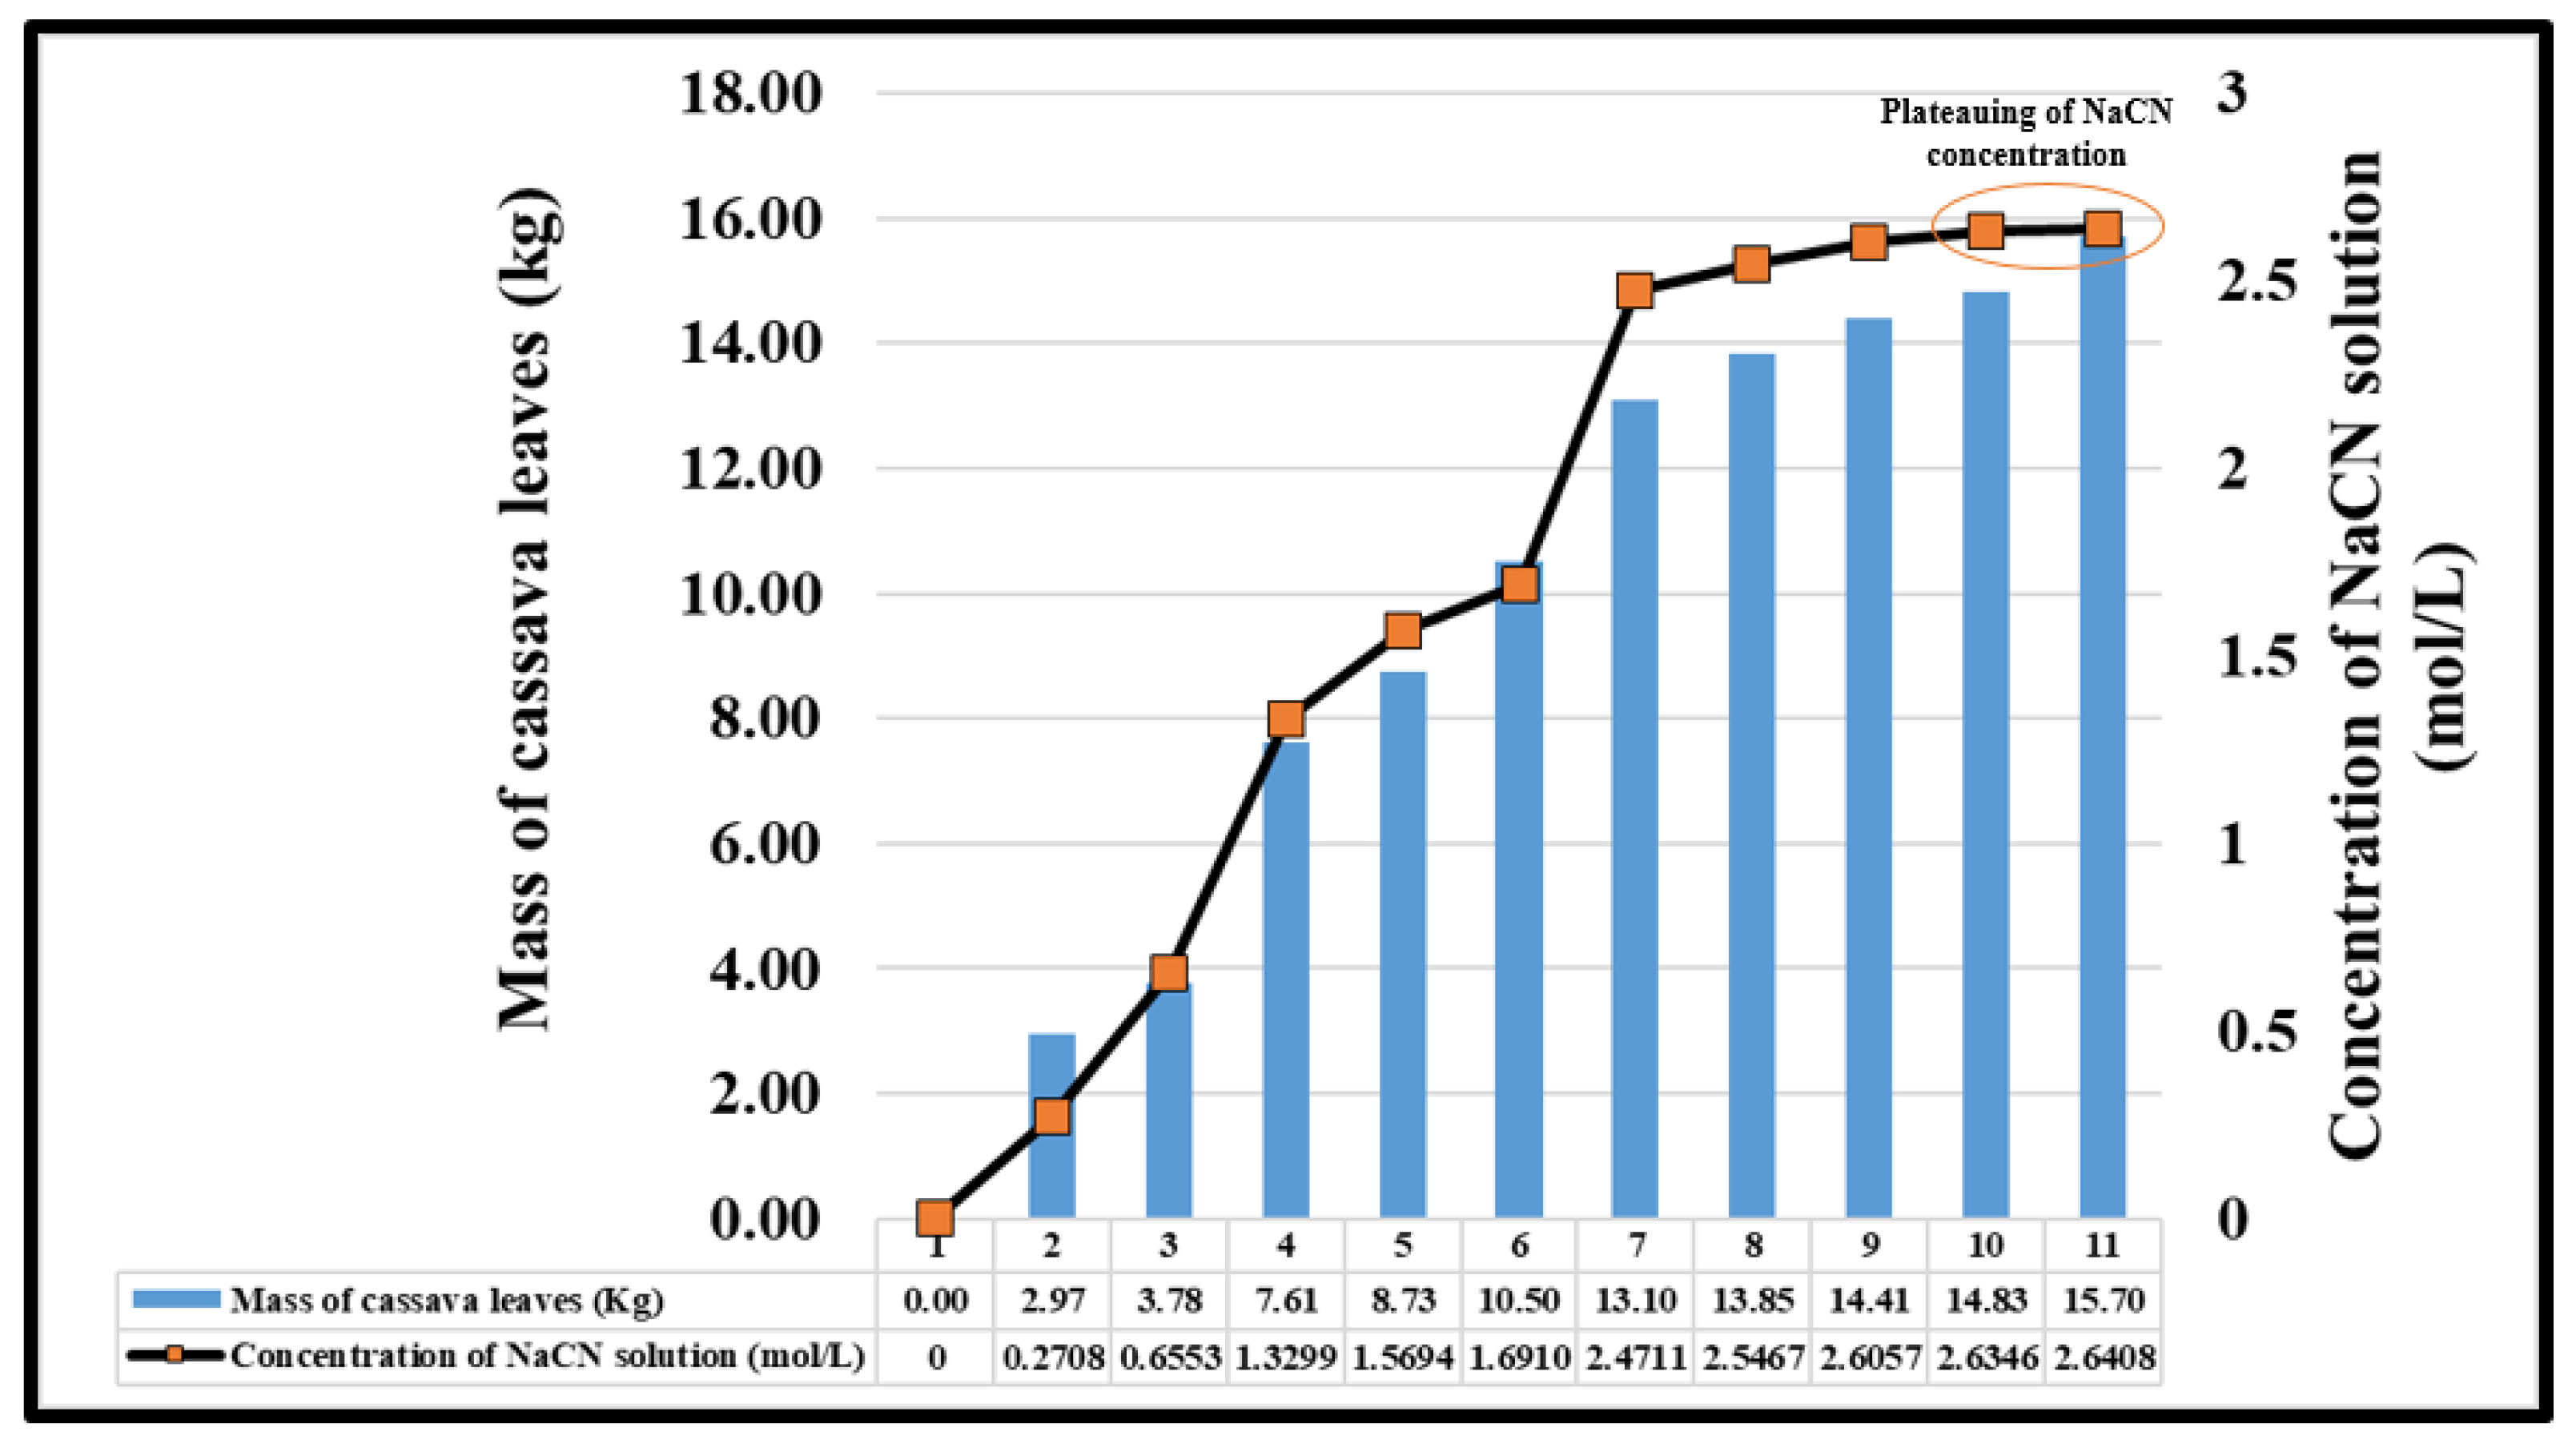
Figure 10 shows the saturation of 250 mL of the 3.6740 mol/L NaOH solution. This process was done using the optimum extractions conditions and continued until the plateauing of the NaCN concentration was observed.
From Figure 10, we see that 15.70 kg of fresh cassava leaves were used to saturate the absorbing solution with extracted HCN gas. This result suggests that the quantity of cassava leaves needed to saturate the absorbing solution solely depends on the concentration of the HCN liberated. Hence, the leaves used in this study had a low HCN content. The saturation process was stopped when the concentration of the prepared NaCN solution plateaued around 2.6 mol/L. Interestingly, the final NaCN concentration (2.6408 mol/L) was lower than the concentration of the absorbing solution (3.6740 mol/L). This result shows that the concentration of the absorbing solution and the amount of CO2 absorbed from the atmosphere restrict the final concentration of NaCN. The former can be overcome by increasing the concentration of the absorbing solution, while the latter can be minimised by limiting the contact time between the absorbing solution and atmospheric CO2.
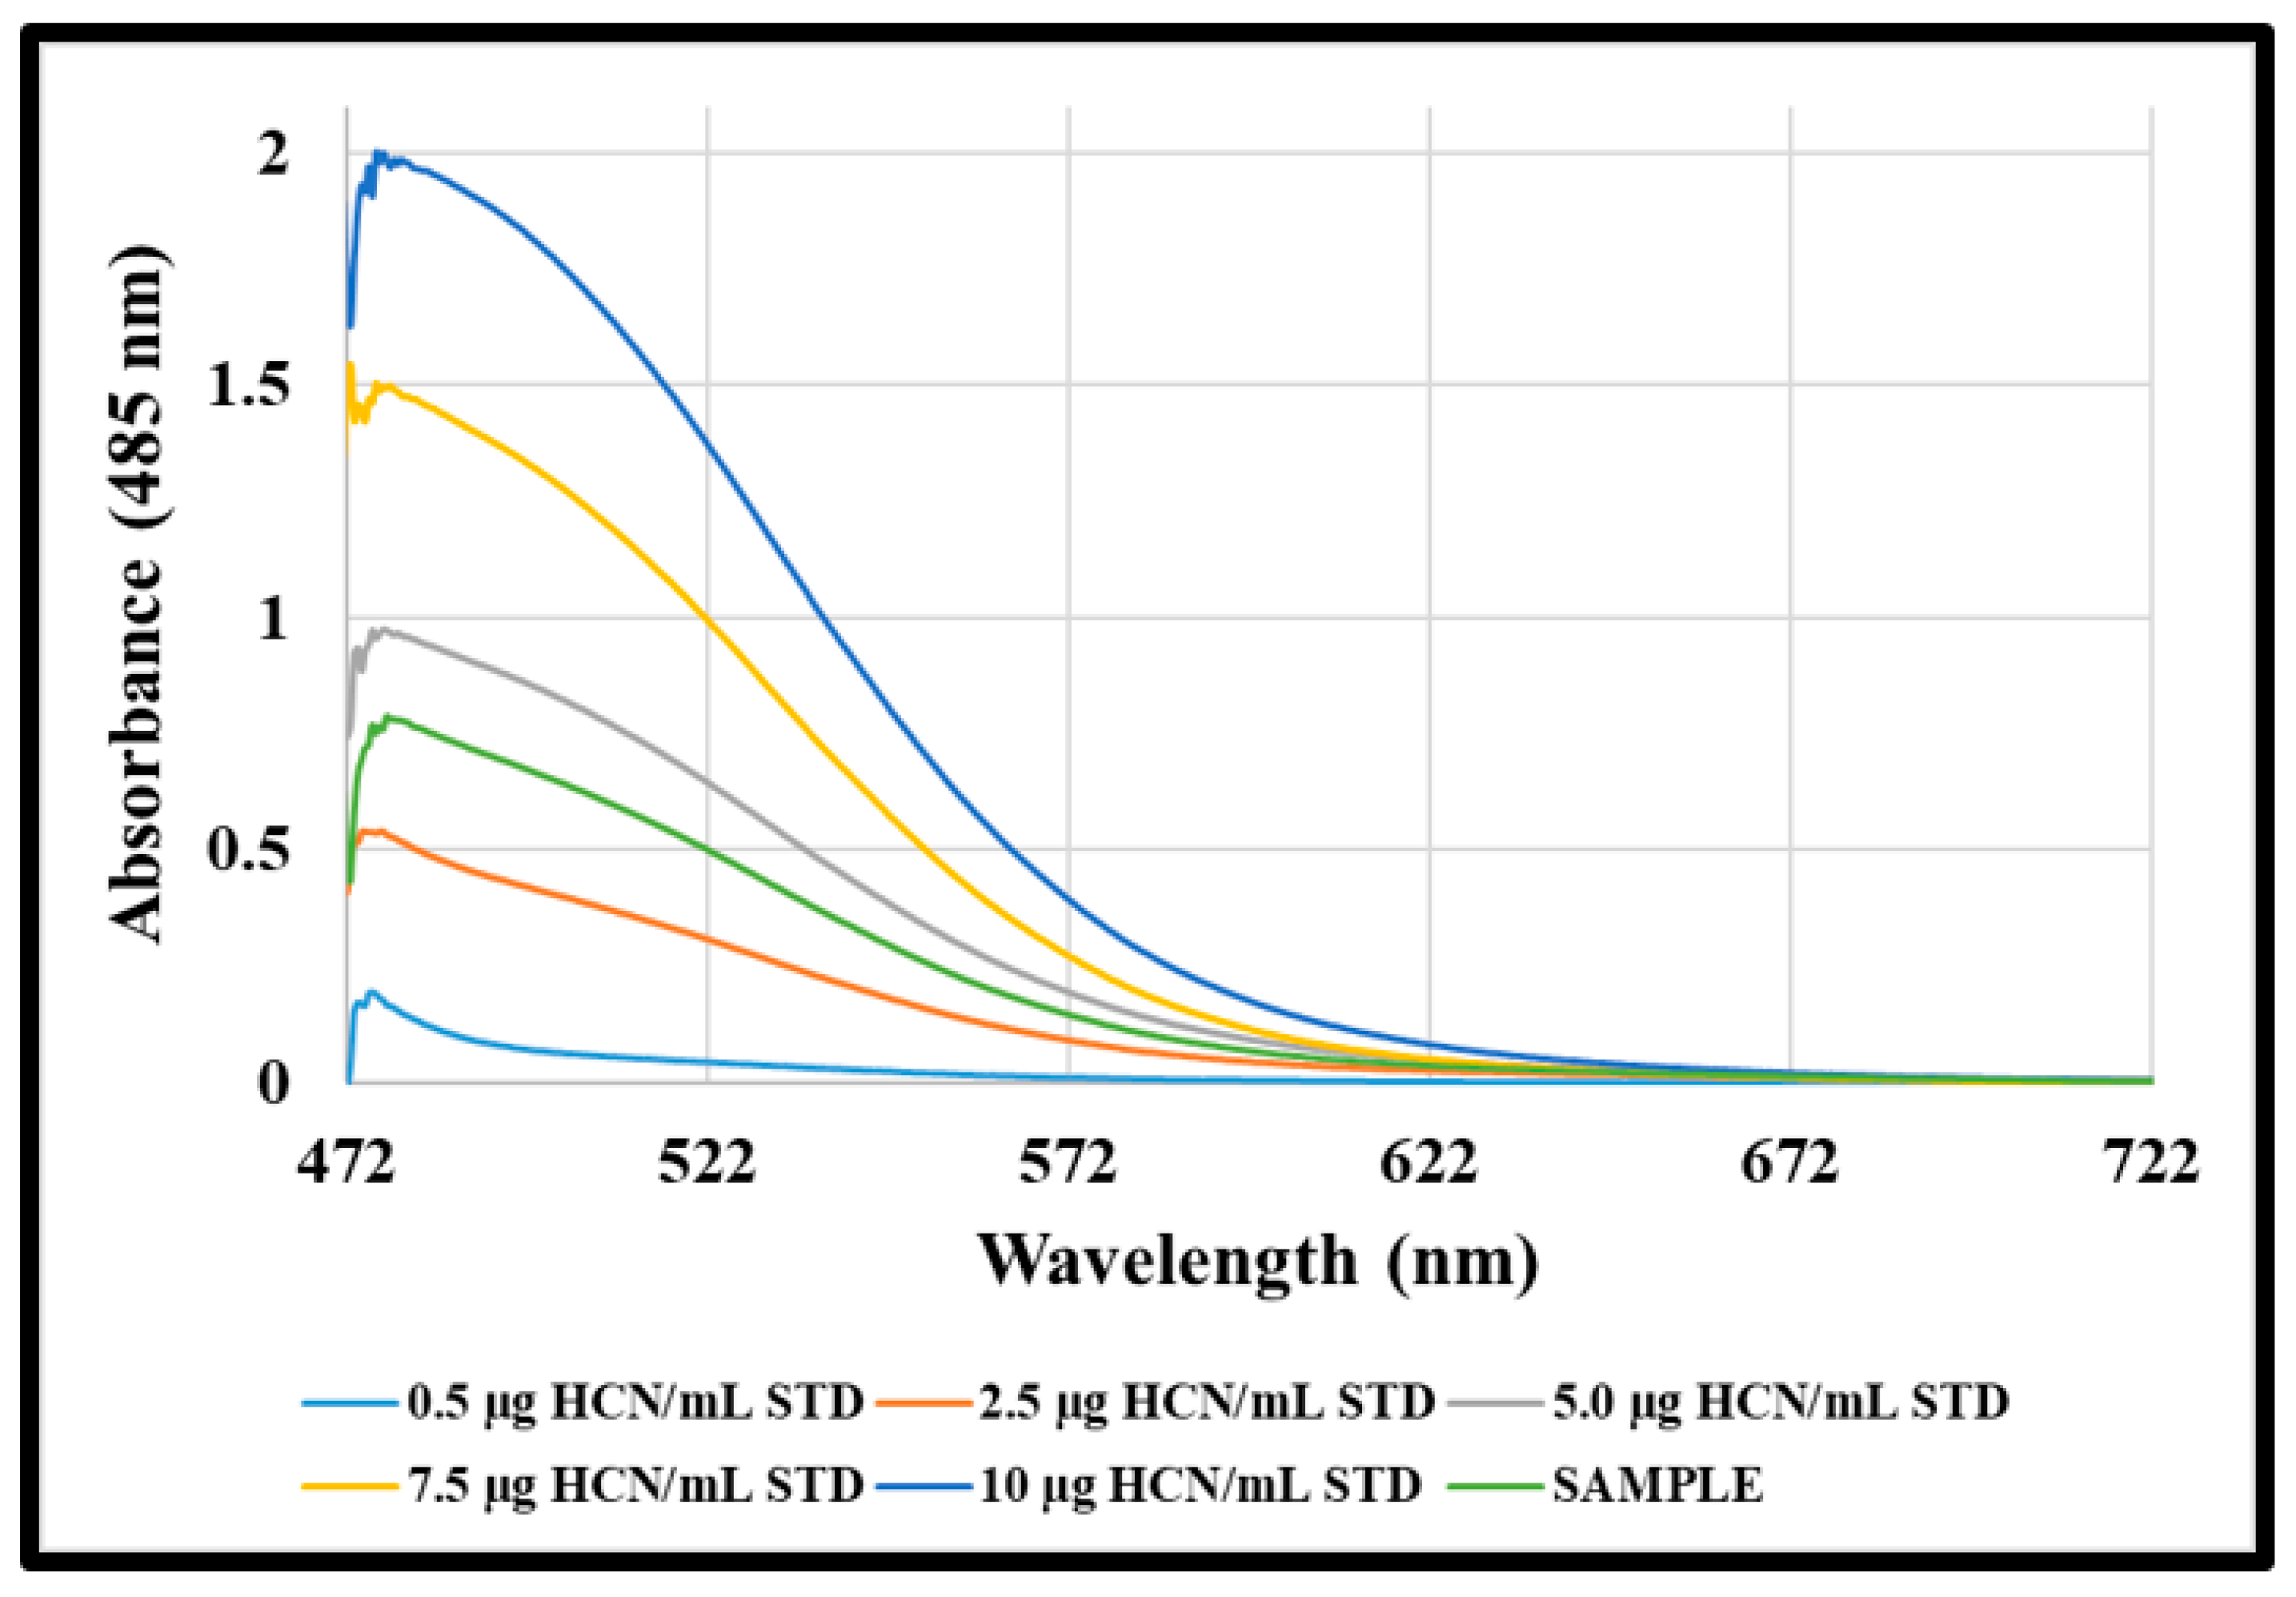
The concentration of NaCN in the absorbing solution was extrapolated from a calibration curve, as shown in Figure 11, generated using the method described in Section 2.2.4. The colour intensity of the sodium isopurpurate is directly proportional to the amount of cyanide present in the samples (Figure 12). This process was repeated with fresh reagents until saturation was complete.

3.3. Estimation of Sodium Carbonate and Residual Sodium Hydroxide in Standard and Green-Sodium Cyanide Salts

Table 2 shows the titration results, and the amounts of sodium carbonate (Na2CO3) and residual sodium hydroxide (NaOH) contained in the standard and green-NaCN salts. Na2CO3 is found in both NaCN salts and originates from the reaction between the atmospheric CO2 and the absorbing solution during the neutralisation and drying processes.
The Na2CO3 and residual NaOH contents were 0.61% and 1.73% in the control NaCN sample and 2.29% and 4.68% in green-NaCN. The results obtained from the green-NaCN reveal the presence of a substantial amount of NaOH after the saturation process. Hence, since NaOH readily reacts with atmospheric CO2 to form Na2CO3, it is advisable to continue saturation well past the onset of plateauing of the NaCN concentration to decrease the concentration of unreacted NaOH. The Na2CO3 present in the NaCN salts could have been formed during the preparation of the NaOH absorbing solution and the latter’s handling during the saturation process when it came into contact with atmospheric CO2. However, Na2CO3 is also present in commercial NaCN, devoid of any residual NaOH from its reaction with the product formed by atmospheric CO2 and water (H2O). Hence, NaCN salt must always be stored in a tightly-closed container to avoid contact with atmospheric CO2.

3.4. Structural Characterisation of Sodium Cyanide Salt

A total of 32.356 g of NaCN salt (green-NaCN) was obtained after drying the green-NaCN solution according to the method described in Section 2.2.6. The percentage yield of the green-NaCN prepared from cassava leaves was determined using Equation (4):
%   y i e l d   g r e e n N a C N =   32.356   g 15.70 × 10 3   g × 100 %   = 0.21 %  
The yield obtained from the cassava leaves, using the proposed method, was very low as compared to the values obtained by [2] and [5] (Table 3).
The low yield that was obtained in this study could be due to the low HCN content of the cassava leaves variety used. The low yield can be overcome using the cassava variety or other cyanogenic plants with high HCN contents.
The identity, crystal structure and purity of green-NaCN and precipitated Na2CO3 were confirmed against control NaCN and control Na2CO3.

3.4.1. Attenuated Total Reflectance–Fourier Transform Infrared Spectroscopy (ATR–FTIR)

The ATR–FTIR spectra and the characteristic peaks of control NaCN and green-NaCN are given in Figure 13. Both spectra show a small, sharp O-H stretching peak at 2970 cm−1 due to water absorption. They exhibited a characteristic sharp, high-intensity peak at 2090 cm−1, corresponding to the C≡N stretching vibration, observed in inorganic cyanide [27]. The O-H bending is displayed at 1738 cm−1 by both samples and at 1594 and 1607 cm−1 by the control NaCN and green-NaCN, respectively. These peaks appeared from the vapour phase of water.
The IR spectra of both NaCN samples also revealed the presence of bands specific to the carbonate group. It is to be expected, since the formation of the latter arises from the reaction between atmospheric CO2 and (I) NaOH during the preparation of NaCN by the neutralisation method; (II) the unreacted NaOH during the drying of NaCN slurry in an air oven; (III) atmospheric H2O to form carbonic acid (H2CO3), which will react with pure NaCN (free of residual NaOH) to give sodium bicarbonate (NaHCO3), Na2CO3 and HCN in equilibria. If HCN is released, the equilibrium would shift. The C-O stretching peak, and C-O in-plane and out-of-plane bending peaks were, respectively, observed at 1449 cm−1, 863 cm−1 and 686 cm−1 in the IR spectrum of control NaCN.
The observed intense broadband at 1438 cm−1 was attributed to C-O stretching. The narrow sharp bands at 879 cm−1 and 702 cm−1, corresponding to C-O in-plane and out-of-plane bending, were observed in the spectrum of green-NaCN. The IR spectrum, shown in Figure 12, also revealed that green-NaCN has more Na2CO3 impurity than the control sample. These findings further support the titration results displayed in Table 2.
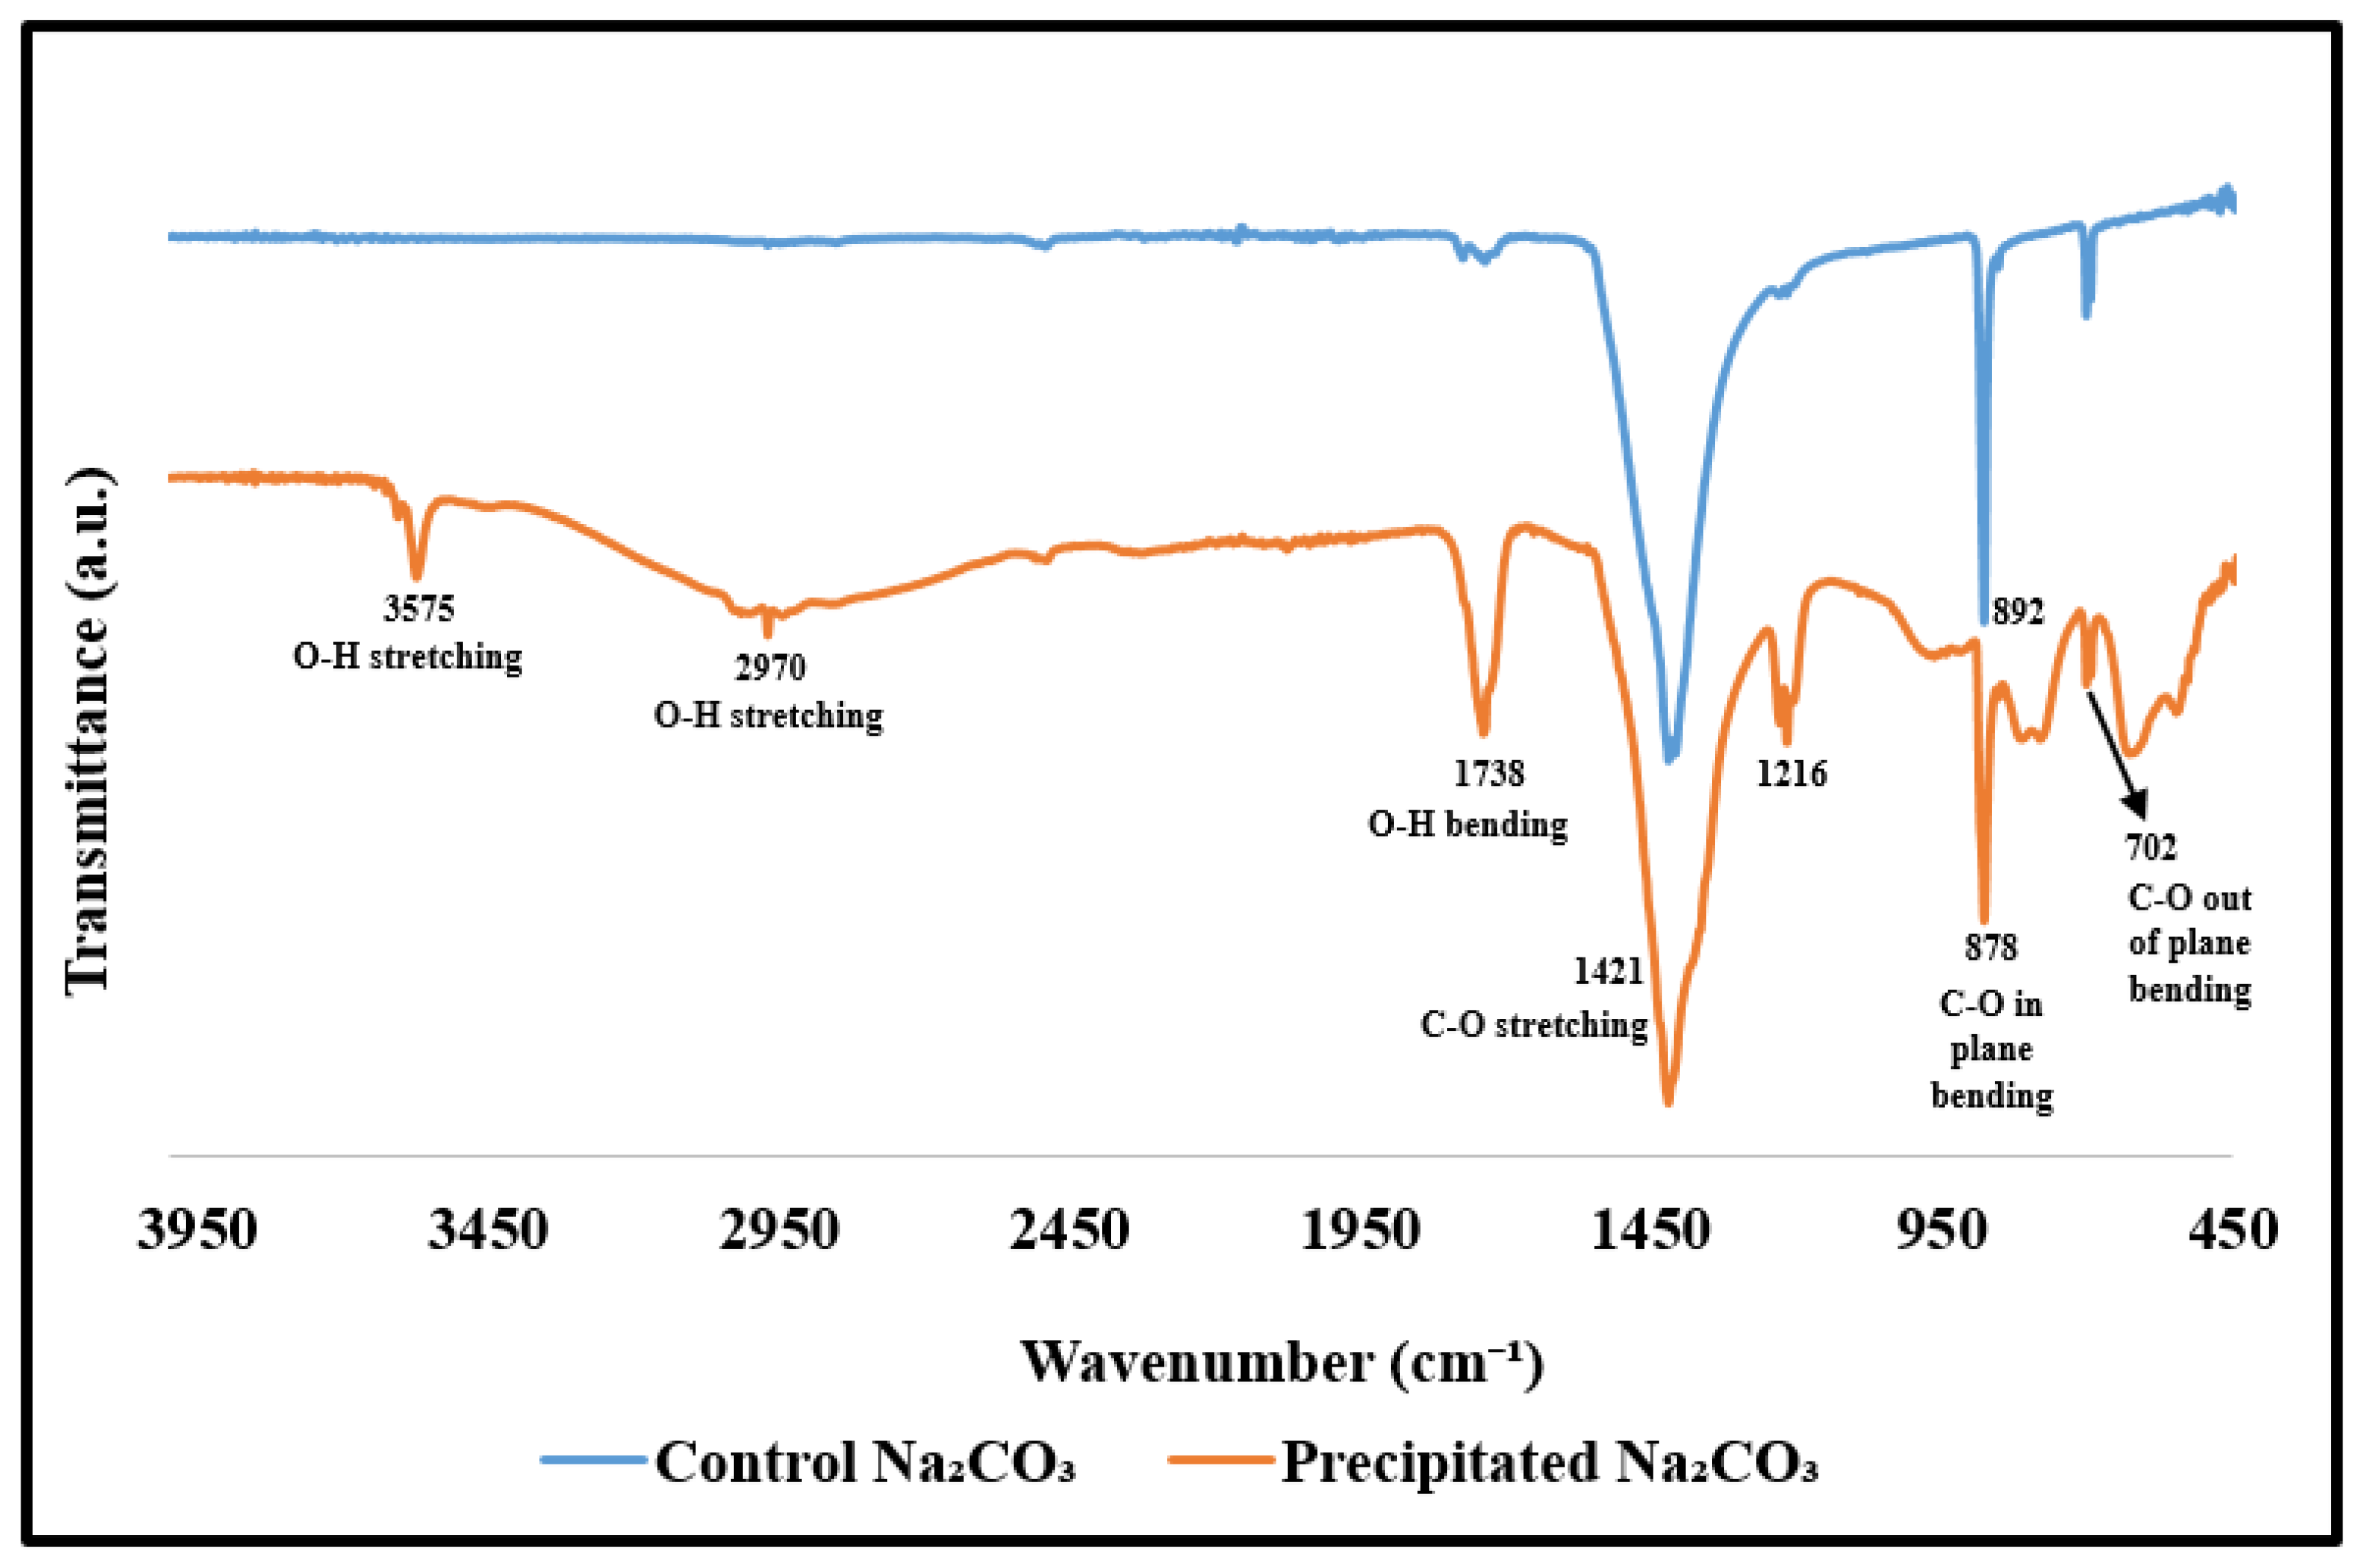
Figure 14 shows the ATR–FTIR spectra of the control Na2CO3 and precipitated Na2CO3. A small, broad peak at 1738 cm−1, resulting from the vapour phase of water, was observed on the spectrum of the control sample. C-O stretching gave rise to the intense, broad absorption band observed at 1421 cm−1. C-O in-plane and out-of-plane bending gave the narrow sharp bands at 878 cm−1 and 702 cm−1. Similar peaks, except for the small, broad peak at 3575 cm−1, caused by the vapour phase of water, and the narrow peak at 2970 cm−1, caused by water absorption by the sample, were observed on the spectrum of precipitated Na2CO3.

3.4.2. X-ray Diffraction (XRD)

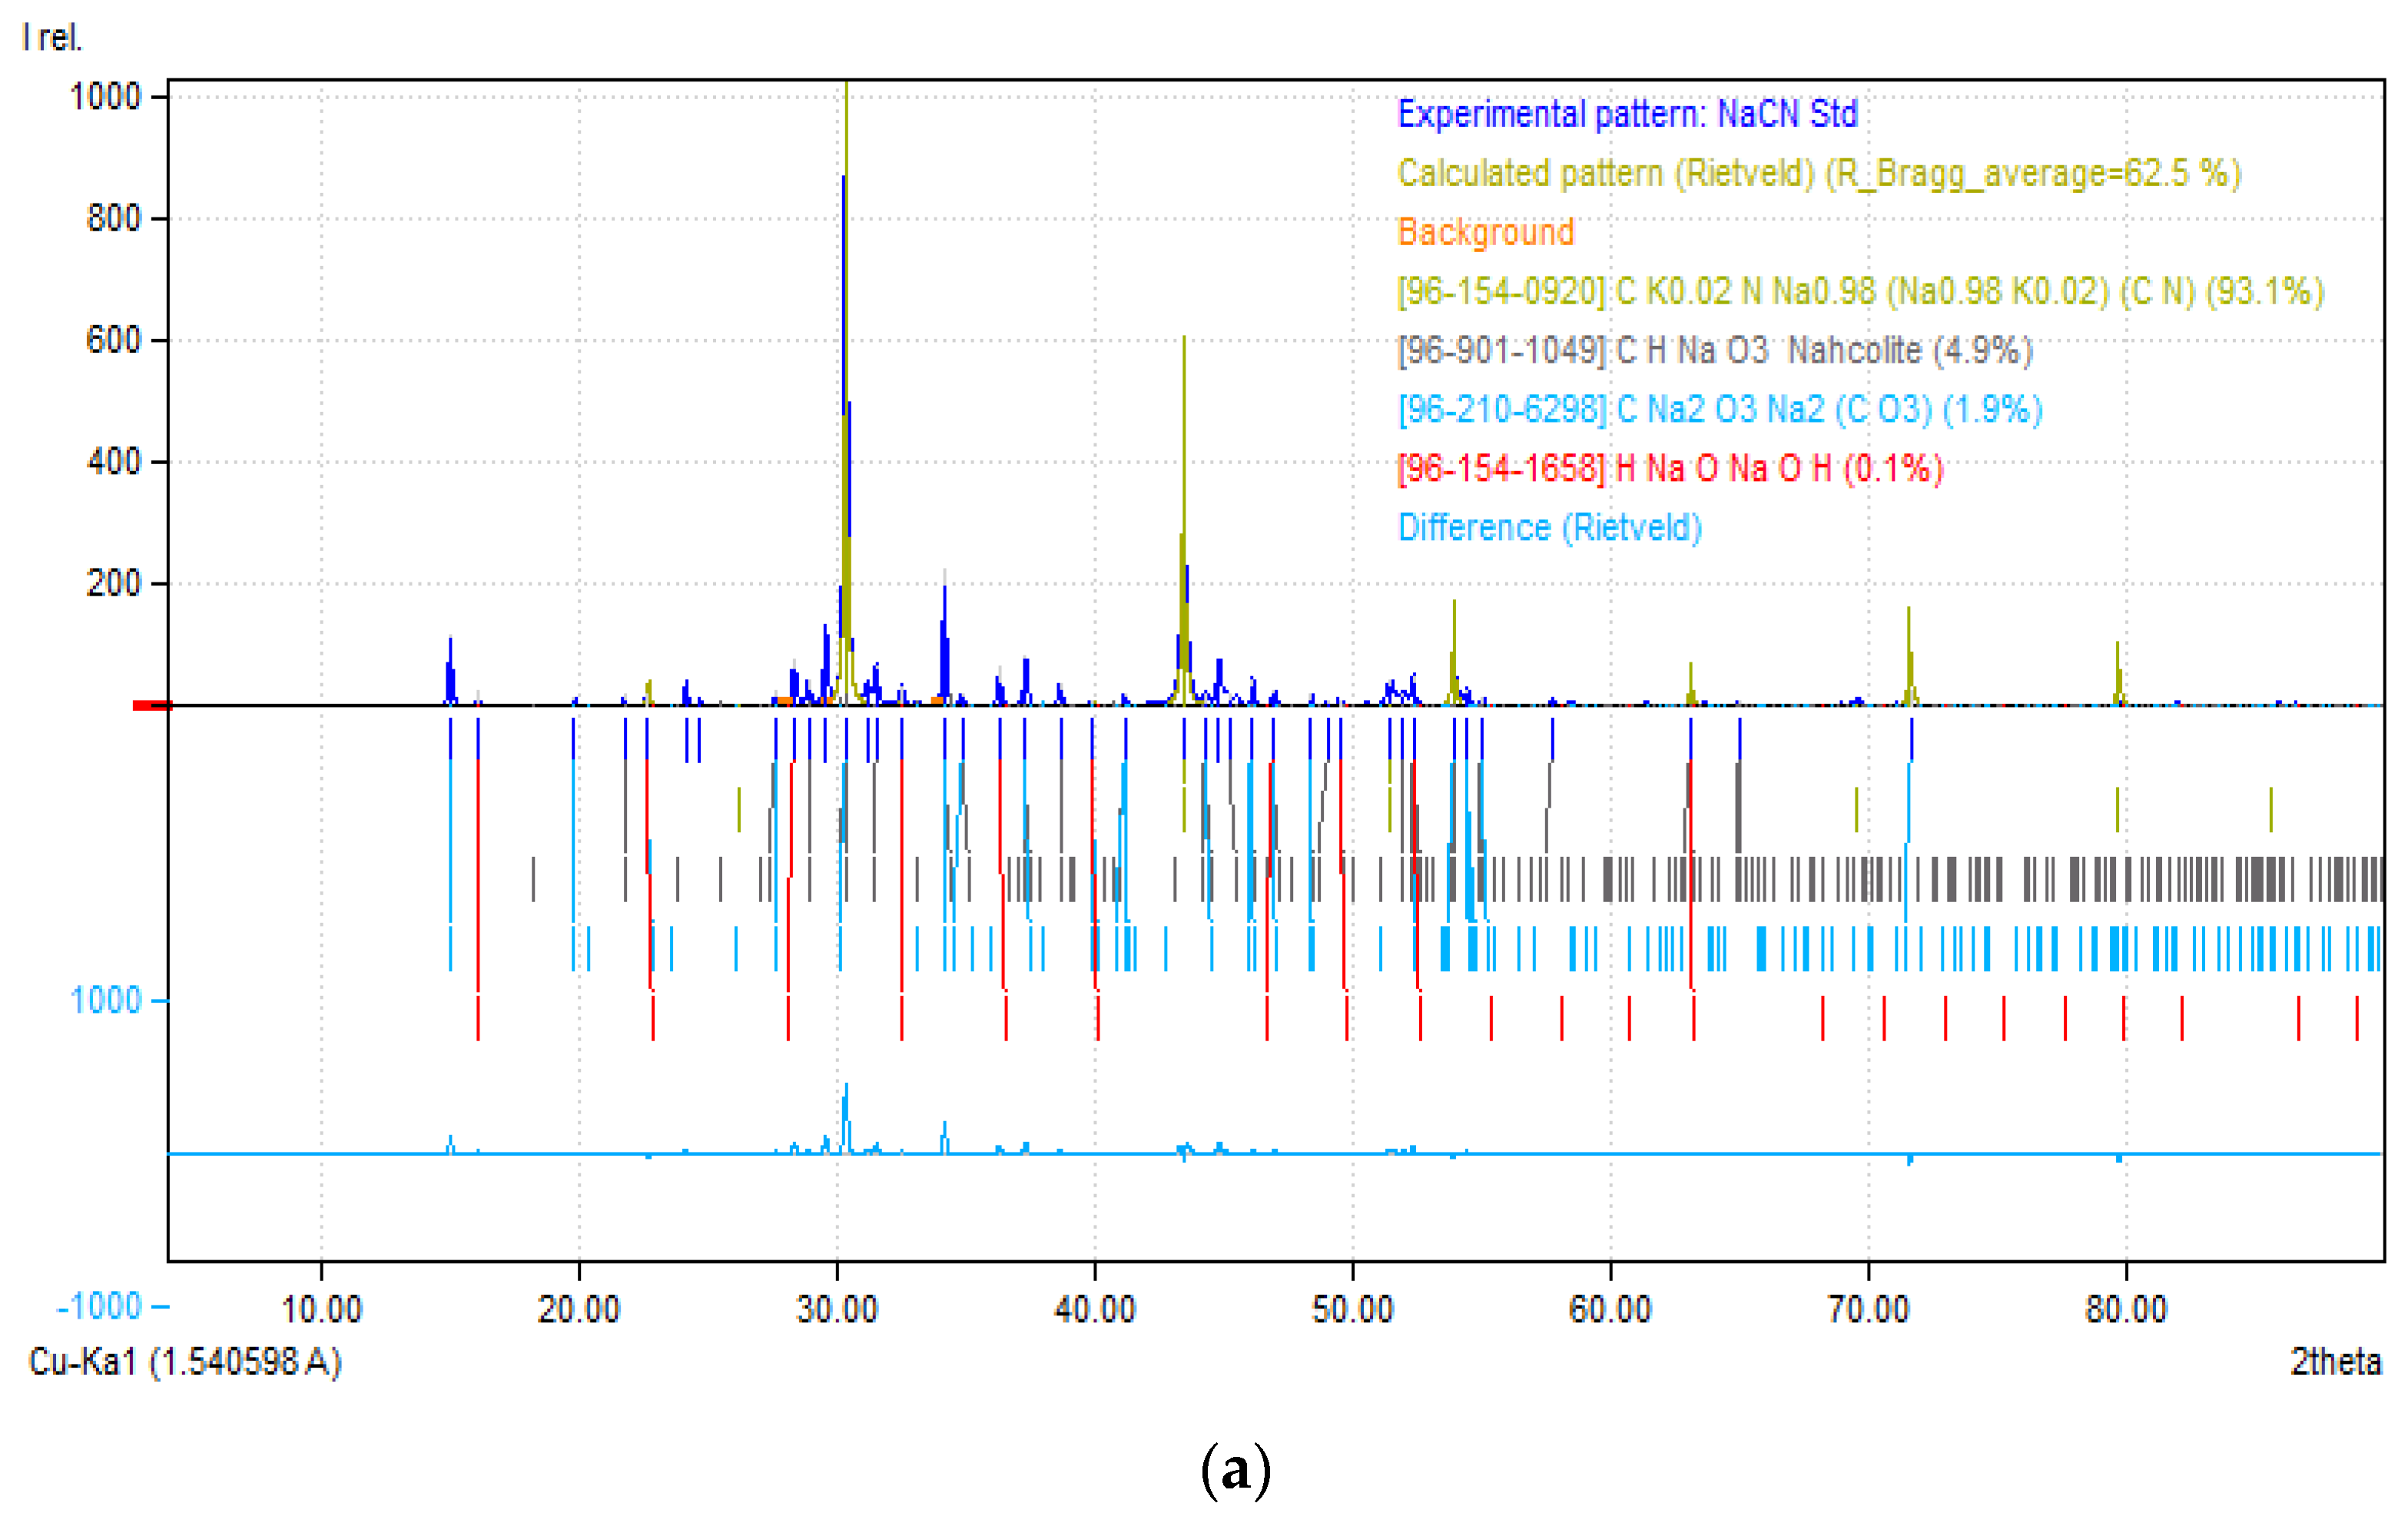
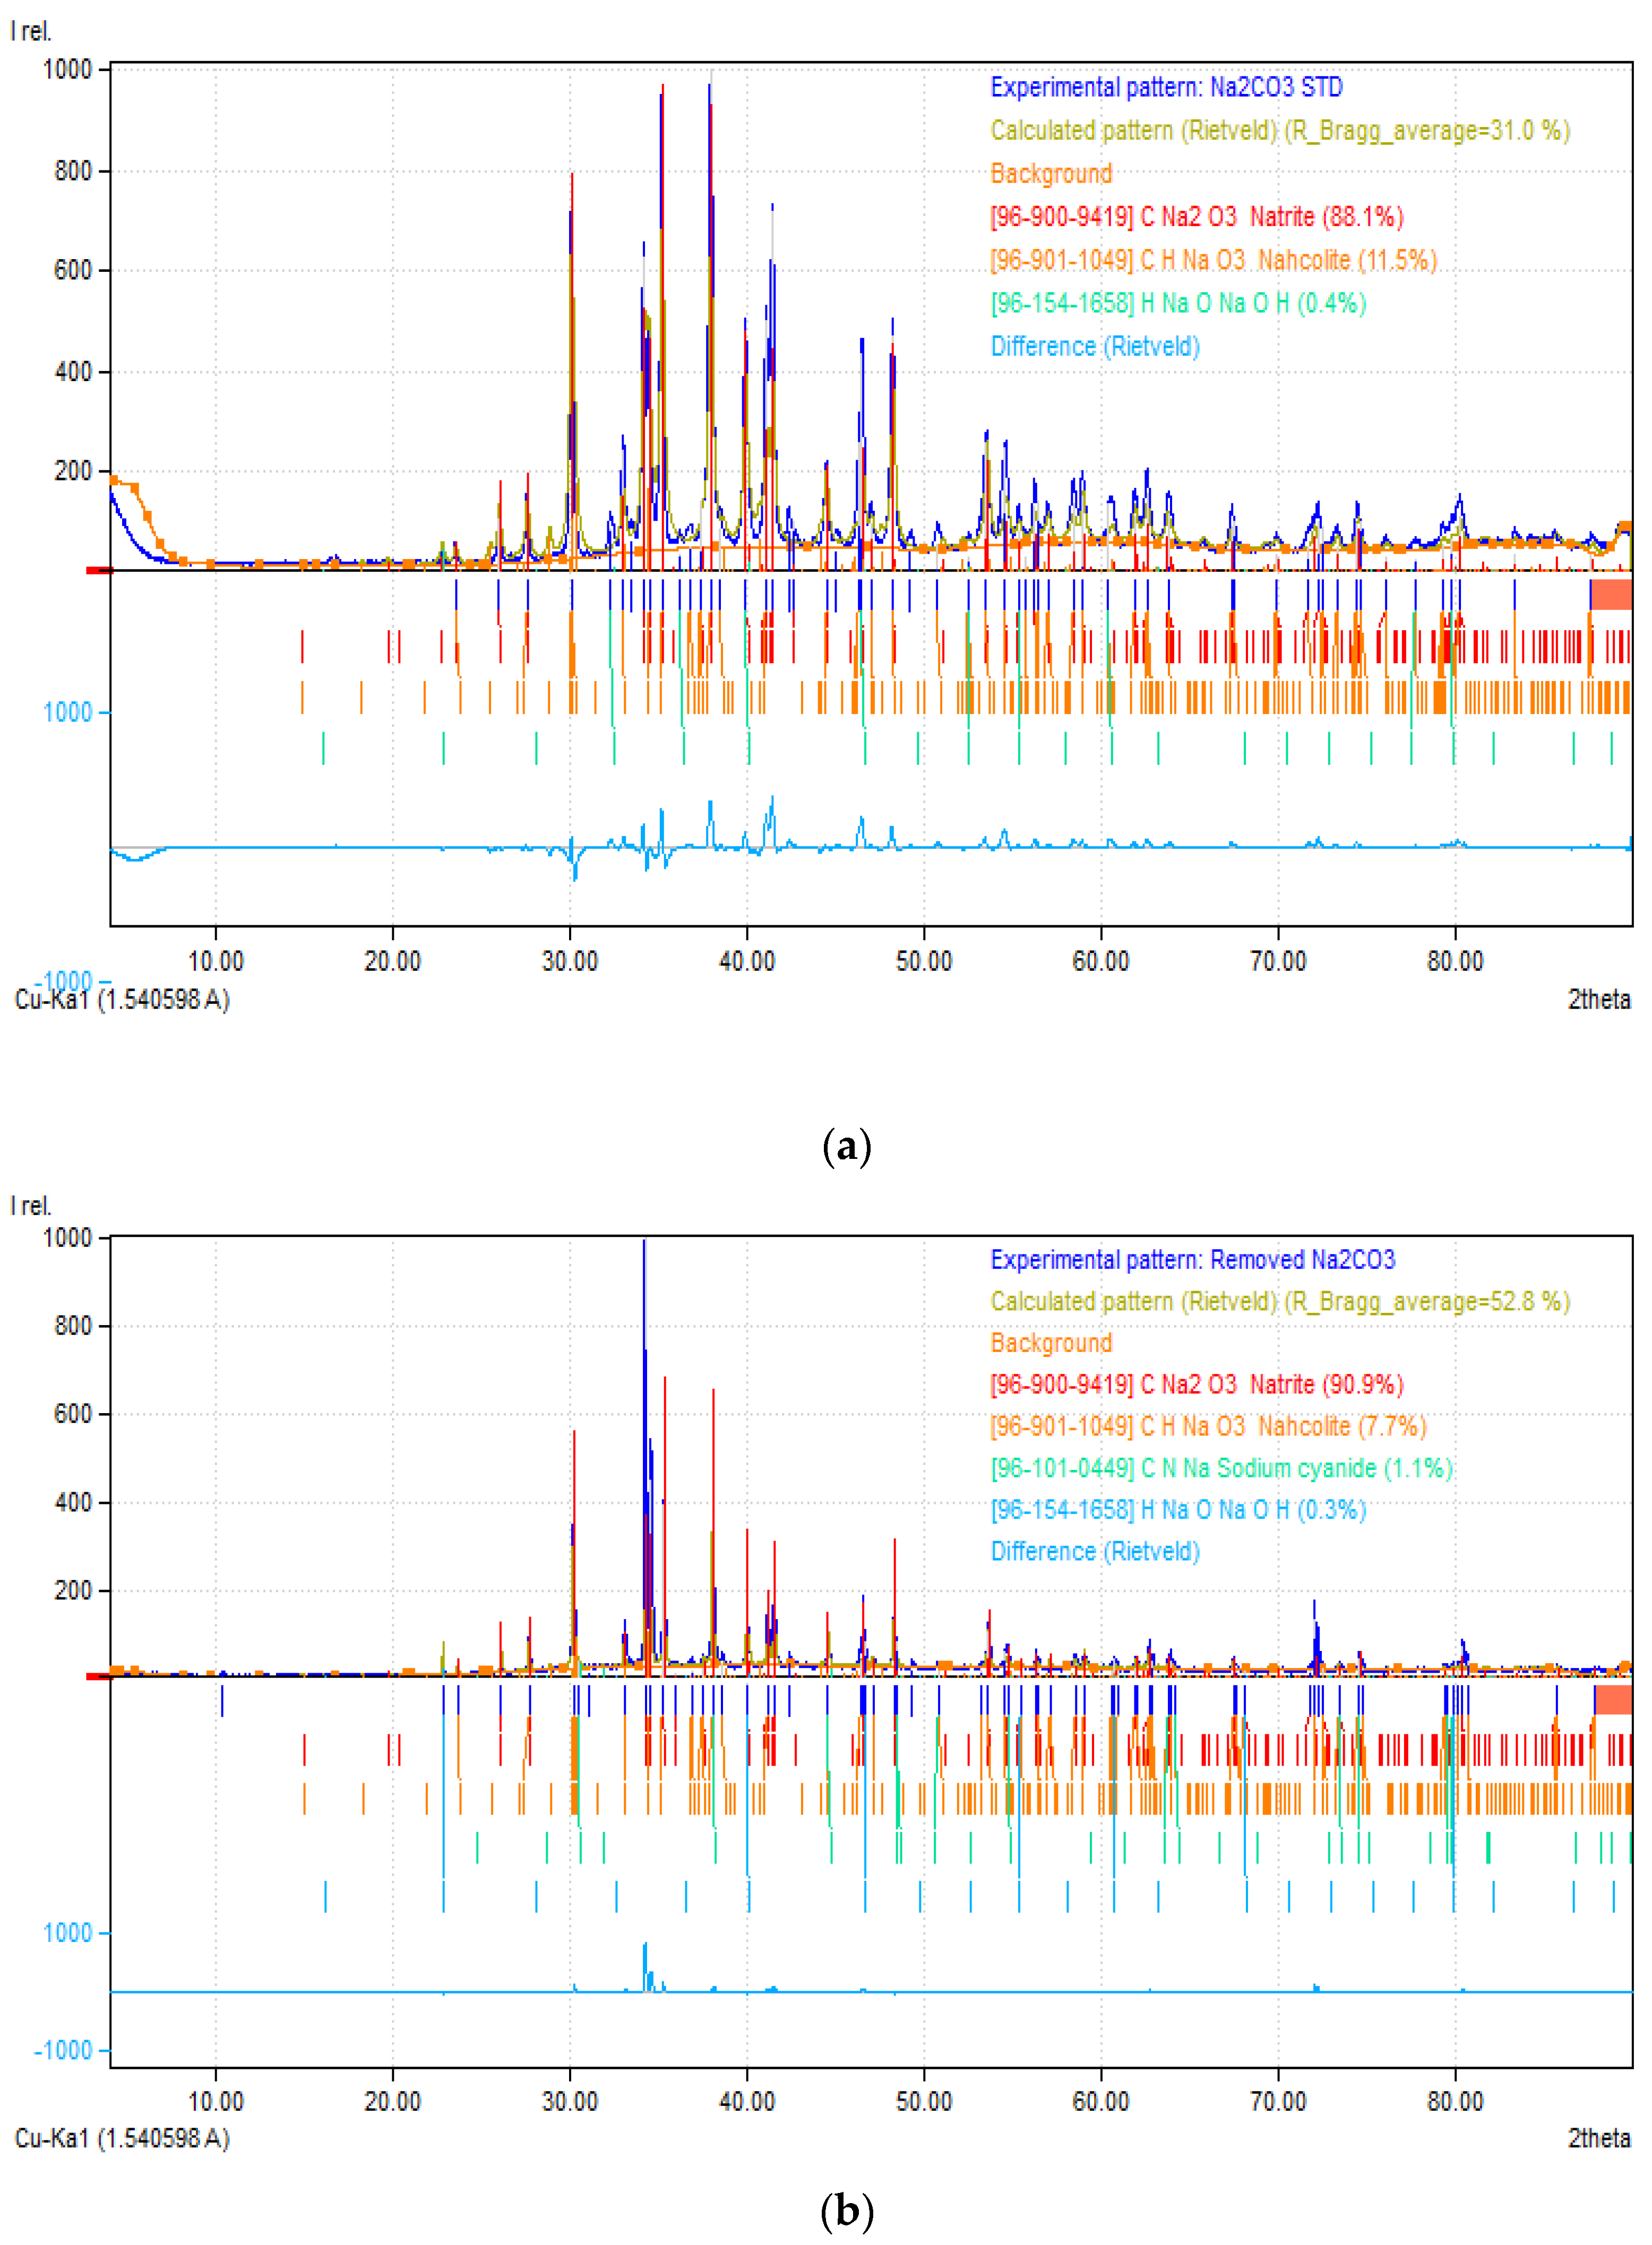
The XRD spectra were generated using the Match! 3 software. It allowed us to identify the different phases present in the NaCN and Na2CO3 samples. The quantitative phase analysis was done using the Rietveld analysis. Although the R Bragg average values were high, the quality fits that gave the best difference plots are displayed in Figure 15 and Figure 16.
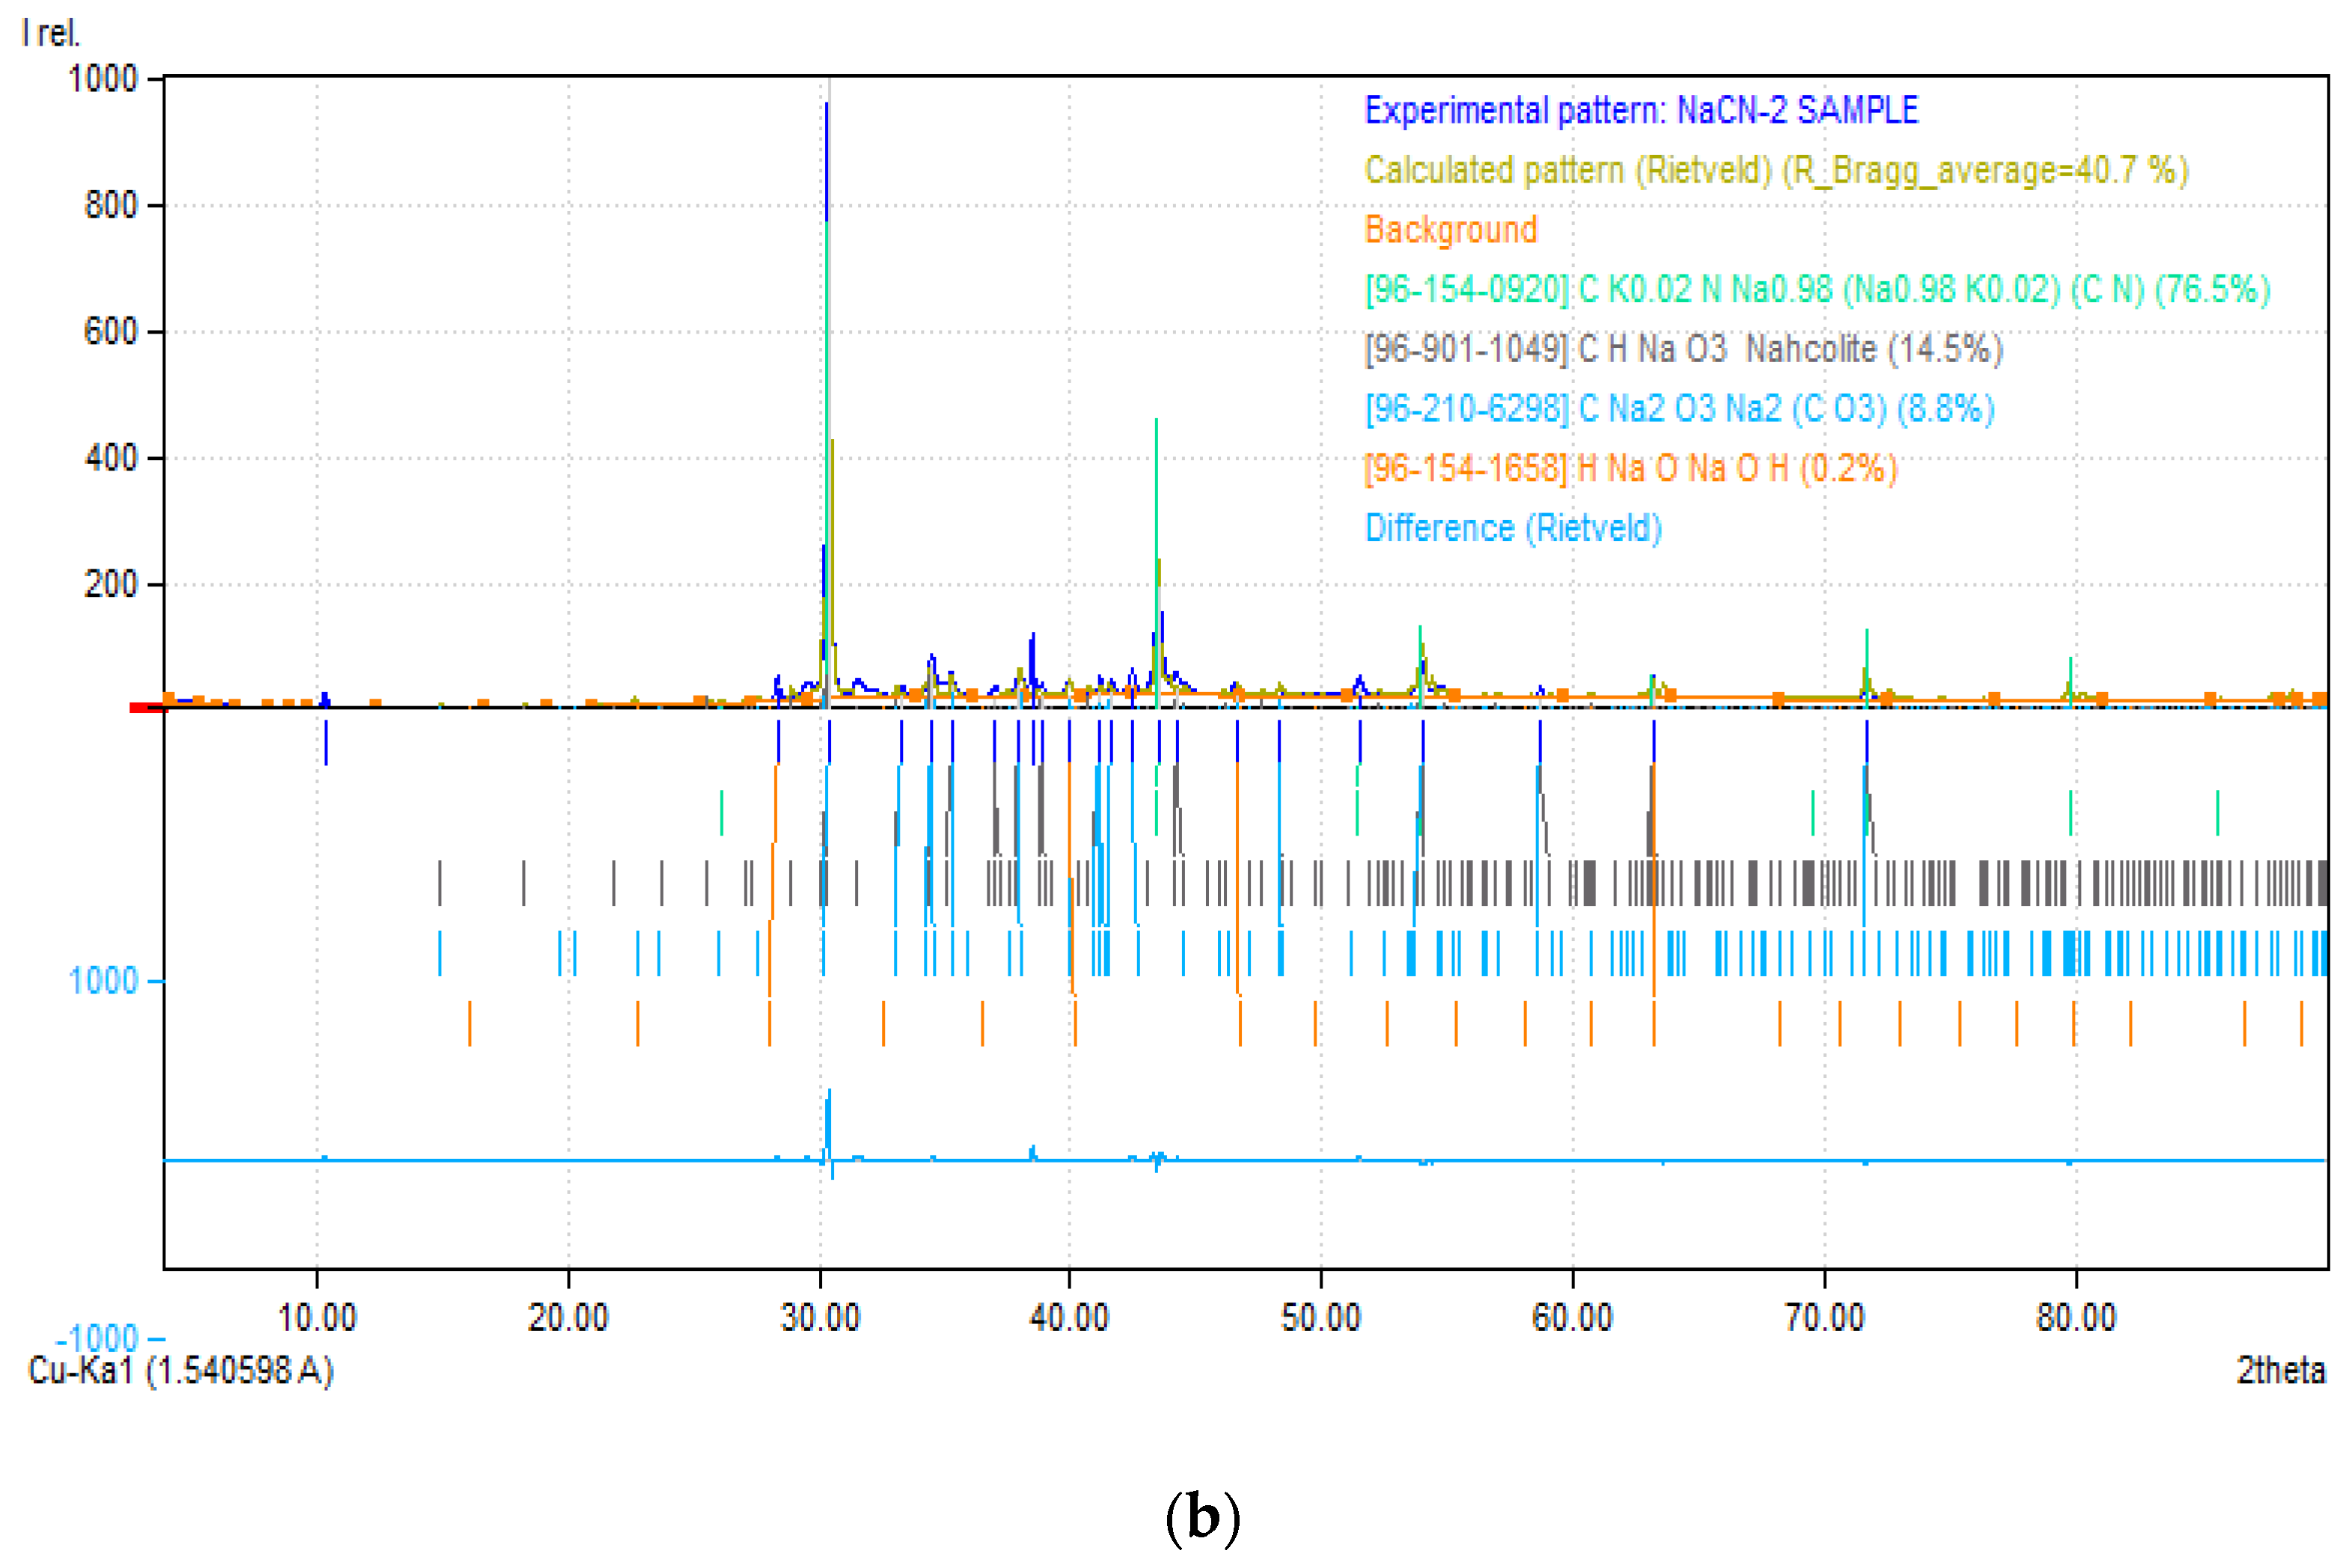
The X-ray diffraction patterns of control NaCN and green-NaCN, recorded at 2θ angles, are shown in Figure 15. Control NaCN (a) and green-NaCN (b) showed similar XRD patterns at (30.3622°, 30.4557°); (34.1697°, 34.3051°); (38.6422°, 38.5661°); (43.4601°, 43.5524°); (51.4398°, 51.5940°); (53.9323°, 54.0450°); (63.1456°, 63.2228°) and (71.6529°, 71.,7345°), respectively. The control NaCN phase strongly matched the sodium cyanide reference phase, ICDD 00-030-1187 (Sodium cyanide hydrate). The green-NaCN phase matched the sodium cyanide reference phase, ICDD 00-037-1490 (Sodium cyanide). The amount of NaCN was 93.1% in the control sample and 76.5% in the green-NaCN. In addition, the XRD pattern of green-NaCN confirmed that the synthesised NaCN had more carbonates (8.8% of Na2CO3 and 14.5% of NaHCO3) than the control sample, which only had 4.9% of Na2CO3 and 1.9% of NaHCO3. The sodium carbonate present in green-NaCN was matched to the reference phase, ICDD 00-037-0451 (Sodium carbonate). Both NaCN samples contained trace levels of NaOH (0.1% in the control sample and 0.2% in green-NaCN). These results further confirm the presence of Na2CO3, identified by NaCN ATR–FTIR and titration, as shown in Figure 12 and Table 2, respectively. The discrepancy in Na2CO3 and the NaOH concentration could have been caused by human error during titration, or the quality of fit during the Rietveld refinement fitting.
The visual inspection of the patterns displayed in Figure 15 indicates that the green-NaCN crystals are smaller than the ones from the control sample.
Figure 16 shows the XRD patterns of control Na2CO3 (a) and precipitated Na2CO3 (b) removed from the NaCN concentrated solution according to the method described in Section 2.2.6. The majority of peaks observed on the XRD pattern of precipitated Na2CO3 were similar to those appearing on the XRD pattern of the control sample. The following peaks from the control sample and precipitated Na2CO3 XRD patterns at 2θ angles are the ones with a noticeable intensity: (26.0488°, 26.1171°); (27.6403°, 27.6929°); (30.1267°, 30.2095°); (33.0273°, 33.1090°); (34.1899°, 34.2551°); (34.5083°, 34.5967°); (35.2238°, 35.2897°); (37.9650°, 38.0721°); (41.0923°, 41.1613°); (41.4807°, 41.5597°); (46.5246°, 46.6025°); (48.2568°, 48.3199°); (53.5670°, 53.6561°); (72.2691°, 72.0894°); (74.4908°, 74.5749°) and (80.3060°, 80.4246°), respectively. The control Na2CO3 phase strongly matched the sodium carbonate reference phase, ICDD 04-011-4108 (Sodium carbonate - Natrite), while the precipitated Na2CO3 was a strong match to the sodium carbonate reference phase, ICDD 05-001-0022 (Sodium carbonate - γ-form). In the control and precipitated samples, the carbonates were 88.1% and 90.9% of Na2CO3 and 11.5% and 7.7% of NaHCO3, respectively. Trace levels of NaOH were also found in the control sample (0.4%) and the precipitated sample (0.3%). The precipitated sample had 1.1% of NaCN. It originated from the residual green-NaCN solution remaining during the drying process (see Section 2.2.6). Both the green-NaCN and the precipitated Na2CO3 were found to be crystalline, with the former exhibiting a cubic crystal structure [28], while the latter had a monoclinic crystal structure.

3.4.3. Scanning Electron Microscopy with Energy-Dispersive X-ray Spectroscopy (SEM-EDS)

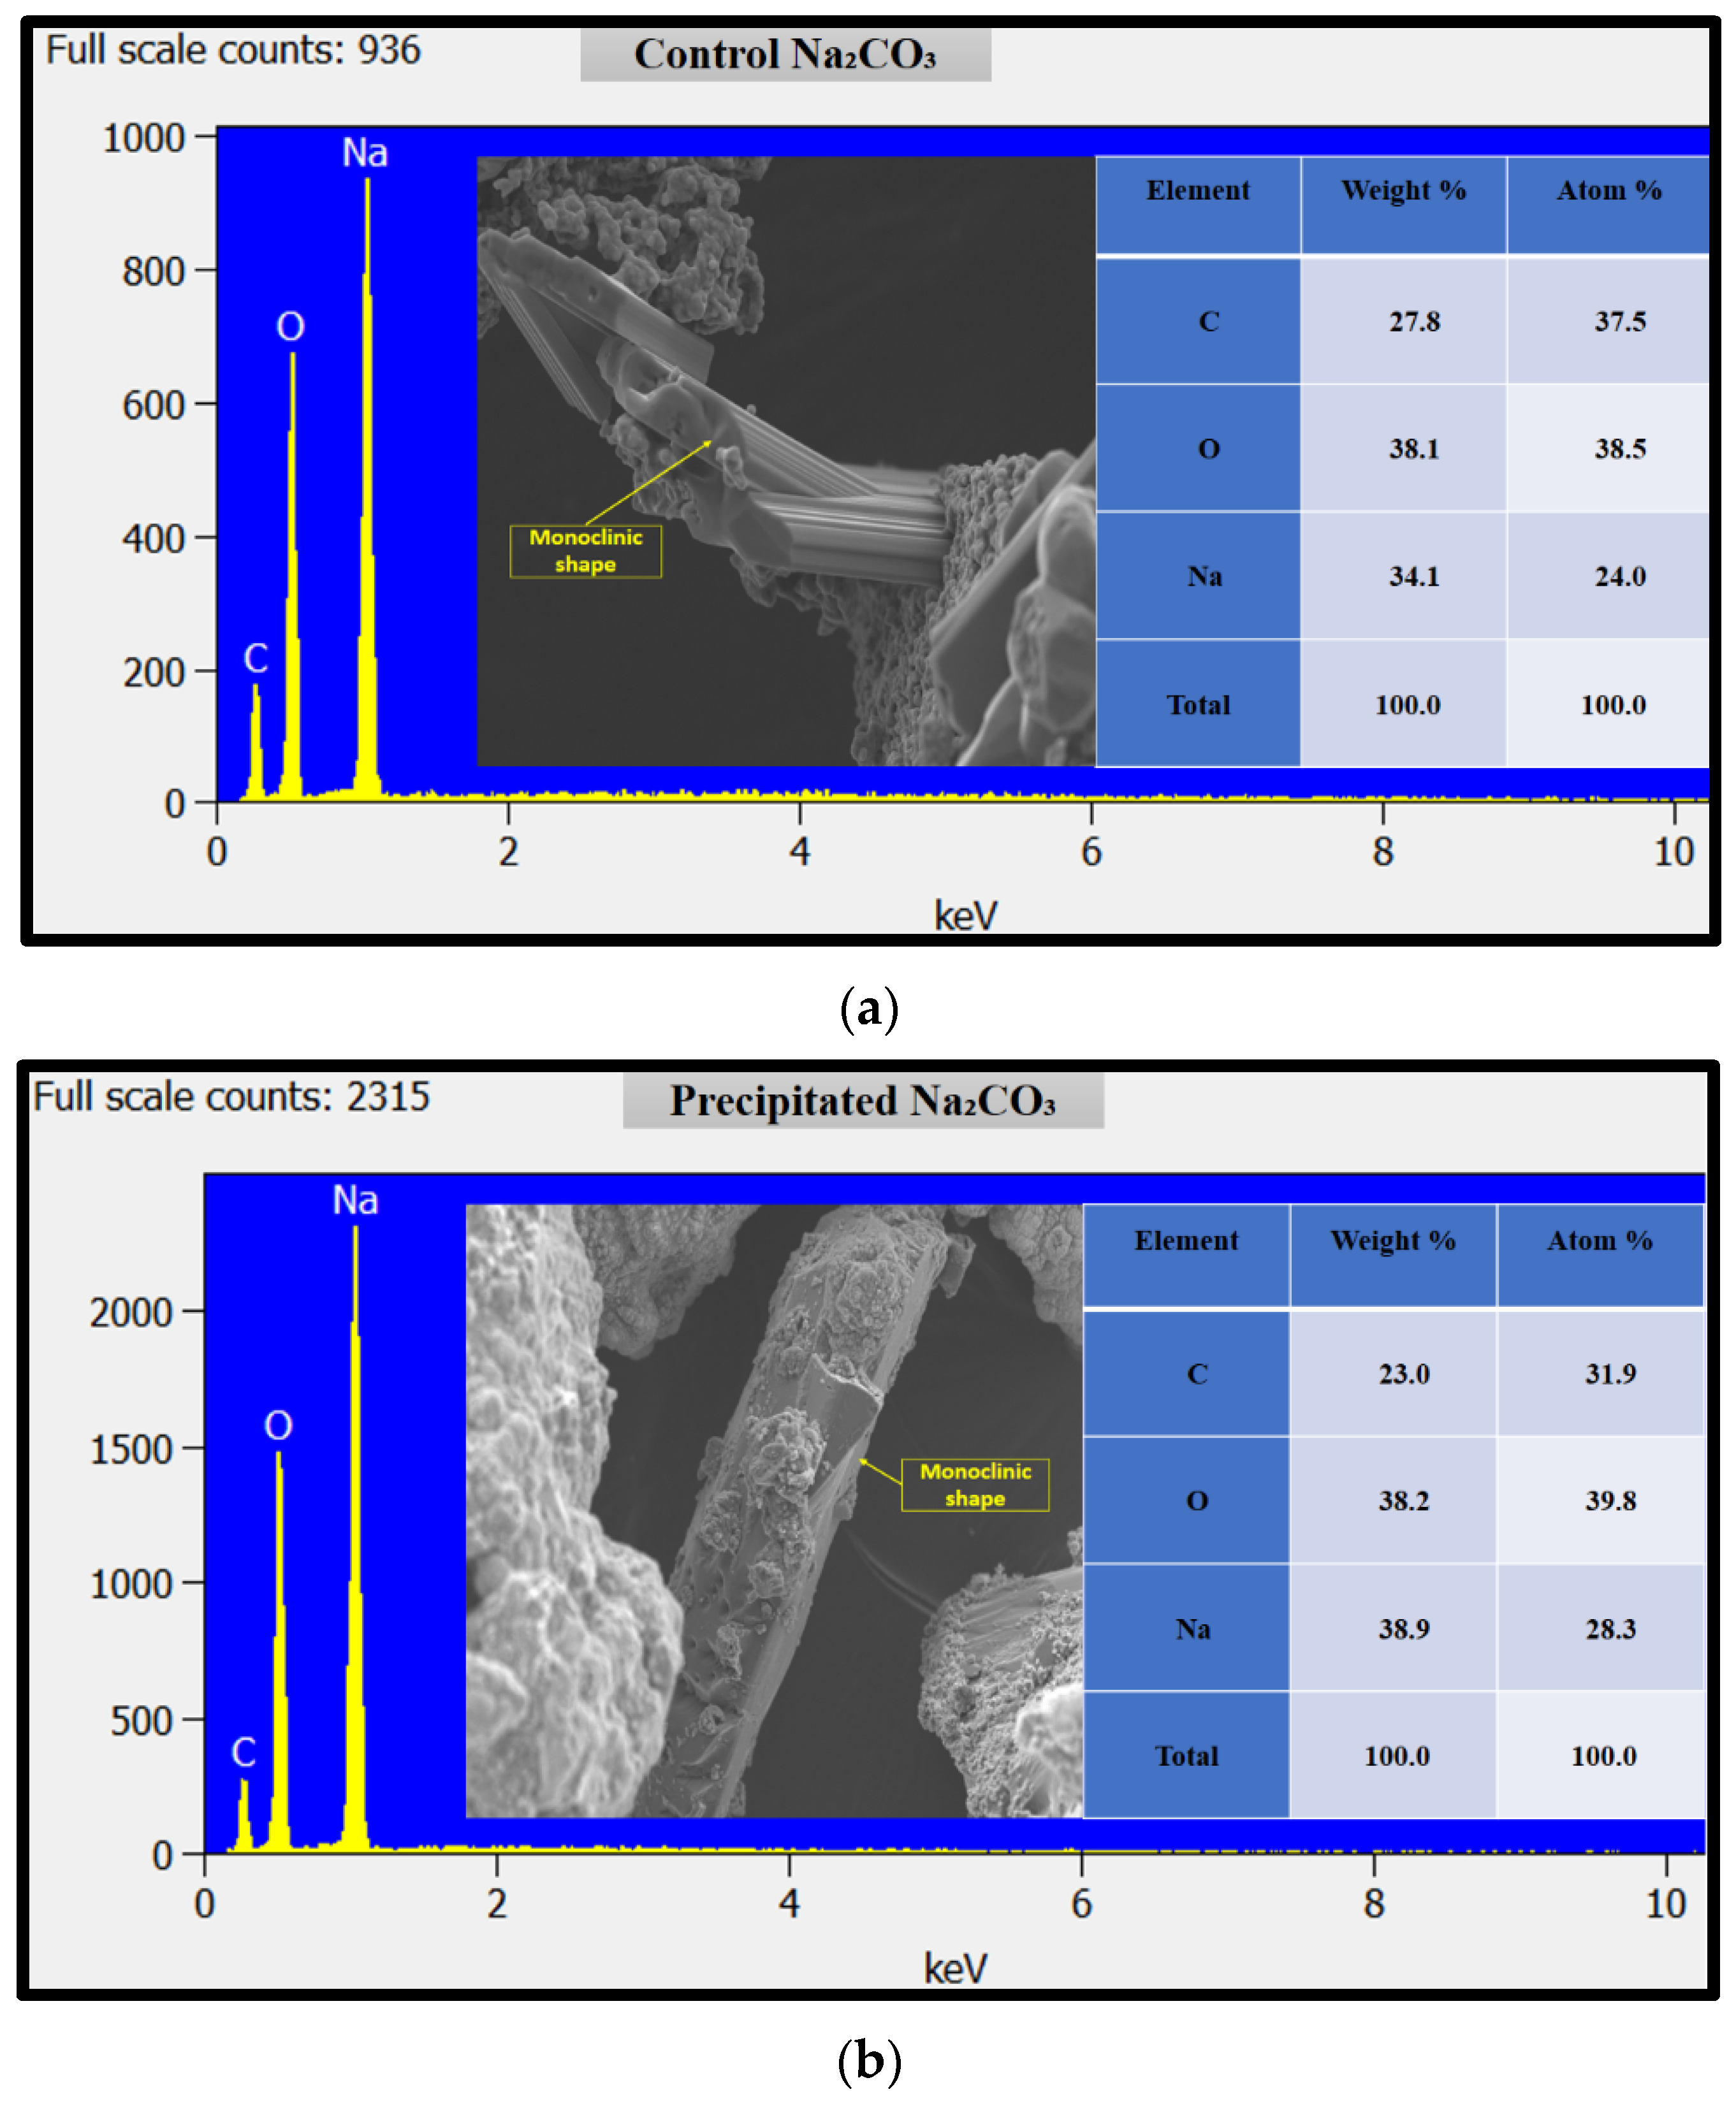
The ideal morphology of NaCN and Na2CO3 crystal is cubic and monoclinic, respectively. Figure 17 shows the morphology of control NaCN (a) and the product synthesised in this study (green-NaCN (b)). As can be seen, both control NaCN (Figure 17a) and green-NaCN (Figure 17b) exhibited a cubic shape with some monoclinic shape due to Na2CO3. The control Na2CO3 (Figure 18a) and precipitated Na2CO3 (Figure 18b), removed from the concentrated NaCN solution, were monoclinic. These results complement and confirm the findings of the ATR–FTIR and XRD analyses.
The EDS analysis was performed on synthesised salt to validate the production of NaCN by the suggested technique. Both NaCN and Na2CO3 were observed in the synthesised sample according to the EDS spectrum in Figure 17b. The same findings were obtained in the control sample (Figure 17a). In green-NaCN, the atomic percentages of sodium (Na), carbon (C), nitrogen (N), and oxygen (O) were 25.8, 32.3, 7.2, and 34.7, respectively. In control NaCN, their atomic % amounts were 12.2, 59.0, 16.3, and 12.5. There was also a negligible amount of aluminium impurities (0.1 atomic %) in the control NaCN. The spectra in Figure 17 also show that the NaCN crystals in the green-NaCN sample are smaller than in the control sample. Na, C, and O were found in 28.3, 31.9, and 39.8 atomic %, respectively, in the EDS spectra of precipitated Na2CO3 (Figure 18a). The EDS spectra of the control Na2CO3 (Figure 18b) indicated atomic % values of 24.0, 37.5, and 38.5 for Na, C, and O, respectively. As a result, the precipitated Na2CO3 may be used to make an alkaline picrate solution to test for cyanide (see Section 2.2.4). These data support and validate the findings of the ATR–FTIR and XRD analyses.

4. Conclusions

This paper described the successful production of sodium cyanide (green-NaCN) via the saturation of a NaOH absorbing solution using hydrogen cyanide (HCN) extracted from cassava leaves after 120 min of maceration at 30 °C and 45 min of extraction under vacuum at 35–40 °C. A total of 32.356 g of green-NaCN were produced from 15.70 kg of fresh cassava leaves, representing a percentage yield of 0.21%. The XRD data confirmed the formation of the NaCN crystals having a characteristic cubic structure. The SEM results complemented the latter finding. Moreover, confirming these findings, the EDS data also revealed that the control sample had an aluminium (Al) impurity. The ATR–FTIR results substantiated the synthesis of NaCN crystal, as depicted by a peak at 2090 cm−1 which was attributed to C≡N from inorganic cyanides. The obtained results also showed the presence of carbonates (Na2CO3 and NaHCO3) and NaOH impurities in both the standard and green-NaCN. Finally, based on the protocol established in this study, it can be concluded that it is possible to synthesise NaCN with minimal carbonate impurities if the following steps are taken: (I) limit the contact time between the NaOH absorbing solution and atmospheric CO2; (II) continue the saturation process well past the onset of plateauing of the NaCN concentration to decrease the residual NaOH content; (III) dry the NaCN slurry in an inert oven; (IV) degas the Milli-Q water before preparing the homogenate.

Author Contributions

The authors’ contributions during the research were as follows: Conceptualization, I.M., V.P., S.M. and O.Z.; Formal analysis, I.M., V.P., S.M. and O.Z.; Investigation, I.M.; Methodology, I.M., V.P., S.M. and O.Z.; Project administration, I.M., V.P., S.M. and O.Z.; Resources, I.M., V.P., S.M. and O.Z.; Supervision, V.P., S.M. and O.Z.; Validation, I.M., V.P., S.M. and O.Z.; Visualization, I.M., V.P., S.M. and O.Z.; Writing—original draft, I.M.; Writing—review and editing, V.P., S.M. and O.Z. All authors have read and agreed to the published version of the manuscript.

Funding

This research received no external funding.

Institutional Review Board Statement

Not applicable.

Informed Consent Statement

Not applicable.

Acknowledgments

The authors wish to extend their gratitude to the Durban University of Technology, the University of Johannesburg and the Council for Scientific and Industrial Research (Pretoria) for the use of their laboratories.

Conflicts of Interest

The authors declare no conflict of interest.

References

  1. European Centre for Ecotoxicology and Toxicology of Chemicals. Cyanides of Hydrogen, Sodium and Potassium, and Acetone Cyanohydrin (CAS No. 74-90-8, 143-33-9, 151-50-8 and 75-86-5); ECETOC: Brussels, Belgium, 2007; pp. 13–31. [Google Scholar]
  2. Attahdaniel, B.E.; Ebisike, K.; Adeeyinwo, C.E.; Adetunji, A.R.; Olusunle, S.O.O.; Adewoye, O.O. Production of Sodium Cyanide from Cassava Wastes. Int. J. Sci. Technol. 2013, 2, 707–709. [Google Scholar]
  3. Gail, E.; Gos, S.; Kulzer, R.; Lorösch, J.; Rubo, A.; Sauer, M.; Kellens, R.; Reddy, J.; Steier, N.; Hasenpusch, W. Cyano Compounds, Inorganic. In Ullmann’s Encyclopedia of Industrial Chemistry; Wiley-VCH Verlag GmbH & Co. KGaA: Weinheim, Germany, 2011; Volume 10, pp. 673–710. [Google Scholar]
  4. Deepa, H.A.; Raj, A.; Asha, P. Evaluation on Production and Economics of Acrylonitrile by Sohio Process. In Proceedings of the International Conference on Recent Trends in Engineering and Technologies, Mysuru, India, 13 March 2016. [Google Scholar]
  5. Attahdaniel, E.B.; Enwerem, P.O.; Lawrence, P.G.; Ofiwe, C.U.; Olusunle, S.O.O.; Adetunji, A.R. Green synthesis and characterization of sodium cyanide from cassava (Manihot esculenta CRANTZ). FTSTJ 2020, 5, 247–251. [Google Scholar]
  6. Davis, S.; Murray, J.; Katsiadaki, I. Cyanide in the Aquatic Environment and Its Metabolism by Fish; World Class Science for the Marine and Freshwater Environment, Ed.; Centre for Environment Fisheries & Aquaculture Science: Suffolk, UK, 2017; p. 72. [Google Scholar]
  7. Panou, M.; Gkelis, S. Cyano-assassins: Widespread cyanogenic production from cyanobacteria. bioRxiv 2020. [Google Scholar] [CrossRef]
  8. Bhalla, T.C.; Kumar, V.; Kumar, V. Microbial Remediation of Cyanides. In Bioremediation Current Research and Applications, 1st ed.; Ashok, D., Rathoure, K., Eds.; IK International: Delhi, India, 2017; p. 23. [Google Scholar]
  9. Ubwa, S.T.; Otache, M.A.; Igbum, G.O.; Shambe, T. Determination of Cyanide Content in Three Sweet Cassava Cultivars in Three Local Government Areas of Benue State, Nigeria. Food Sci. Nutr. 2015, 6, 1078–1085. [Google Scholar] [CrossRef] [Green Version]
  10. Zuk, M.; Pelc, K.; Szperlik, J.; Sawula, A.; Szopa, J. Metabolism of the Cyanogenic Glucosides in Developing Flax: Metabolic Analysis, and Expression Pattern of Genes. Metabolites 2020, 10, 288. [Google Scholar] [CrossRef] [PubMed]
  11. Bayitse, R.; Tornyie, F.; Bjerre, A.-B. Cassava cultivation, processing and potential uses in Ghana. In Handbook on Cassava; Klein, C., Ed.; Nova Science Publishers, Inc.: Hauppauge, NY, USA, 2017; p. 21. [Google Scholar]
  12. Omotayo, A.R.; EL-Ishaq, A.; Babatunde, A.S. Assessment of cyanide content in white, light yellow and deep yellow cassava Grit (Gari) sold in Damaturu Metropolis. Am. J. Food Sci. Health 2015, 1, 5. [Google Scholar]
  13. Nyirenda, K.K. Toxicity Potential of Cyanogenic Glycosides in Edible Plants. In Medical Toxicology; Erkekoglu, P., Ogawa, T., Eds.; IntechOpen: London, UK, 2021; pp. 1–19. [Google Scholar]
  14. Shackelford, G.E.; Haddaway, N.R.; Usieta, H.O.; Pypers, P.; Petrovan, S.O.; Sutherland, W.J. Cassava farming practices and their agricultural and environmental impacts: A systematic map protocol. Environ. Evid. 2018, 7, 30. [Google Scholar] [CrossRef] [Green Version]
  15. Spencer, D.S.C.; Ezedinma, C. Cassava cultivation in sub-Saharan Africa. In Achieving Sustainable Cultivation of Cassava Volume 1, 1st ed.; Burleigh Dodds Science Publishing: Cambridge, UK, 2017; pp. 123–148. [Google Scholar]
  16. Otekunrin, O.A.; Sawicka, B. Cassava, a 21st Century Staple Crop: How can Nigeria Harness Its Enormous Trade Potentials? Acta Sci. Agric. 2019, 3, 194–202. [Google Scholar] [CrossRef]
  17. Mudombi, C.R. An Ex-Ante Economic Evaluation of Genetically Modified Cassava in South Africa. Master’s Thesis, University of Pretoria, Pretoria, South Africa, 2010. [Google Scholar]
  18. Mabasa, K.G. Epidemiology of Cassava Mosaic Disease and Molecular Characterization of Cassava Mosaic Viruses and Their Associated Whitefly (Bemisia Tabaci) Vector in South Africa. Master’s Thesis, University of the Witwatersrand, Johannesburg, South Africa, 2007. [Google Scholar]
  19. Makwarela, M.; Rey, C. Cassava Biotechnology, a southern African perspective. Biotechnol. Mol. Biol. Rev. 2006, 1, 10. [Google Scholar]
  20. Cuvaca, I.B.; Eash, N.S.; Zivanovic, S.; Lambert, D.M.; Walker, F.; Rustrick, B. Cassava (Manihot esculenta Crantz) Tuber Quality as Measured by Starch and Cyanide (HCN) Affected by Nitrogen, Phosphorus, and Potassium Fertilizer Rates. J. Agric. Sci. 2015, 7, 36–49. [Google Scholar] [CrossRef] [Green Version]
  21. Srihawong, W.; Kongsil, P.; Petchpoung, K.; Sarobol, E. Effect of genotype, age and soil moisture on cyanogenic glycosides content and root yield in cassava (Manihot esculenta Crantz). Agric. Nat. Resour. 2015, 49, 13. [Google Scholar]
  22. Brito, V.H.S.; Ramalho, R.T.; Rabacow, A.P.M.; Moreno, S.E.; Cereda, M.P. Colorimetric method for free and potential cyanide analysis of cassava tissue. Gene Conserve 2009, 8, 1–11. [Google Scholar]
  23. Oshima, H.; Ueno, E.; Saito, I.; Matsumoto, H. Quantitative Determination of Cyanide in Foods by Spectrophotometry using Picric Acid Test Strips. Jpn. J. Food Chem. 2003, 10, 96–100. [Google Scholar]
  24. Asterion, A. Carbonates in the Plating Bath. Available online: https://asterionstc.com/2016/06/carbonates-plating-bath/ (accessed on 22 July 2021).
  25. Dusica, I.; Bojana, K.; Tea, B.; Radmilo, C.; Djuro, V.; Jovanka, L.; Slavica, S. Effect of microwave heating on content of cyanogenic glycosides in linseed. Ratar. Povrt. 2012, 49, 63–68. [Google Scholar] [CrossRef] [Green Version]
  26. Castada, H.Z.; Liu, J.; Ann Barringer, S.; Huang, X. Cyanogenesis in Macadamia and Direct Analysis of Hydrogen Cyanide in Macadamia Flowers, Leaves, Husks, and Nuts Using Selected Ion Flow Tube-Mass Spectrometry. Foods 2020, 9, 174. [Google Scholar] [CrossRef] [PubMed] [Green Version]
  27. Nandiyanto, A.B.D.; Oktiani, R.; Ragadhita, R. How to Read and Interpret FTIR Spectroscope of Organic Material. Indones. J. Sci. Technol. 2019, 4, 97–118. [Google Scholar] [CrossRef]
  28. Tesleva, E.P.; Gil, L.B.; Solovyan, A.V. Thermodeformational Behavior of Cubic Crystals of Sodium Cyanide. In Proceedings of the VII International Scientific Practical Conference “Innovative Technologies in Engineering”, Yurga, Russia, 19–21 May 2016. [Google Scholar]
Scheme 1. Preparation of sodium cyanide via the Castner process.
Suschem 03 00020 sch001
Scheme 2. Preparation of sodium cyanide via the neutralisation process.
Suschem 03 00020 sch002
Scheme 3. Preparation of hydrogen cyanide via the Andrussow process.
Suschem 03 00020 sch003
Scheme 4. Preparation of hydrogen cyanide via the BMA process.
Suschem 03 00020 sch004
Scheme 5. Preparation of hydrogen cyanide via the Shawinigan process.
Suschem 03 00020 sch005
Scheme 6. Preparation of hydrogen cyanide (by-product) via the Sohio process.
Suschem 03 00020 sch006
Figure 1. Structures of cyanogenic glucosides found in cassava.
Suschem 03 00020 g001
Scheme 7. Hydrolysis of cyanogenic glucoside (cyanogenesis).
Suschem 03 00020 sch007
Figure 2. Preparation of cassava homogenate.
Suschem 03 00020 g002
Figure 3. Recovery of hydrogen cyanide under vacuum at 35–40 °C.
Suschem 03 00020 g003
Scheme 8. Formation of sodium isopurpurate [23].
Suschem 03 00020 sch008
Figure 4. Samples preparation for UV analysis.
Suschem 03 00020 g004
Figure 5. Steps of the drying process.
Suschem 03 00020 g005
Figure 6. Concentrations of HCN (mg/kg) obtained after 45 min of extraction under vacuum at 35–40 °C and analysed, as depicted in Figure 4, after maceration (n = 4) of cassava leaves at 30 °C for different times (Symbols ●, ■, ♦, and ▲ represent maceration time of 60, 120, 180 and 240 min, respectively).
Suschem 03 00020 g006
Figure 7. Concentrations of HCN (mg/kg) obtained after 45 min of extraction under vacuum at 35–40 °C and analysed, as depicted in Figure 4, after maceration (n = 4) of cassava leaves for 120 min at different temperatures (Symbols ●, ■, and ♦ represent maceration temperature of 18, 30 and 37 °C, respectively).
Suschem 03 00020 g007
Figure 8. Experimental setup of the recovery study.
Suschem 03 00020 g008
Figure 9. HCN recovered (%) at different times under vacuum at 35–40 °C after maceration (n = 4) of cassava leaves at 30 °C for 120 min.
Suschem 03 00020 g009
Figure 10. Preparation of NaCN solution by saturation of 3.6740 mol/L NaOH absorbing solution over time with HCN gas extracted for 45 min under vacuum at 35–40 °C from cassava leaves after 120 min of maceration at 30 °C.
Suschem 03 00020 g010
Figure 11. Typical standard calibration curve for spectrophotometric determination of HCN.
Suschem 03 00020 g011
Figure 12. Typical absorption spectra of cyanide standards and the sample obtained from the proposed method.
Suschem 03 00020 g012
Figure 13. ATR–FTIR spectra of sodium cyanide (NaCN).
Suschem 03 00020 g013
Figure 14. ATR–FTIR spectra of sodium carbonate (Na2CO3).
Suschem 03 00020 g014
Figure 15. X-ray diffraction patterns of (a) control NaCN and (b) green-NaCN.
Suschem 03 00020 g015aSuschem 03 00020 g015b
Figure 16. X-ray diffraction patterns of (a) control Na2CO3 and (b) precipitated Na2CO3.
Suschem 03 00020 g016
Figure 17. SEM images and EDS spectra of (a) control NaCN and (b) green-NaCN.
Suschem 03 00020 g017
Figure 18. SEM images and EDS spectra of (a) control Na2CO3 and (b) precipitated Na2CO3.
Suschem 03 00020 g018
Table 1. The various concentrations, % recovered and % RSD values for HCN recovery from cassava leaves after 120 min of maceration (n = 4) at 30 °C and extraction under vacuum for 35–40 °C for 30, 45 and 60 min.
Initial HCN concentration (mg/kg) *
Run 1Run 2Run 3Run 4
581.40784.86414.01317.96
Final/recovered HCN concentration (mg/kg)
Run 1Run 2Run 3Run 4
30 min extraction574.19756.18406.24309.98Average % recovered% RSD
Recovery (%)98.7696.3598.1297.4997.681.05
45 min extraction571.22766.26403.56317.17Average % recovered% RSD
Recovery (%)98.2597.6397.4799.7598.281.06
60 min extraction568.38761.29394.72305.62Average % recovered% RSD
Recovery (%)97.7697.0095.3496.1296.551.09
* The cassava leaves used for each run did not come from the same batch.
Table 2. Estimation of Na2CO3 and residual NaOH in standard and green-NaCN.
Sample
Aliquot (mL)
Burette Reading
(mL)
Titrant Used for NaOH and Half of Na2CO3 (mL)Titrant Used for NaOH and Na2CO3 (mL)Titrant Used for HCO3
(mL)
Titrant Used for Na2CO3 (mL)Titrant Used for NaOH (mL)
Initial Volume1st Endpoint2nd Endpoint
V1V2V3V4 = (V2 − V1)V5 = (V3 − V1)V6 = (V5 − V4)Va = 2V6Vb = (V5 − 2V6)
Titration of 2.6408 mol/L control NaCN solution
250.004.47 ± 0.015.00 ± 0.014.47 ± 0.015.00 ± 0.010.53 ± 0.001.05 ± 0.013.95 ± 0.01
Titration of 2.6408 mol/L green-NaCN solution
250.0017.52 ± 0.0220.25 ± 0.0217.52 ± 0.0220.25 ± 0.022.74 ± 0.015.47 ± 0.0214.78 ± 0.02
Estimation of Na2CO3 and residual NaOH
Na2CO3Residual NaOH
Control NaCN solutionGreen-NaCN solutionControl NaCN solutionGreen-NaCN solution
Molarity (mol/L)0.057460.21650.43231.1699
Strength (g/L)6.090222.946817.292046.7960
Percentage (% w/v)0.612.291.734.68
Table 3. The % yield of NaCN salt obtained from different cassava samples.
Cassava SampleMethod Used to Extract Cyanogenic GlucosidesReference
Fresh LeavesFresh PeelsFresh Tuber TissueFresh Whole Tuber TissueDried LeavesDried PeelsDried Whole Tuber
5.685.505.905.274.614.275.11Acid hydrolysis[2]
-10.0810.069.46---Acid hydrolysis[5]
-5.505.863.92---Direct hydrolysis (Deionised water)
0.21------Direct hydrolysis (Deionised water)This study
Publisher’s Note: MDPI stays neutral with regard to jurisdictional claims in published maps and institutional affiliations.