Abstract
Current prediction models for patients with ostosarcoma are restricted to predictions from a single, static point in time, such as diagnosis or surgery. These approaches discard information which becomes available during follow-up and may have an impact on patient’s prognosis. This study aims at developing a dynamic prediction model providing 5-year overall survival (OS) predictions from different time points during follow-up. The developed model considers relevant baseline prognostic factors, accounting for where appropriate time-varying effects and time-varying intermediate events such as local recurrence (LR) and new metastatic disease (NM). A landmarking approach is applied to 1965 patients with high-grade resectable osteosarcoma from the EURAMOS-1 trial (NCT00143030). Results show that LR and NM negatively affected 5-year OS (HRs: 2.634, 95% CI 1.845–3.761; 8.558, 95% CI 7.367–9.942, respectively). Baseline factors with strong prognostic value (HRs > 2) included poor histological response (≥10% viable tumor), axial tumor location, and the presence of lung metastases. The effect of poor versus good histological response changed over time, becoming non-significant from 3.25 years post-surgery onwards. This time-varying effect, as well as the strong impact of disease-related time-varying variables, show the importance of including updated information collected during follow-up in the model to provide more accurate survival predictions.
1. Introduction
Osteosarcoma is the most common primary bone cancer and mainly affects children, adolescents, and young adults [,,]. Since the mid-1980s, little progress has been made in improving the survival of patients diagnosed with osteosarcoma [,,]. Current management strategies combine neoadjuvant multi-agent chemotherapy, surgical removal of the primary tumor and, if resectable, all metastatic disease, followed by adjuvant chemotherapy [].
In 2001, the EURAMOS (European and American Osteosarcoma Studies) collaboration was established, with the purpose of pooling resources and facilitating the study of osteosarcoma []. Recruitment for the first trial—the EURAMOS-1 clinical trial (NCT00143030)—took place from 2005 to 2011 yielding a total of 2260 patients, a subset of which (1334) were randomized to treatment []. The effect of various prognostic factors on event-free and overall survival has previously been examined for this trial [,,]. Analyses, however, have been restricted to the randomized patient cohorts [,] and/or limited to considering factors set at diagnosis or at baseline [,,]. A recent re-analysis based on multistate models quantified the impact of experiencing specific disease stages (e.g., the development of local recurrence or metastatic disease), conditional on prior events and patient characteristics []. Multistate model estimation, however, is in practice limited to transitions with a sufficient number of events per predictor category.
In this study, an alternative analysis of the EURAMOS-1 data is proposed using a dynamic prediction model developed trough a landmarking approach [,]. Three main advantages of a dynamic prediction model can be distinguished. First, a notable drawback of classic survival models is that predictions are made from baseline—i.e., the start of follow-up—and that all covariates are also considered at baseline and assumed to have a constant effect on patient survival. Dynamic prediction models consider various prediction time points, , making it possible to obtain predictions for patients who have survived for a given time since the start of follow-up. For example, a patient who has already survived for three years may be expected to have a different prognosis than a patient who has been observed to survive for only one year. Second, a time effect can also be ascribed to covariates measured at baseline. For instance, a covariate may have a stronger effect at the beginning of follow-up. Dynamic prediction models offer a third and final advantage in the potential for the inclusion of time-varying covariates, allowing one to model the effect of various events occurring after the start of follow-up. This makes it possible to update a patient’s prognosis given the occurrence of an intermediate event, such as a local recurrence or new metastatic disease. Such intermediate events are relevant in survival prediction yet cannot be included in a straightforward Cox regression []. The relevance of a dynamic prediction model has previously been demonstrated in other oncological studies, such as for breast cancer [] and high-grade soft tissue sarcoma [,].
The primary aim of this study was to develop a dynamic prediction model capable of providing 5-year overall survival (OS) predictions from various specific time points (up until 5 years after surgery). The landmark model, built using the full EURAMOS-1 cohort of patients who underwent surgery, incorporates baseline factors along with evolving disease-related variables and accounts for time-varying covariate effects. Patients characterized by specific characteristics are employed to illustrate the outcomes of the prediction model.
2. Materials and Methods
2.1. Study Design
The EURAMOS collaboration was established in 2001 between the Children’s Oncology Group (COG), the Cooperative Osteosarcoma Study group (COSS), the European Osteosarcoma Intergroup (EOI), and the Scandinavian Sarcoma Group (SSG) []. From 2005 to 2011, a total of 2260 patients aged 40 or younger with a newly diagnosed resectable osteosarcoma were recruited in the EURAMOS-1 clinical trial (NCT00134030) []. Patients underwent neadjuvant chemotherapy prior to resection of the primary tumor. Histological response was assessed in the resected specimen and classified as poor (≥10% viable tumor) or good (<10% viable tumor). In total, 1334 (59%) patients were randomized for treatment: patients with a poor histological response received MAP (methotrexate, doxorubicin, cisplatin) or MAPinf (MAP plus ifosfamide and etoposide), while patients with a good histological response were allocated MAP or MAPIE (MAP by pegylated interferon). An extensive description of the trial and treatment protocol has been provided previously []. The primary analysis found no beneficial effect of experimental treatment in either group [,].
2.2. Patients and Variables
Of the total 2260 patients registered to EURAMOS-1, a subset of 1965 patients (87%) was considered eligible for the analysis (Figure 1). The 295 (13%) excluded patients met one or more of the following criteria: (1) a local recurrence or new metastatic disease recorded prior to the date of primary surgery; absence of (2) a surgery date or (3) follow-up; and (4) non-randomization due to progression of metastatic disease, the development of a new metastatic disease, or the presence of an unresectable disease. As no benefit of experimental treatment was found in the primary analysis [,], both randomized and non-randomized patients were included in the analysis in order to make the best use of the available data.
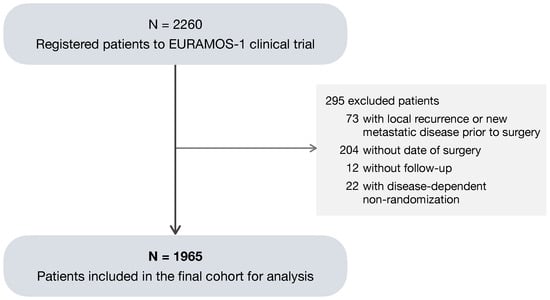
Figure 1.
Consort diagram of patients included in the analysis.
The EURAMOS-1 trial data include predictor measurements and records of intermediate events observed during follow-up. Ten predictors of interest were selected for the analysis. Predictors measured at baseline included age at primary surgery (years), sex (male, female), tumor location (proximal femur/humerus, axial, other), absolute tumor volume (cm3), surgical excision as reported by the pathologist (wide/radical, marginal, intralesional/unknown), the presence of lung metastases (no, yes/possible), the presence of other metastases (no, yes/possible), and histological response as assessed in the resected specimen of the primary tumor (good: <10% viable tumor; poor: ≥10% viable tumor). Three age groups were defined according to the classification introduced by Collins et al. []: child (male: 0–12 years; female: 0–11 years), adolescent (male: 13–17 years; female: 12–16 years), and adult (male: 18 or older; female: age 17 years or older). Tumor location (proximal femur/humerus, axial, other) was defined according to the definition used in previous analyses of survival and prognosis in the EURAMOS-1 trial [] by pooling study variables “site” (femur, tibia, fibula, humerus, radius, ulna, scapula/clavicle, pelvis/sacrum, rib, spine, other) and “location” (proximal, diaphysis, distal, N/A not long bone). A good histological response and the presence of metastases have previously been found to be associated with improved and decreased survival, respectively [,,,,,]. In addition to baseline covariates, the disease-related intermediate events of (i) local recurrence (LR) of the primary tumor and (ii) occurrence of a new metastatic (NM) disease were included in the model developed in this study as time-varying binary covariates (no, yes). By combining these two time-varying covariates for LR and NM, four different time-varying patient disease statuses can be obtained: a patient experienced (1) no intermediate event, (2) only local recurrence, (3) only new metastatic disease, or (4) both.
2.3. Statistical Analysis
Overall survival (OS) was measured in years since date of surgery. The reverse Kaplan–Meier method [] was used to estimate median OS. The effects of risk factors on dynamic OS were evaluated by employing a proportional landmark supermodel [,] to dynamically predict the 5-year probability of death at different prediction time points during follow-up. Dynamic prediction can be defined as the making of a prediction at a specific time, named landmark time point , given the entire history of events and covariates up to that time. This is carried out by selecting all the individuals at risk at that time and using solely the information available at that specific time point to make the prediction. For each landmark time point, , a Cox proportional hazards model [] is estimated using all patients alive and in follow-up at time, . All these individual Cox models are subsequently combined into a single landmark supermodel, which can make predictions at a range of time points for a set prediction window [,]. For this analysis, landmark time points were chosen in increments of 3 months from 0 to 5 years after surgery. For the time-varying covariates LR and NM, the patient status was updated at each landmark time. The remaining prognostic factors, measured at time of surgery (baseline), were kept constant. A prediction window w of 5 years was defined with the purpose of obtaining the 5-year death probabilities as predicted at different times in the first 5 years of follow-up.
Linear and quadratic time effects were included in the model, denoted and , respectively. As histological response may have a time-varying effect on survival [], its main time-constant effect was modeled along with the associated linear and quadratic time-varying effect. In order to incorporate the latter two in the model, interactions between histological response covariate and and were included.
To assess the validity of the prognostic model, a heuristic shrinkage factor was calculated as a measure of internal calibration []. A well-calibrated model ensures small differences between observed and predicted survival probabilities. The heuristic shrinkage factor, used in the case that no external data set is available for validation, gives a measure for calibration by indicating to what extent the regression coefficients should be shrunk towards the mean to ensure the model generalizes well to new data. Its value ranges from 0 to 1, where a value approaching 1 suggests a good calibration.
The discriminative ability of the model was measured using a cross-validated dynamic concordance index (C-index) [,]. A model with a good discriminative ability predicts higher risk for patients that experience an event earlier. The C-index is defined as the proportion of pairs for which the order of observed survival times is matched by the order of model predictions. A C-index of 0.5 indicates no discriminative ability, while a C-index of 1 indicates perfect discrimination. In the dynamic setting, with a prediction window of years, the C-index at time t was obtained by considering event times within the window . The dynamic C-index was computed at different times (in years) after surgery, using a leave-one-out cross-validation approach [].
Of the 1965 patients included in the analysis, 394 (20%) had missing values for one or more covariates. The highest percentage of missing (17.7%) was observed for the prognostic factor absolute tumor volume. To make optimal use of the available data, missing values for tumor volume and histological response were imputed in a 10-fold multiple imputation approach, using the R-package Amelia II []. The analysis was applied to each of the 10 complete datasets, and results were pooled using Rubin’s rule []. All analyses were performed in the R-software environment (R version 4.3.1) [].
3. Results
A total of 1965 patients were considered to be eligible for analysis. Median follow-up time since surgery, estimated with reverse Kaplan–Meier [], was 4.96 years (95% CI 4.87–5.08). At the end of study, 466 (23.7%) patients had died, while 1499 (76.3%) remained alive. Table 1 shows the characteristics at surgery for all patients, the 1328 randomized patients, and the 637 non-randomized patients. Figure 2 shows the number of patients considered at risk at each landmark time , along with their LR status (left panel—gray: no LR; blue: with LR) and their NM disease status (right panel—gray: no NM; red: with NM). During follow-up, a total of 130 (6.6%) patients experienced LR, and 570 (29%) patients NM.

Table 1.
Patient demographics, tumor, and treatment characteristics at surgery.
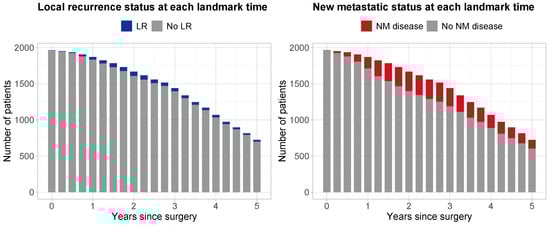
Figure 2.
Number of patients at risk at each landmark time point from 0 to 5 years after surgery with increments of 3 months. Left panel: blue, patients with local recurrence; gray, patients with no local recurrence. Right panel: red, patients with a new metastatic disease; gray, patients without a new metastatic disease.
3.1. Dynamic Prediction Model
The effect of the eight baseline predictors (Table 1) and the two time-varying covariates for LR and NM (Figure 2) on OS was assessed using proportional landmark supermodels. The hazard ratios (HRs) and 95% confidence intervals (95% CIs) estimated from the dynamic model are shown in Table 2. All predictors had significant time-constant effects. The strongest prognostic factors were the occurrence of NM disease, with a HR of 8.558 (95% CI: 7.367–9.942), followed by LR, with a HR of 2.634 (95% CI: 1.845–3.761). The presence of lung metastases and other metastases gave HRs of 2.177 (95% CI: 1.832–2.587) and 1.860 (95% CI 1.383–2.501), respectively. A poor versus good histological response was associated with a decrease in OS (HR: 2.371; 95% CI: 2.020-2.783). An axial tumor site, compared to any other limb site except proximal femur/humerus, resulted in a HR of 2.071 (95% CI 1.475–1.492). An intralesional/unknown excision, compared to a wide/radical one provided a HR of 1.423 (95% CI: 1.041–2.945). The remaining predictor categories had more modest effects with hazard ratios smaller than 1.25. Finally, being a child was found to be associated with increased OS compared to being an adolescent, resulting in a good prognostic factor with an HR of 0.712 (95% CI: 0.575–0.881).
Table 2.
Dynamic prediction model: hazard ratios (HRs) and 95% confidence intervals (N = 1965).
Notably, histological response had a significant time-varying effect. This effect was modelled by an additional linear time component and quadratic time component with HRs of 0.728 (95% CI: 0.641–0.826) and 1.036 (95% CI: 1.001–1.072), respectively. The hazard ratio for a patient with poor versus good histological response was calculated using the following formula:
where denotes the time-constant component, the linear time-varying component, the quadratic time-varying component, and the prediction time in years since surgery.
The calculations for prediction times of 1, 2, 3, 4 and 5 years are reported in Table 3. Directly after surgery the hazard ratio for poor histological response was equal to the time-constant effect of 2.371. At prediction time year, the HR has decreased to 1.788. At prediction time years, the HR has further decreased to 1.256. A visual representation of the time-varying hazard ratio is given in Figure 3. The decrease in HR over time is at first more steep, then more gradual. From 3.25 years onwards, a HR of 1 falls within the 95% confidence interval and a poor histological response (versus good histological response) is no longer a significant predictor for OS.
Table 3.
Time-varying hazard ratio HR() for 5-year dynamic OS for a patient with poor histological response at different prediction time points .
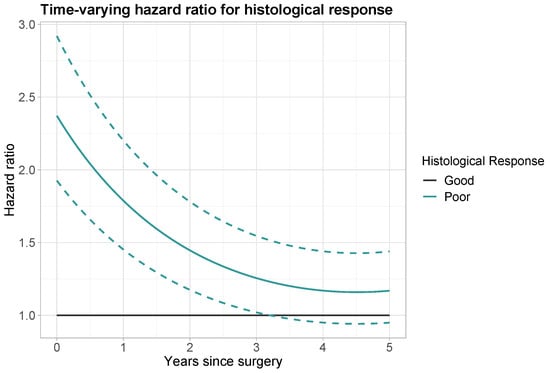
Figure 3.
Time-varying hazard ratio for histological response (black: good histological response; aquamarine: poor histological response). Dashed lines: point-wise 95% confidence interval for poor histological response.
3.2. Model Calibration Furthermore, Discrimination
The estimated heuristic shrinkage factor of 0.997 indicated that the model is very well calibrated. To assess the discriminative ability of the model, dynamic leave-one-out cross-validated C-indeces were computed at six time points t using a prediction window of years. C-index values were equal to 0.693, 0.777, 0.837, 0.837, 0.830, and 0.847 at times years since surgery. These high values indicated a very good discriminative ability of the model.
3.3. Dynamic Predictions of 5-Year Death Probability for Selected Patients
Figure 4 displays the probabilities of dying within 5 years at different time points (from 3 months to 5 years after surgery) for patients with specific characteristics and different disease progression status. The specific characteristics for each patient are provided in Table 4. Patient A is considered the “reference” and refers to a patient with reference values for the predictors evaluated at surgery: an adolescent female patient with a good histological response, no lung metastases or other metastases, a wide/radical surgical excision, and a tumor with absolute volume ≤ 200 cm3, located at any site except axial skeleton and proximal femur/humerus. The remaining patients B–F were defined in terms of characteristics that diverge from those of the reference patient A. For each patient profile A–F, predictions were made given that the patient experienced no intermediate event (black line: no NM/LR), experienced a local recurrence (blue line: with LR), a new metastatic disease (red line: with NM), or both (purple line: with LR + NM). For all patients, the occurrence of NM and/or LR increased the 5-year probability of dying drastically.
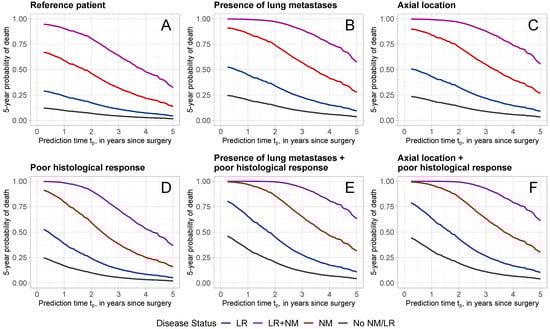
Figure 4.
Five-year death probabilities for patients with different characteristics and disease status. Patient characteristics are reported in Table 4. Different colors refer to different disease statuses (black: No LR/NM; blue: with LR; red: with NM; purple: with LR + NM).
Table 4.
Characteristics of patients A–F in Figure 4.
Figure 4A shows the 5-year death probabilities for reference patient A. Given that the patient is alive at year after surgery, the probability of dying within 5-years, given that no LR or NM has occurred is 9.8%. This probability increased with the occurrence of LR, NM, or LR + NM to 23.9%, 58.8%, and 90.3%, respectively. Poor histological response (Figure 4D) increased the probability of dying noticeably, with a predicted probability of 16.9% at 1 year for no LR/NM, 38.6% for LR, 79.5% for NM, and 98.5% for LR + NM. The presence of lung metastases (Figure 4B) or axial tumor location (Figure 4C) also increased the 5-year death probabilities. The combination of poor histological response with the presence of lung metastases (Figure 4E) or an axial tumor location led to even higher 5-year death probabilities.
For all patients, the later the prediction time, the lower the 5-year probability of dying. Consider, for example, patient D with a poor histological response, who experienced NM (red line in Figure 4D) at prediction times of years. At 1 year, the probability of dying within 5 years was 79.5%, which has decreased to 28.5% and 16.0% at 3 and 5 years, respectively.
4. Discussion
The dynamic prediction model developed in this study can be used to obtain predictions of the 5-year survival probability from different time-points, starting from the time of surgery, up to 5 years after surgery. The model considers a range of relevant covariates, accounting, where appropriate, for time-varying effects, and including various major disease-related events that may occur during follow-up.
Our study shows that the dynamic prediction model captures relevant information that would not be available with a static approach. For instance, the prediction time, in years from surgery, strongly influences the probability of dying within 5 years, with the 5-year death probability decreasing the longer a patient survives. Patient information was updated over time through the dynamic variables LR and NM disease. Both were found to be associated with a high increase in the 5-year death probabilities, with hazard ratios of 2.634 and 8.558, respectively. Confirming previous reports [,,,,,,,], a poor histological response, an axial tumor location, and the presence of lung metastases were strong risk predictors for poor OS. Of interest is that undergoing an intralesional/unknown surgical excision was found to be associated with a decreased OS compared to a wide/radical excision (HR = 1.423). Unlike the other predictors considered, excision is not an observational variable and could be subject to intervention.
For the histological response, a significant time-varying effect was found. The hazard ratio for a poor histological response versus a good one decreases from 2.371, at the time of surgery, to 1.169, at a prediction time of 5 years, with no significant effect observed from 3.25 years onwards. This indicates that directly after surgery histological response is a strong predictor, but it becomes weaker with time. This finding suggests that it would be relevant to examine potential time effects of histological response in other datasets, as it is commonly considered an important predictor in the clinical framework.
The quality of the prediction model was assessed with regards to time conform the endorsement criteria for risk models, as defined by the American Joint Committee on Cancer []. Internal validation was performed by means of cross-validation, a heuristic shrinkage factor was employed to confirm good internal calibration, and dynamic cross-validated C-indices were used to establish good discriminative ability over time.
This analysis has some limitations. Some covariates have unbalanced sizes among the different categories (e.g., tumor location), and the occurrence of LR is observed only in 130/1965 (6.6%) patients. Therefore, some caution is required when interpreting the results. By necessity, a simplified model is presented, with disease progression prior to death characterized by the first occurrence of intermediate events LR and/or NM, and repeated occurrences of NM (N = 71) and LR (N = 1) discarded.
5. Conclusions
The dynamic prediction model developed in this study, using almost 2000 patients from the EURAMOS-1 clinical trial, can be used to make reliable predictions of the probability of dying within 5 years from a given prediction time, which can be any time from surgery up to 5 years after surgery. This dynamic model is a highly relevant addition to existing models, as it accounts for patient status changing over time and, unlike a static model, gives updated predictions for a range of times. To the best of the authors’ knowledge, this is the first study where dynamic OS for patients with osteosarcoma is investigated. Reanalyzing data from large randomized studies, using the dynamic landmarking approach, may also yield valuable insights for patients with other oncological conditions, as shown also for breast cancer [] or high-grade soft tissue sarcoma [,].
Author Contributions
Conceptualization, all authors; methodology, A.-D.H., M.S. and M.F.; software, A.-D.H. and M.S.; validation, A.-D.H. and M.S.; formal analysis, A.-D.H. and M.S.; data curation, A.-D.H., M.S. and M.F.; writing—original draft preparation, A.-D.H. and M.S.; writing—review and editing, H.G. and M.F.; visualization, M.S.; supervision, M.F.; project administration, M.F. All authors have read and agreed to the published version of the manuscript.
Funding
This research received no external funding.
Institutional Review Board Statement
The EURAMOS-1 study was conducted in accordance with the Declaration of Helsinki. The trial is registered as NCT00134030 and ISRCTN 67613327. The protocol was approved by the Local Research Ethics Committee (LREC) in Gent (coordinating Ethics Committee for Euramos, Belgium), the Central Committee on Research Involving Human Subjects (CCMO) in the Netherlands, the LREC in Leiden (The Netherlands), and the Multi-Centre Research Ethics Committee (MREC) and LREC in the UK. All participating institutions obtained regulatory and ethics approvals in accordance to their national rules and regulations.
Informed Consent Statement
Permission to recruit patients to the protocol was provided by the appropriate national and local regulatory and local committees. Written informed content was obtained from all trial participants or legal guardians before beginning protocol therapy. Link anonymized data were used for the purposes of this study, and the use of the data was in accordance with the consent taken. Note that our study is a reanalysis of an already published trial. Participants gave informed consent to participate in the study before taking part.
Data Availability Statement
Data may be obtained from a third party and are not publicly available. A request to access the EURAMOS-1 trial data may be submitted to the MRC Clinical Trials Unit (CTU, London). The application requires completion of an analysis and data release request form, where the applicant provides a project summary (detailing the motivation of the data request, the background and objectives of their project, and the reasons for requesting this specific dataset), the data requirements (for this study, the anonymized individual-level data for all registered patients were requested, including (demographic) patient characteristics, disease characteristics, pathology and surgical information, treatment data, and major events), and details on the proposed publication, authorship and acknowledgments policy. Data applications are submitted to the Coordinating Data Center (CDC, London), and subject to review by the Trial Management Group and the Trial Steering Committee.
Acknowledgments
We would like to thank the MRC Clinical Trials Unit at UCL (London, UK) for making data from the EURAMOS-1 trial available for this analysis. We are grateful to the trial expert panel members from the Children’s Oncology Group (COG—oncology panel: N. Marina, M. Bernstein, A. Goorin, P. Meyers; statistics panel: M. Krailo; pathology review panel: L. Teot; biological studies panel: R. Gorlick, C. Khanna, C. Lau; surgical panel: D. Letson, M. Gebhardt, L. Randall; radiology panel: J. Meyer, H. Nadel; radiotherapy panel: P. Schomberg; pharmacy panel: A. Barr), the Cooperative Osteosarcoma Study group (COSS—oncology panel: S. Bielack, L. Kager, T. Kühne, P. Reichardt, Z. Papai, U. Kontnyl, W. Hassenpflug, N. Graf, M. Nathrath, W.E. Berdel, H. Jürgens, R. Meyer-Steinacker; pathology review panel: G. Jundt, Andreas Schulz, G. Delling, M. Werner, A. Roessner, G. Köhler—associate: C. Dierkes, H. Bürger, S. Lang—associate: I.Sulzbacher, A.R. von Hochstetter, G. Arato; biological studies panel: M. Nathrath, G. Jundt, W. Hassenpflug; surgical panel: R. Windhager—associate: M. Dominkus, P.-U. Tunn, M. Szendroi—associate: I. Antal, D. Branscheid, G. Friedel, U. Heise, V. Ewerbeck, H.R. Dürr, A. Hillmann, G.Gosheger—associate: J. Hardes, G.U. Exner; radiology panel: J. Sciuk, K. Helmke, P. Winkler—associate: T. v. Kalle, R. Maas, C. Franzius; statistics panel: J. Gerss; radiotherapy panel: R. Schwarz, B. Timmermann; pharmacy panel: E. Ahlke, H. Kolve), the European Osteosarcoma Intergroup (EOI—oncology panel: J. Whelan, C. Dhooge, M. Capra, H. Gelderblom, J.K. Anninga, B.e Morland, I. Lewis; statistics panel: M. Sydes; pathology review panel: P. Hogendoorn, J.V.M.G. Bovee, J. Bras, A. Flanagan, E. MacDuff, R. Reid, P. Dildey, D.E. Hughes, E. Hauben, C. Mangham; biological studies panel: P. Hogendoorn, A.M. Cleton Jansen; surgical panel: R. Grimer, S. Cannon, A. Taminiau, M. Gebhart; radiology panel: M. Davies, P. O’Donnell, W. Ramsden, H.J. van der Woude, K. Verstraete; radiotherapy panel: A. Cassoni; pharmacy panel: D. Blake), and the Scandinavian Sarcoma Group (SSG—oncology panel: S. Smeland, M. Eriksson, T. Wiebe, Å. Jakobson, M. Tarkkanen, O.S. Nielsen; pathology review panel: T. Böhling, L.-G. Kindblom, H. Domanski, B. Bjerkehagen, J. Wejde; biological studies panel: O. Myklebost, N. Mandahl, S. Knuutila; surgical panel: O. Brosjö; radiology panel: I. Taksdal, V. Söderlund; radiotherapy panel: Ø. Bruland; statistics panel: L. Werner-Hartman; pharmacy panel: T. Skärby). We extend this appreciation to all TMG members, representatives, investigators and collaborators for their involvement in the EURAMOS-1 study. We are specially grateful to every patients who participated in the trial and their families.
Conflicts of Interest
The authors declare no conflicts of interest.
Abbreviations
The following abbreviations are used in this manuscript:
| CI | Confidence interval |
| EURAMOS | European and American Osteosarcoma Studies |
| HR | Hazard ratio |
| LR | Local recurrence |
| NM | New metastatic disease |
| OS | Overall survival |
References
- Luetke, A.; Meyers, P.A.; Lewis, I.; Juergens, H. Osteosarcoma treatment—Where do we stand? A state of the art review. Cancer Treat. Rev. 2014, 40, 523–532. [Google Scholar] [CrossRef]
- Ritter, J.; Bielack, S.S. Osteosarcoma. Ann. Oncol. 2010, 21 (Suppl. 7), vii320–vii325. [Google Scholar] [CrossRef]
- Smeland, S.; Bielack, S.S.; Whelan, J.; Bernstein, M.; Hogendoorn, P.; Krailo, M.D.; Gorlick, R.; Janeway, K.A.; Ingleby, F.C.; Anninga, J.; et al. Survival and prognosis with osteosarcoma: Outcomes in more than 2000 patients in the EURAMOS-1 (European and American Osteosarcoma Study) cohort. Eur. J. Cancer 2019, 109, 36–50. [Google Scholar] [CrossRef]
- Isakoff, M.S.; Bielack, S.S.; Meltzer, P.; Gorlick, R. Osteosarcoma: Current treatment and a collaborative pathway to success. J. Clin. Oncol. 2015, 33, 3029–3035. [Google Scholar] [CrossRef]
- van Ewijk, R.; Herold, N.; Baecklund, F.; Baumhoer, D.; Boye, K.; Gaspar, N.; Harrabi, S.B.; Haveman, L.M.; Hecker-Nolting, S.; Hiemcke-Jiwa, L.; et al. European standard clinical practice recommendations for children and adolescents with primary and recurrent osteosarcoma. EJC Paediatr. Oncol. 2023, 2, 100029. [Google Scholar] [CrossRef]
- Marina, N.; Bielack, S.; Whelan, J.; Smeland, S.; Krailo, M.; Sydes, M.R.; Butterfass-Bahloul, T.; Calaminus, G.; Bernstein, M. International collaboration is feasible in trials for rare conditions: The EURAMOS experience. In Cancer Treatment and Research; Cancer treatment and research; Springer US: Boston, MA, USA, 2009; pp. 339–353. [Google Scholar] [CrossRef]
- Whelan, J.S.; Bielack, S.S.; Marina, N.; Smeland, S.; Jovic, G.; Hook, J.M.; Krailo, M.; Anninga, J.; Butterfass-Bahloul, T.; Böhling, T.; et al. EURAMOS-1, an international randomised study for osteosarcoma: Results from pre-randomisation treatment. Ann. Oncol. 2015, 26, 407–414. [Google Scholar] [CrossRef]
- Bielack, S.S.; Smeland, S.; Whelan, J.S.; Marina, N.; Jovic, G.; Hook, J.M.; Krailo, M.D.; Gebhardt, M.; Pápai, Z.; Meyer, J.; et al. Methotrexate, doxorubicin, and cisplatin (MAP) plus maintenance pegylated interferon Alfa-2b versus MAP alone in patients with resectable high-grade osteosarcoma and good histologic response to preoperative MAP: First results of the EURAMOS-1 good response randomized controlled trial. J. Clin. Oncol. 2015, 33, 2279–2287. [Google Scholar] [CrossRef]
- Marina, N.M.; Smeland, S.; Bielack, S.S.; Bernstein, M.; Jovic, G.; Krailo, M.D.; Hook, J.M.; Arndt, C.; van den Berg, H.; Brennan, B.; et al. Comparison of MAPIE versus MAP in patients with a poor response to preoperative chemotherapy for newly diagnosed high-grade osteosarcoma (EURAMOS-1): An open-label, international, randomised controlled trial. Lancet Oncol. 2016, 17, 1396–1408. [Google Scholar] [CrossRef]
- Hazewinkel, A.D.; Lancia, C.; Anninga, J.; van de Sande, M.; Whelan, J.; Gelderblom, H.; Fiocco, M. Disease progression in osteosarcoma: A multistate model for the EURAMOS-1 (European and American Osteosarcoma Study) randomised clinical trial. BMJ Open 2022, 12, e053083. [Google Scholar] [CrossRef]
- Van Houwelingen, H.C. Dynamic prediction by landmarking in event history analysis. Scand. J. Stat. 2007, 34, 70–85. [Google Scholar] [CrossRef]
- van Houwelingen, H.; Putter, H. Dynamic Prediction in Clinical Survival Analysis; Chapman & Hall/CRC Monographs on Statistics & Applied Probability; CRC Press: Boca Raton, FL, USA, 2011. [Google Scholar] [CrossRef]
- Cox, D. Regression models and life-tables. J. R. Stat. Soc. 1972, 34, 187–202. [Google Scholar] [CrossRef]
- Fontein, D.B.Y.; Klinten Grand, M.; Nortier, J.W.R.; Seynaeve, C.; Meershoek-Klein Kranenbarg, E.; Dirix, L.Y.; van de Velde, C.J.H.; Putter, H. Dynamic prediction in breast cancer: Proving feasibility in clinical practice using the TEAM trial. Ann. Oncol. 2015, 26, 1254–1262. [Google Scholar] [CrossRef]
- Rueten-Budde, A.J.; van Praag, V.M.; PERSARC Studygroup; van de Sande, M.A.J.; Fiocco, M. Dynamic prediction of overall survival for patients with high-grade extremity soft tissue sarcoma. Surg. Oncol. 2018, 27, 695–701. [Google Scholar] [CrossRef]
- Callegaro, D.; Miceli, R.; Bonvalot, S.; Ferguson, P.C.; Strauss, D.C.; van Praag, V.V.M.; Levy, A.; Griffin, A.M.; Hayes, A.J.; Stacchiotti, S.; et al. Development and external validation of a dynamic prognostic nomogram for primary extremity soft tissue sarcoma survivors. eClinicalMedicine 2019, 17, 100215. [Google Scholar] [CrossRef]
- Collins, M.; Wilhelm, M.; Conyers, R.; Herschtal, A.; Whelan, J.; Bielack, S.; Kager, L.; Kühne, T.; Sydes, M.; Gelderblom, H.; et al. Benefits and adverse events in younger versus older patients receiving neoadjuvant chemotherapy for osteosarcoma: Findings from a meta-analysis. J. Clin. Oncol. 2013, 31, 2303–2312. [Google Scholar] [CrossRef]
- Rosen, G.; Murphy, M.L.; Huvos, A.G.; Gutierrez, M.; Marcove, R.C. Chemotherapy, en bloc resection, and prosthetic bone replacement in the treatment of osteogenic sarcoma. Cancer 1976, 37, 1–11. [Google Scholar] [CrossRef]
- Bacci, G.; Picci, P.; Ruggieri, P.; Mercuri, M.; Avella, M.; Capanna, R.; Brach Del Prever, A.; Mancini, A.; Gherlinzoni, F.; Padovani, G. Primary chemotherapy and delayed surgery (neoadjuvant chemotherapy) for osteosarcoma of the extremities. The Istituto Rizzoli Experience in 127 patients treated preoperatively with intravenous methotrexate (high versus moderate doses) and intraarterial cisplatin. Cancer 1990, 65, 2539–2553. [Google Scholar] [CrossRef]
- Bielack, S.S.; Kempf-Bielack, B.; Delling, G.; Exner, G.U.; Flege, S.; Helmke, K.; Kotz, R.; Salzer-Kuntschik, M.; Werner, M.; Winkelmann, W.; et al. Prognostic factors in high-grade osteosarcoma of the extremities or trunk: An analysis of 1702 patients treated on neoadjuvant cooperative osteosarcoma study group protocols. J. Clin. Oncol. 2002, 20, 776–790. [Google Scholar] [CrossRef]
- Whelan, J.S.; Jinks, R.C.; McTiernan, A.; Sydes, M.R.; Hook, J.M.; Trani, L.; Uscinska, B.; Bramwell, V.; Lewis, I.J.; Nooij, M.A.; et al. Survival from high-grade localised extremity osteosarcoma: Combined results and prognostic factors from three European Osteosarcoma Intergroup randomised controlled trials. Ann. Oncol. 2012, 23, 1607–1616. [Google Scholar] [CrossRef]
- Bishop, M.W.; Chang, Y.C.; Krailo, M.D.; Meyers, P.A.; Provisor, A.J.; Schwartz, C.L.; Marina, N.M.; Teot, L.A.; Gebhardt, M.C.; Gorlick, R.; et al. Assessing the prognostic significance of histologic response in osteosarcoma: A comparison of outcomes on CCG-782 and INT0133-A report from the children’s oncology group bone tumor committee. Pediatr. Blood Cancer 2016, 63, 1737–1743. [Google Scholar] [CrossRef]
- Schemper, M.; Smith, T.L. A note on quantifying follow-up in studies of failure time. Control. Clin. Trials 1996, 17, 343–346. [Google Scholar] [CrossRef] [PubMed]
- Harrell, F.E., Jr.; Lee, K.L.; Mark, D.B. Multivariable prognostic models: Issues in developing models, evaluating assumptions and adequacy, and measuring and reducing errors. Stat. Med. 1996, 15, 361–387. [Google Scholar] [CrossRef]
- James, G.; Witten, D.; Hastie, T.; Tibshirani, R. An introduction to Statistical Learning, 2nd ed.; Springer texts in statistics; Springer: New York, NY, USA, 2021. [Google Scholar] [CrossRef]
- Honaker, J.; King, G.; Blackwell, M. Amelia II: A Program for Missing Data. J. Stat. Softw. 2011, 45, 1–47. [Google Scholar] [CrossRef]
- Rubin, D.B. Multiple imputation after 18+ years. J. Am. Stat. Assoc. 1996, 91, 473–489. [Google Scholar] [CrossRef]
- R Core Team. R: A Language and Environment for Statistical Computing; R Foundation for Statistical Computing: Vienna, Austria, 2023. [Google Scholar]
- Kattan, M.W.; Hess, K.R.; Amin, M.B.; Lu, Y.; Moons, K.G.M.; Gershenwald, J.E.; Gimotty, P.A.; Guinney, J.H.; Halabi, S.; Lazar, A.J.; et al. American Joint Committee on Cancer acceptance criteria for inclusion of risk models for individualized prognosis in the practice of precision medicine. CA Cancer J. Clin. 2016, 66, 370–374. [Google Scholar] [CrossRef]
Disclaimer/Publisher’s Note: The statements, opinions and data contained in all publications are solely those of the individual author(s) and contributor(s) and not of MDPI and/or the editor(s). MDPI and/or the editor(s) disclaim responsibility for any injury to people or property resulting from any ideas, methods, instructions or products referred to in the content. |
© 2024 by the authors. Licensee MDPI, Basel, Switzerland. This article is an open access article distributed under the terms and conditions of the Creative Commons Attribution (CC BY) license (https://creativecommons.org/licenses/by/4.0/).