Article

Mechanism of Methane Adsorption/Desorption in Low-Rank Vitrain and Durain Coal Affected by Pore Structure and Wettability: A Case Study in Dafosi Area, South Ordos Basin, China

1
College of Geology and Environment, Xi’an University of Science and Technology, Xi’an 710054, China
2
State Key Laboratory of Coal and Coalbed Methane Co-Mining Technology, Jincheng 048000, China
3
Shaanxi Geological Science and Technology Center, Xi’an 710054, China
*
Author to whom correspondence should be addressed.
Energies 2022, 15(14), 5094; https://doi.org/10.3390/en15145094
Submission received: 1 June 2022 / Revised: 23 June 2022 / Accepted: 6 July 2022 / Published: 12 July 2022

Abstract

:
Water content and water–coal interface wettability are always the difficult issues of coalbed methane adsorption/desorption. In order to study the effects of the pore structure and wettability of different macro coal components on methane adsorption and desorption, we compared and analyzed the wettability difference between vitrain and durain, and revealed the influence of wettability on methane adsorption and desorption through a pore structure analysis, wettability measurements, an adsorption–desorption experiment and adsorption heat calculations under different conditions, taking the No. 4 coal in Dafosi Coal Mine of the Huanglong coalfield as the research object. The results show that both vitrain and durain are relatively hydrophilic substances. However, vitrain has a low ash content, high volatility, and less oxygen, and the pores are mainly semi-closed pores compared with dark coal. Vitrain also has poor connectivity, poor sorting, a small pore diameter, and a coarser surface, resulting in poor surface wettability. The large specific surface area (SSA) and relatively poor wettability of vitrain leads to more adsorption sites in methane, which makes the adsorption capacity of vitrain greater than that of durain, but the good pore connectivity of durain causes the strong desorption capacity of durain. The isosteric adsorption heat of the adsorption process is greater than that of the desorption process, indicating that there is a desorption hysteresis phenomenon which is essentially due to the lack of energy in desorption. Surfactants change the wettability of the coal surface, and different surfactants have different effects on methane adsorption and desorption. Relatively speaking, the methane desorption of coal samples treated with G502 and 6501 are better. The research results provide scientific reference for the study of gas–water transport in the desorption process of low-rank CBM, and provide evidence for the methane desorption model of vitrain and durain.

1. Introduction

The coalbed methane (CBM) resources of low-rank coal reservoirs reach about 16 × 1012 m3 in China, accounting for 40% of the total CBM resources, and they have gradually become a focus of the exploration and development of CBM in China [1,2,3]. However, the average gas production of CBM wells is still low, and it is urgent to improve the development efficiency of CBM wells. Compared to the high- and medium-rank coals, the characteristics of low-rank coals are a relatively high permeability and a low gas content [4,5,6,7]. As the CBM mainly exists in the state of adsorption on the coal surface, it is more important for the adsorbed methane to be desorbed with a high efficiency for achieving constantly and steadily high production of the coalbed methane wells of low-rank coal reservoirs.
Since methane adsorption on the pore surface takes place spontaneously, the ongoing desorption requires the intake of outside energy, accompanied by a material transfer. CBM adsorption and desorption are two relatively invertible processes. The former process has been studied and discussed in many studies, and the influence factors include temperature, pressure, coal rank, composition of coal, and moisture content [8,9,10,11,12,13,14,15]. However, the desorption and adsorption are not completely invertible, because the desorption hysteresis has been found and studied quantitatively [16,17,18,19,20,21]. Desorption hysteresis is the result of many factors, including the pore structure and wettability of the coal–water interface. Coal is a mixture of different coal-rock components, and the pore structure and wettability of different components are obviously different [22,23]. The previous research results mainly focused on the influence factors of coal wettability and the analysis of coal wettability modification by different surfactants, but the research on the wettability of different coal-rock components and methane adsorption and desorption is not enough.
In this paper, the low-rank coal in the Dafosi area of the Huanglong coalfield in the southern margin of Ordos Basin is taken as the research object. The material composition, pore structure, and coal–water interface contact angle of vitrain and durain samples were systematically measured. The effect of different surfactants on the wettability of vitrain and durain were compared and analyzed. Through an adsorption/desorption experiment and data calculation and analysis, the difference in wettability and its influence on methane adsorption and desorption were revealed, and a physical model of methane desorption in vitrain and durain was constructed. It provides theoretical guidance for the exploitation of low-rank coalbed methane.

2. Geological Settings

The Dafosi field is located in the Changwu and Binxian counties of northwest Xianyang city, Shanxi province (Figure 1), and its tectonic location is between the Xiaolingtai anticline and the Binxian anticline in the south of the Binchang mine. Overall, it is an undulating monocline with a series of NEE and NNW folds, such as Anhua syncline, Qijia anticline, and Shijiadian syncline, distributed from north to south (Figure 1). The stratigraphic dip angles are small, generally ranging from 3° to 5°, and the tectonic structure is relatively simple. The coal-bearing strata in this area are Jurassic Yan’an Formation, deposited in the fluvial sedimentary environment, with a thickness of 40–168.6 m, on average 75.6 m. There are six coal seams developed in the Yan’an Formation, and the main coal seam is the No. 4 coal seam that is recoverable in the whole area, with a thickness of 0~19.2 m, averaging 11.65 m. The coal belongs to the low rank and the total amount of CBM resources is 112.06 × 10⁸ m3, including the recoverable resources of 73.92 × 10⁸ m3, with a buried depth of 300–1000 m. On the whole, it has a good prospect for coalbed methane development and utilization. By the end of 2018, 37 wells had been drilled in this area, with the highest gas production of 3 × 10⁴ m3/d per well, but the gas production of the wells varied greatly, with an average of 300 m3/d.

3. Samples and Experiments

The coal samples for the study were collected from the No. 4 coal seam of Yan’an Formation in Middle Jurassic, on the working face 40,112 of Dafosi in Binchang Mining Area, southern Ordos Basin. Vitrain and durain were stripped by hand for the experiments.

3.1. Coal Composition

The proximate analysis and ultimate analysis of the coal samples were conducted based on Proximate analysis of Coal (GB/T 212-2008) and Method of Determining Microlithotype Composition (GB/T 6948-2008) of the State Standard of the People’s Republic of China. The instrument for the ultimate analysis was the CHN Analyzer SDCHN435, whose testing ranges are C (0.02–100%), H (0.02–50%) and N (0.01–50%).

3.2. Characterization of Pore Structure

The size and shape of the pores in coal have a significant influence on the adsorption/desorption and migration of coalbed methane [24,25,26,27,28,29]. Mercury porosimetry analysis has its particular advantage in measuring macropores and mesopores, covering a pore radius range of 3.75–750 nm. The pore structure type of coal can be judged according to the curve characters of mercury intrusion and extrusion. The method has an obvious limitation in measuring nanoscale pores, which is unable to reflect the information about closed pores [30]. Liquid nitrogen adsorption analysis is very useful for measuring the pore diameter with a lower limit of 0.6 nm, to calculate the pore distribution, pore volume, and specific surface area based on different pore interpretation models, and to determine the pore shape and the degree of openness based on the form of the hysteresis loop [31]. The micropore structure analysis of the coal samples was mainly conducted through a mercury porosimetry experiment and a liquid nitrogen adsorption experiment. The former experiment was conducted at the Petroleum and Geology Experiment Center of Exploration and Production Research Institute of Zhongyuan Oilfield Company. A Mercury Intrusion Apparatus Auto pore 9505 was adopted for parametric measurement, with a pore throat ranging from 0.004 μm~63 μm and a resolution ratio of 0.0001 MPa. The experimental process was based on Part 1: Mercury Porosimetry of Pore Size Distribution and Porosity of Solid Materials by Mercury Porosimetry and Gas Adsorption (GB/T 21650.1-2008) of the State Standard of the People’s Republic of China. Based on the decimalism pore throat classification system of Hodot (1961), pore throat classification and parameter calculation were performed on the test data. A liquid nitrogen adsorption experiment was conducted at the Coalbed Methane Lab of the Xi’an University of Science and Technology, with a Surface Area and Pore Size Analyzer ASAP2020 from Beckman Coulter, Inc. All the samples were tested in a vacuum drying oven at 80 °C and a nitrogen purging station after 24 hours’ drying and degassing. The experimental process was based on Part 2: Analysis of Mesopores and Macropores by Gas Adsorption (GB/T 21650.2-2008) and Part 3: Analysis of Micropores by Gas Adsorption (GB/T 21650.3-2011) of Pore Size Distribution and Porosity of Solid Materials by Mercury Porosimetry and Gas Adsorption of the State Standard of the People’s Republic of China.

3.3. Wettability Test

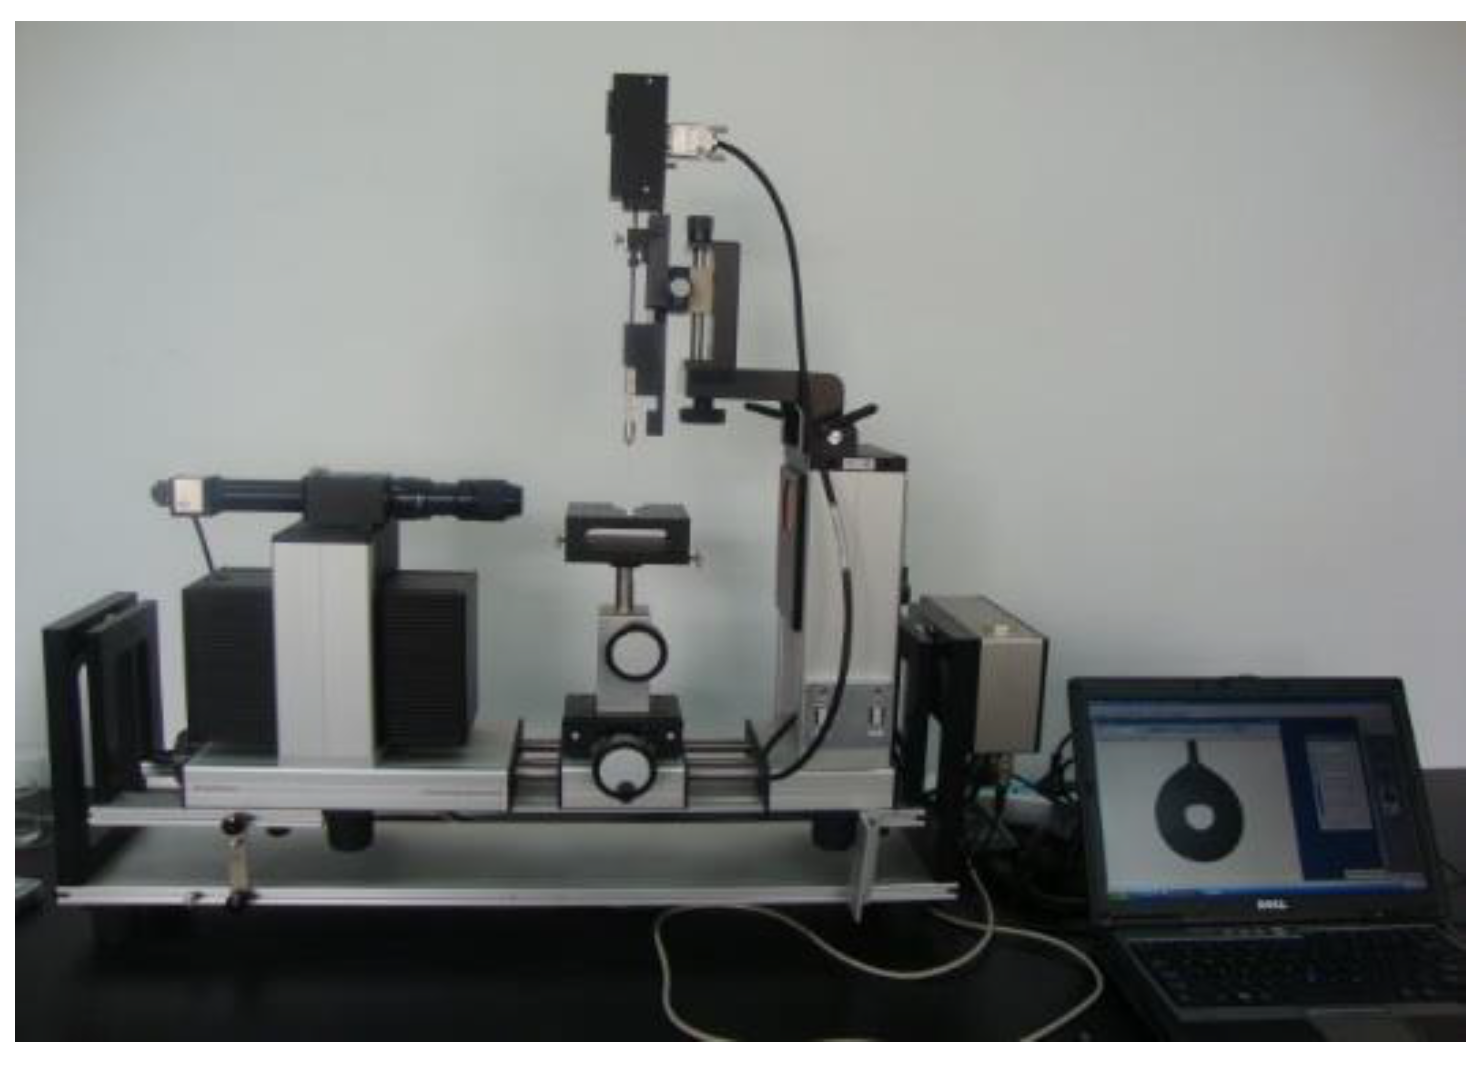
Contact Angle is an important index reflecting wettability. A wetting test was conducted at the coalbed methane lab of the Xi’an University of Science and Technology. A video optical contact angle measuring device OCA20 from dataphysics in Germany was adopted to measure the contact angle of durain and vitrain (Figure 2). First, raw coal sample a selected, which was cut into the same specification of 3 × 3 × 2 cm cubes of coal, and then a PG type 2 metallographic sample polishing machine (1000 mesh sandpaper) was used for coal surface grinding in order to make it smooth while considering the original state; the state coal reservoir water then cut the dish specifications samples that were saturated after immersion in a dry area, eventually resulting in a balanced water sample.
Surfactants can significantly reduce the surface tension of the solution and improve the hydrophilicity of coal. The corresponding surfactants selected in this paper are shown in Table 1. LAS, JFC, and 6501 can be prepared with distilled water as a solvent for contact angle measurement experiments, while a G502 wetting agent is difficult to prepare with aqueous solution because of its strong hydrophobic properties. Therefore, anhydrous ethanol was used as the solvent to prepare the G502 solution, and then the coal was placed in it for soaking for 12 h. The coal was then dried in a drying oven at 50 °C for 1–1.5 h to evaporate the ethanol completely, in order to exclude its influence on the wettability of the coal.

3.4. Methane Adsorption and Desorption Experiment

1.
The isothermal adsorption experiment was conducted at the Coalbed Methane Lab of the Xi’an University of Science and Technology. A CBM adsorption–desorption simulation instrument (AST-2000) was employed, with the temperature set at 20 °C, 25 °C, 30 °C, 35 °C, and 40 °C, and the maximum adsorption pressure being 8 MPa and particle size being 60–80 mesh. Equilibrium water sample collections and experiments were based on the Experimental Methods of Coal’s High Pressure Isothermal Adsorption-Volumetric Method (GB/T19560-2008).
The Langmuir Equation (1) was adopted to describe the methane adsorptive process of vitrain and durain [32,33,34]. Due to the hysteresis of desorption, the desorptive Equation (2) proposed by [35,36,37,38] was adopted.
V a = a a b a p 1 + b a p
where, Va stands for adsorption capacity with coal reservoir pressure p, cm3/g; aa for the utmost adsorption capacity of the coal sample, cm3/g; and ba for the integrated parameter of adsorption/desorption speed and adsorption heat.
V d = a d b d p 1 + b d p + c
where, Vd stands for the adsorption capacity when the pressure is p during CBM desorption, cm3/g; ad for the utmost adsorption capacity of the coal sample, cm3/g; bd for the integrated parameter of adsorption/desorption speed and adsorption heat; and c for constant or residual adsorption, cm3/g.
2.
The process of methane adsorption and desorption involves a change in energy. The interaction between adsorbate and adsorbent can be measured by studying the same amount of adsorption heat in the process of methane adsorption and desorption (when the adsorption capacity on the adsorbent surface is constant, there is still an infinitesimal amount of heat released after adsorption, which is the change in enthalpy value at the moment of the adsorption process). In the process of methane adsorption by coal, the stronger the property of the coal adsorption performance is, the greater the enhancement in the interaction between the surface molecules of coal and methane molecules, and an increase in the adsorption heat can be detected, irrespectively. The isosteric heat of methane adsorption and desorption can be calculated indirectly using the Clausius Clapeyron Equation (3) [39]:
d ln f d T = q st R T
where qst is equal to adsorption heat, kJ/mol; f is fugacity, Pa; T is temperature, K; R is gas constant, taking 8.314 J/(mol·K). By transforming Equation (3), it can be concluded that:
ln = q st R T + C
The relationship between fugacity f and pressure p is obtained as:
f = p · Z
where p is the pressure and Z is the compression factor. According to the above relations:
q st = R · C
where R is the gas constant, 8.314 J/(mo1·K), and C is the slope of the linear fitting relationship. According to the one-to-one corresponding relationship between different temperature and pressure lnf and adsorption capacity n, the data relationship between them was fitted and the lnf-n relationship was obtained.

4. Results and Discussion

4.1. Differences between Vitrain and Durain

4.1.1. Coal Composition

A proximate analysis and an ultimate analysis were conducted in turn for ten groups of stripped vitrain and durain samples (Table 2). According to the results of the proximate analysis, moisture and fixed carbon were roughly equal between vitrain and durain, and the ash content of durain was greater than that of vitrain; however, the volatility of durain was lower than that of vitrain. According to the results of the ultimate analysis, the variation ranges of C, H, O, and N for both vitrain and durain were small, at 82.4–83.6%, 4.68–4.80%, 0.86–0.89%, and 10.73–12.03%, respectively. With the calculation of the element content average of the 10 samples, the C/H of vitrain was 17.42, which was lower than the 17.61 for durain. The C/O of vitrain was 7.79, higher than the 6.85 for durain. The data show that in terms of macromolecular structure, the cyclic saturated hydrocarbon fragments in vitrain were numerous than those in durain, and the oxygen-containing functional groups in durain were more numerous than those in vitrain [40].
Vitrain is generated through gelatinization in a reducing environment, and it is pure in nature, simple in maceral, and without exogenous impurities or mineral substances. Its macromolecules have abundant functional groups (such as -O-, -COOH, C-O-C-, -OH, and -OCH3), with a relatively greater number of aromatic and hydrocarbon molecules. Therefore, it has more denaturalizing and volatile components at high temperatures. Its contents of moisture, hydrogen, oxygen, and nitrogen are relatively high. Durain is generated in an oxidation environment, and a large number of coal molecule branches are lost, leaving the main carbon skeletons. Moreover, exogenous impurities and mineral substances often mix themselves into durain, making the components more complicated, and making the air-dried ash and carbon contents higher.

4.1.2. Pore Structure Characteristics

Through mercury porosimetry, the maximum displacement pressure (Pd) of vitrain and durain was found to be similar, with both being low. In terms of the maximum saturation of mercury (SHG), that of vitrain was around 2/3 that of durain. The mercury intrusion volume was lower in vitrain pores. The mercury extrusion efficiency (WE) of durain was obviously lower than that of vitrain. Therefore, compared with durain, vitrain has lower mercury intrusion volume and is easier to use for mercury extrusion. Hence, there are differences in the pore openness between vitrain and durain. There were almost no differences found in pore parameters or sorting, but durain had a stronger flexure (Figure 3 and Table 3). The migration of the fluid (mercury) in the coal pores shows that vitrain has poorer connectivity (dominated by semi-closed pores) and that durain has a better connectivity (dominated by open pores).
According to the experimental data obtained from the liquid nitrogen adsorption experiment (Table 4) for the No. 4 coal seam of Dafosi Mine, the specific surface area (SSA) and total pore volume (TPV) of vitrain were larger than those of durain, but the average pore size (APZ) of the former was smaller than that of the latter. Through micropore analysis, the total micropore volume (TMV) and the most probable pore size (MPPZ) of vitrain were found to be smaller than those of durain. The results from the liquid nitrogen adsorption were accordance with those from mercury porosimetry.

4.1.3. Wettability

The contact angle is generally used to characterize wettability, and the smaller the contact angle, the better the wettability [41,42,43]. In this study, the contact angle was for water and the test solvent was distilled water to prevent the interference of mineral impurities. For the test analysis, the average contact angle (three times) of vitrain was 66.9°; for durain samples it was 61.2° (Table 5). The results indicate that both durain and vitrain were hydrophilic and the former was more easily wetted. The material composition and pore structure of coal have a significant influence on its wettability. Inorganic minerals (ash) with hydrophilic properties can enhance the wettability of coal, and since volatile substances are usually hydrophobic, the wettability of coal becomes poor. The influence of C and O on the wettability is complex and depends on the type of oxygen-containing functional groups. Compared with durain, the pores of vitrain were found to be mainly semi-closed pores with poor connectivity, poor sorting, a small pore size, a large specific surface area, and a rougher surface, resulting in worse wettability.
In order to study the effect of different surfactants on the wettability of coal, the contact angle of the coal samples was determined using a 1% concentration of anionic surfactant (LAS) solution, non-ionic surfactant solution (6501 and JFC), and hydrophobic agent solution (G502). After adding different surfactants, the contact angle of vitrain was still larger than that of durain, indicating that the wettability of durain was better than that of vitrain. At the same time, it was found that the size of the contact angle after treatment with different surfactants was G502 > production water > distilled water > 6501 > LAS > JFC (Table 5). The hydrophobic wetting agent was G502, and the hydrophilic wetting agent was JFC, LAS, and 6501.
The JFC, LAS, and 6501 were able to effectively reduce the contact angle of the coal–water interface, improve the wettability of coal, and reduce the contact angle of vitrain and durain coal to 33.8°, 39.9°, and 49.9°, and to 32.5°, 36.7°, and 42.1°, respectively. Compared with the original contact angle of coal (measured with distilled water), the contact angle of the coal samples after surfactant modification decreased by 49.5%, 47.7%, and 40.4%, and by 46.9%, 47.5%, and 40.0%, respectively, indicating that the three kinds of surfactants have basically the same effect on the wettability modification of vitrain and durain, that the change rate of contact angle is roughly the same, and that the wettability of modified durain is still better than that of vitrain. The contact angles of vitrain and durain increased to 98.8° and 90.3°, respectively, after the action of G502, and the change rates of the contact angles were 25.4% and 31.2%, respectively. The coal changed from hydrophilicity to hydrophobicity, and the wettability was reversed. Therefore, G502 is a hydrophobic agent which can effectively promote the hydrophobicity of coal.

4.2. Methane Adsorption and Desorption

The experimental data include saturated adsorption Langmuir volume VL, Langmuir pressure PL, and residual adsorption c. VL can reflect the maximum adsorption capacity of vitrain and durain coal to methane. PL can reflect the growth rate of the adsorption capacity when the pressure is low. When the figure for the PL value increased, as the growth rate of pressure decreased, a fall in both the increasing rate of the adsorption capacity at the low-pressure stage and the adsorption rate of methane were detected, respectively. The residual adsorption amount c could only indicate the size of the residual adsorption. The results of the methane adsorption and desorption of the vitrain and durain coal samples at five temperature points are shown in Figure 4.

4.2.1. Methane Adsorption Characteristics

The fitting results of methane adsorption/desorption are shown in Table 6. The fitting degree R2 in the process of adsorption and desorption was greater than 0.99, and the fitting effect was good. The saturated adsorption capacity of vitrain was 11.87~16.04 cm3/g in the process of the pressure-up adsorption of methane. The saturated adsorption capacity of durain was 9.76~12.18 cm3/g. When the temperature was the same, the saturated adsorption capacity of durain was smaller than that of vitrain, which shows that the adsorption capacity of vitrain is stronger than that of durain, and the adsorption capacities of vitrain and durain are the same under different temperatures. Secondly, the Langmuir pressure PL of vitrain was 2.37~2.73 MPa, and that of durain was 2.33~2.70 MPa. When the temperature was the same, the Langmuir pressure PL of durain was larger than that of vitrain. The adsorption rate of methane by durain was slower than that of vitrain, so that it was more difficult to reach the saturated adsorption state. The above characteristics were present at different temperatures.

4.2.2. Methane Desorption Characteristics

The desorption efficiency of methane desorption characteristics can be measured using theoretical desorption or recovery. The higher the theoretical desorption ratio and recovery ratio, the easier the desorption and production of methane. The theoretical desorption ratio of a coal sample is the ratio of the desorption and saturated adsorption when the pressure equals zero in the desorption process; namely,
η 1 = V L c V L = 1 c V L
In fact, the productivity of coalbed methane is usually measured by the recovery factor of coalbed methane. The recovery factor of coalbed methane refers to the ratio between the desorption capacity and the saturated adsorption capacity when the pressure drops to abandonment pressure (generally 0.7 MPa).
η 2 = V L c des V L
where cdes refers to the residual adsorption capacity corresponding to the desorption curve at waste pressure, mL/g.
According to the above formula, the desorption parameters and desorption efficiency of coal samples can be fitted and calculated. The theoretical desorption efficiency of vitrain and durain was 75.91% and 80.78%, respectively, and the recovery efficiency was 66.02% and 71.01%, respectively. The theoretical desorption efficiency and recovery efficiency of durain were higher than those of vitrain, indicating that methane desorption and production are easier in durain than in vitrain. Under the same pressure, the adsorption capacity of vitrain and durain coal in the desorption process was greater than that in the adsorption process, and the amount of methane adsorbed in the coal was not fully desorbed; that is, there was a desorption hysteresis phenomenon, which further indicates that the adsorption and desorption process of methane in the coal is not completely reversible. At the same temperature of the same coal sample, the Langmuir pressure PL of the desorption process was significantly higher than that of the adsorption process, which indicates that the desorption ratio of methane is relatively fast and methane is relatively easy to desorb at the initial stage of the desorption process; however, with the further development of the desorption process, the desorption difficulty increases and the desorption effect gradually weakens. The pore size of durain was larger and the connectivity was good, while semi-closed pores such as ink bottle pores were more numerous and the connectivity was relatively poor in vitrain. Therefore, after the adsorption expansion of the coal matrix of vitrain, the pore channels with poor connectivity become narrower or even closed pores. Finally, during the depressurization desorption, the methane molecules that can be desorbed through the narrow pore channels are less numerous (partially enclosed in water). Therefore, the desorption ratio of durain is higher than that of vitrain.

4.3. Adsorption Heat Analysis of Methane

Fixed n values were used to calculate the lnf at the corresponding temperature; according to the obtained lnf, the lnf −1/T was made different under different apparent adsorption capacities (0.1~0.5 mmol/g), and the isosteric adsorption heat was calculated from its slope. The adsorption/desorption data of at least three temperature points are needed to calculate the adsorption/desorption heat in the process of adsorption/desorption. Based on the experimental data of methane isothermal adsorption/desorption at the 20 °C, 25 °C, 30 °C, 35 °C, and 40 °C five temperature points of vitrain and durain in low-rank No. 4 coal seam of the Dafosi minefield, the isosteric adsorption heat of the adsorption and desorption process of vitrain and durain at different temperatures was calculated. The energy variation characteristics of the adsorption and desorption process were obtained.

4.3.1. Adsorption Heat Calculation

(1)
Adsorption process
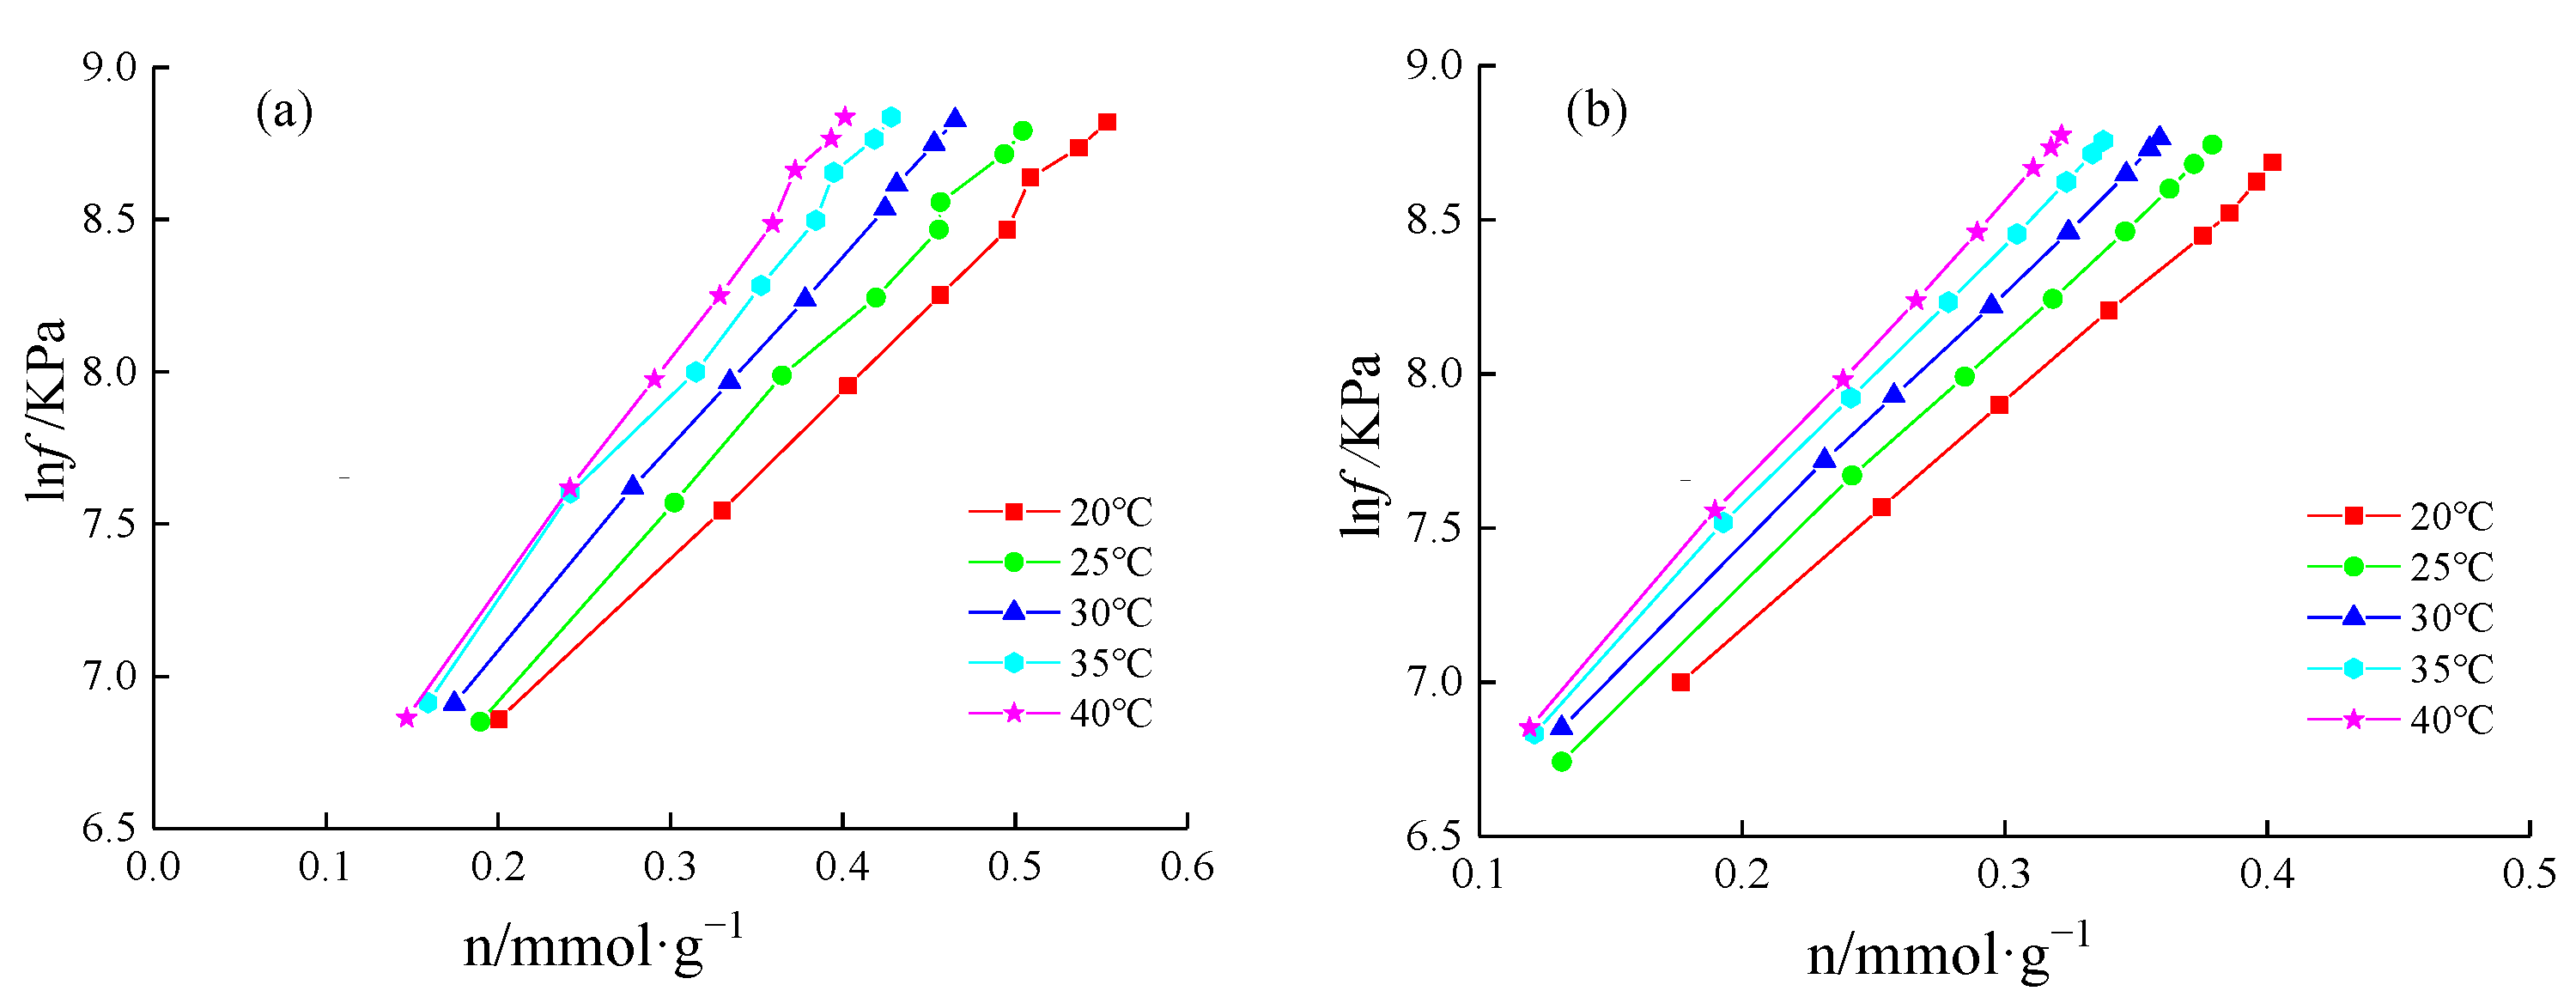
Based on the isothermal adsorption experimental data of vitrain and durain at different temperatures, the relationship between the natural logarithm of fugacity lnf (Kpa) and the adsorption capacity n (mmol/g) (Figure 5) was established, and then the lnf-n data points were linearly fitted. The fitting formula was lnf = An + B, and the fitting results are shown in Table 7.
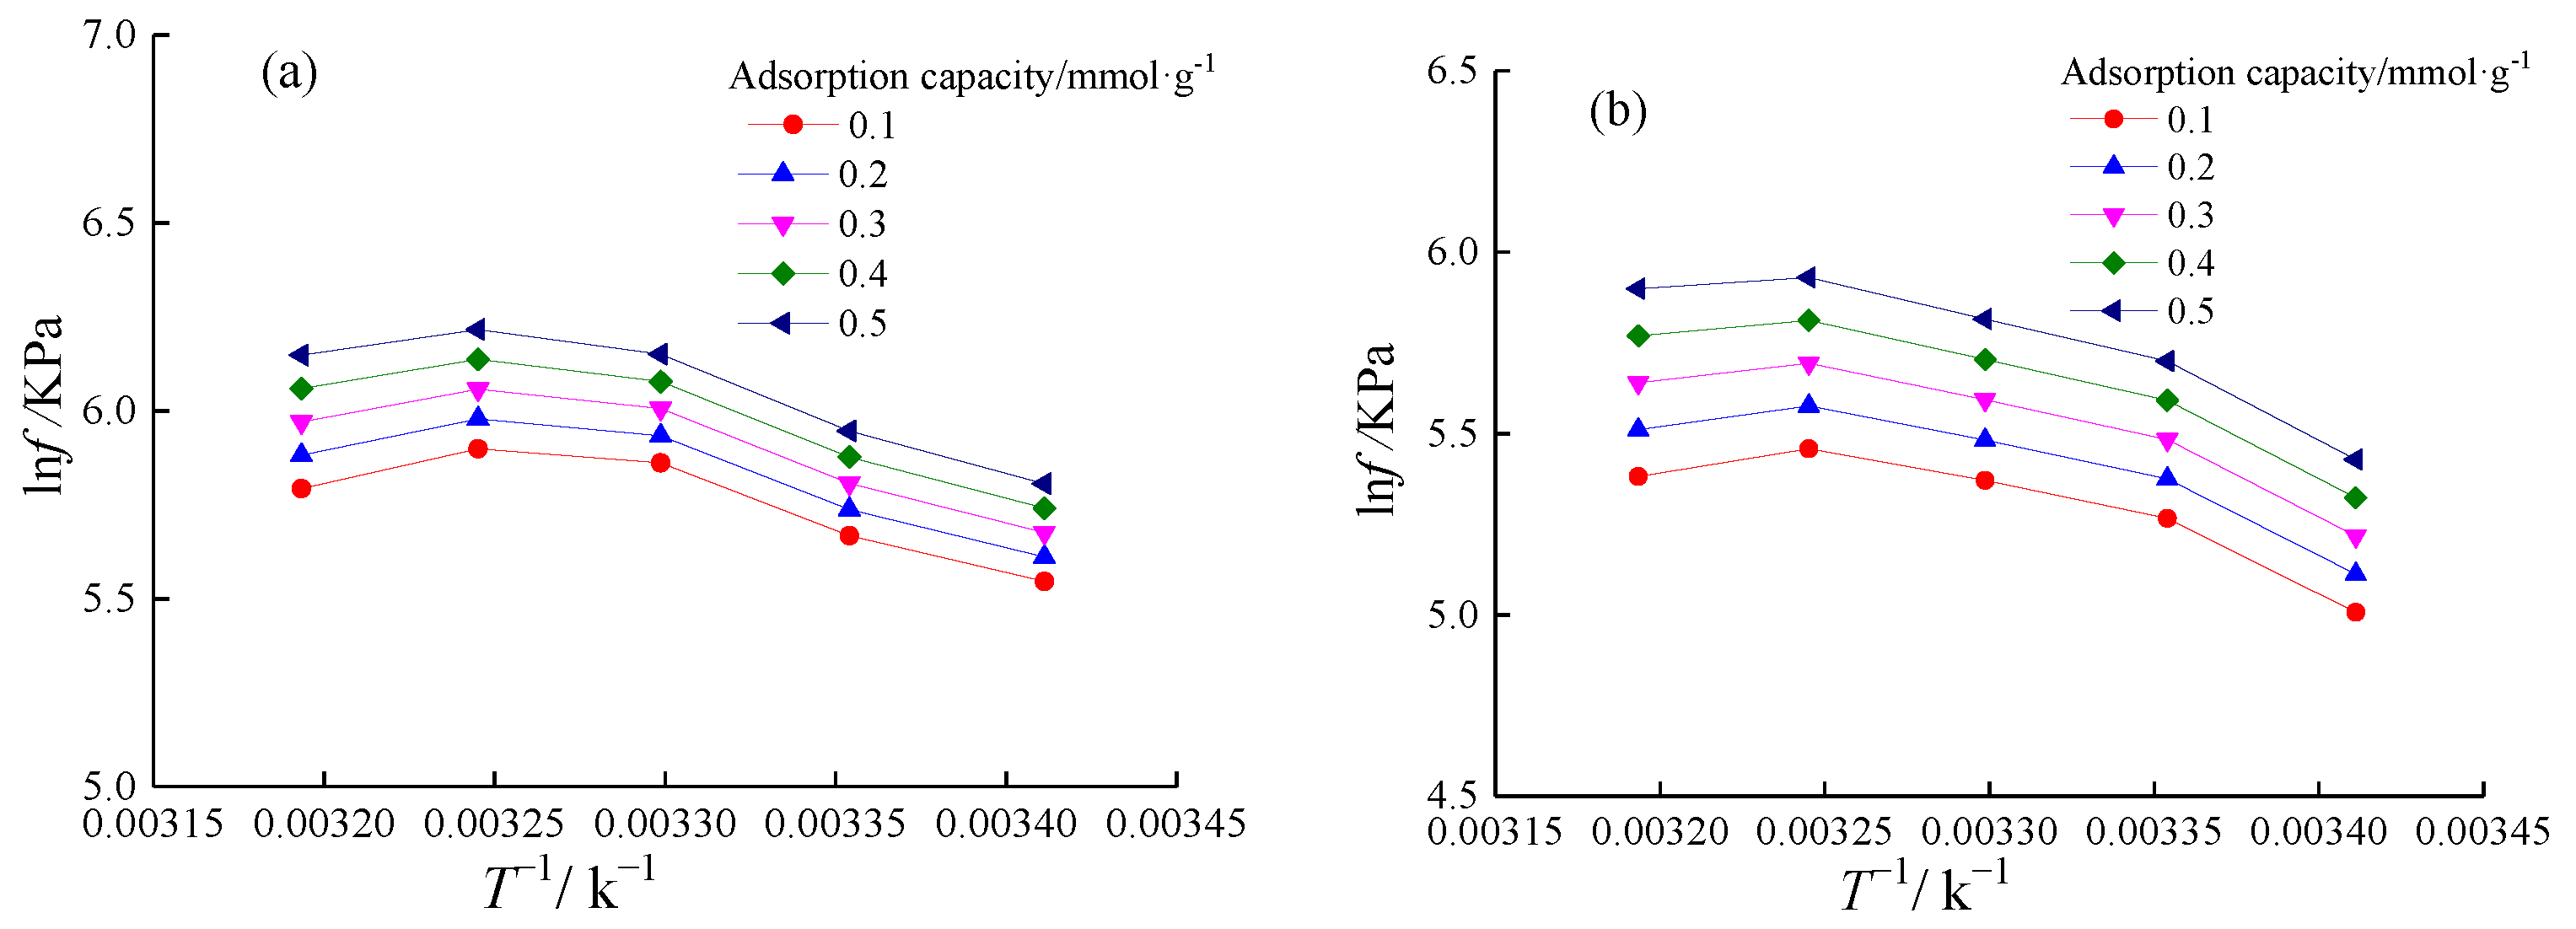
According to the fitting formula above, given different adsorption capacities, the lnf values at different temperatures were calculated under different fixed adsorption capacities, and linear fitting was carried out for the relationship between lnf and T−1. The fitting equation is shown in Figure 6.
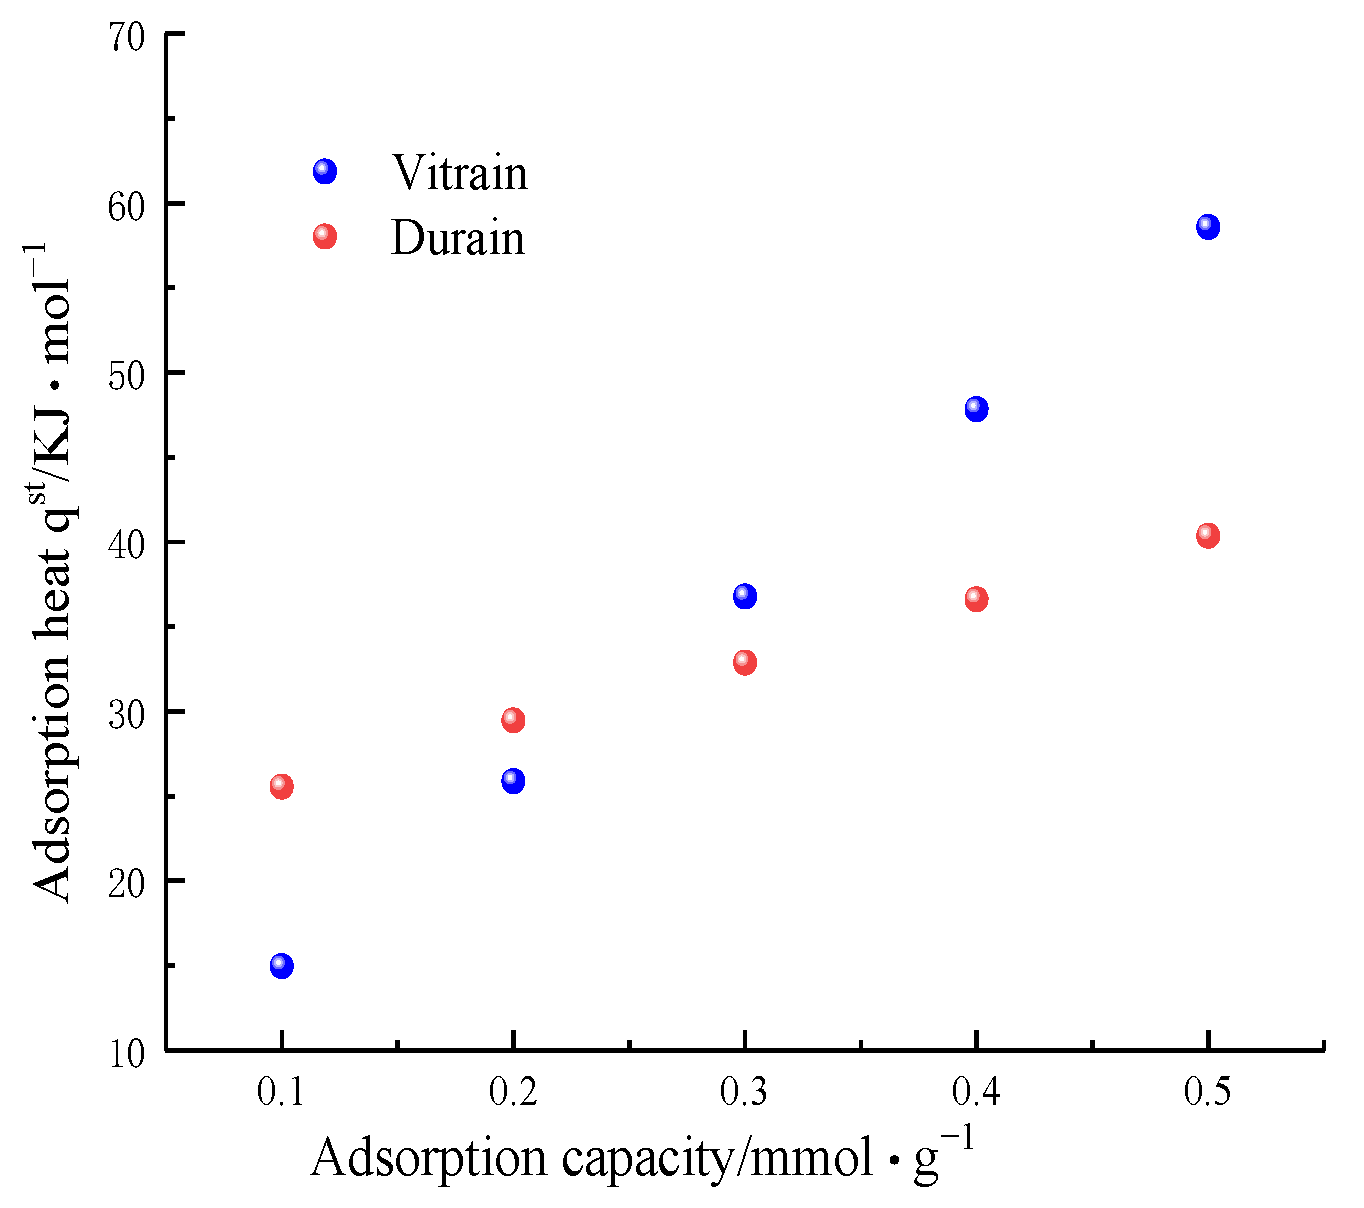
Using experimental data from the methane isothermal adsorption of vitrain and durain samples in the Dafosi area, the calculation results of isosteric adsorption heat of methane in the adsorption process are shown in Table 8. Different adsorption capacities resulted in different methane isosteric adsorption heat values. In the range of an adsorption capacity of 0.1~0.5 mmol·g−1, the isosteric adsorption heat of vitrain was 14.88~58.57 kJ·mol−1, and that of durain coal was 25.79~40.23 kJ·mol−1.
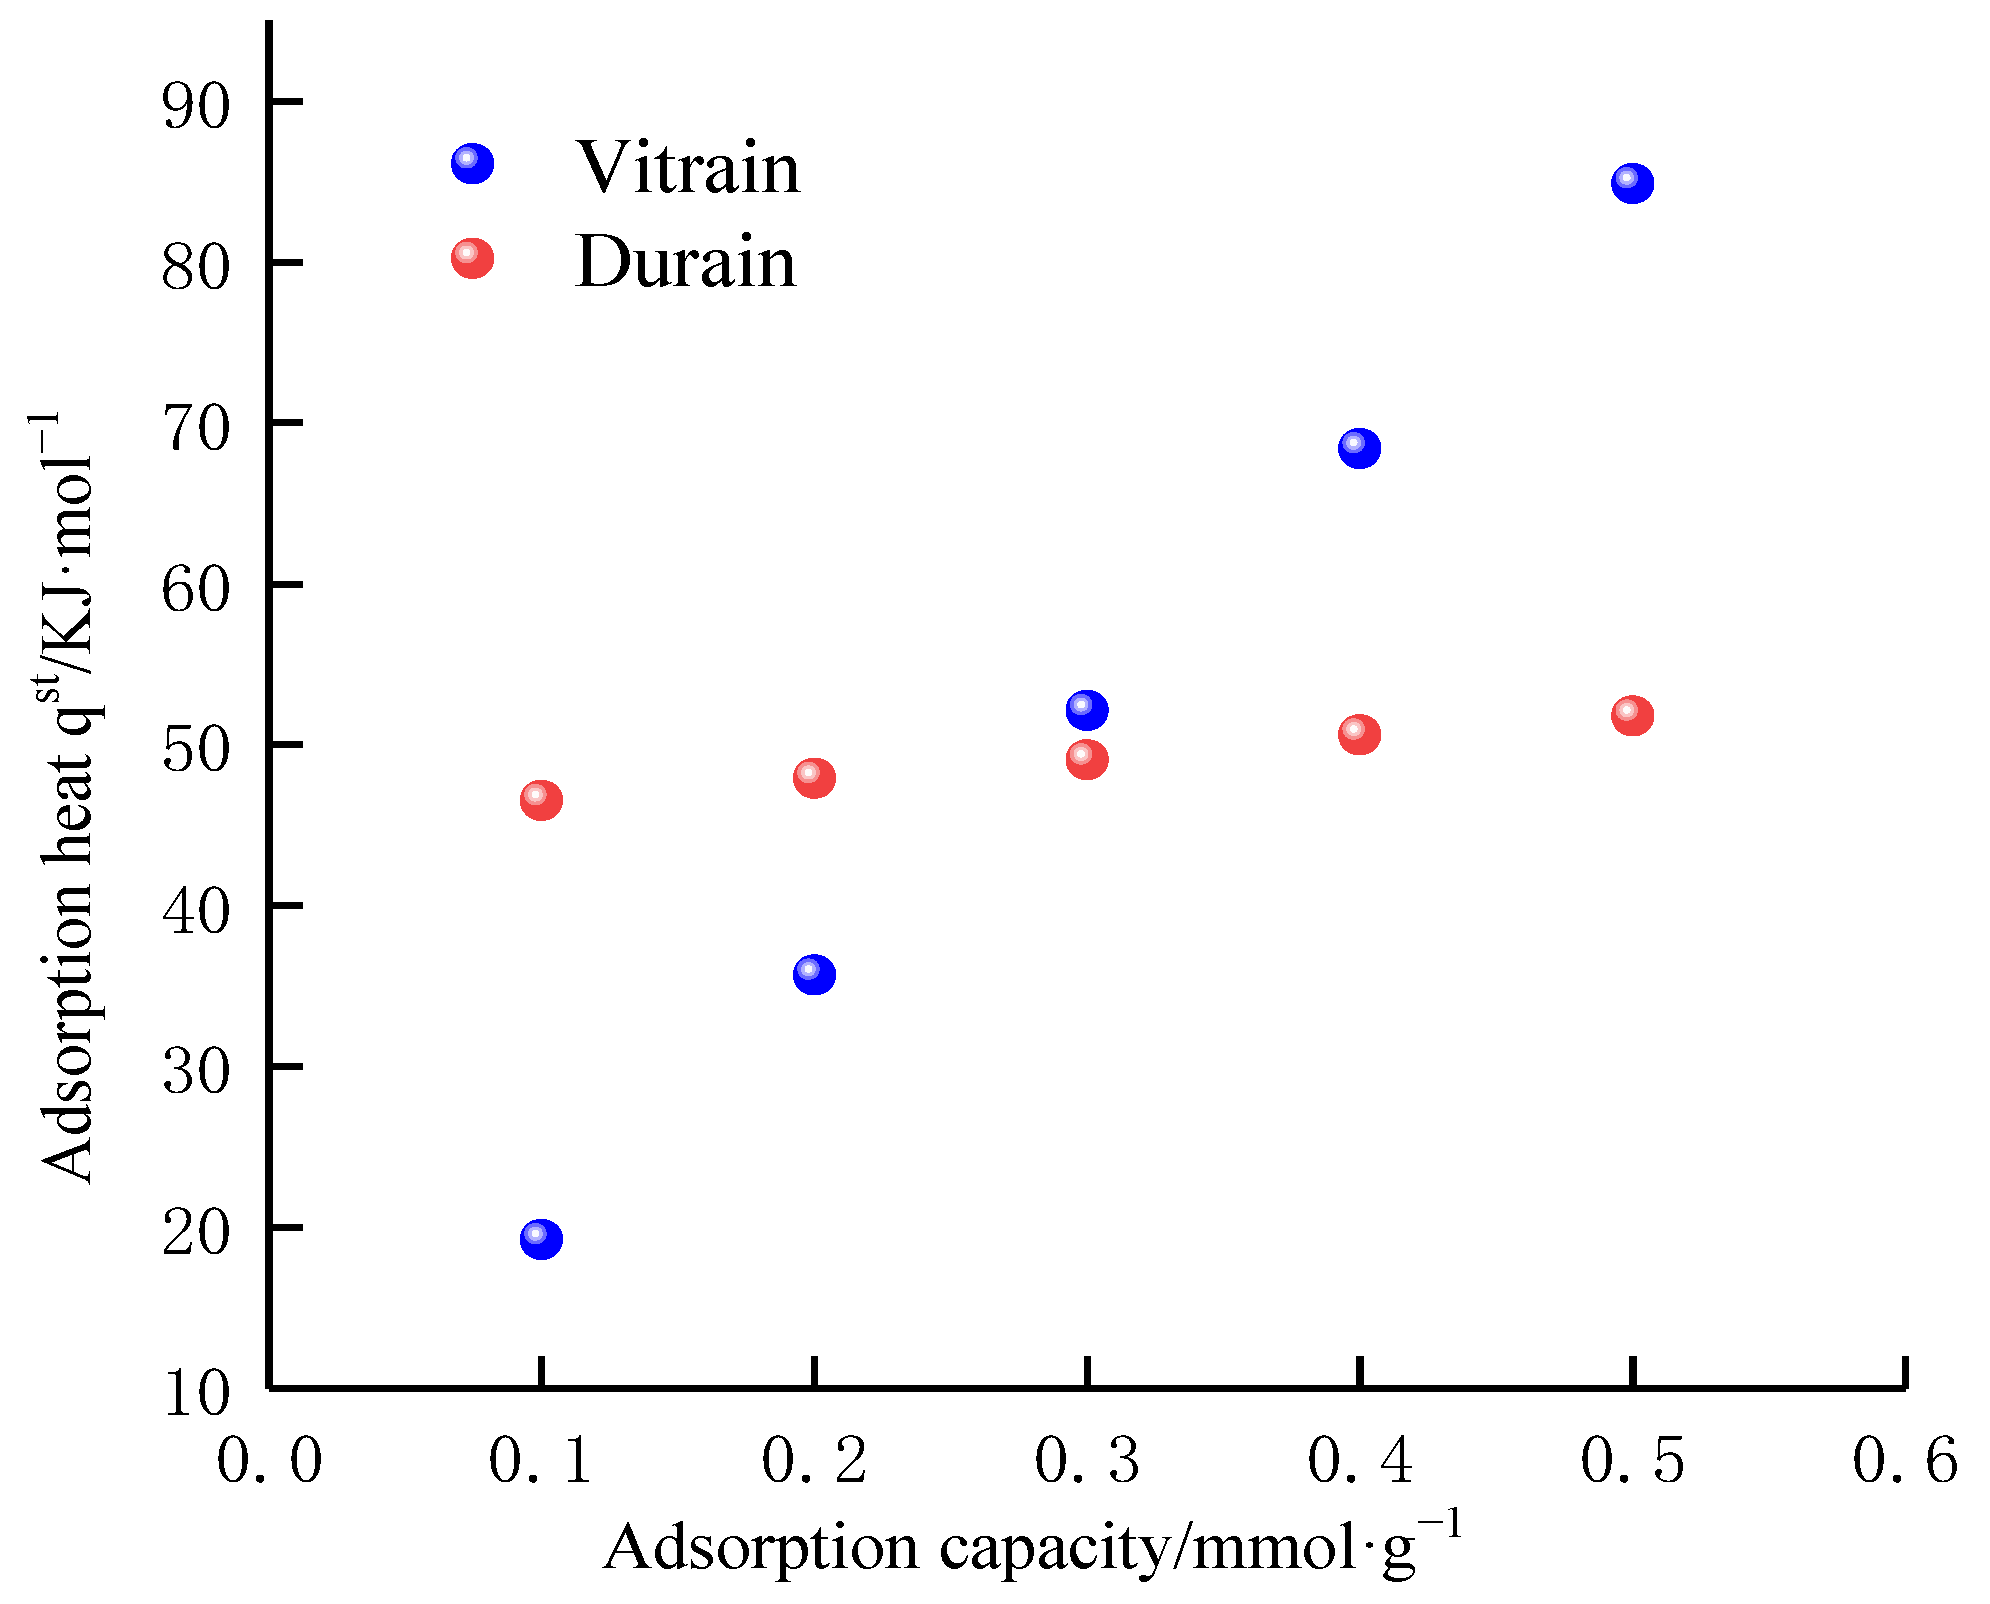
In the process of methane adsorption, the isosteric adsorption heat was dynamically changing. In the adsorption process, the isosteric adsorption heat was proportional to the methane adsorption range, the increased rate of the isosteric adsorption heat of vitrain was greater than that of durain coal, and the isosteric adsorption heat of vitrain increased faster (Figure 7). In the initial stage of adsorption (when the adsorption capacity was less than 0.3 mmol·g−1), the pressure was lower, the ability of methane to adsorb durain coal was stronger, and its isosteric adsorption heat was greater. In the later stage of adsorption (when the adsorption capacity was greater than 0.3 mmol·g−1), with the increase in pressure, methane was mainly adsorbed into the micropores, which are difficult to be adsorbed in. The developed micropores of vitrain caused the isosteric adsorption heat of vitrain to become greater than that of durain coal in the middle and later stages of the adsorption process, and the molecular force between coal and methane was strong, which made methane adsorption easier. This was consistent with the results of the isothermal adsorption experiment.
(2)
Desorption process
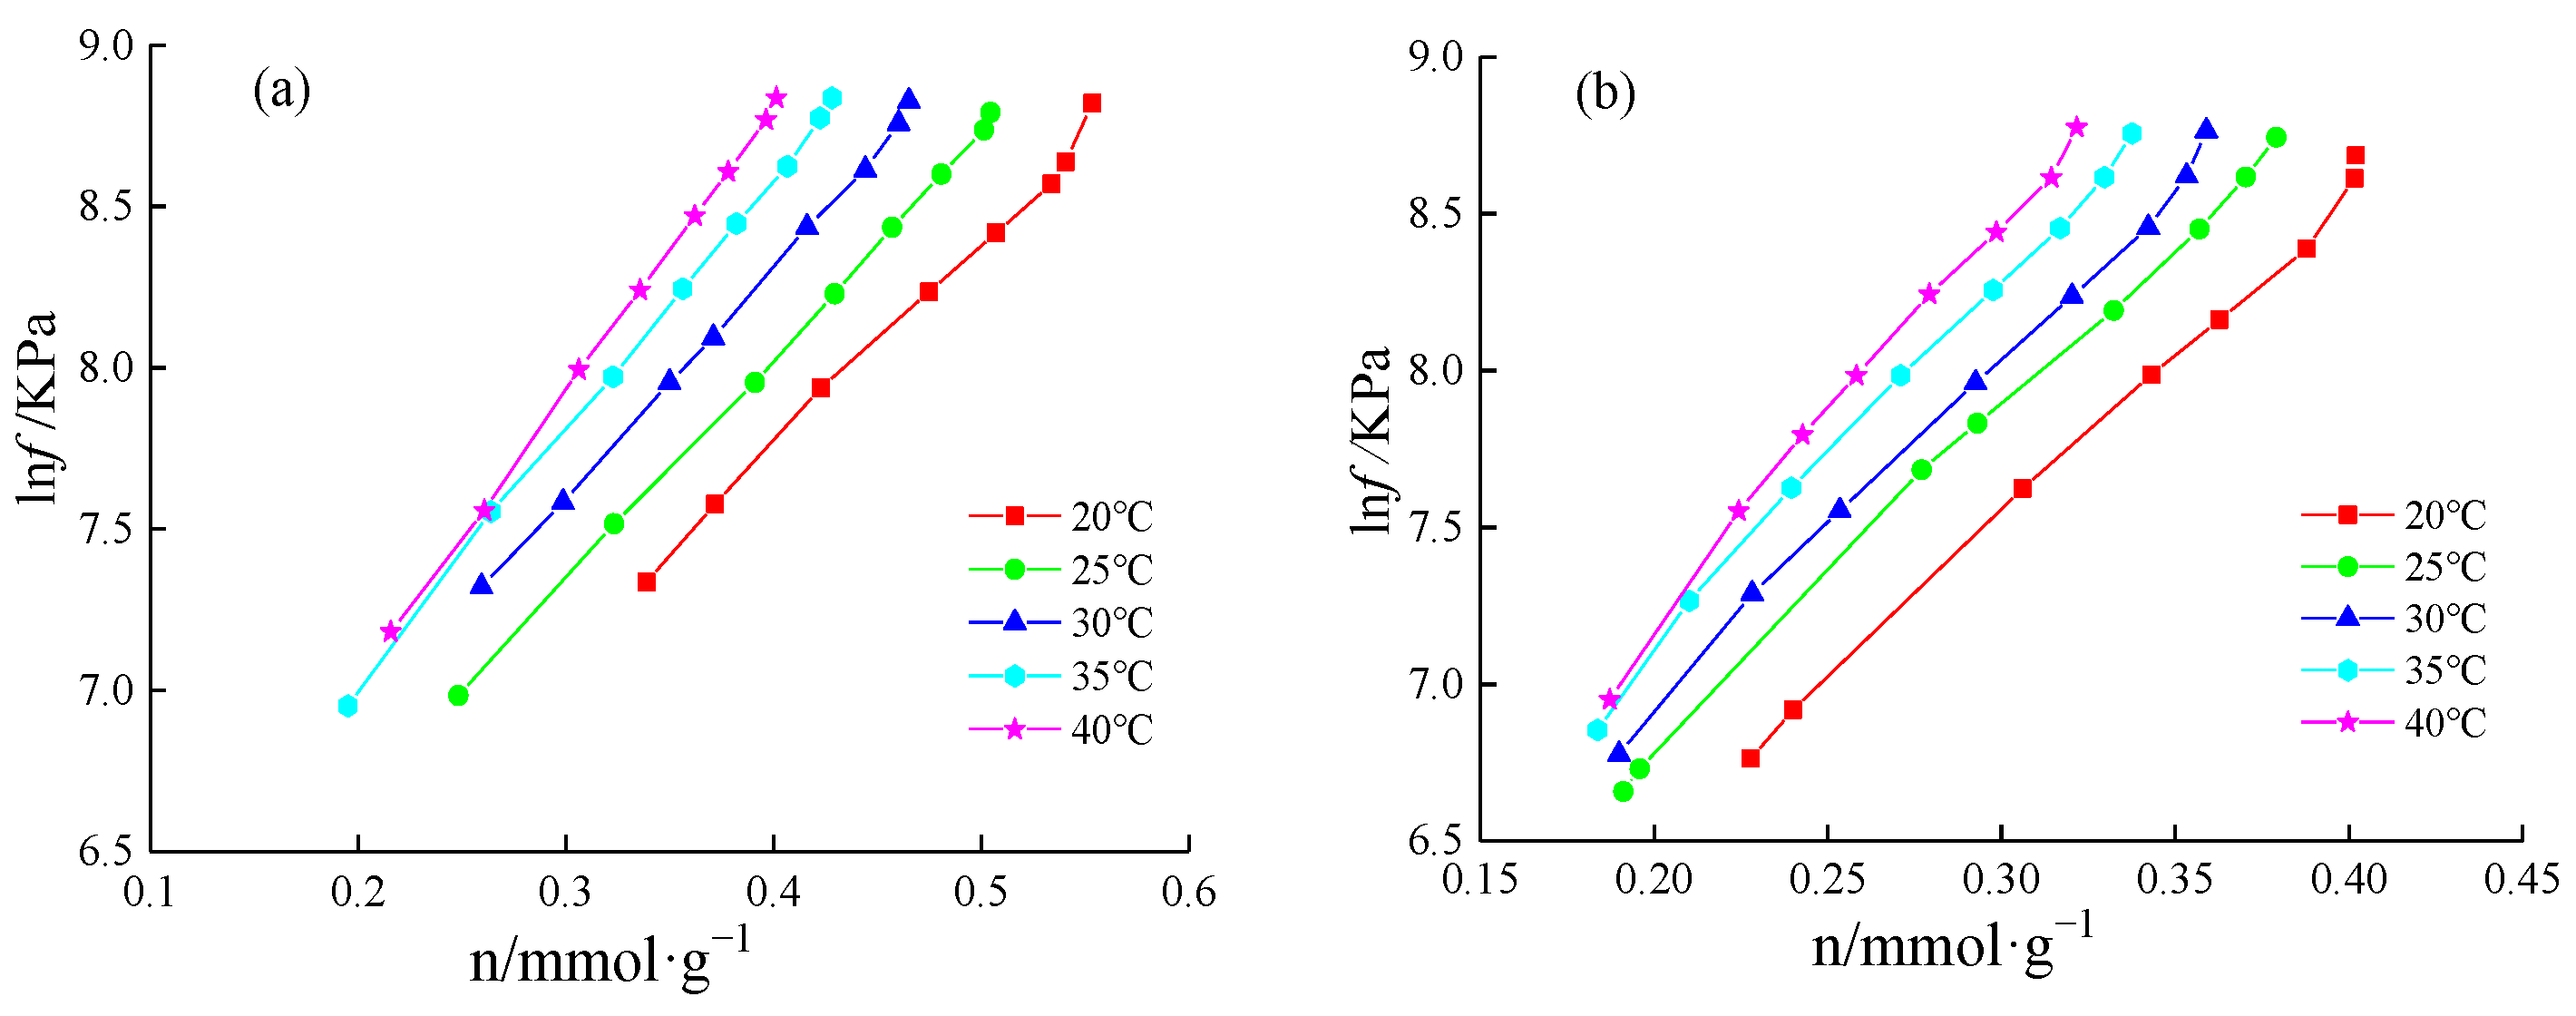
According to the same method mentioned above, the desorption experimental data of the vitrain and durain samples were processed. The relationship between the logarithm of fugacity lnf (Kpa) and the adsorption capacity n (mmol/g) of the methane desorption process at different temperatures is shown in Figure 8. The results of the fitting relationship lnf = An + B are shown in Table 9.
According to the above fitting formula, given different adsorption capacities, the lnf value at different temperatures was calculated; under different fixed adsorption capacities, the relationship data between lnf and T−1 were linearly fitted (Figure 9), and the slope C was obtained. The final results of the isosteric adsorption heat of the methane desorption process of vitrain and durain are shown in Table 10.
Methane in coal seam was desorbed by absorbing heat, and the adsorption heat corresponding to the desorption process represents the absorbed heat during desorption. In the desorption process, within the range of an adsorption capacity of 0.1~0.5 mmol/g, the equivalent adsorption heat of vitrain was 19.27~84.46 kJ·mol−1, and that of durain was 46.73~51.87 kJ·mol−1 (Table 10).
The adsorption heat of the desorption process reflects the heat to be absorbed during methane desorption. Within the desorption process, the desorption amount increases, the adsorption amount decreases, and the isosteric adsorption heat decreases (Figure 10). In the process of desorption, the change trend in the adsorption heat of vitrain and durain coal was the same. In the initial stage of desorption (when the adsorption capacity was more than 0.3 mmol/g), methane was first desorbed in large and medium pores. The pores of durain coal are more evenly developed and have better connectivity. There was a greater number of micropores and poorer connectivity in vitrain. Compared with durain coal, it was more difficult for vitrain to desorb methane. Therefore, the desorption of methane in vitrain needed to absorb more heat than durain coal in the middle and late stages of the desorption process (when the adsorption capacity was less than 0.3 mmol/g), methane desorption in micropores was dominant, and vitrain developed more micropores, which is an advantage in desorption at this stage. Therefore, vitrain required less heat absorption, and the isosteric adsorption heat was less than that of durain.

4.3.2. Adsorption Heat Variation

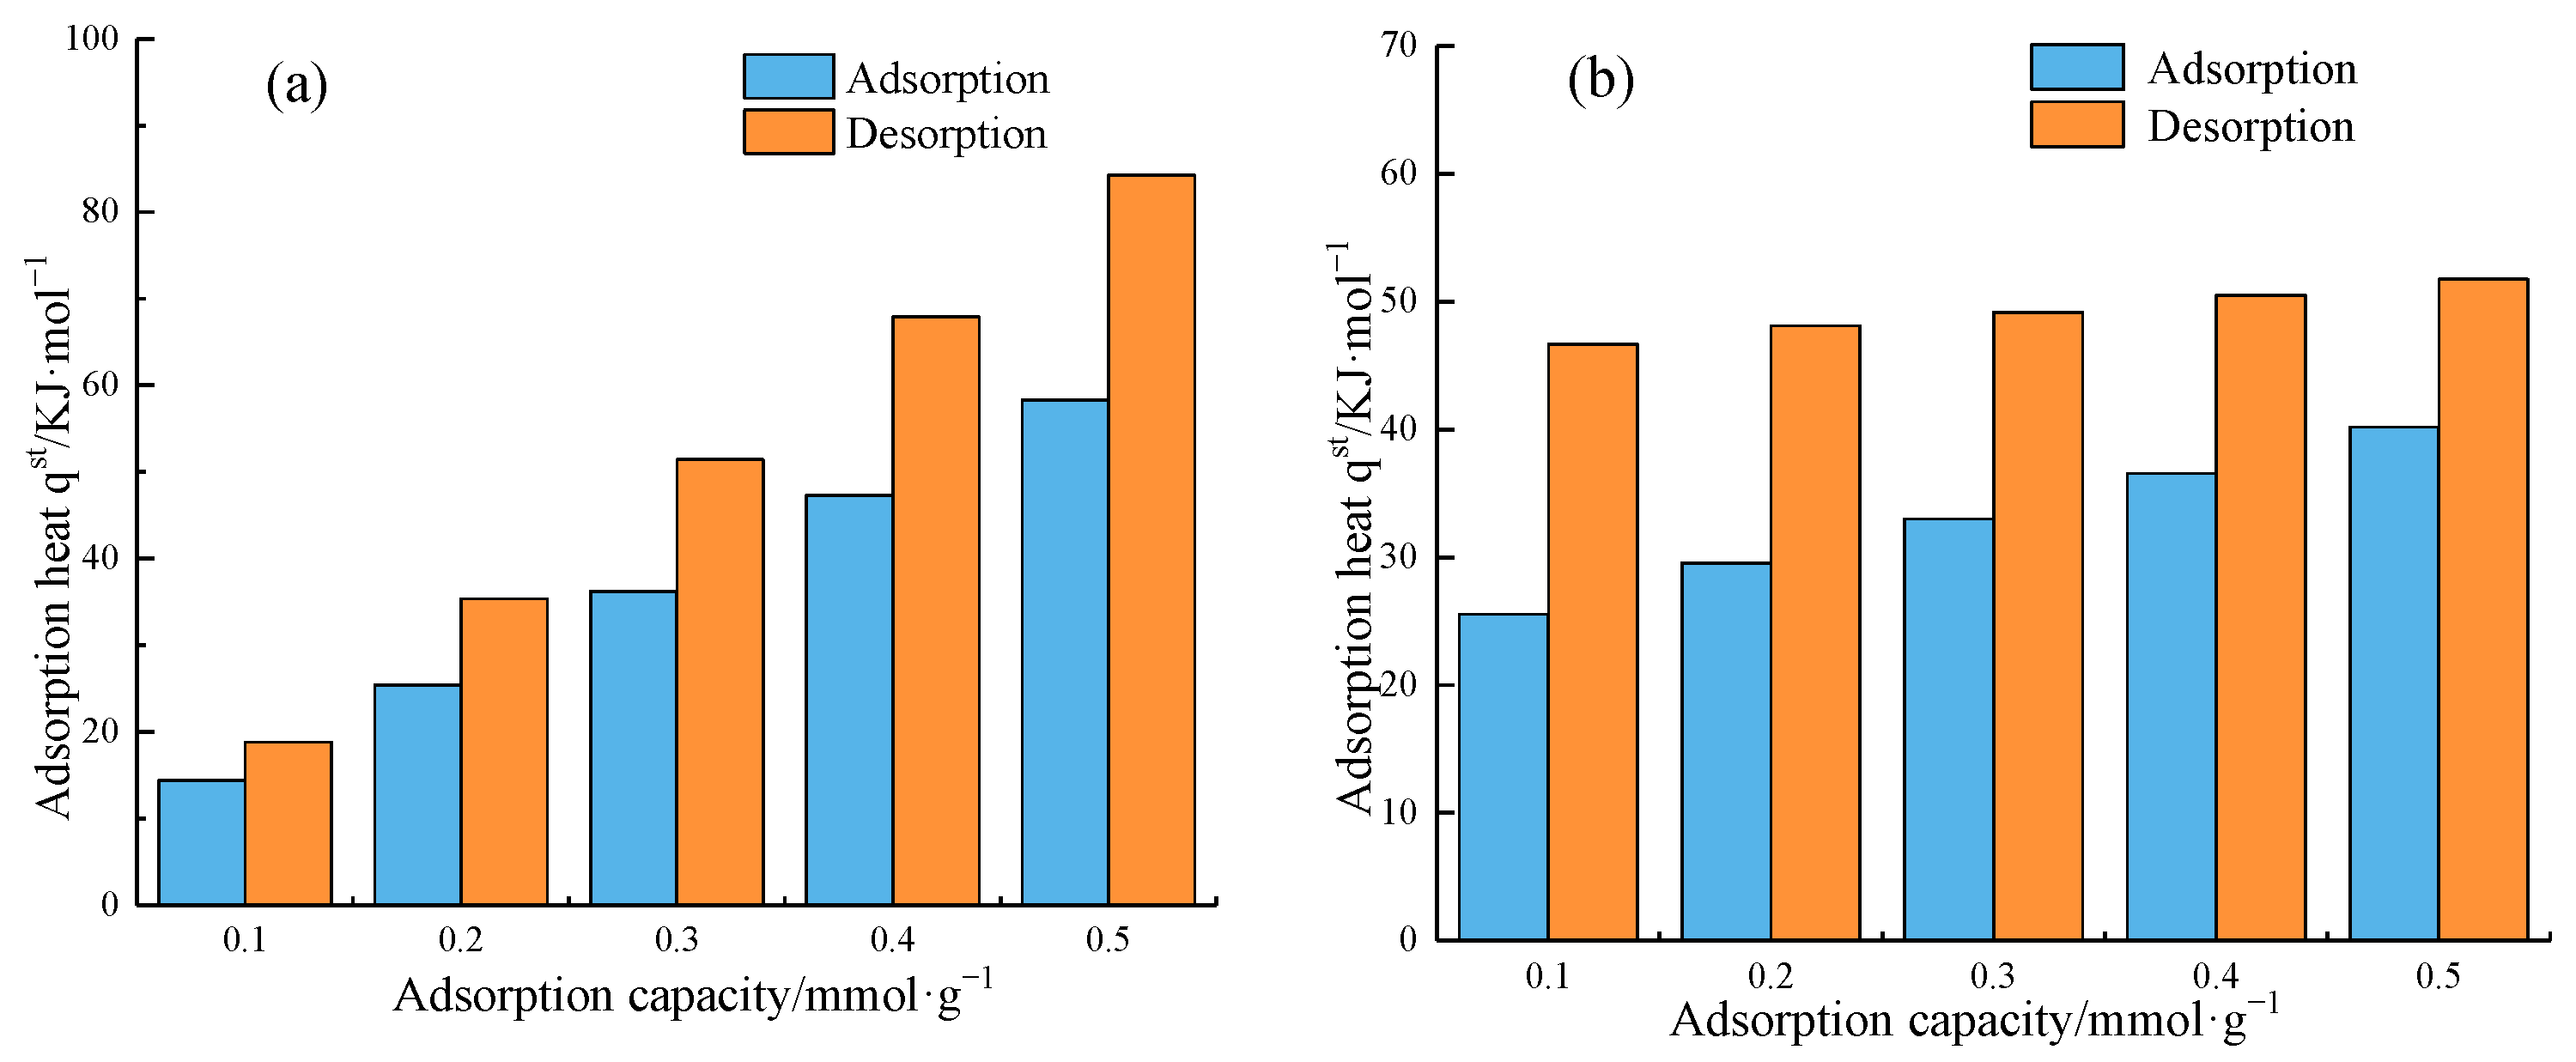
Under the same adsorption capacity, the adsorption heat of the desorption process of vitrain and durain was greater than the corresponding adsorption heat of the adsorption process (Table 11 and Figure 11). The heat released by the adsorption of unit amount of methane molecules cannot make the same amount of methane molecules desorb, indicating that under the same conditions, the desorption of methane needs to absorb additional heat, and that is the essence of desorption hysteresis. Desorption heat supplement is equivalent to methane desorption needing to absorb additional heat, that is, the heat supplement of the external environment during methane desorption.
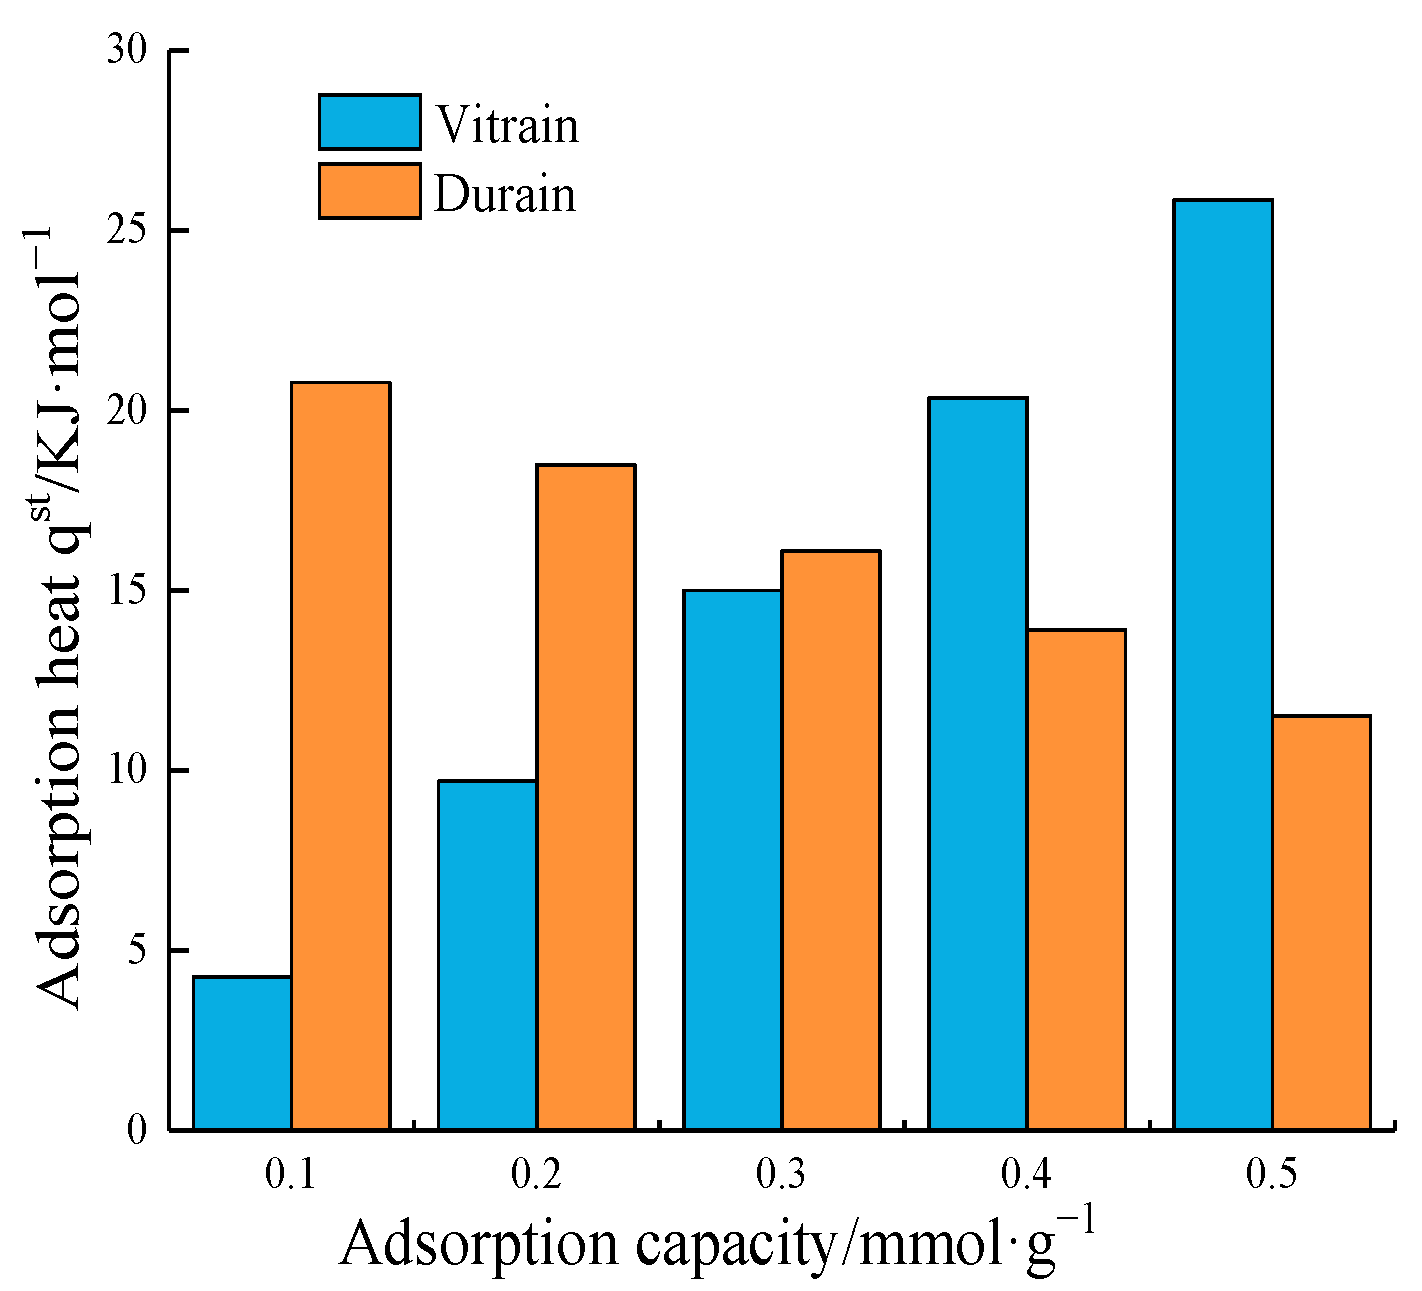
In addition, under different adsorption capacities, that is, in different pores, the adsorption heat difference of the methane adsorption and desorption process was dynamically affected by the corresponding pore structure. Due to the obvious difference in pore characteristics between vitrain and durain, the difference in adsorption heat between adsorption and desorption under different adsorption capacities was also very great, which can be regarded as the energy absorbed from the coal methane system when the corresponding amount of methane was desorbed. When the adsorption capacity was low (corresponding to the larger pores in the coal), the required heat of methane desorption within the vitrain was less than that in the durain; when the adsorption capacity was high (corresponding to the smaller pores in the coal), the needed heat of methane desorption in the vitrinite was more than that in the durain (Figure 12).

4.4. Effects of Wettability on Methane Adsorption and Desorption

4.4.1. Characteristics of Wettability on Adsorption and Desorption

The stronger the methane adsorption capacity and the faster the efficiency of coal samples with different surfactants, the higher the adsorption curve will be (Figure 13). The saturated adsorption capacity of methane was G502 > air dry basis sample > equilibrium water sample > 6501 > JFC > LAS. The coal samples treated with G502 had the greatest methane adsorption capacity and the fastest efficiency. However, the better the wettability of the coal sample treated with the surfactants (positive wetting agent), the stronger its attraction to water molecules, occupying the adsorption space of methane molecules and resulting in a reduction in methane adsorption. The saturated adsorption capacity of LAS with good wettability was only 5.626 cm3·g−1 (Table 12), while that of G502 with strong hydrophobicity was 26.984 cm3·g−1.
The coal sample with poor wettability had the strongest adsorption capacity for methane; that is, it had the weakest desorption capacity for methane, and the desorption curve was at the top among other agents’ curves, such as that of the G502 coal sample (Figure 13). As the wettability worsened, the adsorption speed was enhanced, the desorption speed was decreased, and the figure for Langmuir pressure PL was decreased, irrespective of other conditions. For example, the Langmuir pressure PL (4.444 Mpa) of the G502 coal sample was much larger than that of the other samples.
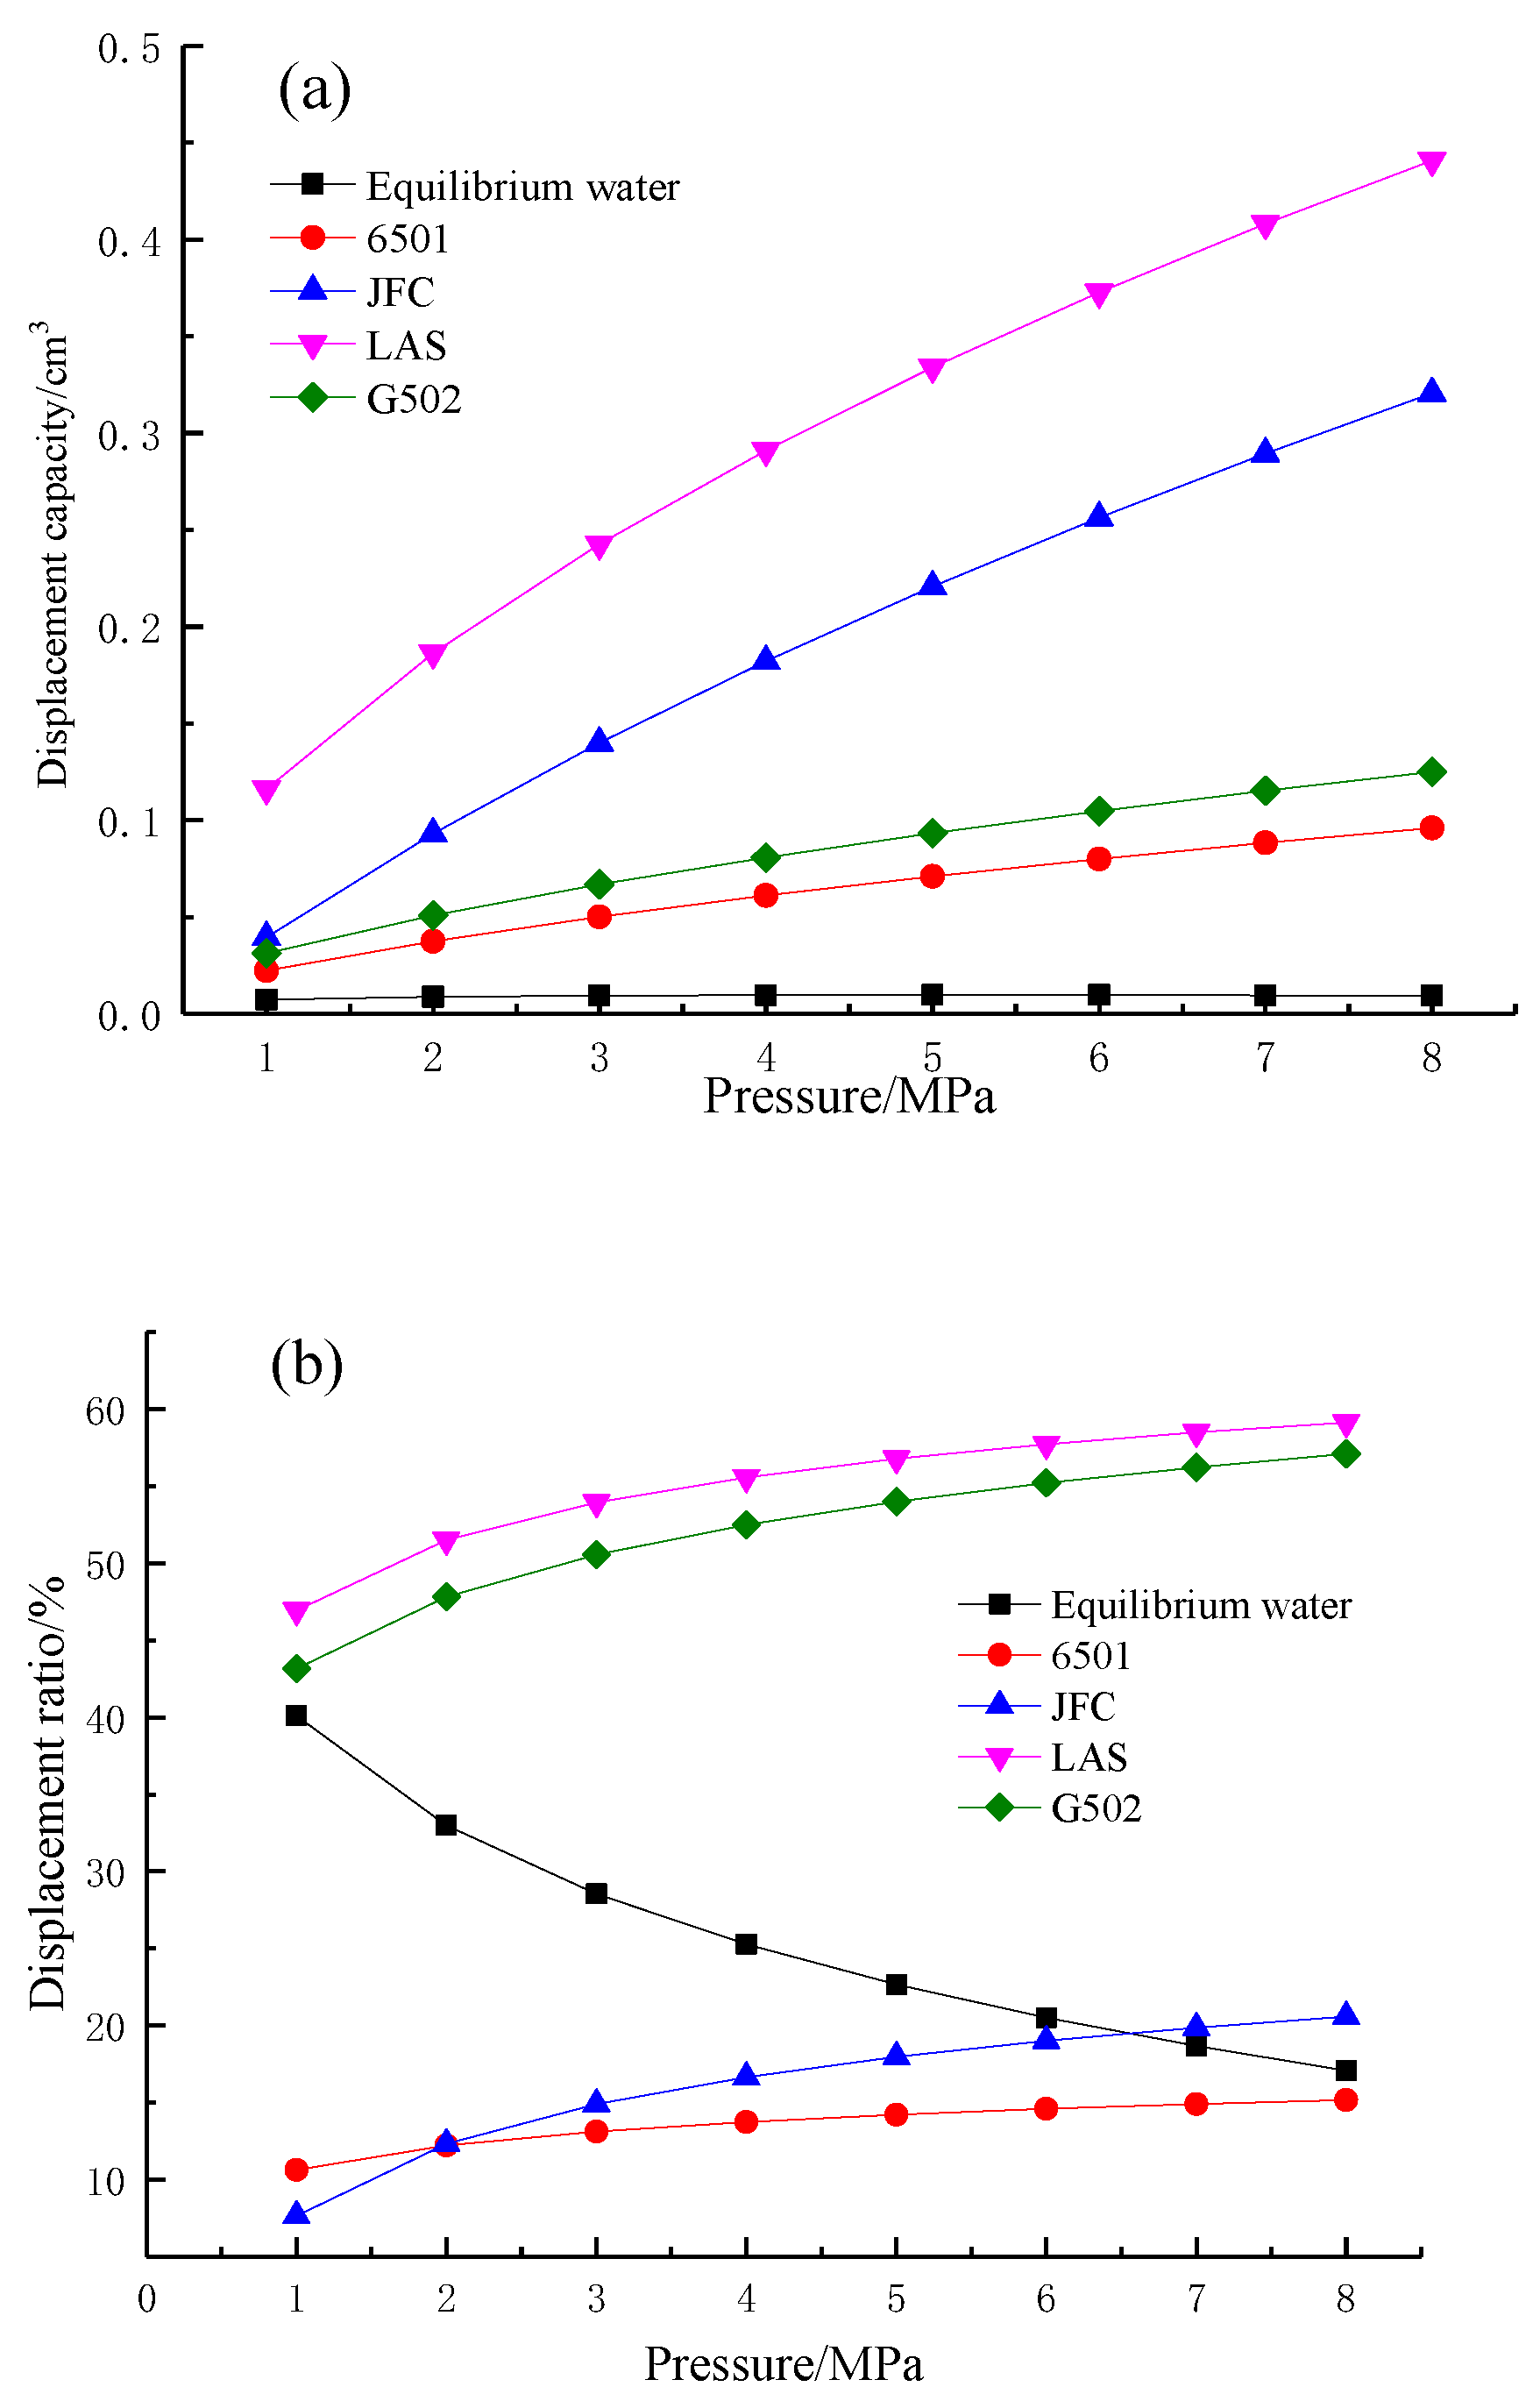
The interaction between water and coal surface (hydrogen bond) is greater than that between coal and methane (dispersion force). Water molecules affect the adsorption of methane by occupying the adsorption sites of methane. Therefore, the mechanism of the influence of wettability on methane adsorption can be regarded as the substitution of water for methane. The effect of water on methane adsorption is almost nonexistent beyond the critical value of water. The displacement of methane by water can be measured by the displacement capacity and displacement ratio.
For coal samples treated with different surfactants, the displacement capacity and displacement ratio increased with the increase in pressure. At the same temperature and pressure, the absolute value of displacement capacity (from large to small) can be ranked as LAS, JFC, G502, 6501, and equilibrium water (Figure 14), and the absolute value of displacement ratio (from large to small) can be ranked as LAS, G502, JFC, and 6501 (Figure 14). It can be seen from the above that water is more easily adsorbed on the coal surface; the coal samples treated with the LAS, JFC, and 6501 surfactants with better wettability strengthen the attraction of coal to water, making water molecules occupy the adsorption position on the coal surface more effectively. With the further increase in pressure, the coal with better wettability absorbs more water, displaces more methane, and has a higher displacement ratio, and it further promotes the desorption of methane. G502 has the effect of gas wetting reversal, which is stronger than equilibrium water and 6501 in methane adsorption. Generally speaking, the positive wetting agent can promote the displacement of methane by water, the negative wetting agent is conducive to the adsorption of methane, and the increase in pressure can promote the displacement.
The effect of wettability on the methane adsorption and desorption is essentially determined by changing the wettability of water and the coal surface. The increase in moisture content in coal will lead to the increase in wettability, and the increase in moisture content and wettability will significantly reduce the adsorption capacity of methane. The adsorption of methane and coal can be changed by changing the adsorption degree of coal and water. At present, surfactant can be added to change the wettability of coal surface and further change the influence of coal on methane adsorption and desorption.

4.4.2. Effects of Wettability on Desorption

The effects of surfactants on methane desorption can be studied according to desorption capacity, desorption efficiency, and desorption hysteresis.
(1)
Methane desorption capacity
Methane desorption capacity is the methane capacity desorbed from the surface of the coal matrix caused by depressurization, as shown in Equation (9).
Q d = ( V d - V a ) m
where, Qd is the depressurization desorption amount of methane isothermal desorption, cm3, m is the mass of the corresponding coal sample in the methane adsorption/desorption experiment, g; Vd and Va, respectively, correspond to the adsorption capacity in the process of depressurization and pressurization, cm3/g.
As shown in Figure 15, the desorption curves of coal samples treated with different surfactants showed that the desorption capacity decreased with the increase in pressure; that is, the depressurized desorption capacity decreased. When the pressure was less than 2 MPa, the curve gradually slowed down with the increase in pressure; that is, the amount of depressurized desorption decreases, indicating that a pressure less than 2 MPa is not conducive to methane desorption. The desorption curve is obviously the steepest in the whole pressure range, and the desorption efficiency is the fastest. However, the desorption curve of the high-pressure stage (5~8 MPa) slows down with the increase in pressure, and the desorption ratio was slow, indicating that the desorption of methane is not utilized at a higher pressure. Therefore, on the whole, the medium pressure stage (2~5 MPa) is most favorable for methane desorption. At the same time, for the depressurization desorption capacity of coal samples treated with different surfactants was G502 (strong G502 gas wetting effect) > 6501 > equilibrium water > air dry basis > JFC > LAS, and the depressurization desorption of coal samples treated with different surfactants increased with the increase in temperature.
(2)
Methane desorption efficiency
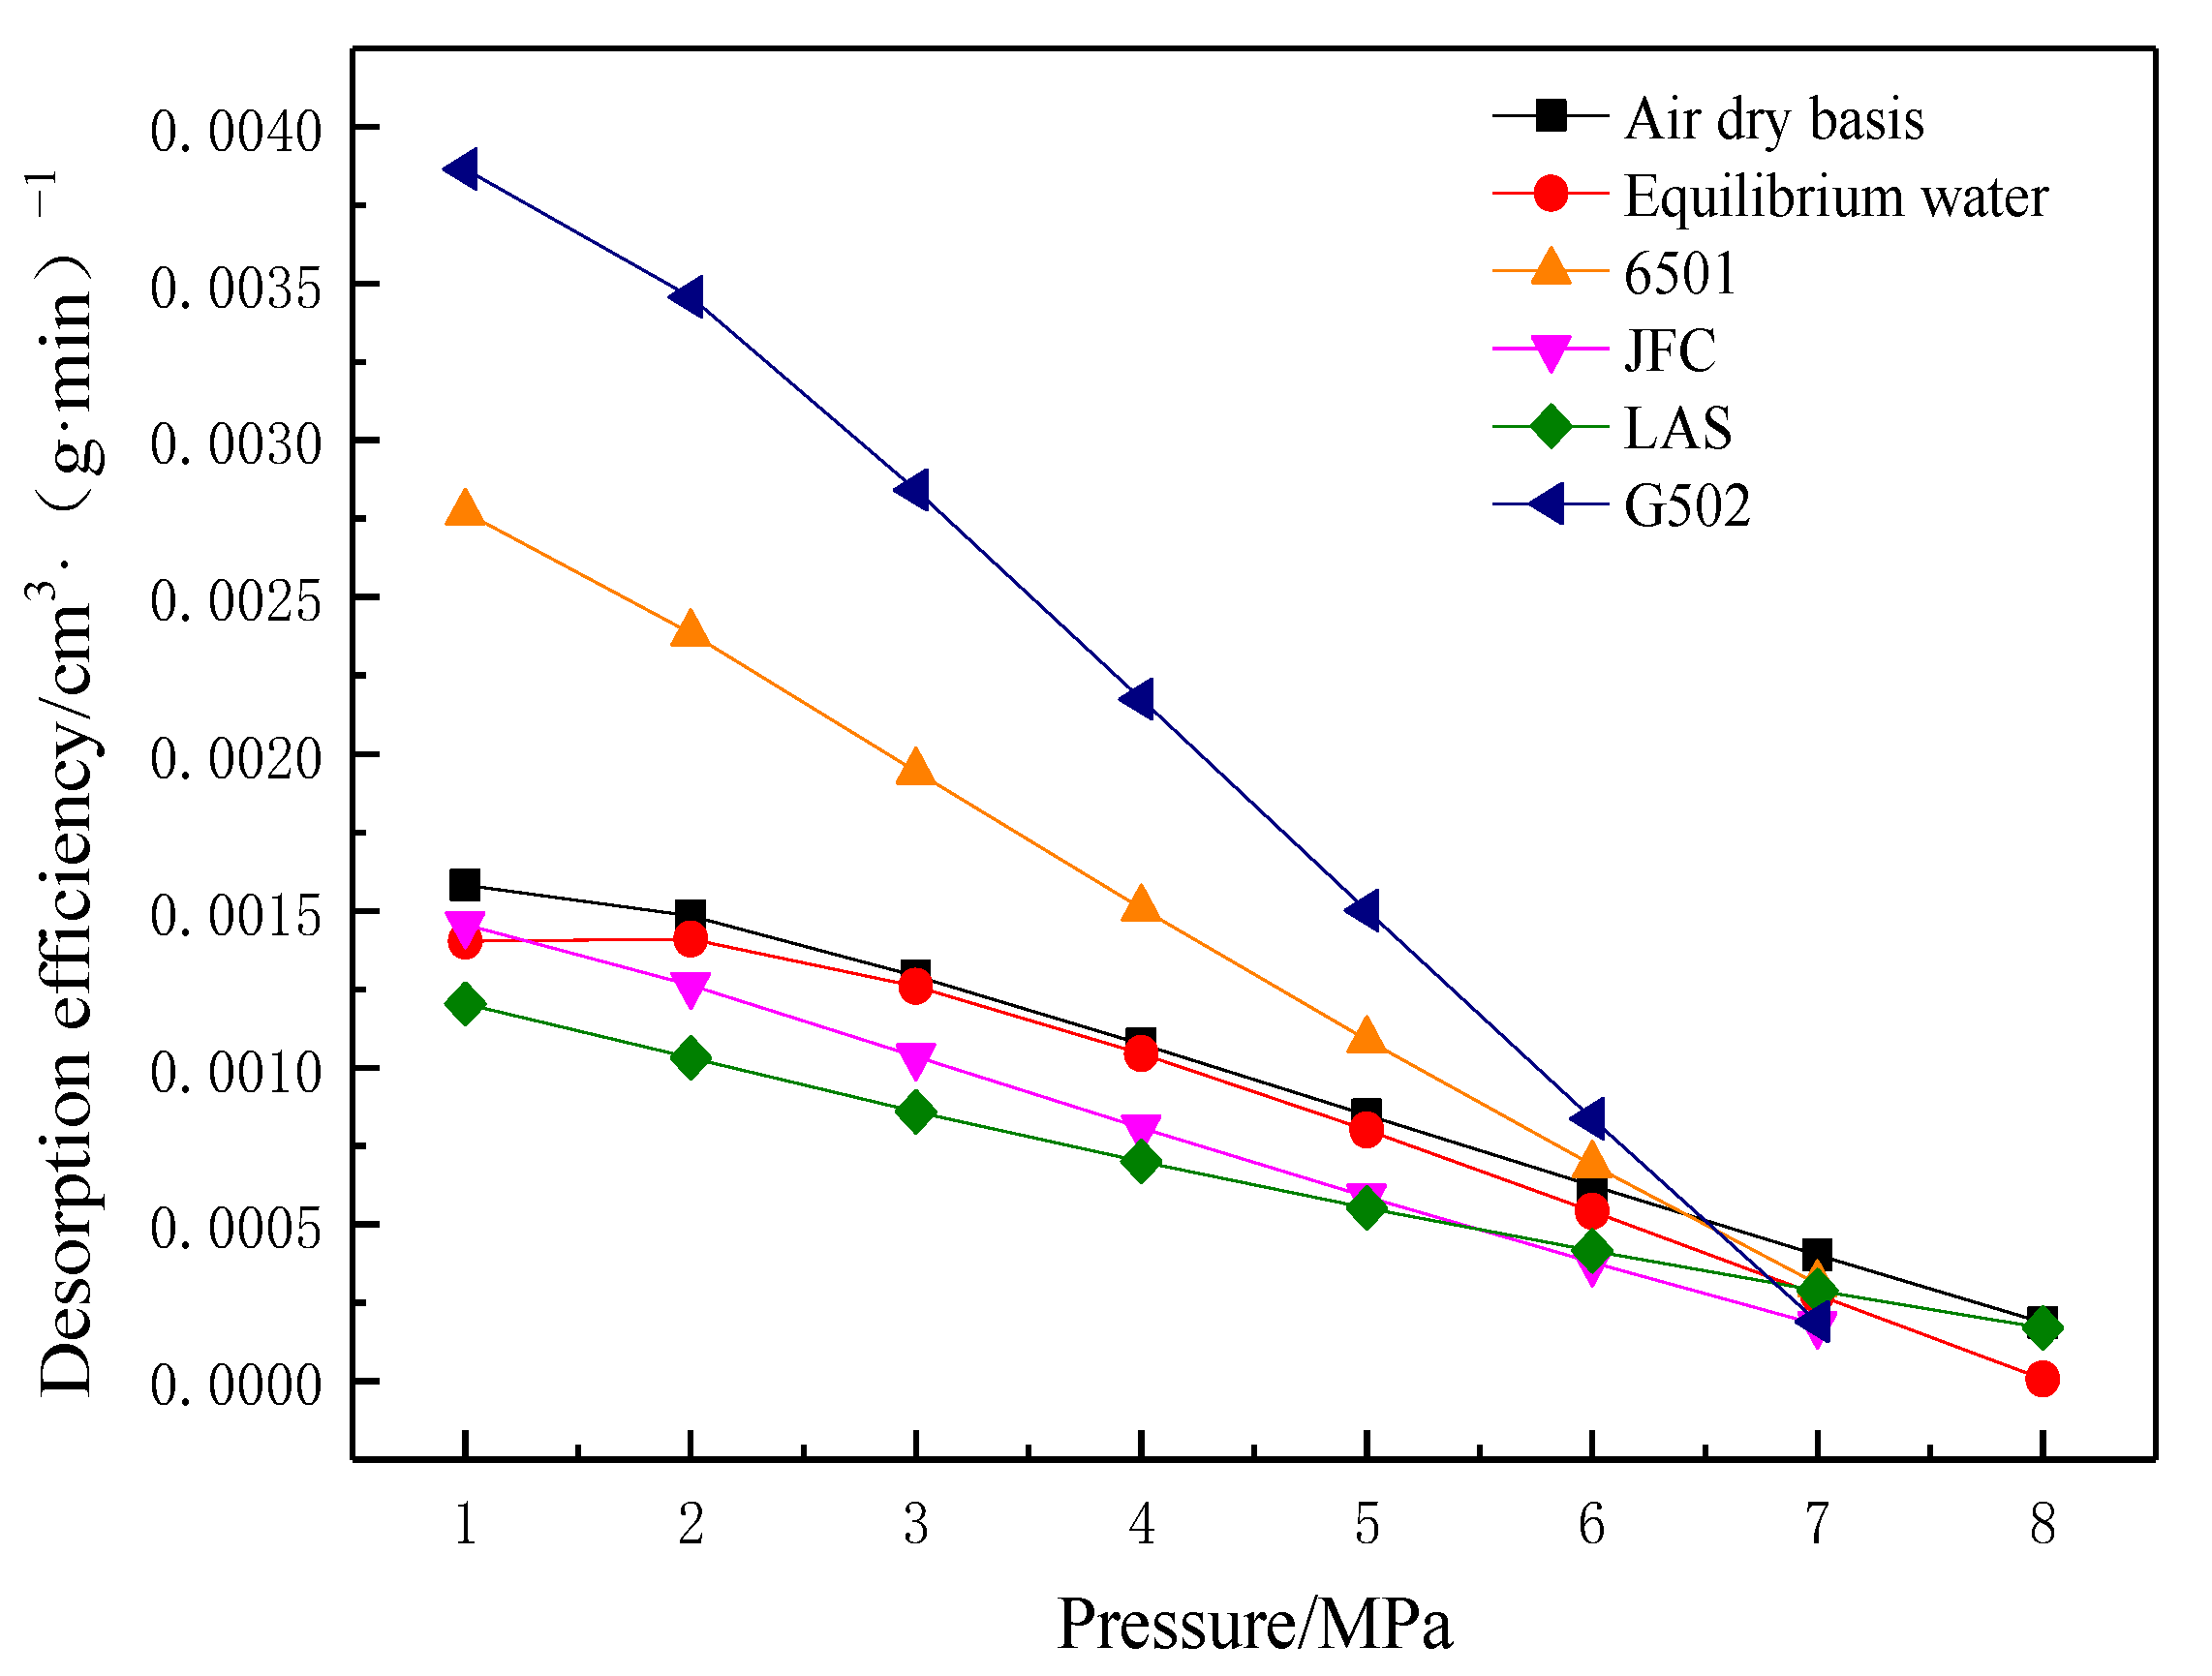
Desorption efficiency refers to the rate of desorption of methane gas from coal samples with unit pressure drop in unit time, cm3/(g·min). The equilibrium time of methane isothermal adsorption/desorption experiment is 12 h, as shown in Equation (10).
V = Q d 720 = ( V d V a ) 720 .
where V is the desorption efficiency of methane in the depressurization desorption process, cm3/(g·min).
The desorption efficiency of the coal sample decreased with the increase in pressure (Figure 16). Under the same temperature and pressure, the desorption efficiency was G502 > 6501 > JFC > LAS. Excepting 6501, the desorption efficiency of the coal sample treated with other surfactants was relatively small; the change trend was relatively close, and the desorption efficiency of wetting reversal agent G502 was the highest.
(3)
Desorption hysteresis ratio
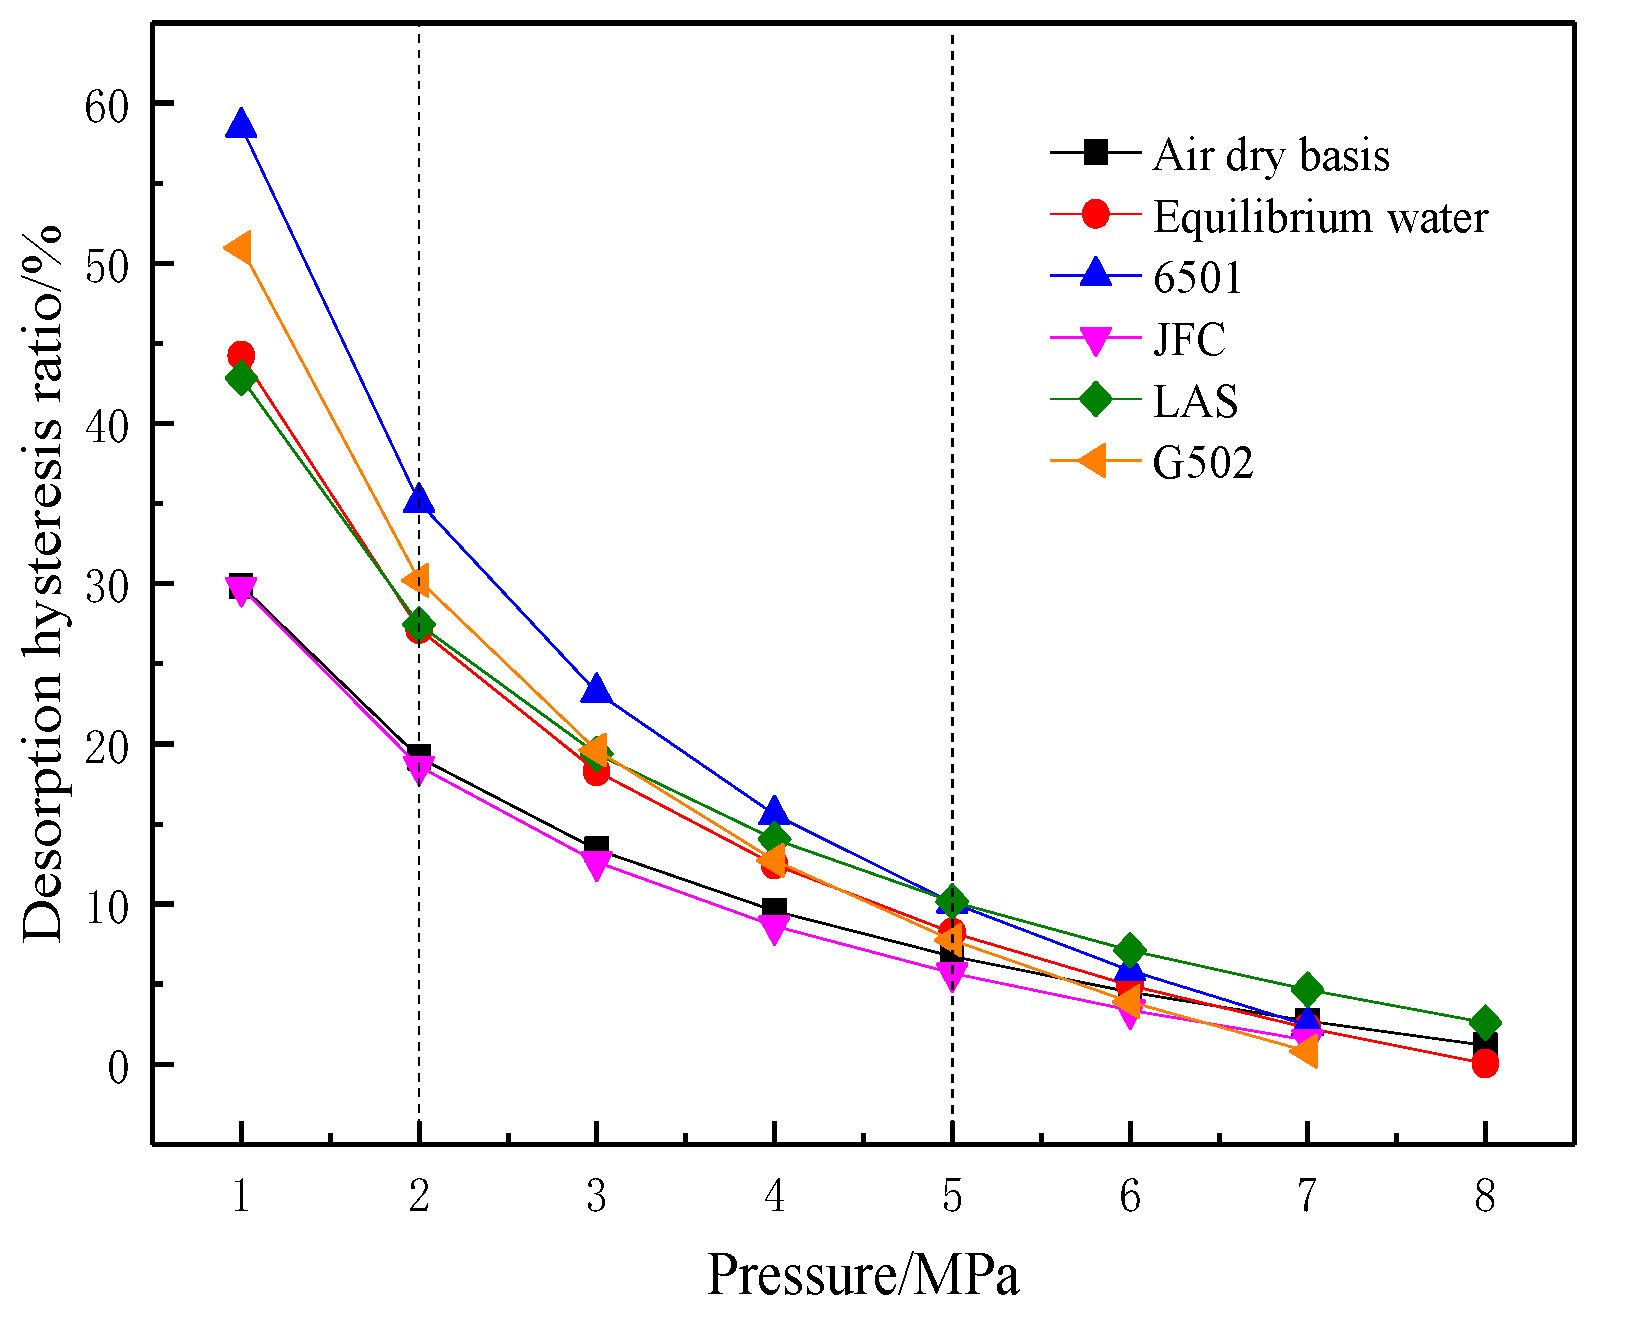
Desorption hysteresis ratio is an important index to measure the desorption hysteresis phenomenon. When coal adsorbs methane, the adsorption curve does not coincide with the desorption curve, and the desorption curve is generally above the adsorption curve. This phenomenon is called desorption hysteresis. The desorption hysteresis ratio (δ) can be obtained according to the aforementioned Equation (1) and Equation (11), namely, Equation (5):
δ = V d V a V a × 100 % .
where δ is desorption hysteresis ratio of methane during depressurization, %.
The desorption hysteresis ratio of the coal samples showed a logarithmic downward trend with the increase in pressure (Figure 17), the desorption curve changed from steep to slow, and the desorption hysteresis ratio changed from large to small. The desorption hysteresis ratio curves at different temperatures were consistent, and the desorption hysteresis degree decreased with the increase in temperature. In the low-pressure stage, methane was adsorbed in coal for a period of time, and then gradually desorbed out. The hysteresis degree of the relatively high-pressure stage was very large. Different coal samples had different hysteresis ratios. Under the same temperature and pressure, the desorption hysteresis ratios were 6501 > G502 > LAS > JFC.

4.5. Mechanism of CBM Desorption in Coal Covered with Water

As we know, drainage and depressurization can exploit coalbed methane in water-rich coal seams, and for water-deficient coal seams, it can also promote the normal production of CBM under sufficient differential pressures. The present production mechanisms of CBM mainly include depressurizing desorption [44,45], temperature-rising desorption [46], displacement desorption [47,48], diffusion desorption, and induced desorption [41,49,50,51,52], but the means of depressurizing desorption is still the most common method of CBM production. Therefore, in this study, the mechanism of coalbed methane desorption in coal covered with water is discussed in detail.

4.5.1. Vapor Displacement

In the coal reservoir, coalbed methane adsorption and desorption are accompanied by vapor desorption and adsorption, influencing each other [53,54]. During CBM exploitation, for the coal seam covered with water, the energy mainly comes from the water turbulence resulting from water pumps. The phenomenon of water turbulence in wellbore caused by drainage has been pointed out by some researchers [43,55,56,57]. Then, the migration pathways of particles through pore throats and cavitation provide conditions for water vaporization, whose adsorption on the pore surface offers energy for methane desorption (Figure 18).
At standard atmospheric pressure (101.325 KPa), the heat of water evaporation is 40.8 kJ/mol, which is far higher than the adsorption heat of either vitrain or durain, and far higher than the heat required by the desorption of CH4 from vitrain or durain. The saturated vapor pressure increases with temperature increasing and the evaporation heat decreases with temperature increasing (Figure 19). Thus, competitive adsorption takes place between water vapor (H2O (g)) and CH4 in coal, urging the desorption of CH4. Regarding the adsorption on the coal surface, the adsorption heat of H2O (g) and VDW force is far higher than that of CH4, which is also proved by [58].

4.5.2. CBM Desorption Models

  • CBM desorption in semi-open pores
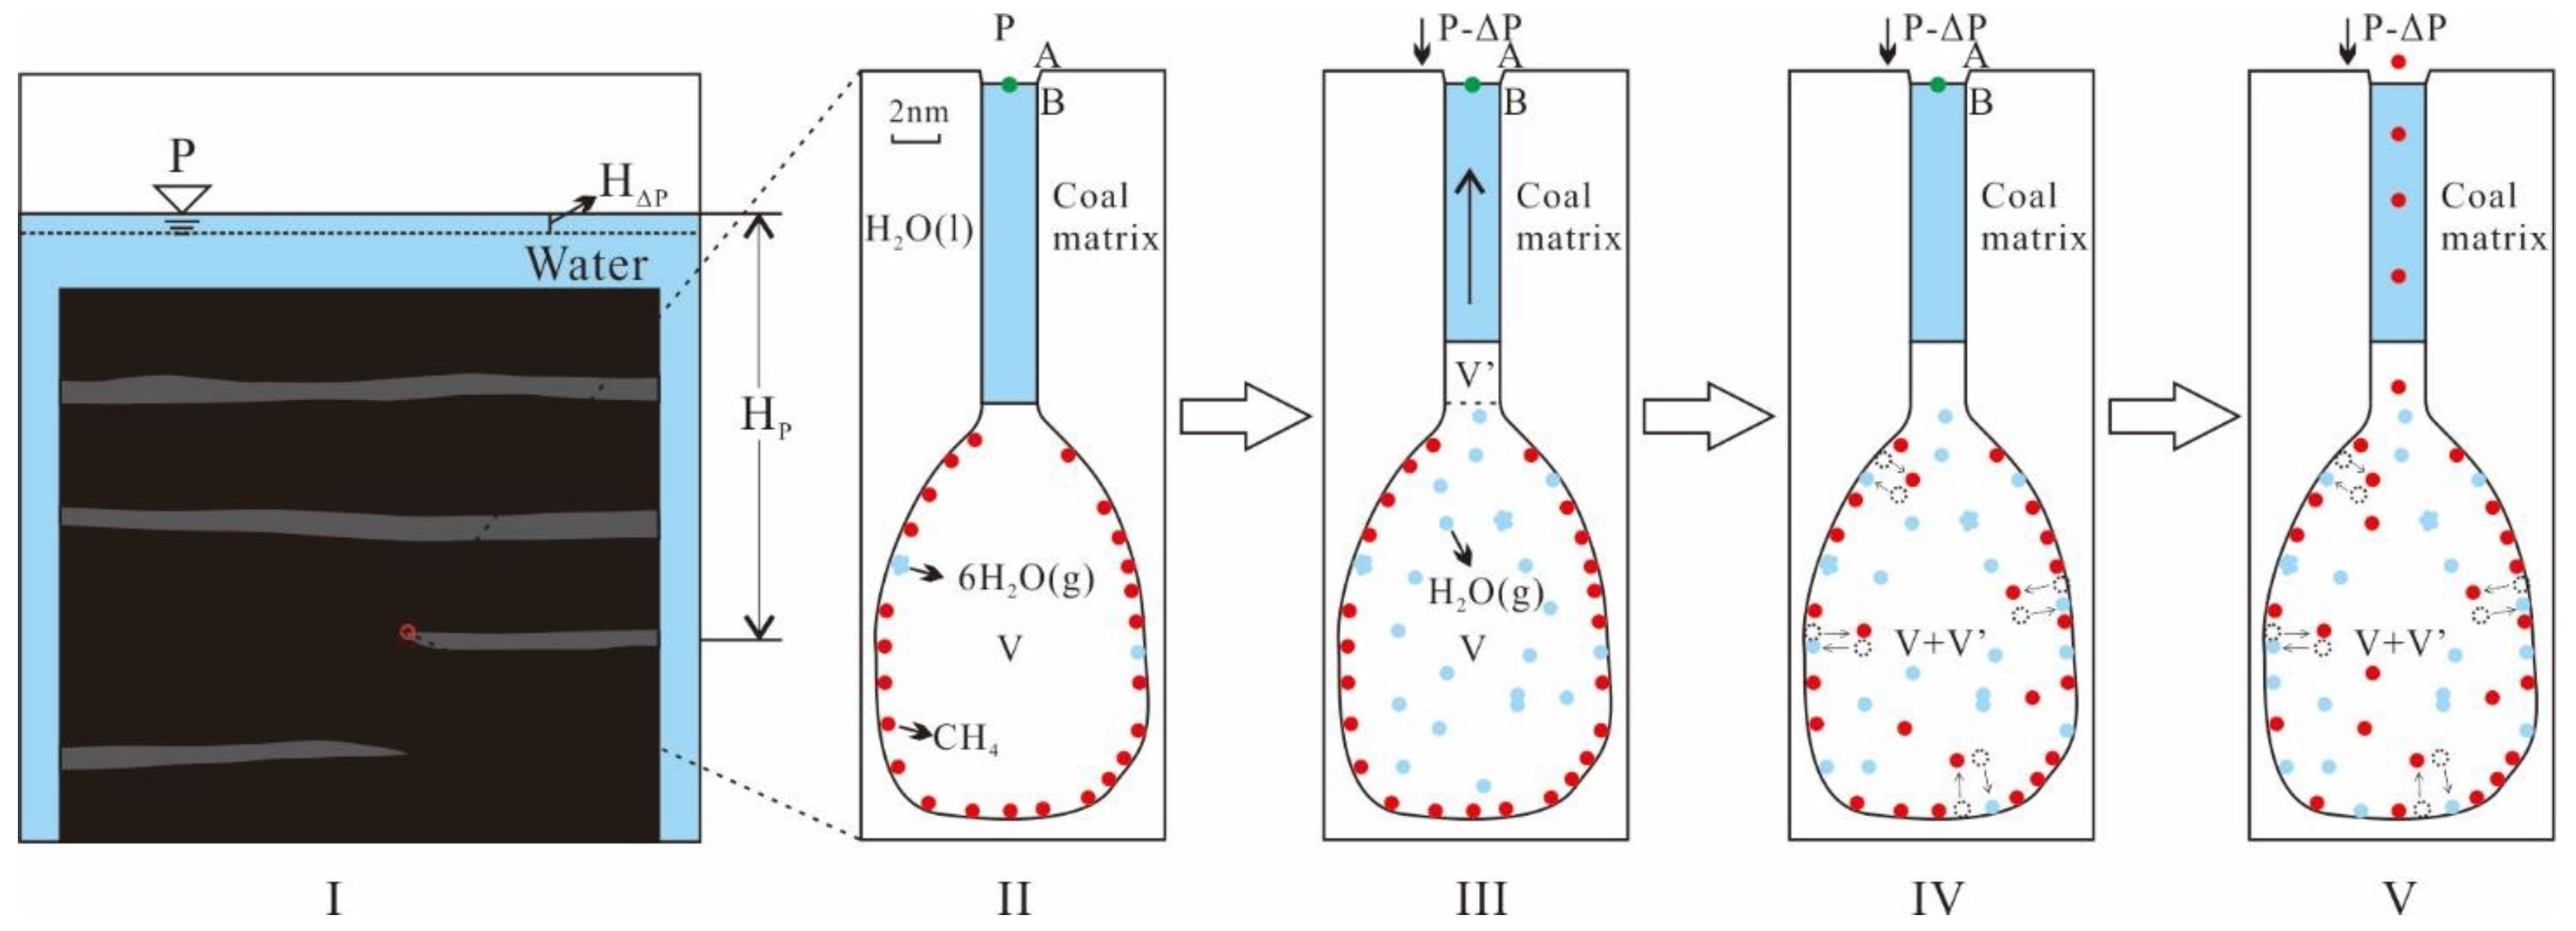
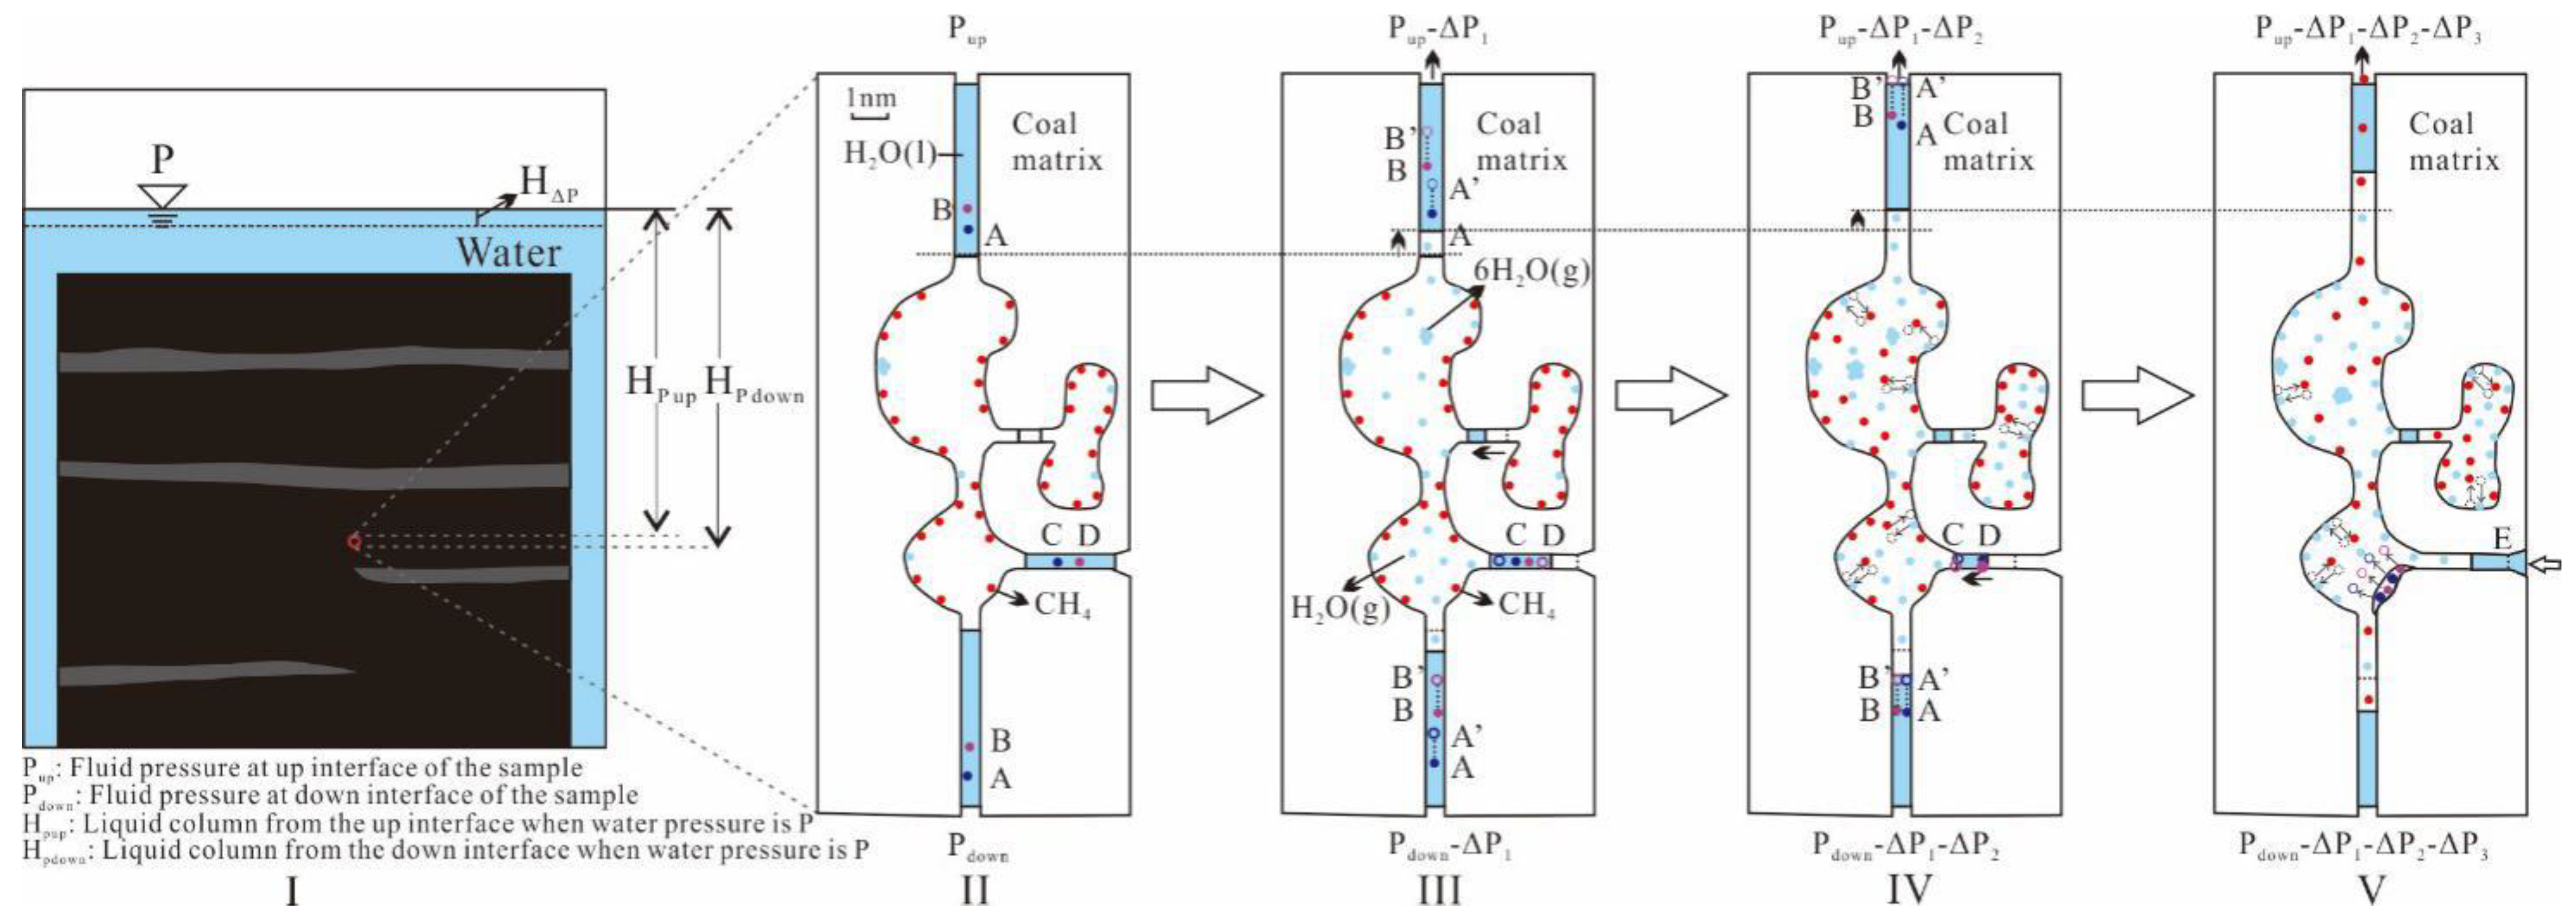
In the coal reservoir covered with water (Figure 20I), while air is pumped out, the fluid pressure in pores becomes P-ΔP (ΔP being the decrease in saturated vapor pressure above water surface, equivalent to HΔP—the fall of the water surface). The capillary water column in the pore throat rises (Ⅱ→Ⅲ), and the pore volume increases by V’, whereas the pressure decreases. The liquid water vaporizes at B, and H2O (g) effuses in the closed pores. The adsorption heat of H2O (g) on the pore surface is higher than 40.8 kJ/mol, while the adsorption heat of CH4 is no more than 31 kJ/mol. In other words, the heat released by H2O (g) adsorption on the pore surface is enough for CH4 to shift from an absorbed state to a free state, which can be seen as the displacement of H2O (g) for CH4. With sustained depressurization, the displacement continues. With the increase in free methane in the pores, the partial pressure of H2O (g) decreases and that of CH4 increases, urging CH4 to break through the water column at the pore throat. Thus, a two-phase flow of liquid and gas comes into being, moving toward the direction of depressurization, and CH4 is produced.
2.
CBM Desorption in Interconnected Pores
Durain is wetter than vitrain, and the pore throats are more interconnected. In a water covering environment, the static pressure P continues to decrease (Figure 21), ΔP1(ΔP1 + ΔP2)(ΔP1 + ΔP2 + ΔP3). The water column from the up interface of the durain stripe and that from the down interface are labeled as HP up and HP down, respectively. Close to the upright pore throat, the solute methane (II, B) forms cavities, moving upward and downward (to the direction of depressurization). It ultimately cavitates and breaks at the water surface, becoming free CH4, and enters the top of the vacuum vessel, and discharges under negative pressure. Meanwhile, a small amount of water particles (II, A) cavitate. H2O (g) strengthens the desorption of the methane absorbed on the pore surface.
Close to the horizontal pore throat (II, C, D), no matter whether methane cavitates or water vaporizes, whether pressure drops toward pores or vessels, there are no other than two types of phenomena. One is that pressure drops toward the pores, and the capillary force of the water columns in the pore throats is lower than the pressure drop, so that water spreads out on the pore surface (IV, C, D). The liquid–solid interface is more likely to cavitate at the pressure drop. The other one is that in the condition of water covering, capillary pore throats (V, E) are refilled with water under the dual function of capillary force and pressure drop. This kind of dynamic process circulates on the condition of depressurization. The dynamic equilibrium of adsorption and desorption is shown as the desorption of methane.

5. Conclusions

(1) Vitrain has more developed micropores than durain, and the specific surface area (SSA) and total pore volume (TPV) of vitrain are slightly larger than those of durain, with most of them being semi-closed and ink-bottle-shaped pores. However, the average pore size and pore connectivity of durain are better than those of vitrain.
(2) Coal–water contact angles are all less than 90°, showing hydrophilicity. The contact angle of durain (61.2°) is smaller than that of vitrain (66.9°). The wettability of the coal samples treated with different surfactants from poor to good is, in order, G502 (hydrophobic), 6501, LAS, and JFC. G502 causes the wettability of coal to reverse, and the contact angle increases to 98.8°. The other three surfactants can improve the wettability of coal, and the contact angle decreases to 32.5°.
(3) The wettability of coal is negatively correlated with methane adsorption capacity. The better the wettability is, the weaker the methane adsorption capacity is. The order for the adsorption capacity of different wettability coal samples from strong to weak is G502 sample, air dry sample, balanced water sample, 6501, JFC, and LAS. The desorption capacity was positively correlated with the wettability. The better the wettability, the higher the desorption ratio and the lower the desorption hysteresis ratio. The desorption capacity was, in descending order, G502, 6501, JFC, and LAS.
(4) The effect of coal wettability on methane adsorption and desorption is in essence a comprehensive reflection of coal–water and coal–methane molecular interactions. The better the wettability of coal, the stronger the molecular interaction of the coal–water interface, and the surface of the coal matrix is easily occupied by a large number of water molecules. The competitive adsorption of water and methane molecules weakens the methane adsorption capacity of coal, but it also promotes methane desorption.

Author Contributions

Conceptualization, Y.J. and P.H.; data curation, Y.C.; investigation, T.P.; methodology, D.M.; project administration, L.W. and D.M.; supervision, W.L.; validation, C.Z. and Z.M.; visualization, G.L. and X.W.; writing—review & editing, T.P. and Y.C. All authors have read and agreed to the published version of the manuscript.

Funding

This work was supported by the National Natural Science Foundation of China (Grant No. 41902175, Grant No. 41972183), the Shanxi Province Science and Technology Major Special Funding Project (Grant No. 20201101002), the Shaanxi Province Natural Science Basic Research Program Funding Project (Grant No. 2019JQ-245), the Open Project Funding Project of the Key Laboratory of Coal Resources Exploration and Comprehensive Utilization of the Ministry of Natural Resources (Grant No. KF2019-2), and the Projects Funded by the China Postdoctoral Science Foundation (Grant No. 2019M653873XB). The authors also thank the editor and anonymous reviewers very much for the valuable comments and suggestions that have greatly improved the manuscript.

Data Availability Statement

All data, models, and code generated or used during the study appear in the paper.

Conflicts of Interest

The authors declare no potential conflict of interest with respect to the research, authorship, and publication of this paper.

References

  1. Wang, Z.; Pan, J.; Hou, Q.; Yu, B.; Li, M.; Niu, Q. Anisotropic characteristics of low-rank coal fractures in the Fukang mining area, China. Fuel 2018, 211, 182–193. [Google Scholar] [CrossRef]
  2. Fu, H.; Tang, D.; Xu, T.; Xu, H.; Tao, S.; Li, S.; Yin, Z.; Chen, B.; Zhang, C.; Wang, L. Characteristics of pore structure and fractal dimension of low-rank coal: A case study of Lower Jurassic Xishanyao coal in the southern Junggar Basin, NW China. Fuel 2017, 193, 254–264. [Google Scholar] [CrossRef]
  3. Qin, Y.; Moore, T.A.; Shen, J.; Yang, Z.; Shen, Y.; Wang, G. Resources and geology of coalbed methane in China: A review. Int. Geol. Rev. 2017, 60, 777–812. [Google Scholar] [CrossRef]
  4. Fu, H.; Tang, D.; Xu, H.; Xu, T.; Chen, B.; Hu, P.; Yin, Z.; Wu, P.; He, G. Geological characteristics and CBM exploration potential evaluation: A case study in the middle of the southern Junggar Basin, NW China. J. Nat. Gas Sci. Eng. 2016, 30, 557–570. [Google Scholar] [CrossRef]
  5. Zhou, S.; Liu, D.; Cai, Y.; Yao, Y. Fractal characterization of pore–fracture in low-rank coals using a low-field NMR relaxation method. Fuel 2016, 181, 218–226. [Google Scholar] [CrossRef]
  6. Ou, C.H.; Li, C.C.; He, J.; Hou, S.Y. Low-Rank Coalbed Methane Enrichment Characteristics in the Eastern Zone of Junggar Basin. Adv. Mater. Res. 2015, 1092, 1416–1419. [Google Scholar] [CrossRef]
  7. Wei, Y.; Li, C.; Cao, D.; Zhang, A.; Wang, A.; Xiang, X. New Progress on the Coal Fines Affecting the Development of Coalbed Methane. Acta Geol. Sinca 2018, 92, 2060–2062. [Google Scholar] [CrossRef]
  8. Flores, R.M. Coal and Coalbed Gas: Fueling the Future. Int. J. Coal Geol. 2014, 127, 1–2. [Google Scholar] [CrossRef]
  9. Ma, D.; Zhang, J.; Bai, J.; Zhang, H. Thermodynamic Characteristics of Adsorption-Desorption of Methane in 3# Coal Seam of Sihe. Nat. Resour. 2014, 05, 782–794. [Google Scholar] [CrossRef] [Green Version]
  10. Moore, T.A. Coalbed methane: A review. Int. J. Coal Geol. 2012, 101, 36–81. [Google Scholar] [CrossRef]
  11. Zhang, S.; Sang, S. Physical chemistry mechanism of influence of liquid water on coalbed methane adsorption. Procedia Earth Planet. Sci. 2009, 1, 263–268. [Google Scholar] [CrossRef]
  12. Sang, S.; Zhu, Y.; Zhang, J.; Zhang, X.; Zhang, S. Influence of liquid water on coalbed methane adsorption An experimental research on coal reservoirs in the south of Qinshui Basin. Chin. Sci. Bull. 2005, 50, 79–85. [Google Scholar] [CrossRef]
  13. Bustin, R.M.; Clarkson, C.R. Geological controls on coalbed methane reservoir capacity and gas content. Coal Geol. 1998, 38, 3–26. [Google Scholar] [CrossRef]
  14. Chen, R.; Zhang, P.; Qin, Y.; Wei, C.; Wang, L. New discovery on methane adsorption change of coal due to Sc-CO2 extraction during CO2-ECBM. Acta Geol. Sinca 2018, 92, 2438–2439. [Google Scholar]
  15. Zhang, Z.; Qin, Y.; Zhuang, X.; Li, G.; Liu, D. Geological Controls on the CBM Productivity of No.15 Coal Seam of Carboniferous–Permian Taiyuan Formation in Southern Qinshui Basin and Prediction for CBM High-yield Potential Regions. Acta Geol. Sinca 2018, 92, 2310–2332. [Google Scholar] [CrossRef]
  16. Wang, K.; Wang, G.; Ren, T.; Cheng, Y. Methane and CO2 sorption hysteresis on coal: A critical review. Int. J. Coal Geol. 2014, 132, 60–80. [Google Scholar] [CrossRef]
  17. Ding, G.; Rice, J.A. Effect of lipids on sorption/desorption hysteresis in natural organic matter. Chemosphere 2011, 84, 519–526. [Google Scholar] [CrossRef]
  18. Ran, Y.; Xing, B.; Rao, P.S.; Fu, J. Importance of Adsorption (Hole-Filling) Mechanism for Hydrophobic Organic Contaminants on an Aquifer Kerogen Isolate. Environ. Sci. Technol. 2004, 38, 4340–4348. [Google Scholar] [CrossRef]
  19. Braida, W.J.; Pignatello, J.J.; Lu, Y.; Ravikovitch, P.I.; Neimark, A.V.; Xing, B. Sorption Hysteresis of Benzene in Charcoal Particles. Environ. Sci. Technol. 2003, 37, 409–417. [Google Scholar] [CrossRef]
  20. Wu, W.; Sun, H. Sorption-desorption hysteresis of phenanthrene-effect of nanopores, solute concentration, and salinity. Chemosphere 2010, 81, 961–967. [Google Scholar] [CrossRef]
  21. Zhu, H.; Selim, H.M. Hysteretic Behavior of Metolachlor Adsorption-Desorption in Soils. Soil Sci. 2000, 165, 632–645. [Google Scholar] [CrossRef]
  22. Wang, K.; Fu, X.; Qin, Y.; Sesay, S.K. Adsorption characteristics of lignite in China. J. Earth Sci. 2011, 22, 371–376. [Google Scholar] [CrossRef]
  23. Feng, Y.; Yang, W.; Liu, D.; Chu, W. Surface Modification of Bituminous Coal and Its Effects on Methane Adsorption. Chin. J. Chem. 2013, 31, 1102–1108. [Google Scholar] [CrossRef]
  24. Feng, Y.; Yang, W.; Chu, W. Coalbed methane adsorption and desorption characteristics related to coal particle size. Chin. Phys. B 2016, 25, 068102. [Google Scholar] [CrossRef]
  25. Cai, Y.; Liu, D.; Yao, Y.; Li, J.; Liu, J. Fractal Characteristics of Coal Pores Based on Classic Geometry and Thermodynamics Models. Acta Geol. Sinca 2011, 85, 1150–1162. [Google Scholar] [CrossRef]
  26. Lin, J.; Ren, T.; Wang, G.; Booth, P.; Nemcik, J. Experimental study of the adsorption-induced coal matrix swelling and its impact on ECBM. J. Earth Sci. 2017, 28, 917–925. [Google Scholar] [CrossRef]
  27. Shan, C.; Zhang, T.; Liang, X.; Shu, D.; Zhang, Z.; Wei, X.; Zhang, K.; Feng, X.; Zhu, H.; Wang, S.; et al. Effects of nano-pore system characteristics on CH4 adsorption capacity in anthracite. Front. Earth Sci. 2018, 13, 75–91. [Google Scholar] [CrossRef]
  28. Feng, Y.; Jiang, C.; Liu, D.; Chu, W. Microstructure and its influence on CH4 adsorption behavior of deep coal. Chin. Phys. B 2014, 23, 028201. [Google Scholar] [CrossRef]
  29. Han, X.; Zhang, B.; Ye, J. Analysis and Application of CO2 Phase Change During CO2-ECBM Injection in CBM-Taking the study of Shizhuang North Block in Qinshui Basin as An Example. Unconventonaloil Gas 2018, 5, 80–85. [Google Scholar]
  30. Yao, Y.; Liu, D.; Tang, D.; Huang, W.; Tang, S.; Che, Y. A Comprehensive Model for Evaluating Coalbed Methane Reservoirs in China. Acta Geol. Sin.-Engl. Ed. 2008, 82, 1253–1270. [Google Scholar] [CrossRef]
  31. Chen, P.; Tang, X. The research on the adsorption of nitrogen in low temperature and micro-pore properties in coal. J. China Coal Soc. 2001, 26, 2438–2439. [Google Scholar]
  32. Harpalani, S.; Pariti, U.M. Study of coal sorption isotherms using amulticomponents gas mixture. Int. Coalbed Methane Symp. 1993, 31, 151–160. [Google Scholar] [CrossRef]
  33. Greaves, K.H.; Owen, L.B.; McLennan, J.D.; Olszcwski, A. Multicomponent gas adsorption-desorption behavior of coal. Int. Coalbed Methane Symp. 1993, 1, 197–205. [Google Scholar]
  34. Busch, A.; Gensterblum, Y.; Krooss, B.M. Methane and CO2 sorption and desorption measurements on dry Argonne premium coals: Pure components and mixtures. Int. J. Coal Geol. 2003, 55, 205–224. [Google Scholar] [CrossRef]
  35. Ma, D.; Zhang, S.; Lin, Y. Isothermal adsorption and desorption experiment of coal and experimental results accuracy fitting. J. China Coal Soc. 2011, 36, 477–480. [Google Scholar] [CrossRef]
  36. Ma, D.; Zhang, S.; Wang, P.; Lin, Y.; Wang, C. Mechanism of coalbed methane desorption at different temperatures. Coal Geol Explor. 2011, 39, 20–23. [Google Scholar] [CrossRef]
  37. Ma, D.; Cao, S.; Li, P.; Zhang, H.; Wu, J.; Hao, C.; Wang, L. Comparison on adsorption and desorption thermodynamics features between shale gas and coalbed methane. Coal Sci. Technol. 2015, 43, 64–67. [Google Scholar] [CrossRef]
  38. Wang, X.; Wang, Y.; Zhang, L.; Wang, Y. Reasearch on CO2, CH4 Competitive Adsorption, Desorption and Replacement Effect of High and Low Rank Coal. Unconventonaloil Gas 2018, 5, 46–51. [Google Scholar]
  39. Gao, Z.; Ma, D.; Chen, Y. Hysteresis of methane desorption from coal seams in the Huanglong coalfield and quantitative evaluation of desorption hysteresis. J. Henan Univ. Sci. Technol. 2021, 40, 16–22+79. [Google Scholar] [CrossRef]
  40. Zhang, D.; Xian, X.; Tan, X. The Experimental Study of the Relation Between the Macromolecular Stucture of Coal and Its Bank. J. Chong Qing Univ. 1990, 13, 78–83. [Google Scholar]
  41. Nie, B.; He, X.; Wang, E. Surface free energy of coal and its calculation. J. Taiyuan Univ. Technol. 2000, 4, 346–348. [Google Scholar] [CrossRef]
  42. Nie, B.; He, X.; Wang, E.; Zhang, L. Micro-mechanism of coal adsorbing water. J. China Univ. Min. Technol. 2004, 33, 379–383. [Google Scholar]
  43. Li, Z. Experimental Study on Migration Characteristics of Pulverized Coal in Horizontal Wellbore of Coalbed Methane. Ph.D. Thesis, Xi’an University of Science and Technology, Xi’an, China, 2017. [Google Scholar]
  44. Su, X.; Chen, R.; Lin, X.; Song, Y. Application of adsorption potential theory in the fractionation of coalbed gas during the process of adsorption/desorption. Acta Geol. Sinica 2008, 82, 1382–1389. [Google Scholar]
  45. Duan, L.; Tang, S.; Liu, H.; Zhen, G. Implication of canister desorption of coal for coalbed methane production. Beijing Geol. Publ. House 2008, 182–187. [Google Scholar]
  46. Pang, X.; Jing, X.; Wang, W.; Li, B.; Cheng, L.; Wang, Y. Coalbed gas content experiment research based on desorption by raising temperature. Coal Mine Saf. 2010, 41, 1–3. [Google Scholar] [CrossRef]
  47. Zhou, L.; Feng, Q.; Qin, Y. Thermodynamic analysis of competitive adsorption of CO2 and CH4 on coal matrix. J. China Coal Soc. 2011, 36, 1307–1311. [Google Scholar] [CrossRef]
  48. Zhang, Z.; Liu, G.; Zhang, X.; Yang, X. Adsorption-disorption experiments of CH4 and CO2 with different consistency. J. China Coal Soc. 2009, 34, 551–555. [Google Scholar] [CrossRef]
  49. Yi, J.; Jiang, Y.; Xian, X. An experimental research on the characters of methane seepage in stress field and temperature field. China Min. Mag. 2007, 16, 113–116. [Google Scholar]
  50. Yi, J.; Jiang, Y.; Xian, X.; Luo, Y.; Zhang, Y. A liquid-solid dynamic coupling model of ultrasound enhanced coalbed gas desorption and flow. Rock Soil Mech. 2009, 30, 2945–2950. [Google Scholar] [CrossRef]
  51. Jiang, W.; Zhang, Q.; Cui, Y. Quantum chemistry characteristics of coal adsorbing gas and their applications. Nat. Gas Geosci. 2014, 25, 444–452. [Google Scholar] [CrossRef]
  52. Nie, B.; He, X.; Wang, E.; Zhang, L. Research on the mechanisms of the influence of electromagnetic field on coalbed methane adsorption. Nat. Gas Ind. 2004, 24, 32–34. [Google Scholar] [CrossRef]
  53. Chen, R.; Wang, Y.; Qin, Y.; Wang, L.; Wei, C.; Zhang, P. New Discovery on Supercritical CO2-H2O Treated Coal Pore Structure and Methane Adsorption. Acta Geol. Sinca 2017, 91, 1509–1510. [Google Scholar] [CrossRef]
  54. Xiang, J.; Zeng, F.; Liang, H.; Li, B.; Song, X. Molecular simulation of the CH4/CO2/H2O adsorption onto the molecular structure of coal. Sci. China Earth Sci. 2014, 57, 1749–1759. [Google Scholar] [CrossRef]
  55. Blake, J.R.; Gibson, D.C. Growth and collapse of a vapor cavity near a free surface. J. Fluid Mech. 1981, 111, 123–140. [Google Scholar] [CrossRef]
  56. Cui, J.; Li, P.; Ma, D.; Li, Z.; Zhang, K.; Meng, F. Experiment study on migration law of pulverized coal in borehole of coalbed methane horizontal well. Coal Sci. Technol. 2016, 44, 74–78. [Google Scholar] [CrossRef]
  57. Xu, M. Visual Experiment Research of the Bubble near the Wall; Zhejiang University: Zhejiang, China, 2013. [Google Scholar]
  58. Xu, L.; Xian, X.; Yang, M. Basic research on CMM concentration and purification. China Coalbed Methane 2005, 2, 11–15. [Google Scholar]
Figure 1. The location and geological structure of the Dafosi field.
Energies 15 05094 g001
Figure 2. OCA20 video contact angle measurement.
Energies 15 05094 g002
Figure 3. Capillary pressure curves of coal samples: (a) vitrain; (b) durain.
Energies 15 05094 g003
Figure 4. Methane adsorption/desorption curves: (a) vitrain; (b) durain.
Energies 15 05094 g004
Figure 5. lnf-n relationship of methane adsorption in the isothermal adsorption experimental: (a) vitrain; (b) durain.
Energies 15 05094 g005
Figure 6. lnf-T−1 of adsorption process in the isothermal adsorption experimental: (a) vitrain; (b) durain.
Energies 15 05094 g006
Figure 7. The relation between heat of adsorption and capacity of adsorption.
Energies 15 05094 g007
Figure 8. lnf-n relationship of methane adsorption in the desorption experimental: (a) vitrain; (b) durain.
Energies 15 05094 g008
Figure 9. lnf-T−1 of adsorption process in the desorption experimental: (a) vitrain; (b) durain.
Energies 15 05094 g009
Figure 10. The relationship between heat of adsorption and adsorption capacity in the desorption process.
Energies 15 05094 g010
Figure 11. Comparison of adsorption heat during the adsorption and desorption process: (a) vitrain; (b) durain.
Energies 15 05094 g011
Figure 12. Comparison of adsorption heat difference between vitrain and durain during adsorption and desorption.
Energies 15 05094 g012
Figure 13. Methane adsorption/desorption fitting curves of samples with different wettabilities: (a) adsorption; (b) desorption.
Energies 15 05094 g013
Figure 14. Methane displacement effect with different wettability: (a) displacement capacity; (b) displacement ratio.
Energies 15 05094 g014
Figure 15. Variation in desorption capacity of samples with different surfactants.
Energies 15 05094 g015
Figure 16. Changes in desorption efficiency of samples with different surfactants.
Energies 15 05094 g016
Figure 17. Variation in desorption hysteresis ratio of samples with different surfactants.
Energies 15 05094 g017
Figure 18. Effusion of CH4 during forced water adsorption of lump coal and its interpretation.
Energies 15 05094 g018
Figure 19. Variation in saturated vapor pressure and evaporation heat with temperature: (a) Saturated vapor pressure; (b) Vaporization heat.
Energies 15 05094 g019
Figure 20. Desorption mechanism of CH4 in vitrain (semi-open pores) covered with water. Ⅰ: The coal reservoir covered with water; Ⅱ: Initial state; Ⅲ: Air is pumped out, the capillary water column in the pore throat rises; Ⅳ: The pore volume increases by V’; V: CH4 to break through the water column at the pore throat.
Energies 15 05094 g020
Figure 21. Desorption mechanism of CH4 in durain (interconnected pores) covered with water. I: The coal reservoir covered with water; II: Initial state; III: a Free CH4 enters the top of the vacuum vessel, and discharges under negative pressure; IV: Water spreads out on the pore surface; V: Capillary pore throats are refilled with water.
Energies 15 05094 g021
Table 1. Category of surfactants selected in the test of contact angle.
Full NamePrincipal ComponentCode
Twelve fluoroalkyl trimethoxy silaneC14F12H2OSiO3G502
Cocoanut fatty acid diethanolamideC16H33O3N6501
Fatty alcohol-polyoxyethylene etherCmH2m+1(EO)nHJFC
Sodium dodecyl benzene sulfonateC18H29NaO3SLAS
Distilled waterH2ODW
Production waterH2O and MineralsPW
Table 2. Results of proximate and ultimate analysis of vitrain and durain.
SamplesMad/%Aad/%Vdaf/%FCad%C/%H/%N/%O/%C/HC/O
Vitrain3.901.9637.4858.8683.604.800.8610.7317.427.79
Durain2.949.7531.4659.8382.44.680.8912.0317.616.85
Table 3. Pore characteristics of vitrain and durain samples.
Coal SamplePore Volume/cm3·g−1Pore Throat Radius/μmPore Sorting Pore Connectivity
R ¯ SpSkpPd/MPaSHG/%WE/%
Vitrain0.041543.184.981.420.0360.263.88
Durain0.030384.833.39−1.370.0298.5336.56
Note: R is the average pore throat radius; Sp is the sorting coefficient; Skp is skewness; Pd is the displacement pressure; SHG is mercury saturation; WE is mercury extrusion efficiency.
Table 4. Results of liquid nitrogen adsorption experiments on vitrain and durain samples.
Coal SampleSSA/m2·g−1TPV/cm3·g−1APZ/nmMTV/cm3·g−1MPPZ/nm
Vitrain22.9220.02574.48410.00741.09676
Durain15.6680.01944.93940.00521.02288
Note: SSA is the specific surface area; TPV is the total pore volume; APZ is the average pore size; MTV is the micropore total volume; MPPZ is the most probable pore size.
Table 5. Measurement results of the contact angle of the coal–water interface.
Coal SampleCoal–Water Interface Contact Angle/(°)
Distilled WaterJFCG502LASStratum Water6501
Vitrain66.9°33.8°98.8°39.9°93.2°49.9°
Durain61.2°32.5°90.3°36.7°91.3°42.1°
Table 6. Fitting results of the methane adsorption/desorption of vitrain and durain.
Coal
Sample
T/°CAdsorption ProcessDesorption Process
VL/
cm3·g−1
PL/
MPa
R2VL/
cm3·g−1
PL/
MPa
c/
cm3·g−1
R2
Vitrain2016.042.370.998813.492.752.610.9944
2514.942.460.998913.032.341.400.9996
3013.922.600.999912.512.440.970.9993
3512.982.730.998811.522.741.140.9996
4011.872.510.999510.092.911.690.9990
Durain2012.182.330.99998.681.992.420.9973
2511.502.500.99998.582.652.300.9993
3011.002.630.99998.202.361.970.9977
3510.502.700.99997.783.232.310.9988
409.762.551.00007.133.942.670.9980
Table 7. lnf-n fitting results of the methane adsorption process at different temperatures.
Coal SampleTemperature/°CABR2
Vitrain205.62895.70640.9977
256.12185.70960.9974
306.54865.77650.9995
357.04205.82260.9959
407.74465.72960.9877
Durain207.37585.69740.9995
257.99735.70630.9995
308.32845.77020.9997
358.75435.79790.9994
409.40745.74410.9996
Table 8. Isosteric adsorption heat during methane adsorption.
Adsorbing Capacity/mmol·g−10.10.20.30.40.5
Adsorption heat/kJ·mol−1Vitrain14.8825.8036.7247.6558.57
Durain25.7929.4033.0136.6240.23
Table 9. lnf-n fitting results of the methane desorption process at different temperatures.
Coal SampleTemperature/°CABR2
Vitrain206.48475.15730.9944
256.97065.24960.9995
307.23285.42740.9988
357.92715.42370.9999
408.87385.26080.9996
Durain2010.5364.37490.9965
2510.8454.61560.9980
3011.1304.70300.9961
3511.8094.74960.9964
4012.9404.60520.9936
Table 10. Isosteric adsorption heat during methane desorption.
Adsorbing Capacity/mmol·g−10.10.20.30.40.5
Adsorption heat/kJ·mol−1Vitrain19.2735.5751.8768.1684.46
Durain46.7348.0249.3050.5951.87
Table 11. Calculation results of the isosteric heat of vitrain and durain samples.
qst/kJ·mol−1Adsorption
Process
Desorption
Process
Desorption Heat Supplement
Adsorption/mmol·g−1 VitrainDurainVitrainDurainVitrainDurain
0.1−14.877−25.79319.27046.7344.39320.941
0.2−25.800−29.40235.56848.0189.76818.616
0.3−36.723−33.01151.86649.30215.14316.291
0.4−47.645−36.62068.16450.58520.51913.965
0.5−58.568−40.22984.46251.86925.89411.648
“−” means heat release.
Table 12. Fitting of adsorption characteristic parameters of different wettability coal samples.
Coal SampleAdsorption ProcessDesorption Process
VL/cm3·g−1PL/MPa R2VL/cm3·g−1PL/MPac/cm3·g−1 R2
Air dry basis16.5116.5360.99913.8355.3761.0140.992
Equilibrium water15.4623.3440.99613.8322.1010.1380.997
G50226.9844.4440.99422.7456.9445.5690.997
650112.4592.8410.9998.9052.6042.7900.984
JFC11.5162.5770.9929.4313.5462.4230.994
LAS5.6262.0200.9854.2731.7641.2040.983
Publisher’s Note: MDPI stays neutral with regard to jurisdictional claims in published maps and institutional affiliations.