
Optimization of Process Variables in the Drilling of LM6/B4C Composites through Grey Relational Analysis


Abstract
:1. Introduction
2. Materials and Methods
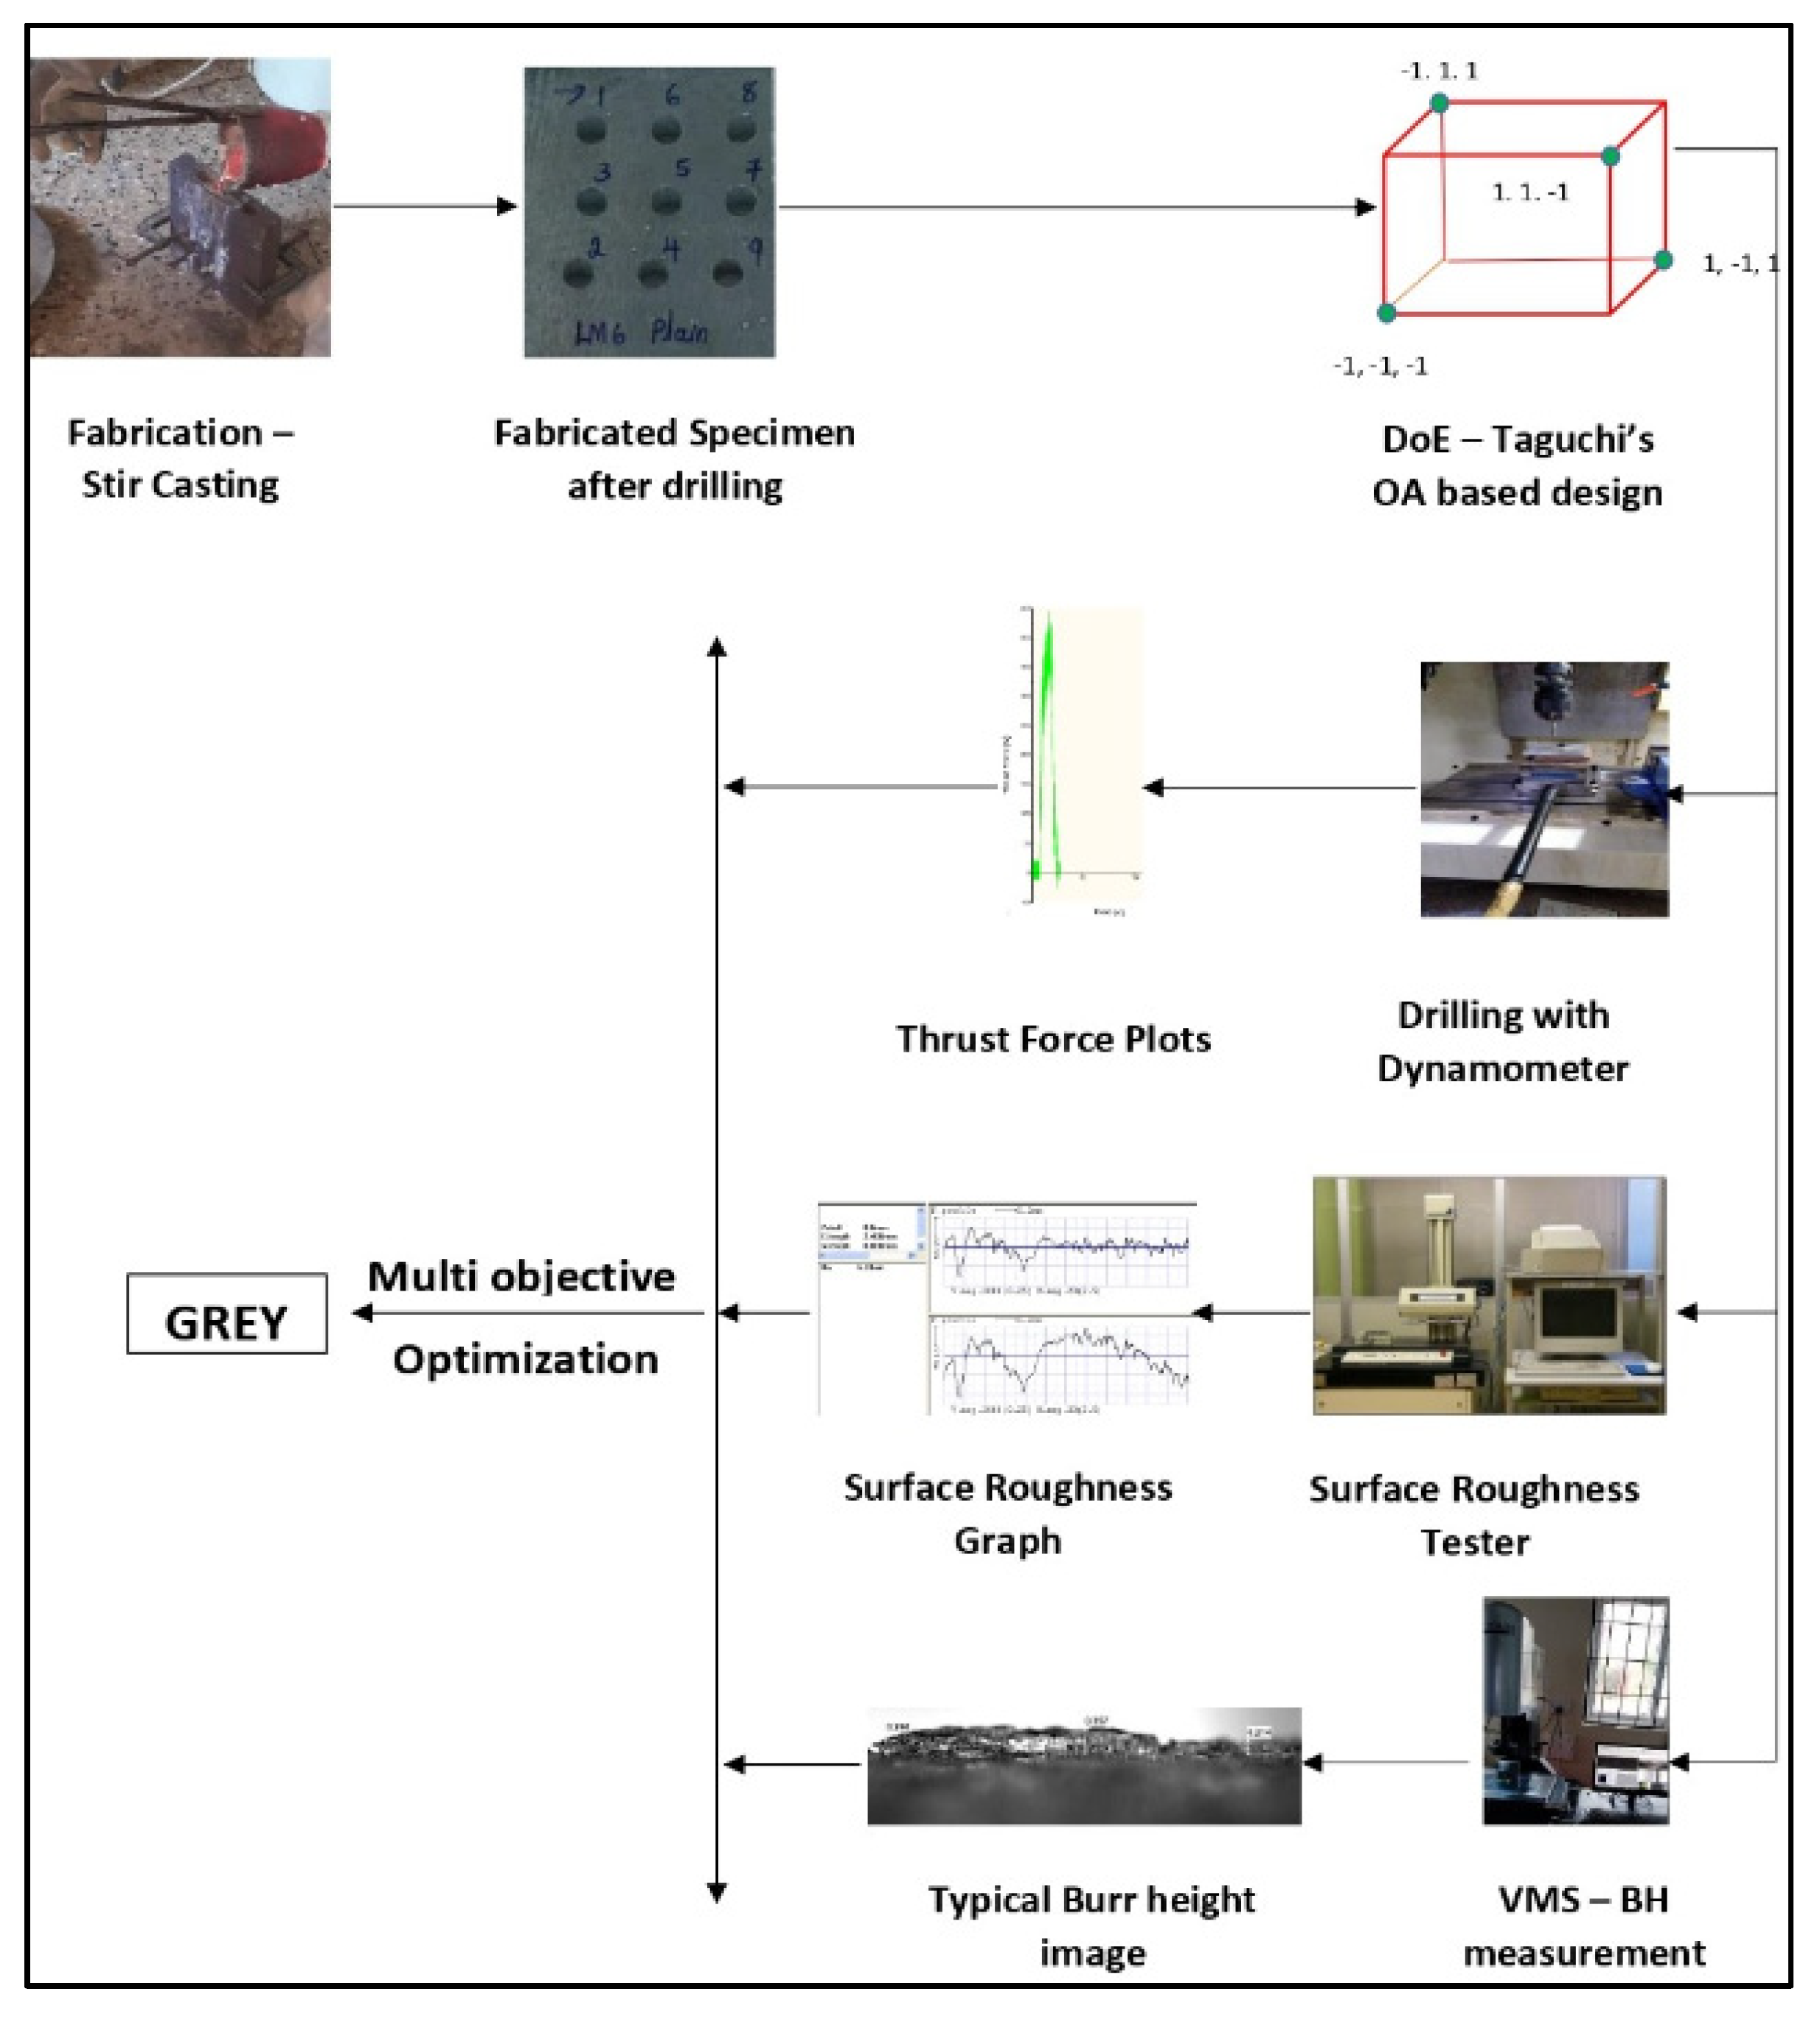
2.1. Fabrication of the LM6 Alloy/Boron Carbide () Composites
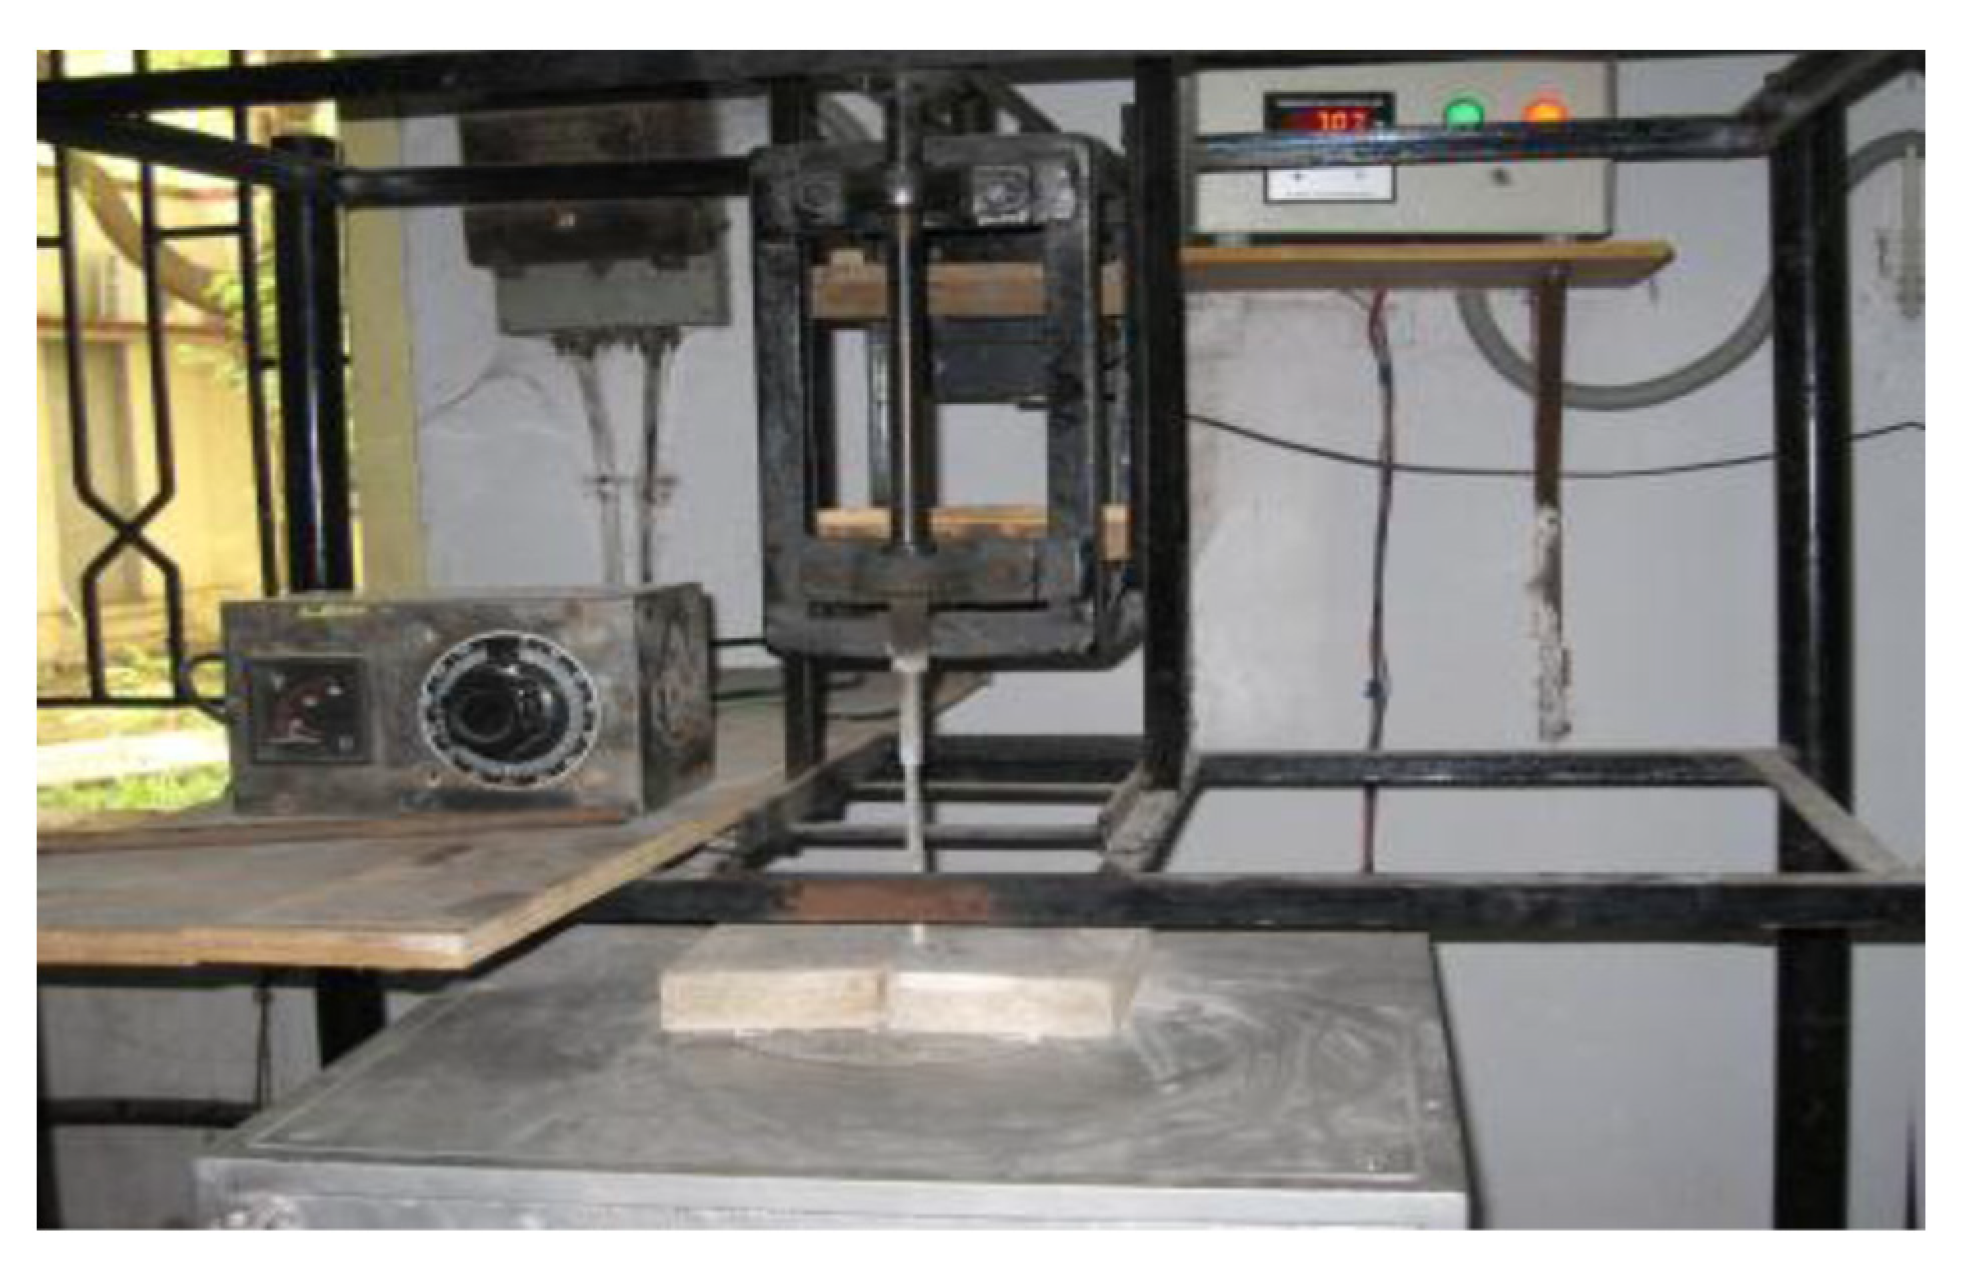
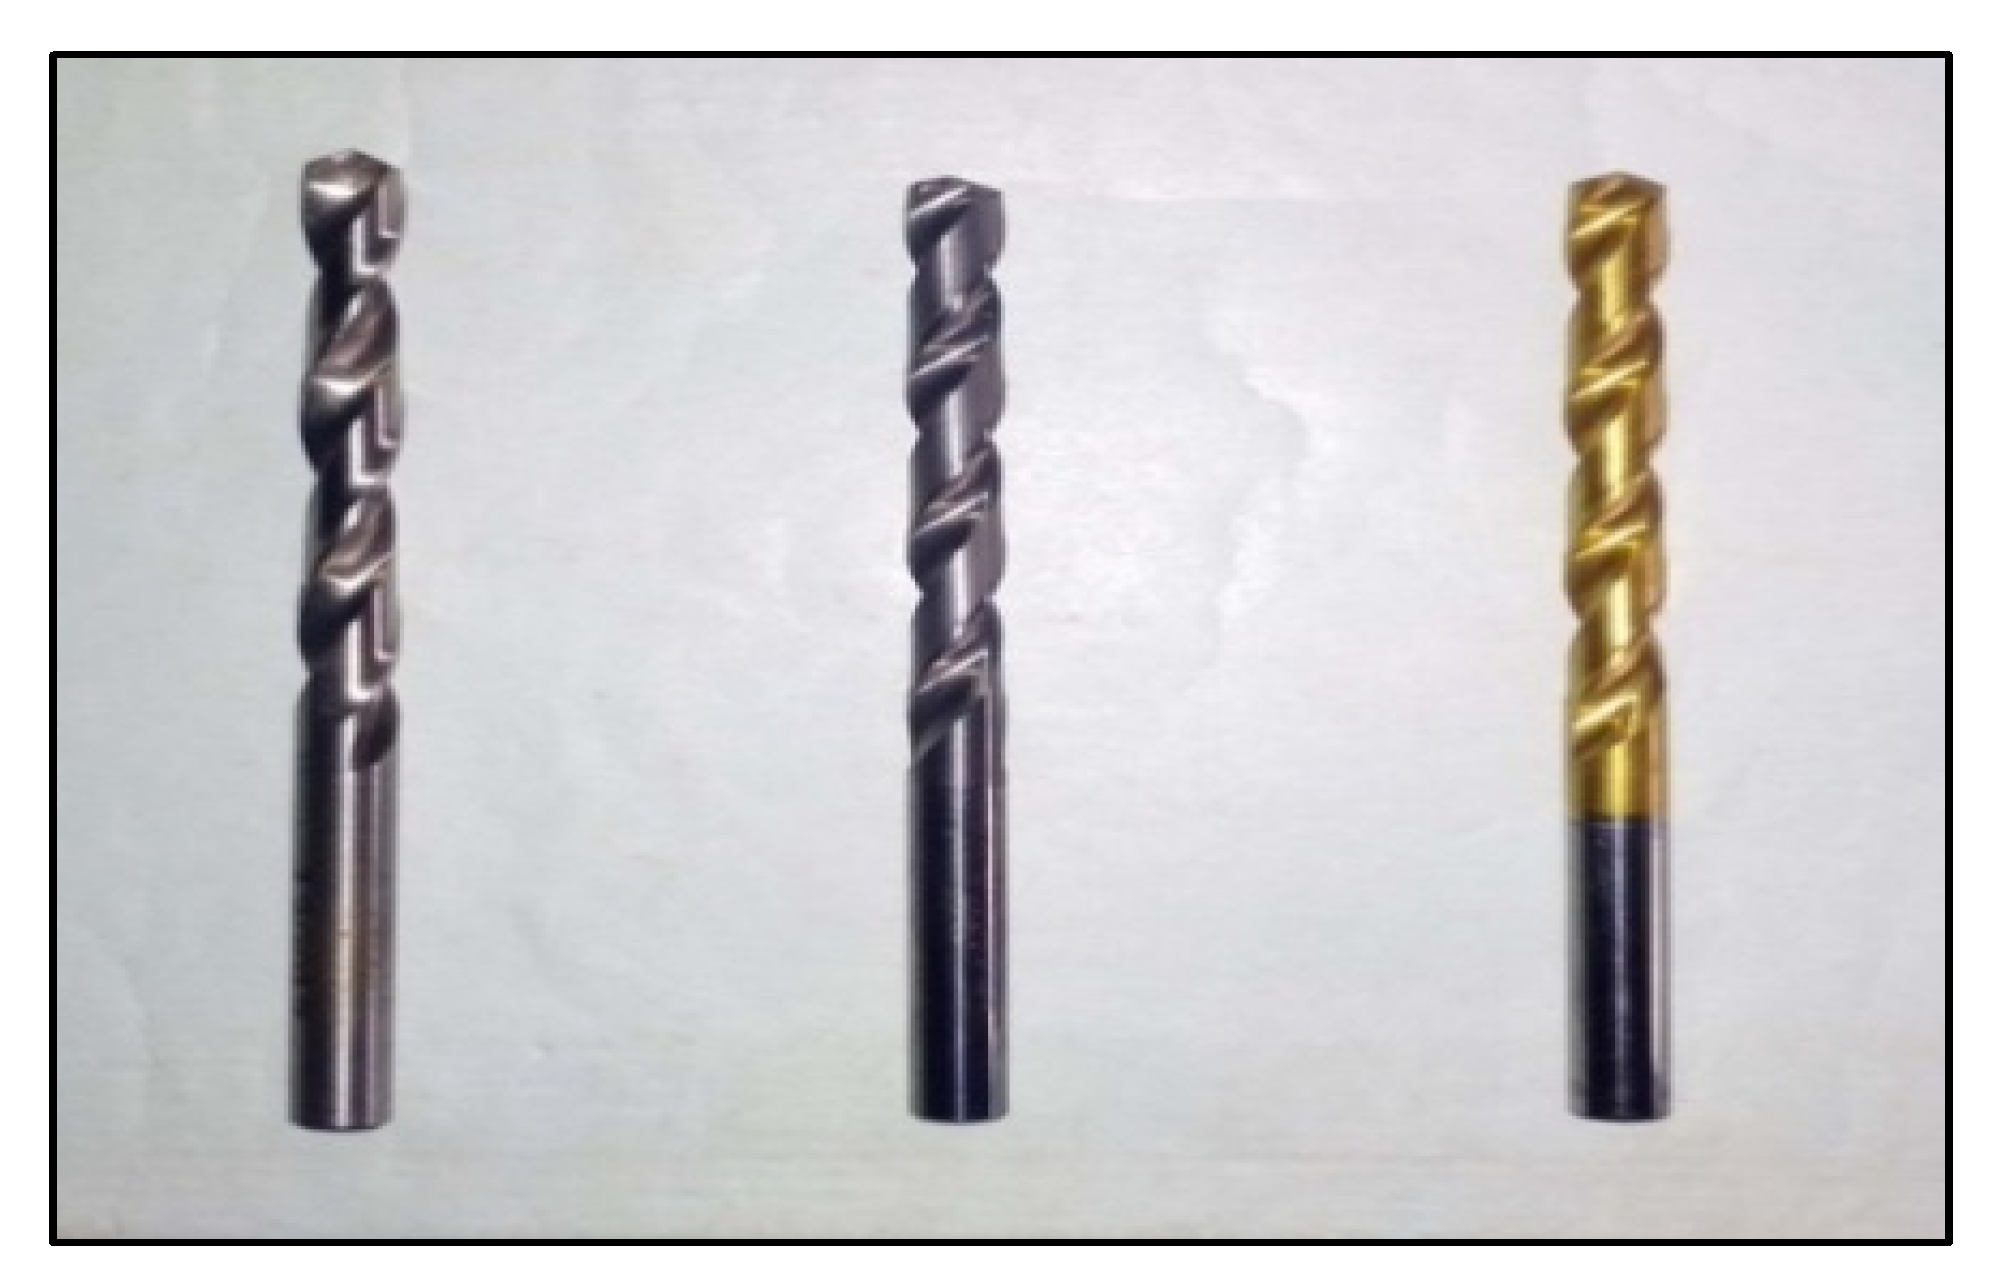
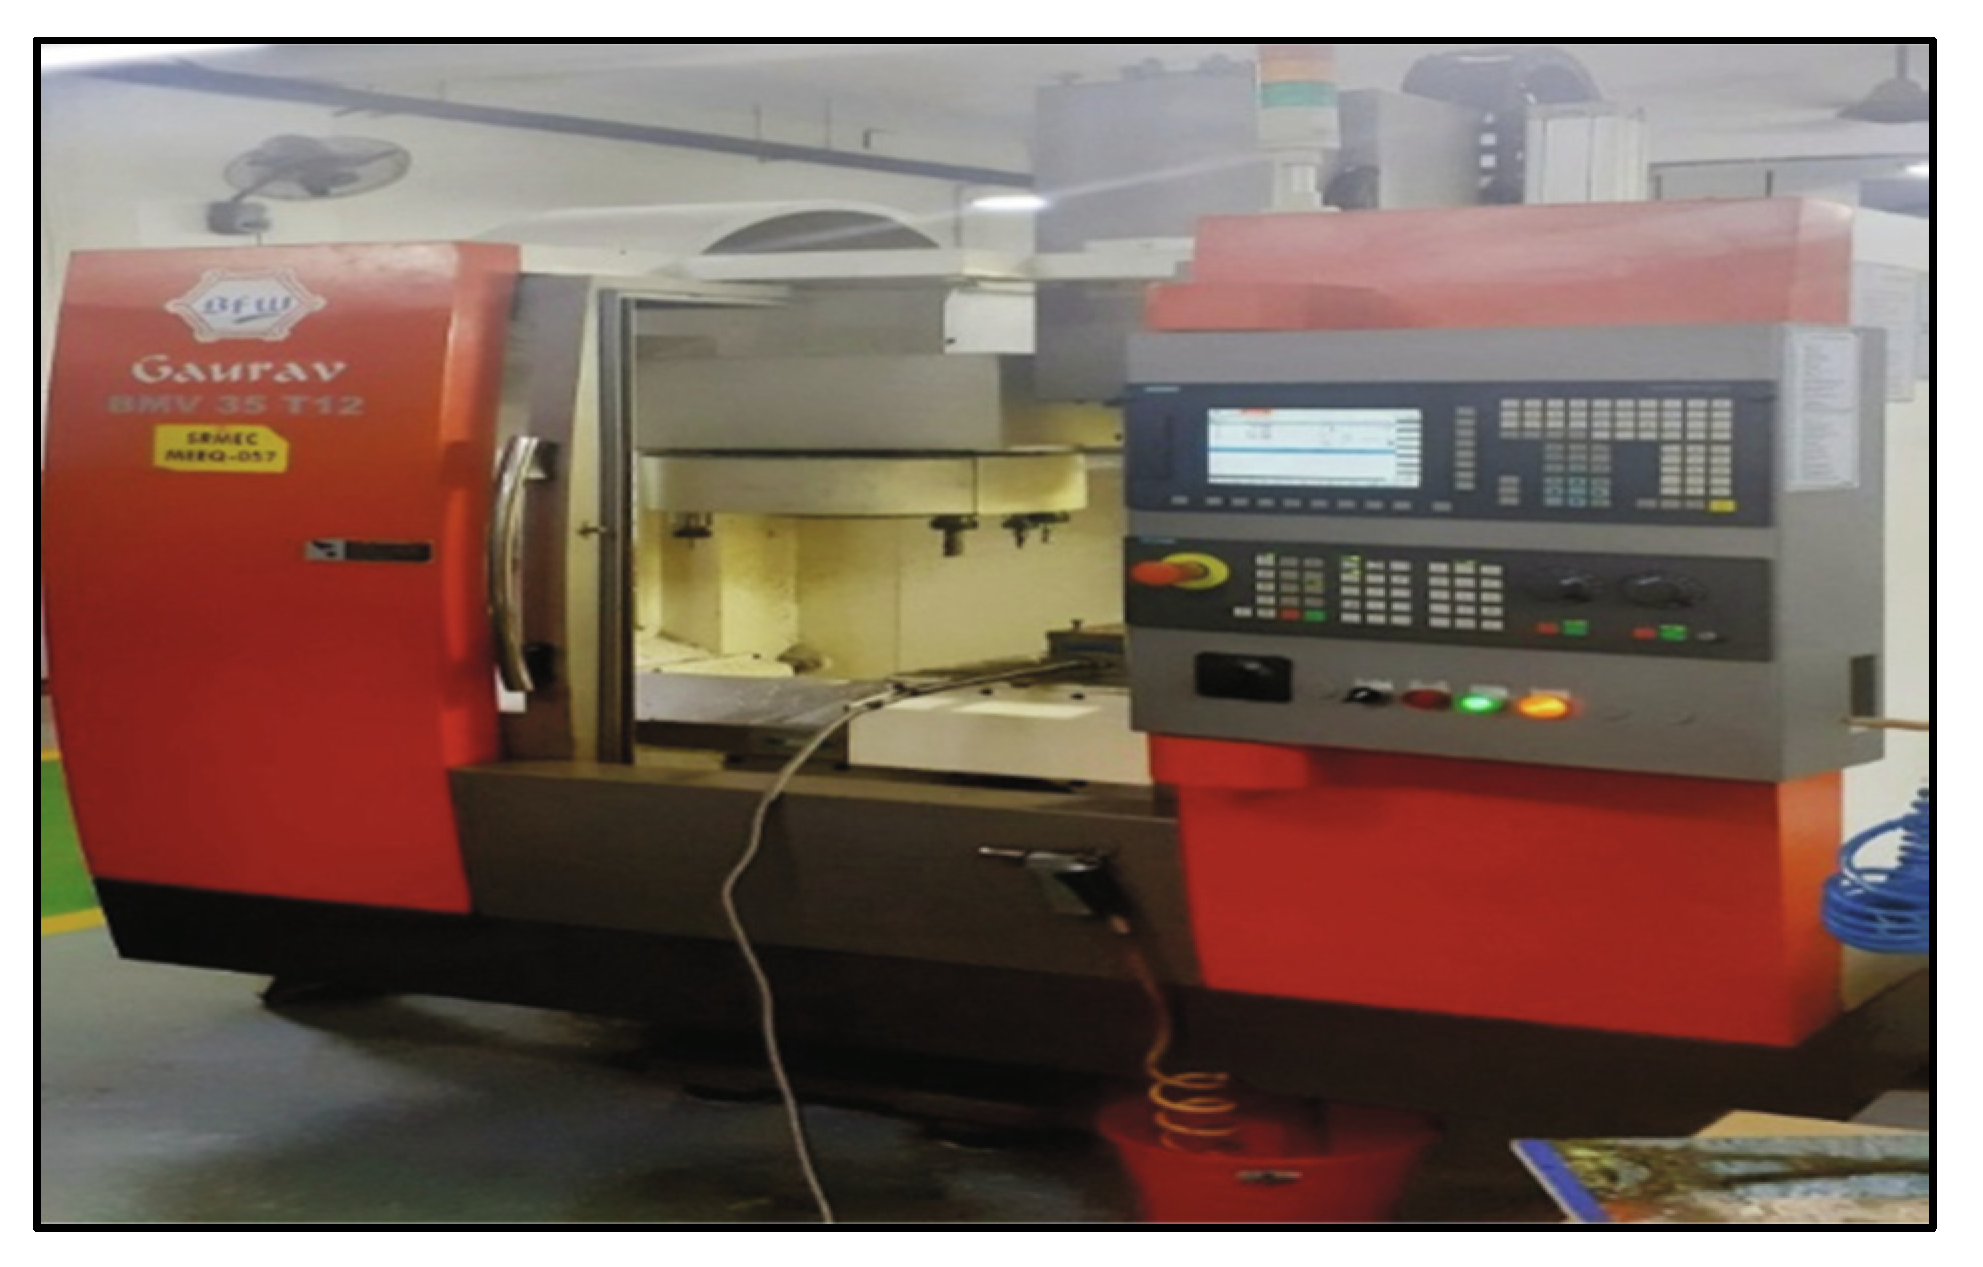
2.2. Drilling
2.3. Grey Relational Analysis
3. Measurements
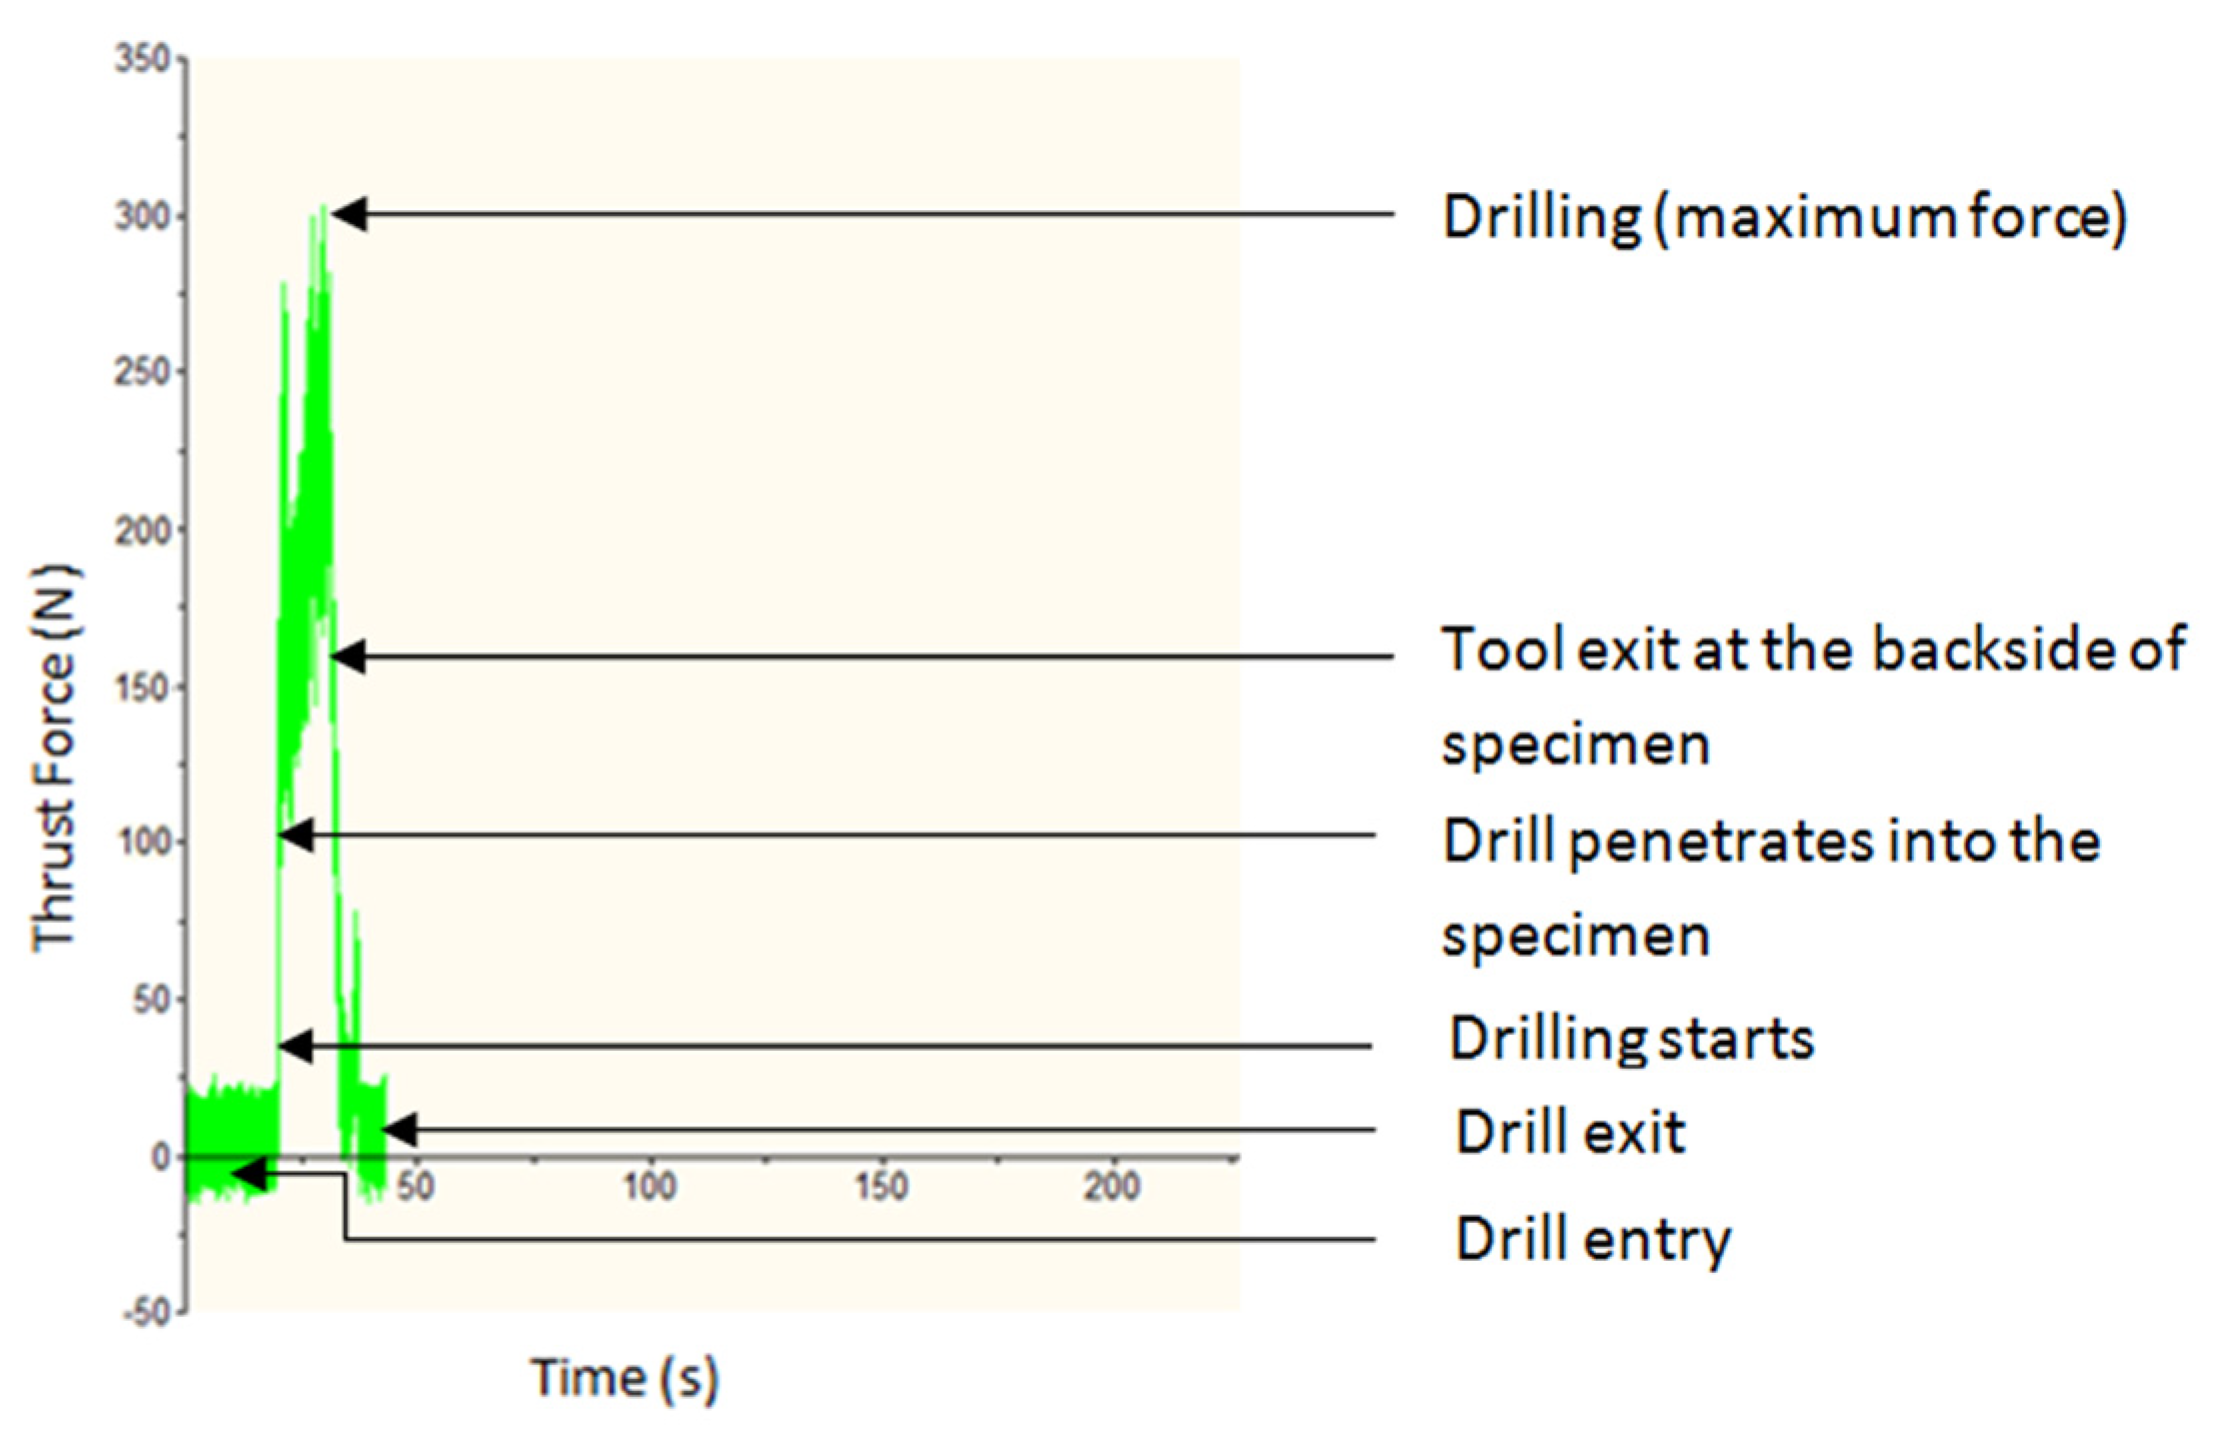
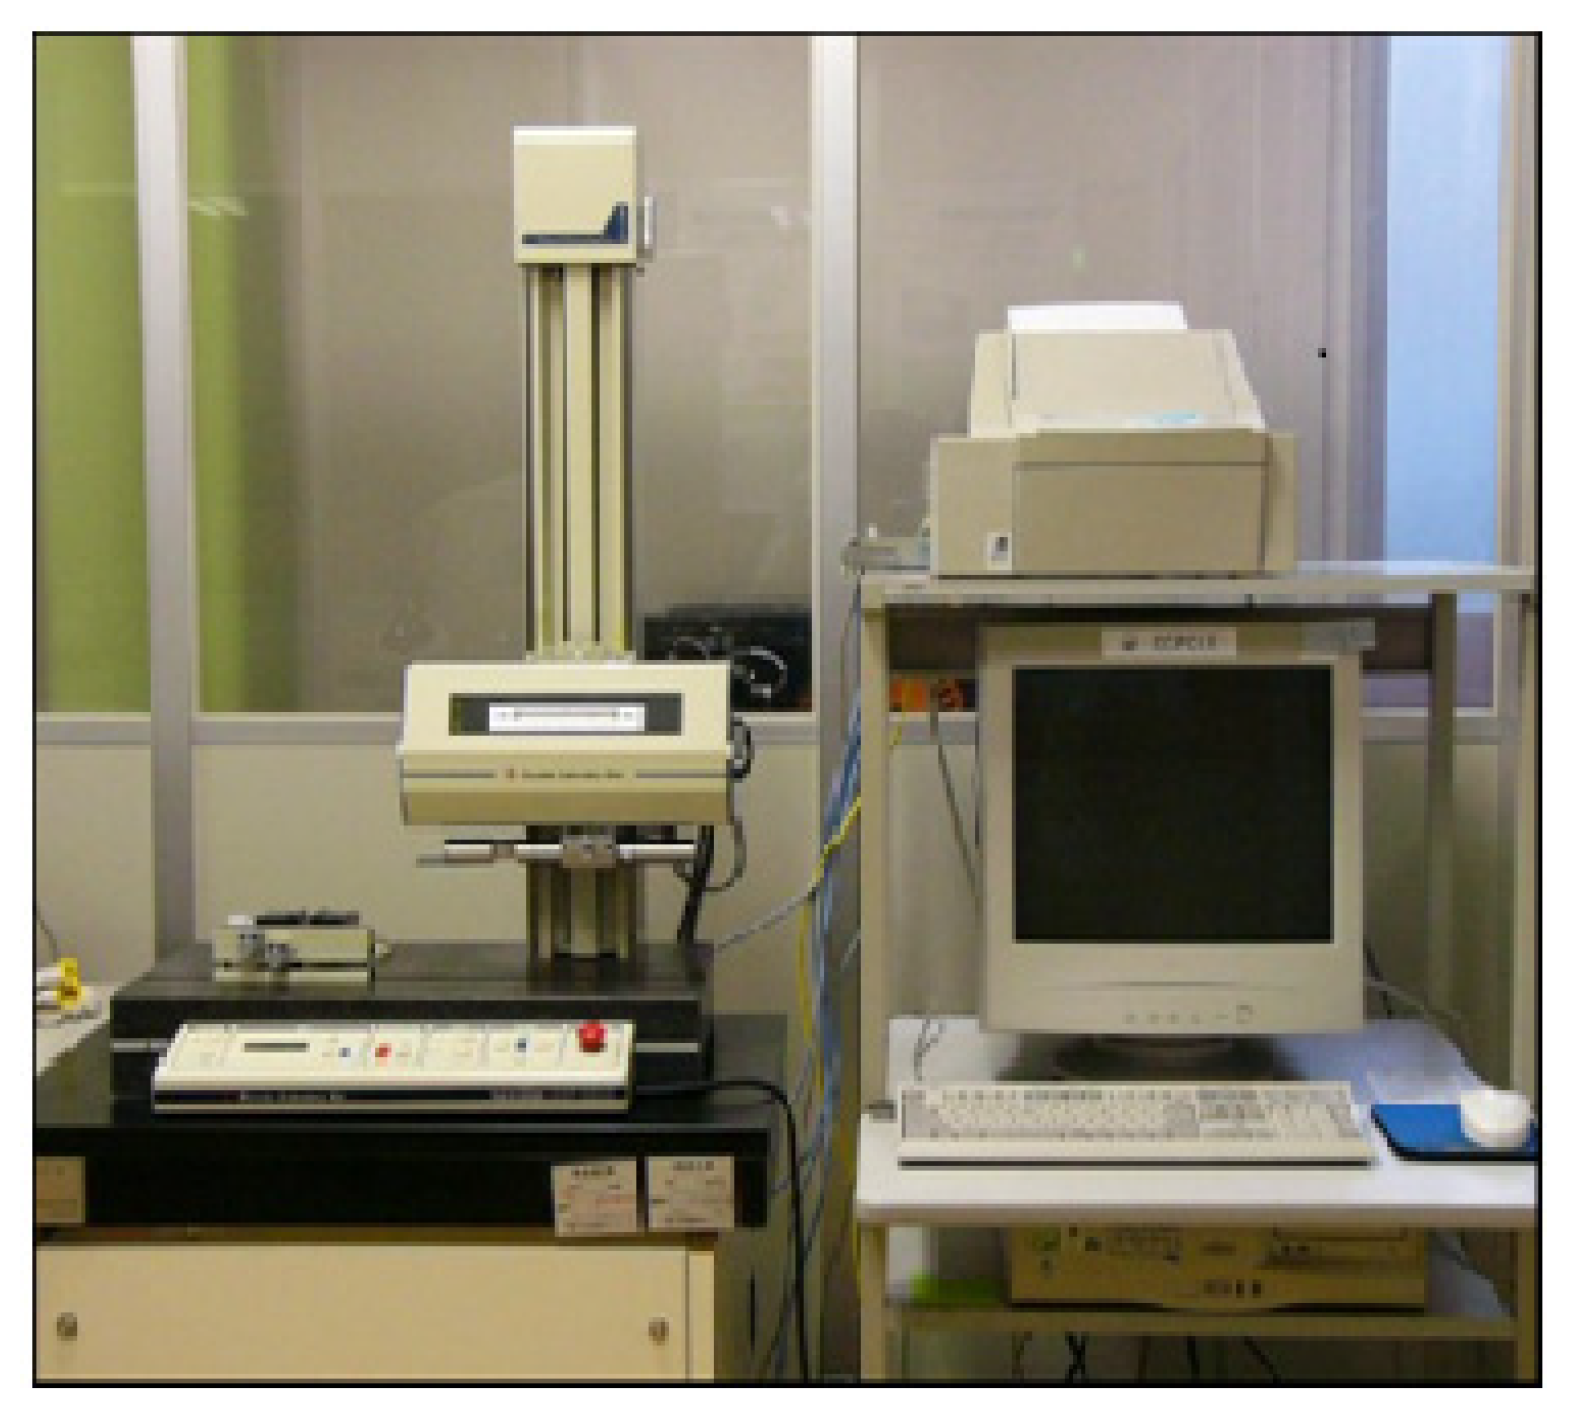
3.1. Thrust Force (TF) Measurement
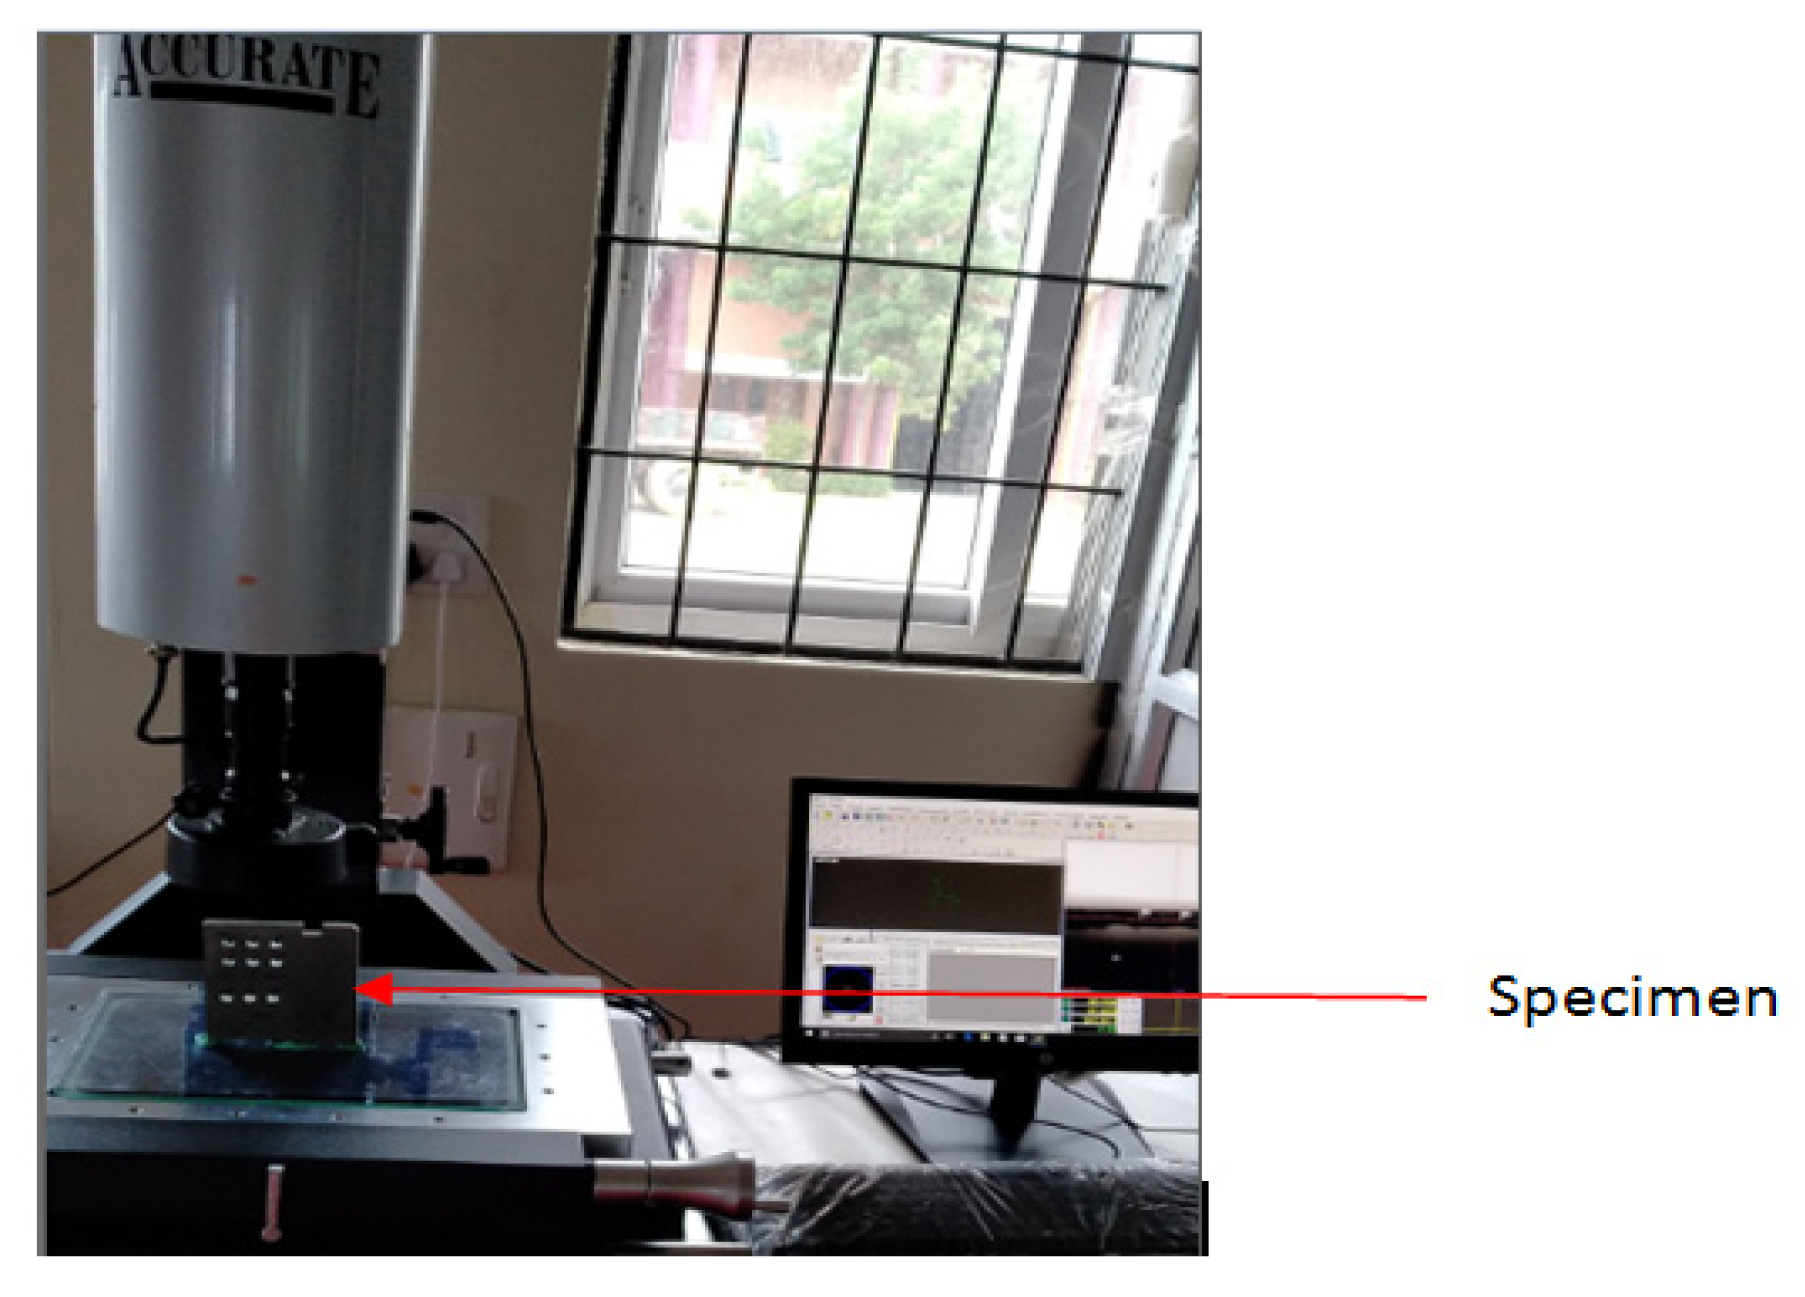
3.2. Surface Roughness (SR) Measurement
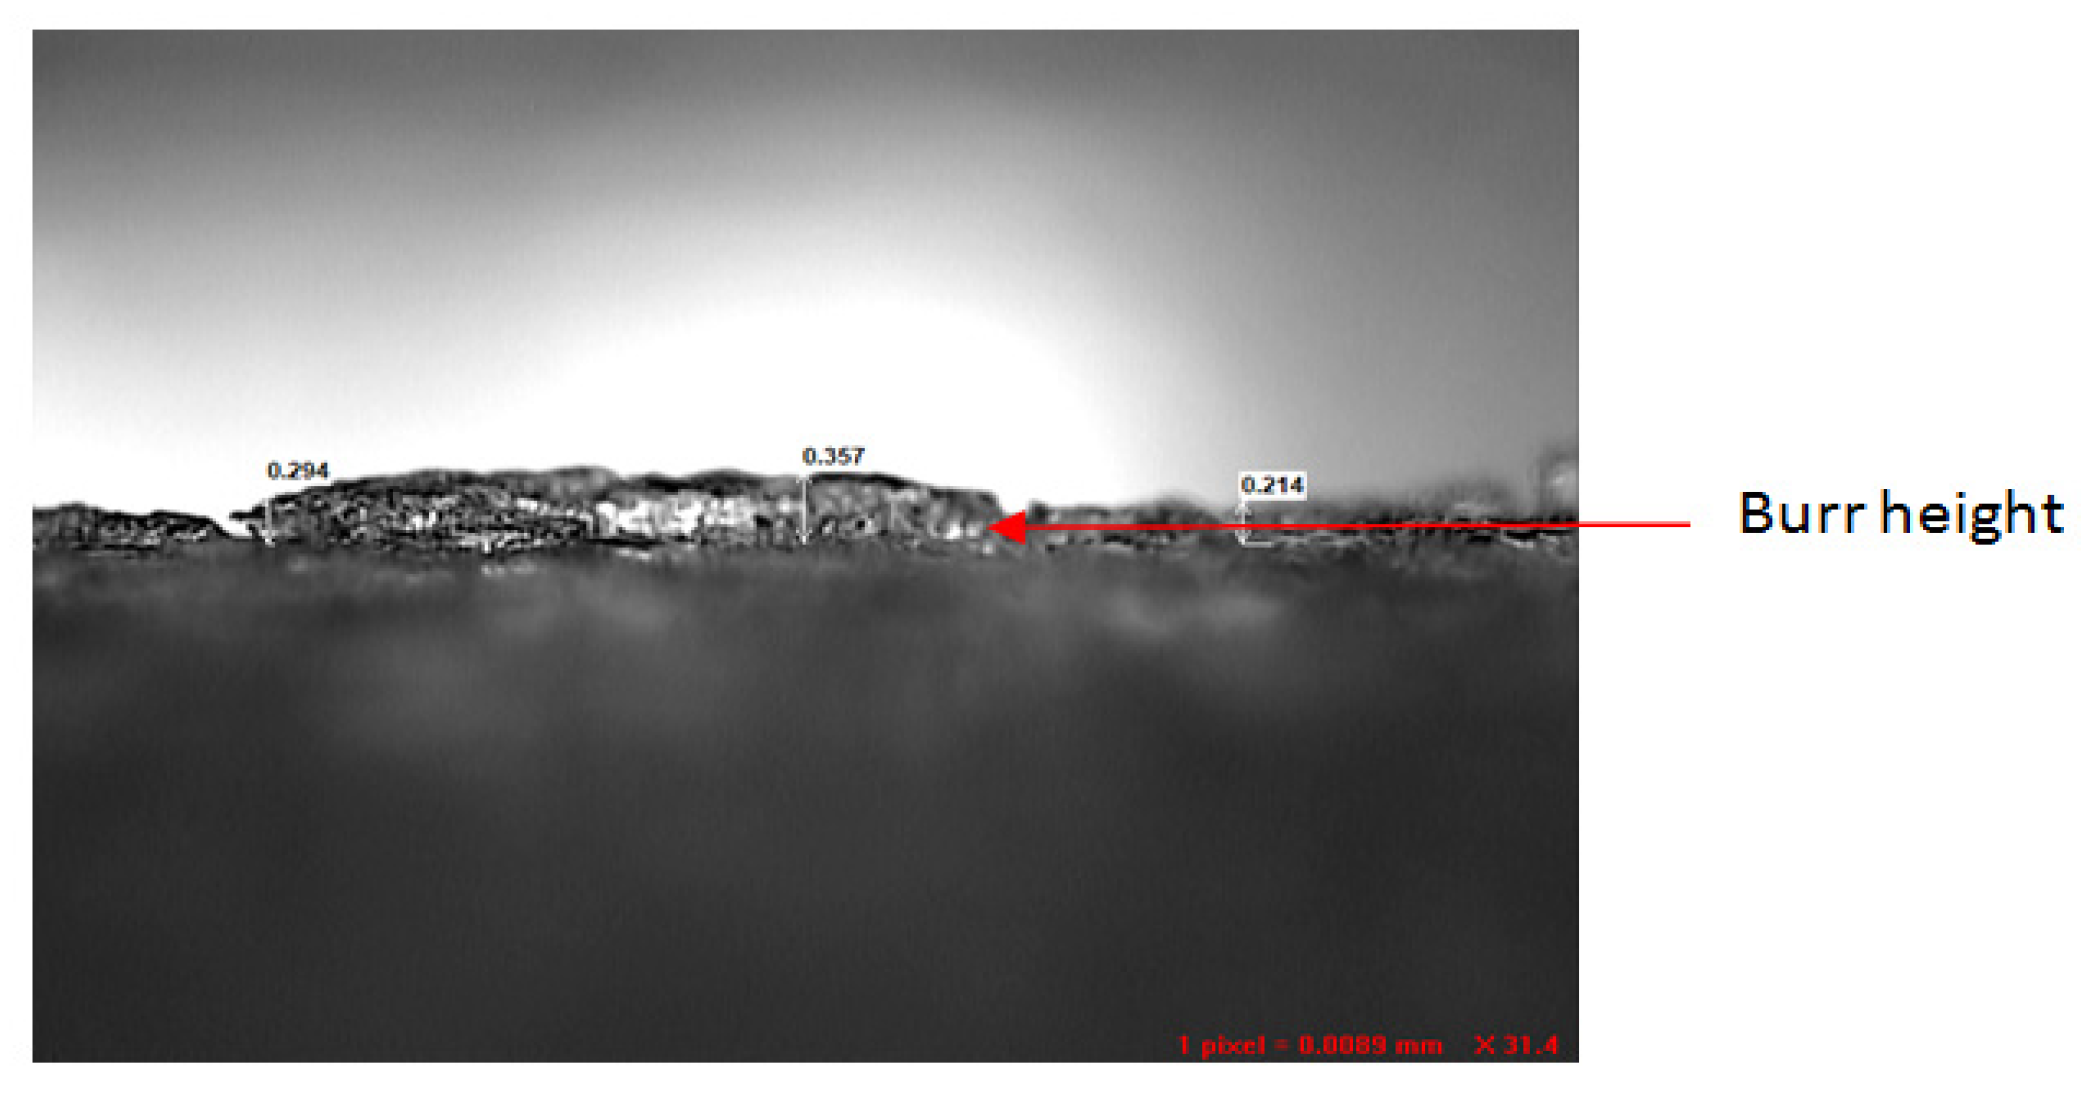
3.3. Measurement of Burr Height
4. Results and Discussion
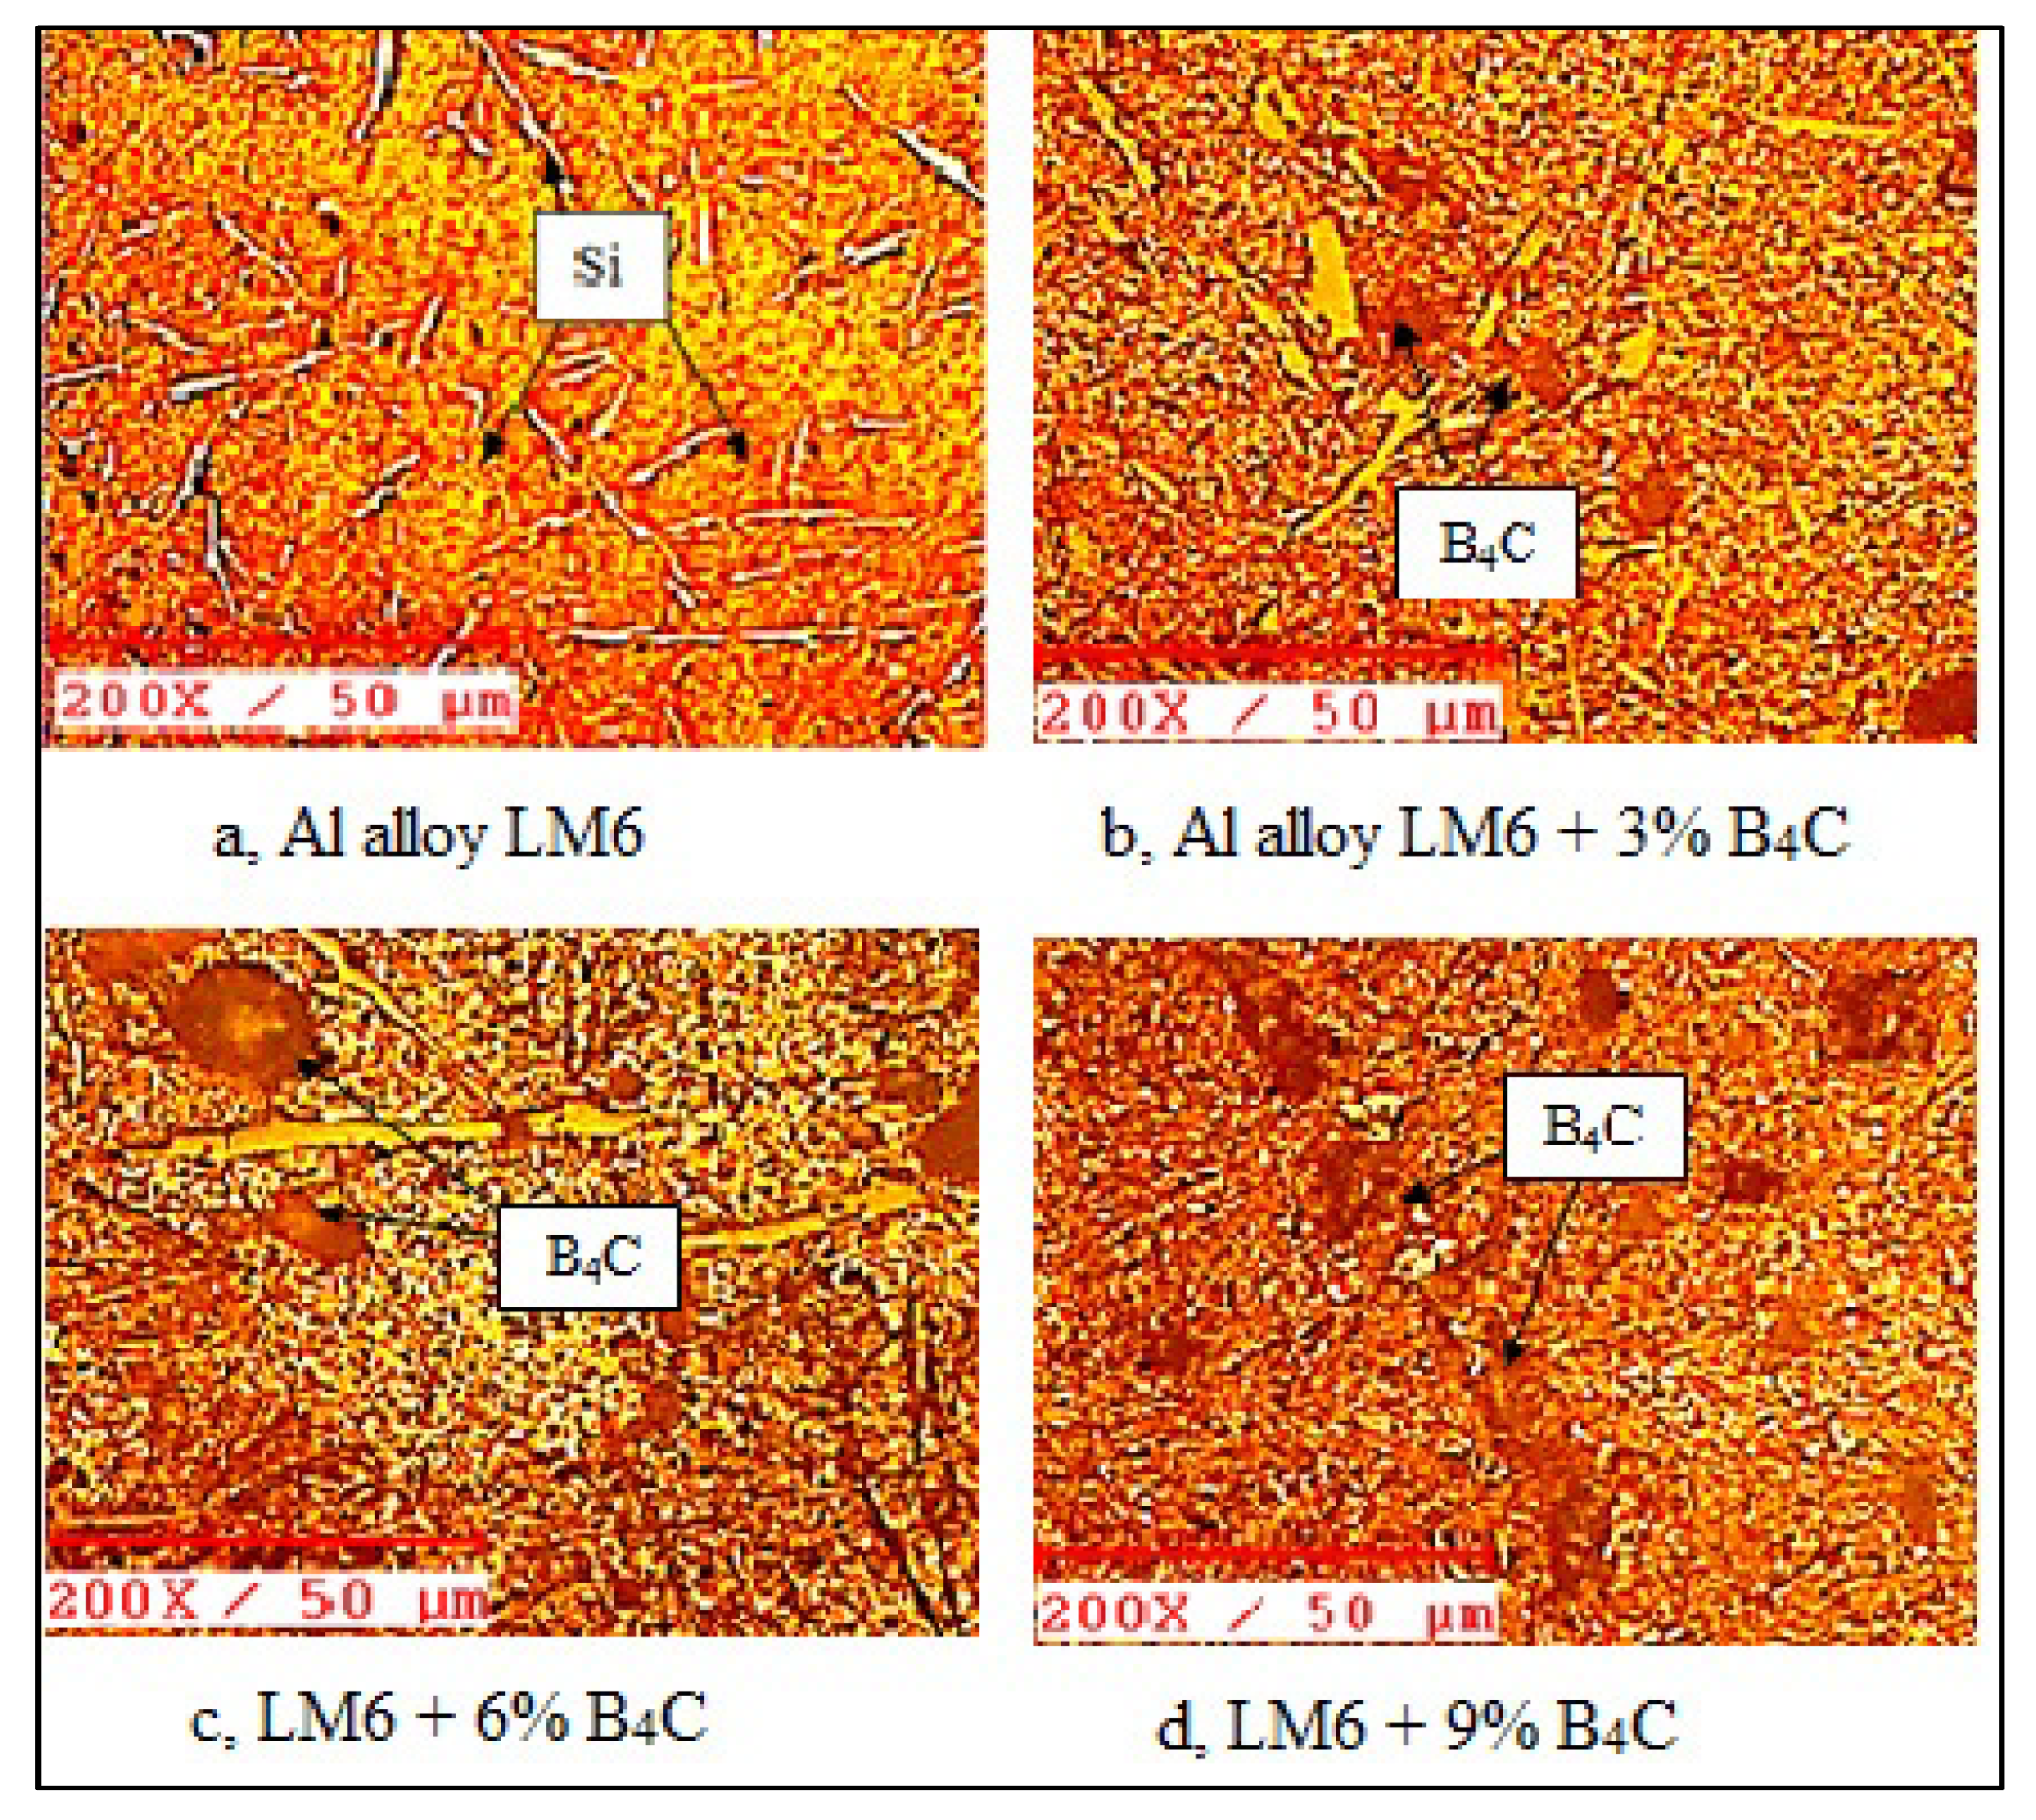
4.1. Microstructure
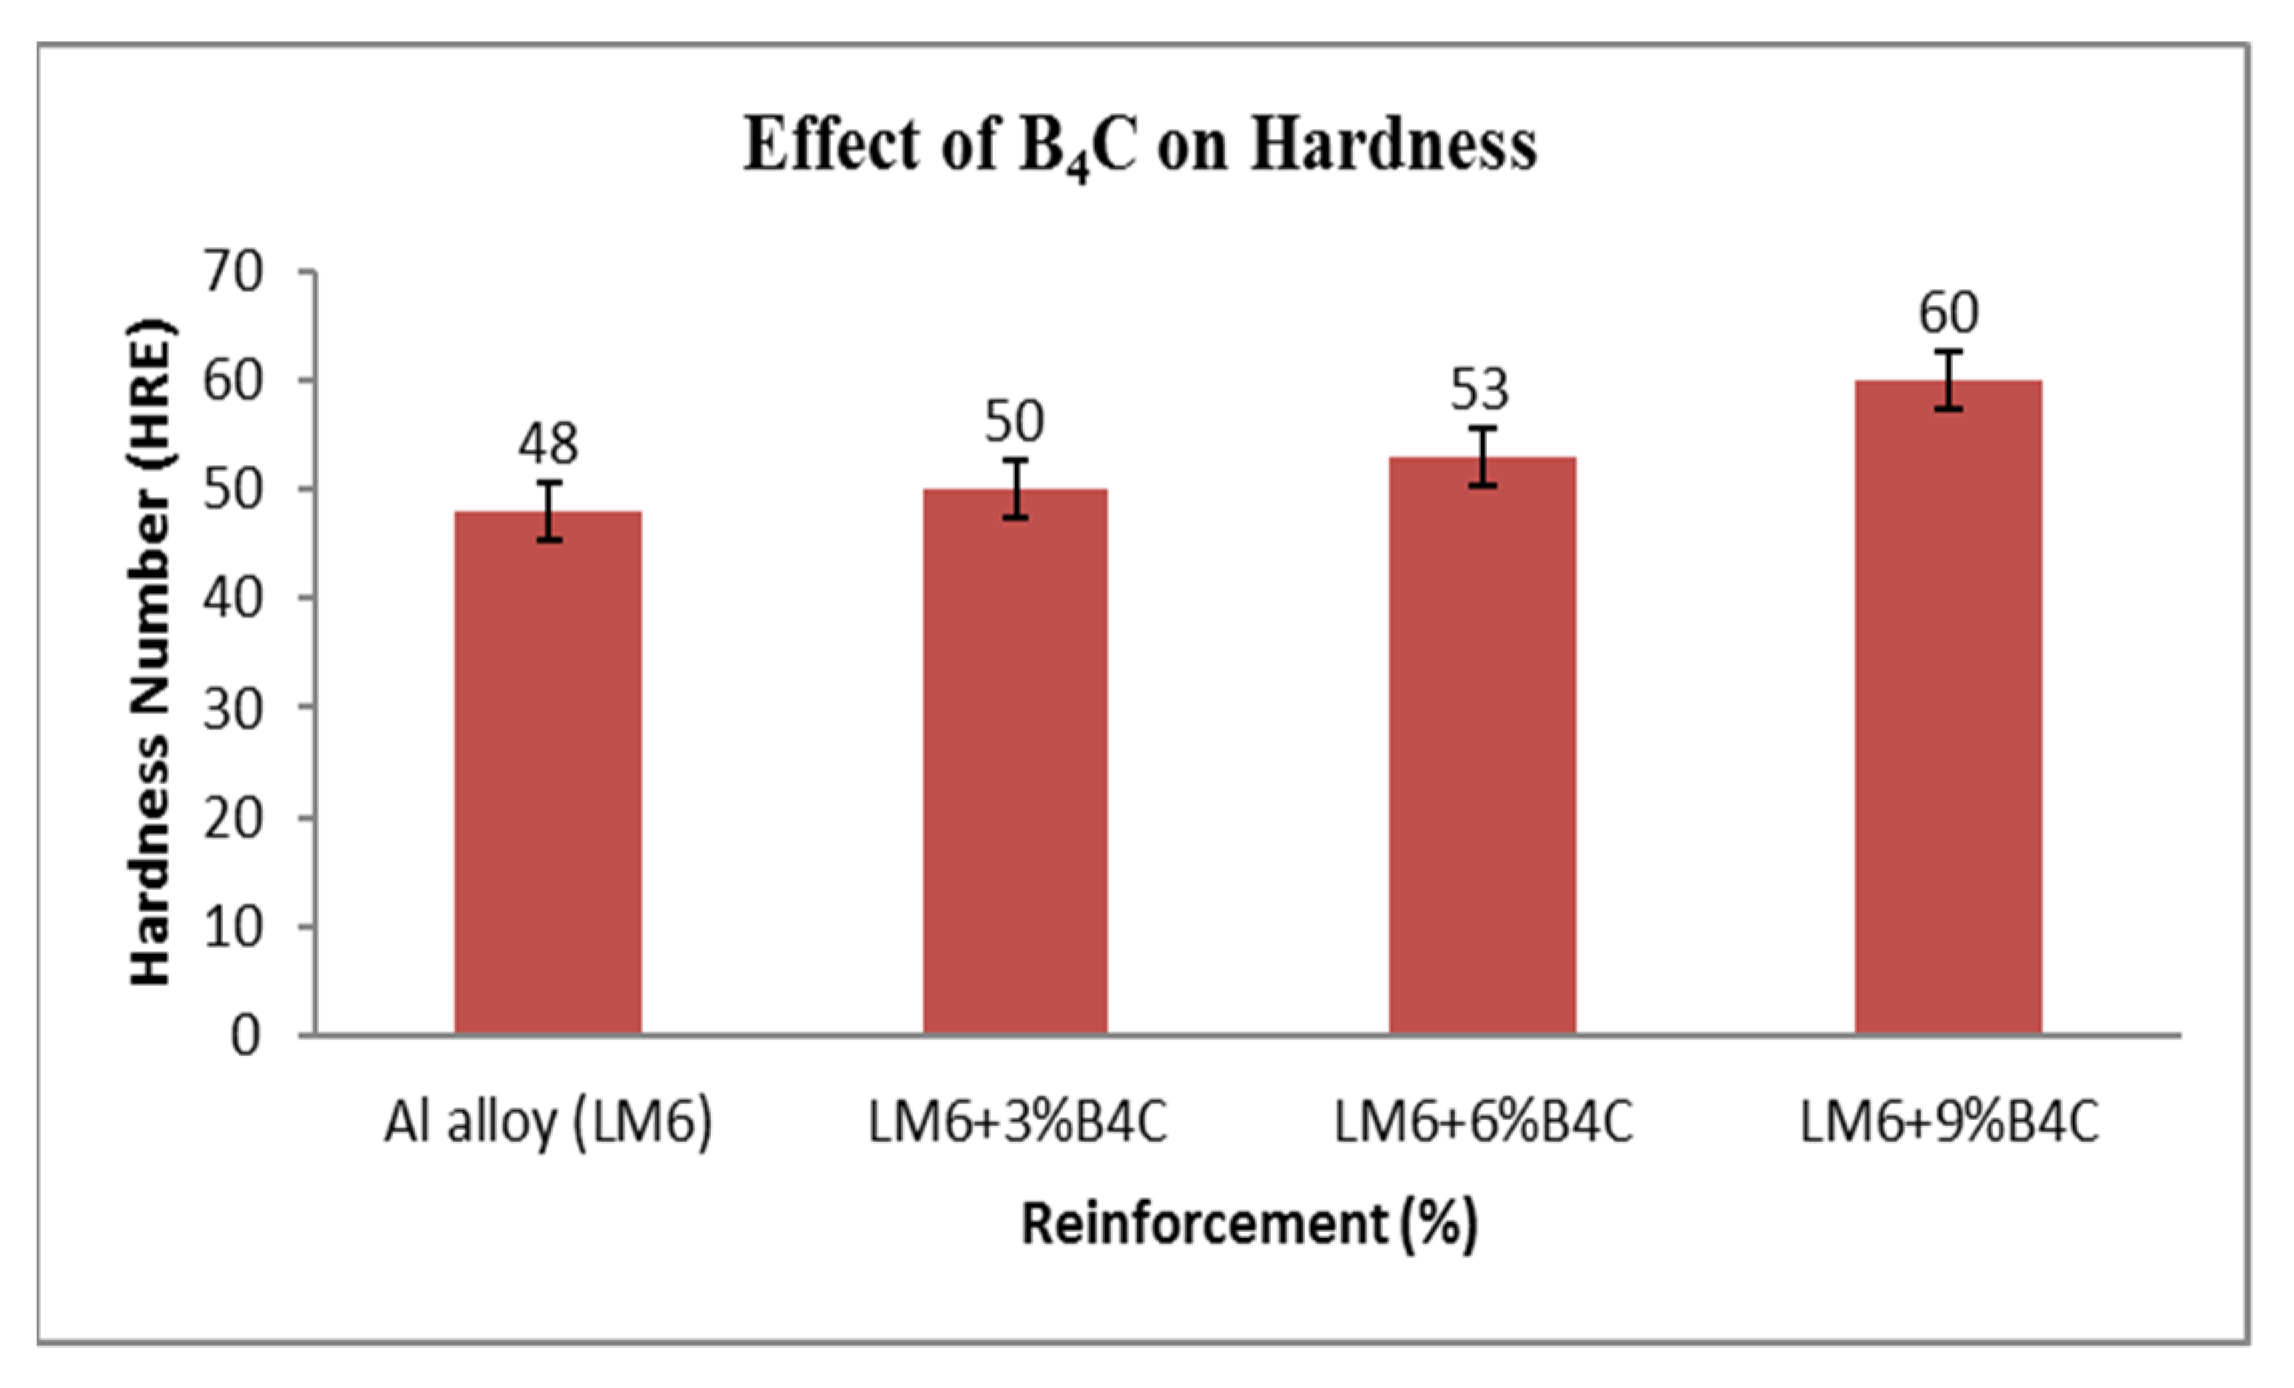
4.2. Hardness
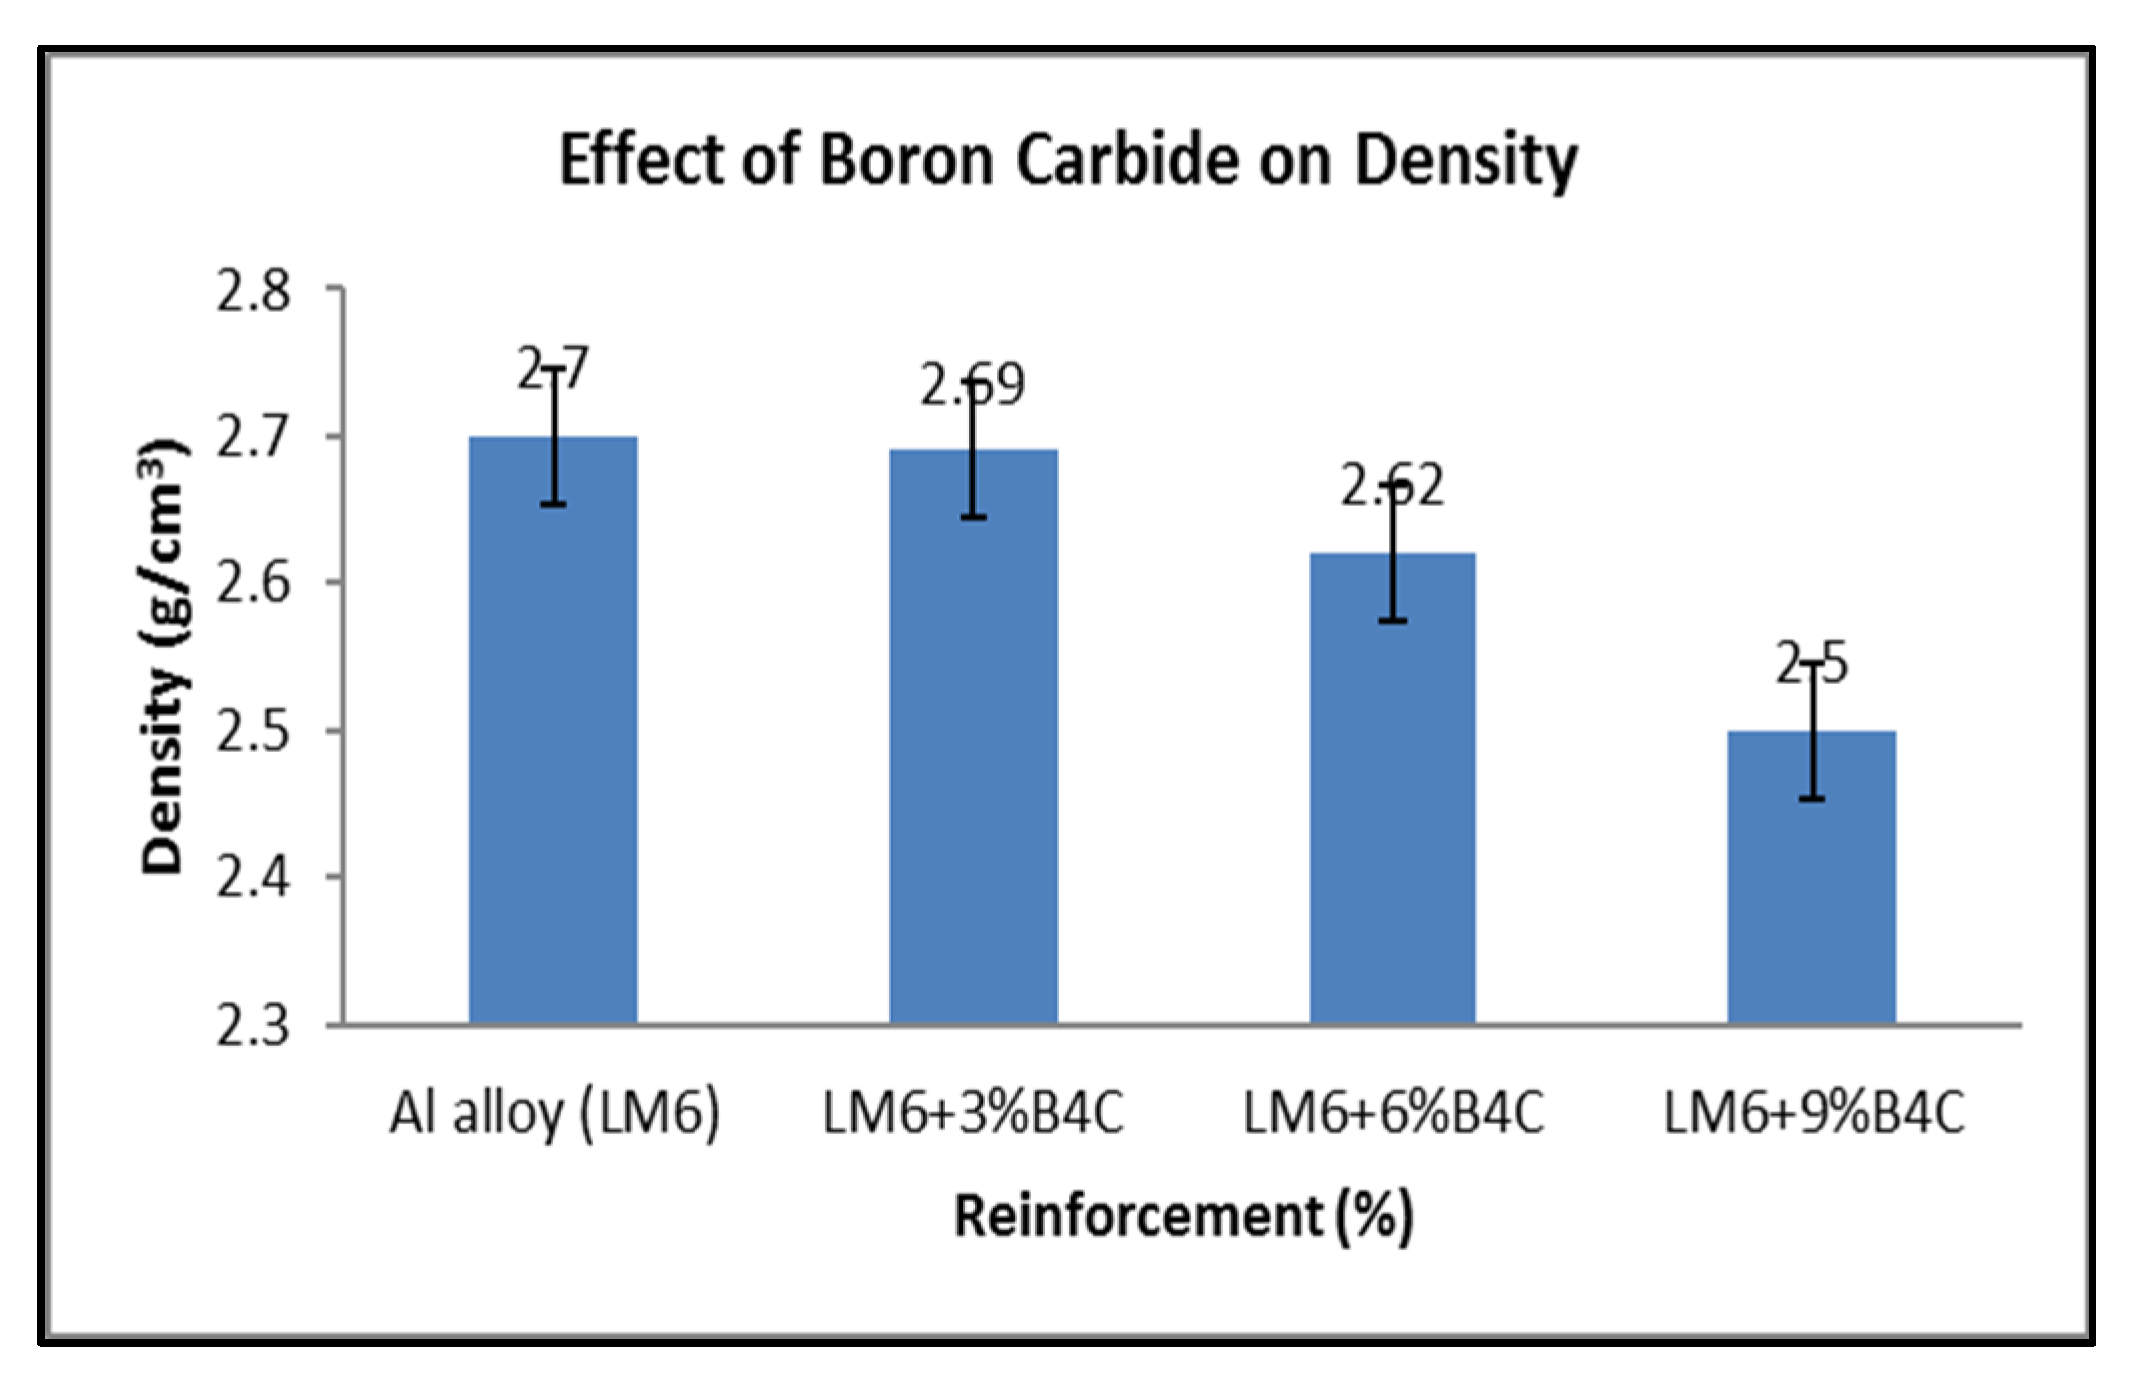
4.3. Density Measurement
4.4. Grey Relational Analysis ()
4.5. Confirmation Experiments
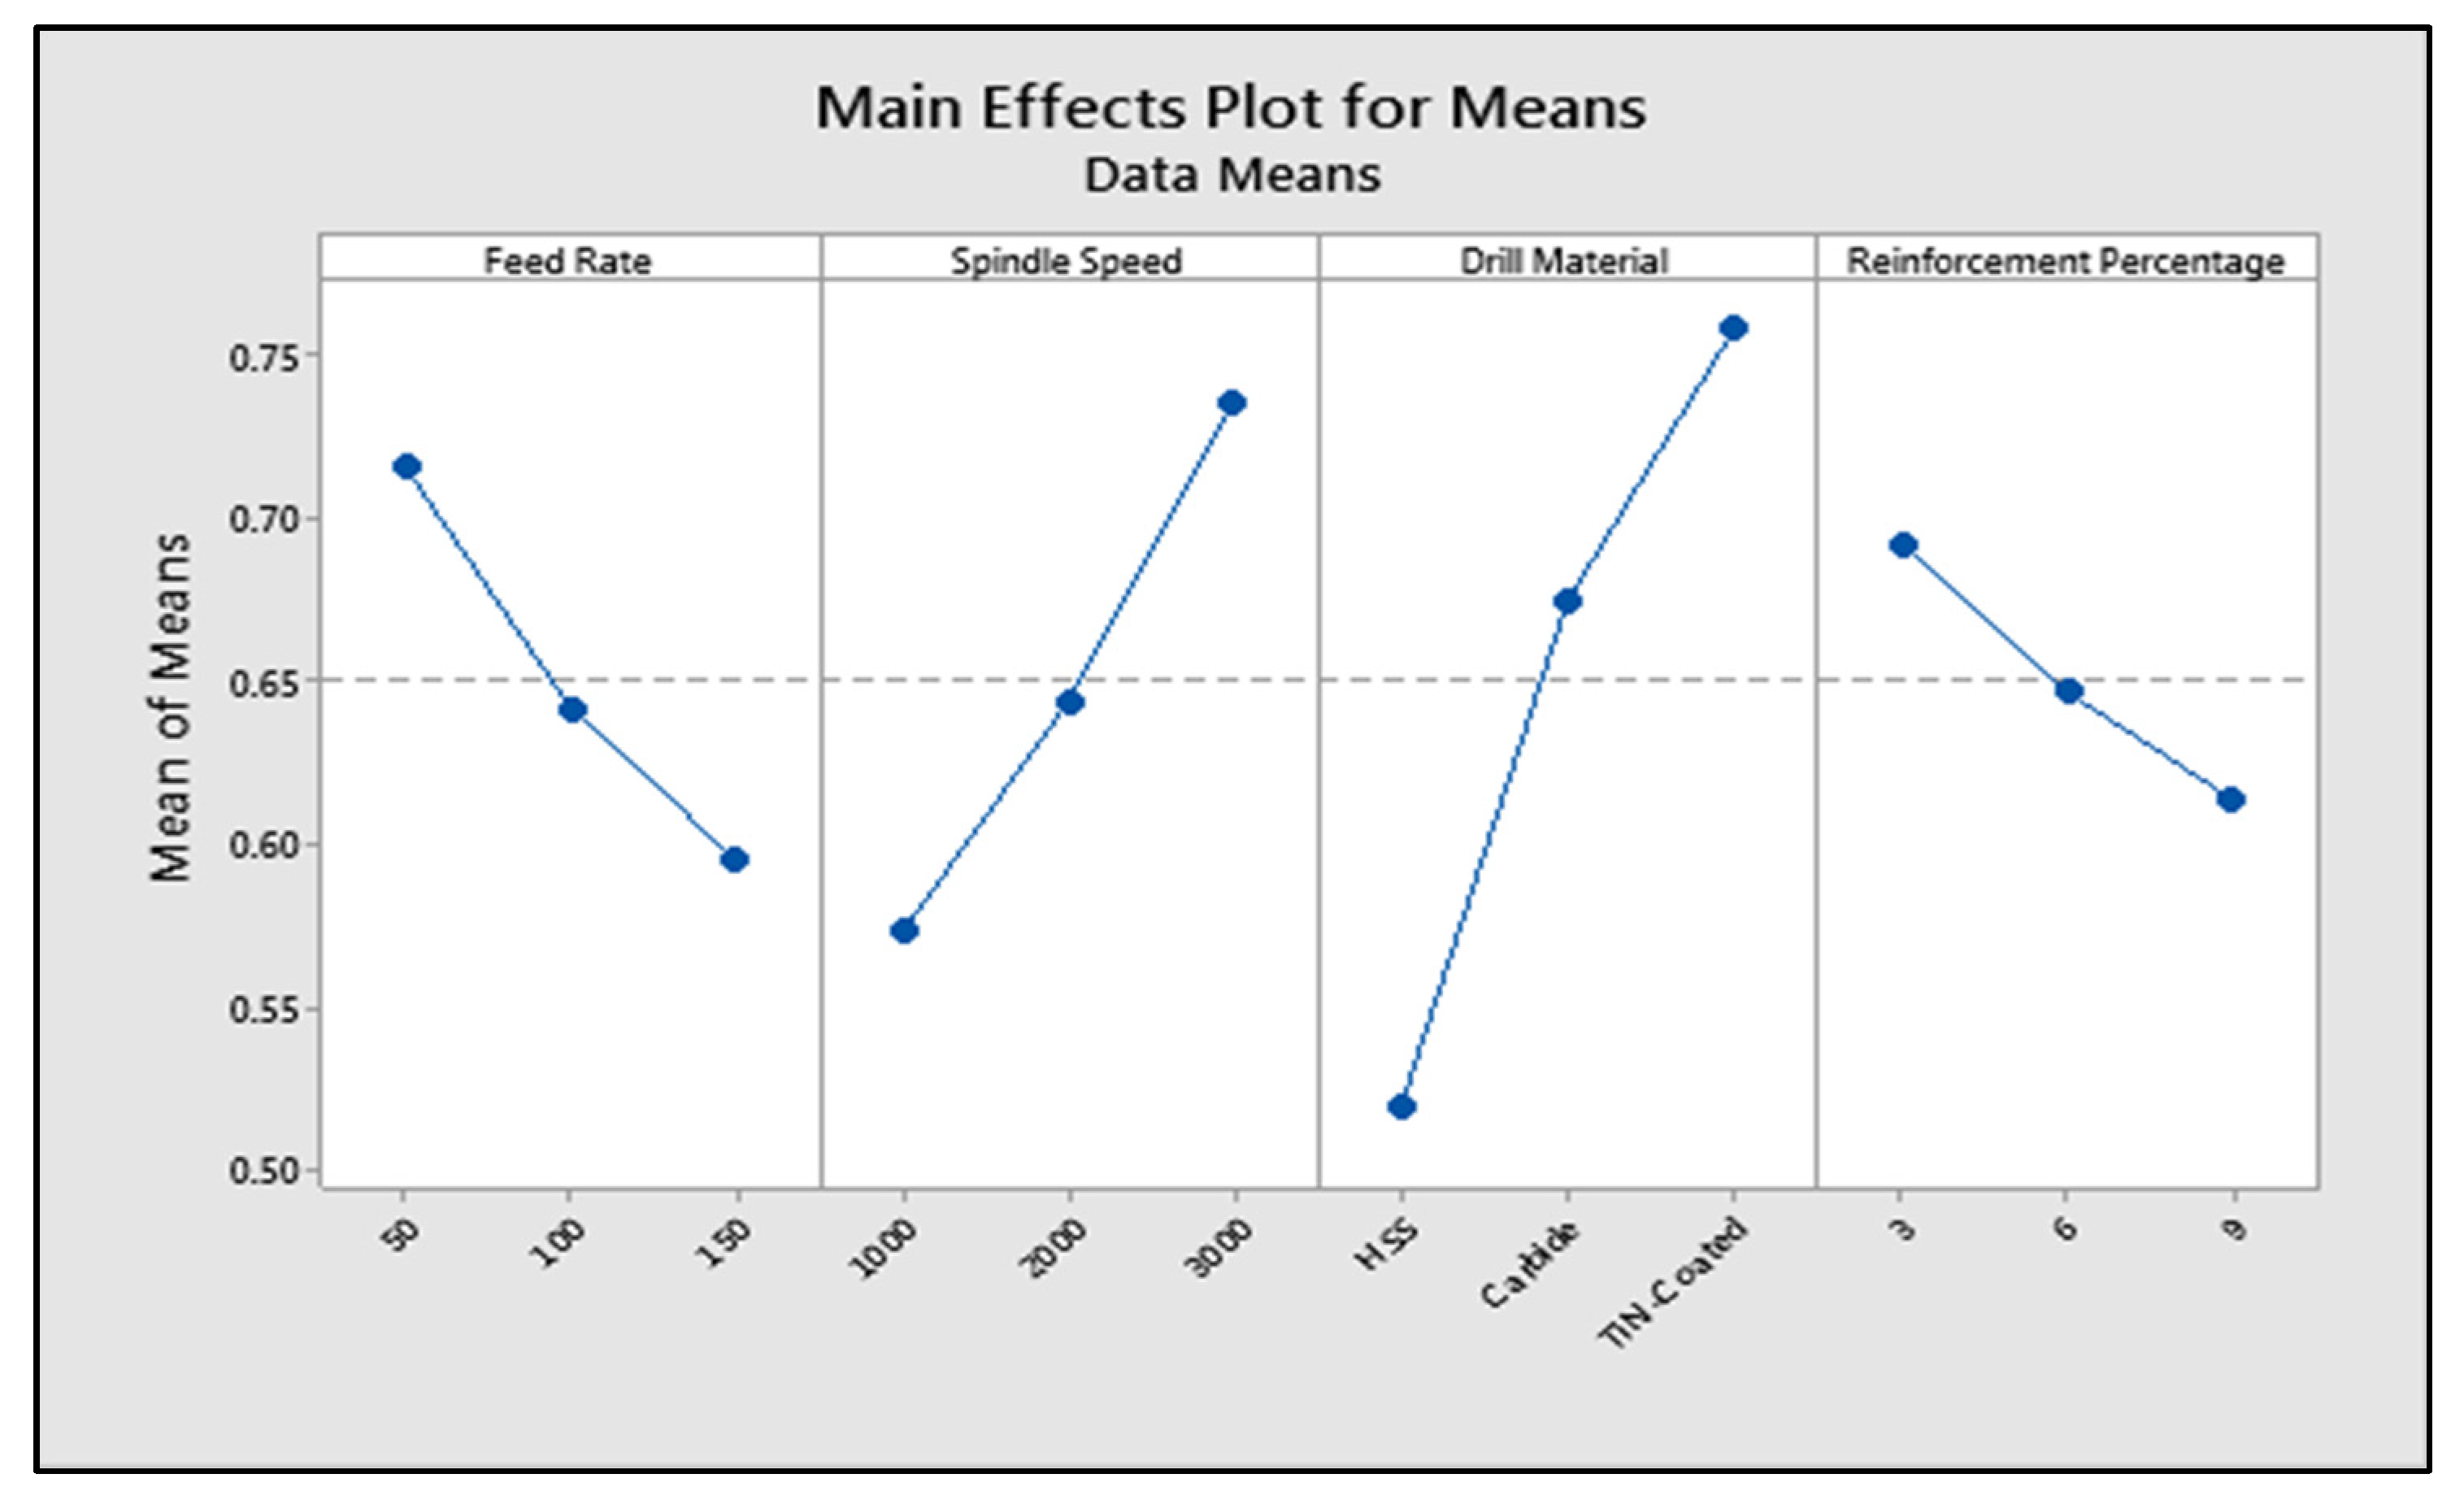
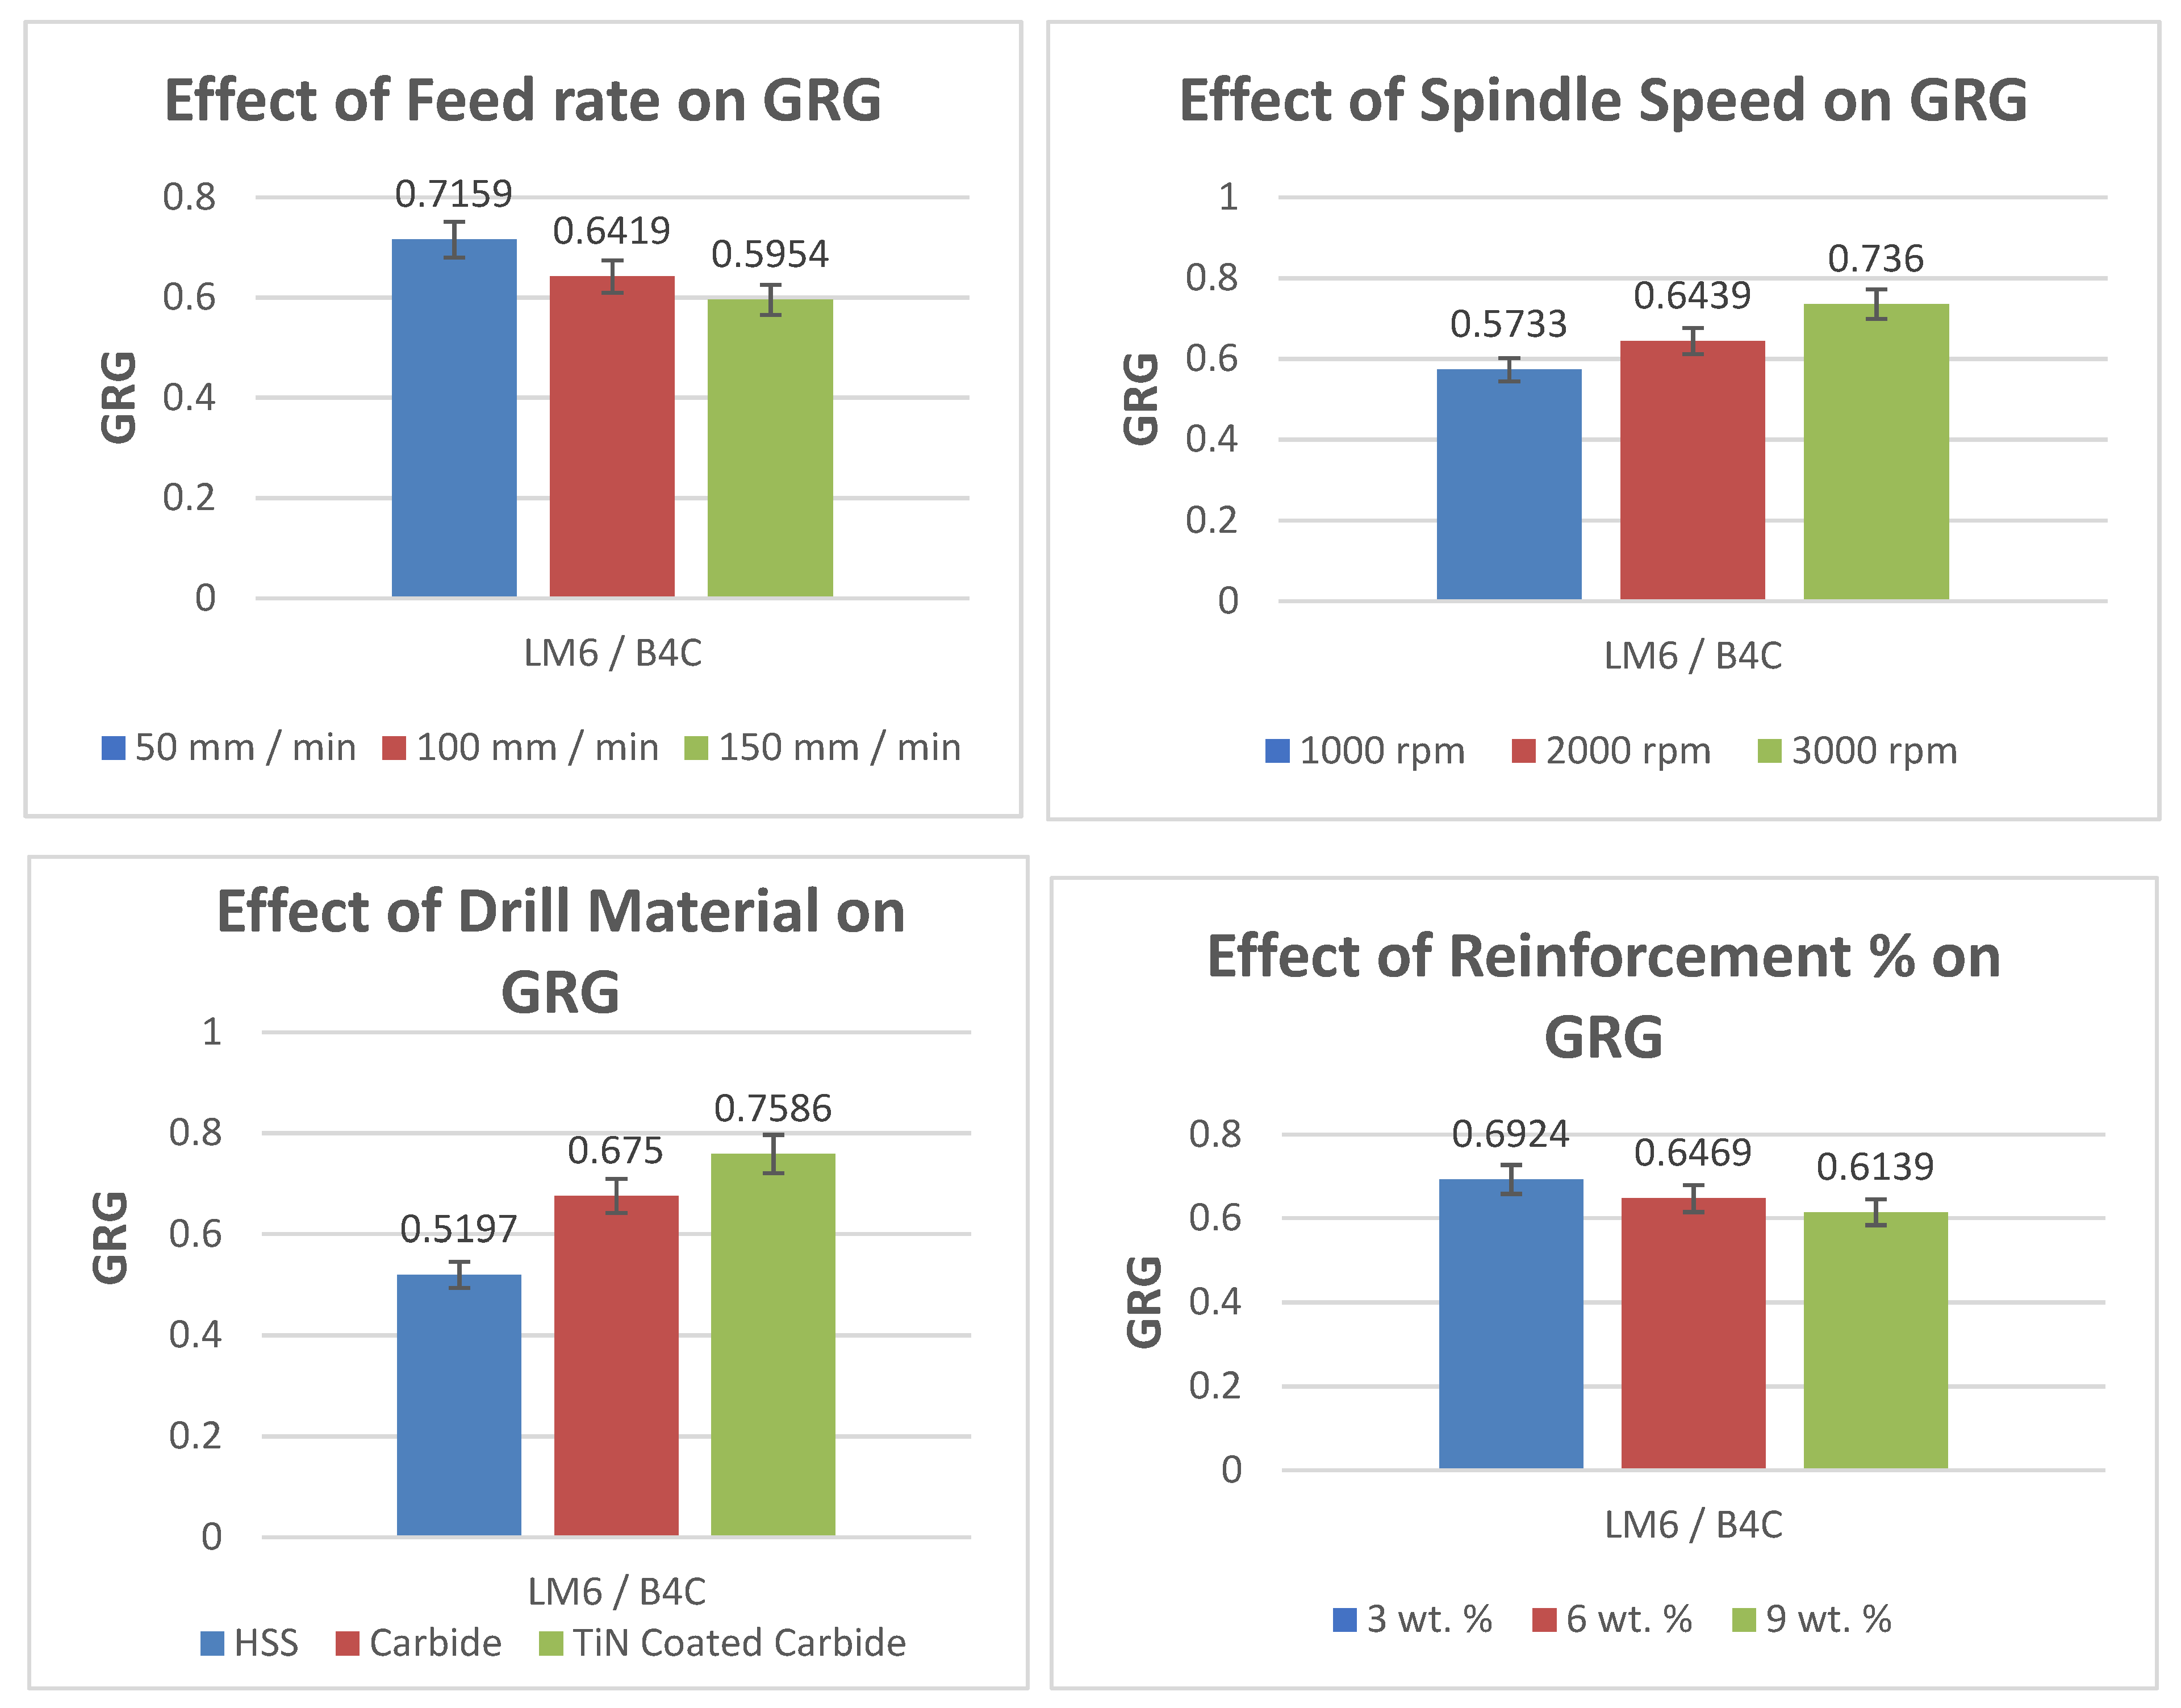
4.6. The Effects of Drilling Process Variables on the GRG
5. Conclusions
- composites were prepared by the low cost Stir casting method.
- The uniform distribution of the second phase material in the matrix was confirmed by Optical micrographs.
- The densities of the composites decreased with rises in the wt. % of the , whereas the hardness increased with increases in the reinforcement.
- Drilling experiments were conducted on composites using Taguchi’s DoE and analysed using Grey relational analyses.
- The TF, SR and BH values decreased with decreases in the feed rate for all the specimens.
- The TF, SR and Burr height values decreased with rises in the spindle speed for all the specimens.
- The TiN-Coated carbide drill bit provided the optimum Surface Roughness and Burr Height values for all the composites.
- The predicted GRG was 0.846, whereas the experimental GRG was 0.865. A good agreement attained with respect to the predicted and experimental values could be seen and the error was 2.2%, so the methodology of optimization held well.
Author Contributions
Funding
Institutional Review Board Statement
Informed Consent Statement
Data Availability Statement
Conflicts of Interest
References
- Hassan, A.M.; Alrashdan, A.; Hayajneh, M.T.; Mayyas, A.T. Prediction of density, porosity and hardness in aluminum–copper-based composite materials using artificial neural network. J. Mater. Process. Technol. 2009, 209, 894–899. [Google Scholar] [CrossRef]
- Hassan, A.M.; Mayyas, A.T.; Alrashdan, A.; Hayajneh, M.T. Wear behavior of Al–Cu and Al–Cu/SiC components produced by powder metallurgy. J. Mater. Sci. 2008, 43, 5368–5375. [Google Scholar] [CrossRef]
- Hassan, A.M.; Hayajneh, M.; Al-Omari, M.A.-H. The Effect of the Increase in Graphite Volumetric Percentage on the Strength and Hardness of Al-4 Weight Percent Mg-Graphite Composites. J. Mater. Eng. Perform. 2002, 11, 250–255. [Google Scholar] [CrossRef]
- Hayajneh, M.; Hassan, A.M.; Alrashdan, A.; Mayyas, A.T. Prediction of tribological behavior of aluminum–copper based composite using artificial neural network. J. Alloy. Compd. 2009, 470, 584–588. [Google Scholar] [CrossRef]
- Hayajneh, M.T.; Hassan, A.M.; Mayyas, A.T. Artificial neural network modeling of the drilling process of self-lubricated aluminum/alumina/graphite hybrid composites synthesized by powder metallurgy technique. J. Alloy. Compd. 2009, 478, 559–565. [Google Scholar] [CrossRef]
- Zhong, Z.-W. Processes for environmentally friendly and/or cost-effective manufacturing. Mater. Manuf. Process. 2021, 36, 987–1009. [Google Scholar] [CrossRef]
- Alem, S.A.A.; Latifi, R.; Angizi, S.; Hassanaghaei, F.; Aghaahmadi, M.; Ghasali, E.; Rajabi, M. Microwave sintering of ceramic reinforced metal matrix composites and their properties: A review. Mater. Manuf. Process. 2020, 35, 303–327. [Google Scholar] [CrossRef]
- Davim, J.; António, C.C. Optimal drilling of particulate metal matrix composites based on experimental and numerical procedures. Int. J. Mach. Tools Manuf. 2001, 41, 21–31. [Google Scholar] [CrossRef]
- Karabulut, Ş.; Gökmen, U.; Çinici, H. Study on the mechanical and drilling properties of AA7039 composites reinforced with Al2O3/B4C/SiC particles. Compos. Part B Eng. 2016, 93, 43–55. [Google Scholar] [CrossRef]
- Davim, J.P. Machining Composites Materials; John Wiley & Sons: Hoboken, NJ, USA, 2013. [Google Scholar]
- Davim, J.P. Machining of Hard Materials; Springer Science & Business Media: Berlin, Germany, 2011. [Google Scholar]
- Kamble, A.; Kulkarni, S.G. Microstructural examination of bagasse ash reinforced waste aluminium alloy matrix composite. In AIP Conference Proceedings; AIP Publishing LLC: Melville, NY, USA, 2019; Volume 2105, p. 020011. [Google Scholar] [CrossRef]
- Prasad, S.V.; Asthana, R. Aluminium metal-matrix composites for automotive applications: Tribological considerations. Tribol. Lett. 2004, 17, 445–453. [Google Scholar] [CrossRef]
- Prasad, V.; Bhat, B.; Mahajan, Y.; Ramakrishnan, P. Structure–property correlation in discontinuously reinforced aluminium matrix composites as a function of relative particle size ratio. Mater. Sci. Eng. A 2002, 337, 179–186. [Google Scholar] [CrossRef]
- Etemadi, R.; Wang, B.; Pillai, K.M.; Niroumand, B.; Omrani, E.; Rohatgi, P. Pressure infiltration processes to synthesize metal matrix composites—A review of metal matrix composites, the technology and process simulation. Mater. Manuf. Process. 2018, 33, 1261–1290. [Google Scholar] [CrossRef]
- Miracle, D. Metal matrix composites—From science to technological significance. Compos. Sci. Technol. 2005, 65, 2526–2540. [Google Scholar] [CrossRef]
- Basavarajappa, S.; Chandramohan, G.; Rao, K.V.N.; Radhakrishanan, R.; Krishnaraj, V. Turning of particulate metal matrix composites—review and discussion. Proc. Inst. Mech. Eng. Part B J. Eng. Manuf. 2006, 220, 1189–1204. [Google Scholar] [CrossRef]
- Kumar, N.S.; Shankar, G.S.; Basavarajappa, S.; Suresh, R. Some studies on mechanical and machining characteristics of Al2219/n-B 4 C/MoS 2 nano-hybrid metal matrix composites. Measurement 2017, 107, 1–11. [Google Scholar] [CrossRef]
- Ficici, F. Evaluation of surface roughness in drilling particle-reinforced composites. Adv. Compos. Lett. 2020, 29, 2633366X20937711. [Google Scholar] [CrossRef]
- Ravindranath, V.; Yerriswamy, M.; Vivek, S.; Shankar, G.S.; Kumar, N.S. Drilling of Al2219/B 4 C/Gr metal matrix hybrid composites. Mater. Today Proc. 2017, 4, 9898–9901. [Google Scholar] [CrossRef]
- Rajmohan, T.; Palanikumar, K.; Kathirvel, M. Optimization of machining parameters in drilling hybrid aluminium metal matrix composites. Trans. Nonferrous Met. Soc. China 2012, 22, 1286–1297. [Google Scholar] [CrossRef]
- Taşkesen, A.; Kütükde, K. Experimental investigation and multi-objective analysis on drilling of boron carbide reinforced metal matrix composites using grey relational analysis. Measurement 2014, 47, 321–330. [Google Scholar] [CrossRef]
- Klocke, F.; Eisenblätter, G. Dry Cutting. CIRP Ann. 1997, 46, 519–526. [Google Scholar] [CrossRef]
- Batzer, S.; Haan, D.; Rao, P.; Olson, W.; Sutherland, J. Chip morphology and hole surface texture in the drilling of cast Aluminum alloys. J. Mater. Process. Technol. 1998, 79, 72–78. [Google Scholar] [CrossRef]
- Carrilero, M.; Bienvenido, R.; Sánchez, J.; Álvarez, M.; González, A.; Marcos, M. A SEM and EDS insight into the BUL and BUE differences in the turning processes of AA2024 Al–Cu alloy. Int. J. Mach. Tools Manuf. 2002, 42, 215–220. [Google Scholar] [CrossRef]
- Dixit, U.S.; Sarma, D.K.; Davim, J.P. Environmentally Friendly Machining; Springer Science & Business Media: Berlin, Germany, 2012. [Google Scholar]
- Aamir, M.; Giasin, K.; Tolouei-Rad, M.; Vafadar, A. A review: Drilling performance and hole quality of aluminium alloys for aerospace applications. J. Mater. Res. Technol. 2020, 9, 12484–12500. [Google Scholar] [CrossRef]
- Rubi, C.S.; Prakash, J.U.; Rajkumar, C.; Mohan, A.; Muthukumarasamy, S. Optimization of process variables in drilling of LM6/fly ash composites using Grey-Taguchi method. Mater. Today Proc. 2022, 62, 5894–5898. [Google Scholar] [CrossRef]
- Parikh, V.K.; Badheka, V.J.; Badgujar, A.D.; Ghetiya, N.D. Fabrication and processing of aluminum alloy metal matrix composites. Mater. Manuf. Process. 2021, 36, 1604–1617. [Google Scholar] [CrossRef]
- Ramulu, M.; Spaulding, M. Drilling of Hybrid Titanium Composite Laminate (HTCL) with Electrical Discharge Machining. Materials 2016, 9, 746. [Google Scholar] [CrossRef] [Green Version]
- Kalita, K.; Pal, S.; Haldar, S.; Chakraborty, S. A Hybrid TOPSIS-PR-GWO Approach for Multi-objective Process Parameter Optimization. Process Integr. Optim. Sustain. 2022, 1–16. [Google Scholar] [CrossRef]
- Rubi, C.S.; Prakash, J.U. Drilling of Hybrid Aluminum Matrix Composites using Grey-Taguchi Method. INCAS Bull. 2020, 12, 167–174. [Google Scholar] [CrossRef]
- Juliyana, S.J.; Prakash, J.U. Drilling parameter optimization of metal matrix composites (LM5/ZrO2) using Taguchi Technique. Mater. Today Proc. 2020, 33, 3046–3050. [Google Scholar] [CrossRef]
- Bansod, A.V.; Patil, A.P.; Kalita, K.; Deshmukh, B.D.; Khobragade, N. Fuzzy multicriteria decision-making-based optimal Zn–Al alloy selection in corrosive environment. Int. J. Mater. Res. 2020, 111, 953–963. [Google Scholar] [CrossRef]
- Prakash, J.U.; Rubi, C.S.; Rajkumar, C.; Juliyana, S.J. Multi-objective drilling parameter optimization of hybrid metal matrix composites using grey relational analysis. Mater. Today Proc. 2020, 39, 1345–1350. [Google Scholar] [CrossRef]
- Shivakoti, I.; Kalita, K.; Kibria, G.; Sharma, A.; Pradhan, B.B.; Ghadai, R.K. Parametric analysis and multi response optimization of laser surface texturing of titanium super alloy. J. Braz. Soc. Mech. Sci. Eng. 2021, 43, 1–15. [Google Scholar] [CrossRef]
- Hassan, M.H.; Abdullah, J.; Franz, G. Multi-Objective Optimization in Single-Shot Drilling of CFRP/Al Stacks Using Customized Twist Drill. Materials 2022, 15, 1981. [Google Scholar] [CrossRef] [PubMed]
- Panchagnula, K.K.; Sharma, J.P.; Kalita, K.; Chakraborty, S. CoCoSo method-based optimization of cryogenic drilling on multi-walled carbon nanotubes reinforced composites. Int. J. Interact. Des. Manuf. (IJIDeM) 2022, 1–19. [Google Scholar] [CrossRef]
- Palanikumar, K.; Muniaraj, A. Experimental investigation and analysis of thrust force in drilling cast hybrid metal matrix (Al–15%SiC–4%graphite) composites. Measurement 2014, 53, 240–250. [Google Scholar] [CrossRef]
- Kumar, G.V.; Rao, C.S.P.; Selvaraj, N. Mechanical and Tribological Behavior of Particulate Reinforced Aluminium Metal Matrix Composites–a Review. J. Miner. Mater. Charact. Eng. 2011, 10, 59–91. [Google Scholar]
- Kalaiselvan, K.; Murugan, N.; Parameswaran, S. Production and characterization of AA6061–B4C stir cast composite. Mater. Des. 2011, 32, 4004–4009. [Google Scholar] [CrossRef]
- Prasad, B. Investigation into sliding wear performance of zinc-based alloy reinforced with SiC particles in dry and lubricated conditions. Wear 2007, 262, 262–273. [Google Scholar] [CrossRef]
- Kennedy, A. The microstructure and mechanical properties of Al-Si-B4C metal matrix composites. J. Mater. Sci. 2002, 37, 317–323. [Google Scholar] [CrossRef]
- Kalita, K.; Shivakoti, I.; Ghadai, R.K. Optimizing process parameters for laser beam micro-marking using genetic algorithm and particle swarm optimization. Mater. Manuf. Process. 2017, 32, 1101–1108. [Google Scholar] [CrossRef]
- Kalita, K.; Mallick, P.K.; Bhoi, A.; Ghadai, K. Optimizing Drilling Induced Delamination in GFRP Composites using Genetic Algorithm & Particle Swarm Optimisation. Adv. Compos. Lett. 2018, 27, 096369351802700101. [Google Scholar] [CrossRef] [Green Version]
- Ragavendran, U.; Ghadai, R.K.; Bhoi, A.K.; Ramachandran, M.; Kalita, K. Sensitivity analysis and optimization of EDM process parameters. Trans. Can. Soc. Mech. Eng. 2019, 43, 13–25. [Google Scholar] [CrossRef]
- Shivakoti, I.; Pradhan, B.B.; Diyaley, S.; Ghadai, R.K.; Kalita, K. Fuzzy TOPSIS-Based Selection of Laser Beam Micro-marking Process Parameters. Arab. J. Sci. Eng. 2017, 42, 4825–4831. [Google Scholar] [CrossRef]
- Diyaley, S.; Shilal, P.; Shivakoti, I.; Ghadai, R.K.; Kalita, K. PSI and TOPSIS Based Selection of Process Parameters in WEDM. Period. Polytech. Mech. Eng. 2017, 61, 255. [Google Scholar] [CrossRef] [Green Version]
- Shinde, D.; Öktem, H.; Kalita, K.; Chakraborty, S.; Gao, X.-Z. Optimization of Process Parameters for Friction Materials Using Multi-Criteria Decision Making: A Comparative Analysis. Processes 2021, 9, 1570. [Google Scholar] [CrossRef]
- Juliyana, S.J.; Prakash, J.U. Optimization of burr height in drilling of aluminium matrix composites (LM5/ZrO2) using Taguchi technique. Adv. Mater. Process. Technol. 2020, 1–10. [Google Scholar] [CrossRef]
- Reddy, S. Multi response Characteristics of Machining Parameters During Drilling of Alluminium 6061 alloy by Desirability Function Analysis using Taguchi Technique. Int. J. Appl. Sci. Eng. 2013, 1, 93–102. [Google Scholar]

| Constituent | Si | Cu | Fe | Mg | Mn | Ti | Ni | Zn | Al |
|---|---|---|---|---|---|---|---|---|---|
| Wt. % | 11.48 | 0.013 | 0.52 | 0.02 | 0.01 | 0.02 | 0.01 | 0.01 | Remainder |
| Level | F (mm/min) | S (rpm) | D | R % |
|---|---|---|---|---|
| 1 | 50 | 1000 | HSS | 3 |
| 2 | 100 | 2000 | Carbide | 6 |
| 3 | 150 | 3000 | TiN-Coated | 9 |
| Expt. No. | F (mm/min) | S (rpm) | D (Drill Material) | R (wt. %) | GRC of TF | GRC of SR | GRC of BH | GRG | Rank |
|---|---|---|---|---|---|---|---|---|---|
| 1 | 50 | 1000 | HSS | 3 | 0.769 | 0.355 | 0.564 | 0.563 | 18 |
| 2 | 50 | 1000 | Carbide | 6 | 0.76 | 0.518 | 0.775 | 0.684 | 11 |
| 3 | 50 | 1000 | TiN-Coated | 9 | 0.602 | 0.739 | 0.898 | 0.746 | 9 |
| 4 | 50 | 2000 | HSS | 6 | 0.649 | 0.383 | 0.623 | 0.552 | 21 |
| 5 | 50 | 2000 | Carbide | 9 | 0.587 | 0.543 | 0.975 | 0.702 | 10 |
| 6 | 50 | 2000 | TiN-Coated | 3 | 1 | 0.825 | 1 | 0.942 | 1 |
| 7 | 50 | 3000 | HSS | 9 | 0.766 | 0.447 | 0.627 | 0.613 | 14 |
| 8 | 50 | 3000 | Carbide | 3 | 0.772 | 0.992 | 0.703 | 0.822 | 5 |
| 9 | 50 | 3000 | TiN-Coated | 6 | 0.708 | 1 | 0.75 | 0.819 | 6 |
| 10 | 100 | 1000 | HSS | 3 | 0.582 | 0.349 | 0.491 | 0.474 | 26 |
| 11 | 100 | 1000 | Carbide | 6 | 0.599 | 0.505 | 0.564 | 0.556 | 20 |
| 12 | 100 | 1000 | TiN-Coated | 9 | 0.493 | 0.715 | 0.75 | 0.653 | 13 |
| 13 | 100 | 2000 | HSS | 6 | 0.561 | 0.373 | 0.603 | 0.512 | 24 |
| 14 | 100 | 2000 | Carbide | 9 | 0.565 | 0.528 | 0.683 | 0.592 | 15 |
| 15 | 100 | 2000 | TiN-Coated | 3 | 0.73 | 0.813 | 0.726 | 0.756 | 8 |
| 16 | 100 | 3000 | HSS | 9 | 0.643 | 0.438 | 0.613 | 0.565 | 17 |
| 17 | 100 | 3000 | Carbide | 3 | 0.615 | 0.958 | 0.935 | 0.836 | 2 |
| 18 | 100 | 3000 | TiN-Coated | 6 | 0.6 | 0.949 | 0.951 | 0.833 | 4 |
| 19 | 150 | 1000 | HSS | 3 | 0.478 | 0.333 | 0.333 | 0.381 | 27 |
| 20 | 150 | 1000 | Carbide | 6 | 0.557 | 0.471 | 0.594 | 0.541 | 22 |
| 21 | 150 | 1000 | TiN-Coated | 9 | 0.333 | 0.649 | 0.703 | 0.562 | 19 |
| 22 | 150 | 2000 | HSS | 6 | 0.511 | 0.368 | 0.594 | 0.491 | 25 |
| 23 | 150 | 2000 | Carbide | 9 | 0.56 | 0.494 | 0.644 | 0.566 | 16 |
| 24 | 150 | 2000 | TiN-Coated | 3 | 0.594 | 0.71 | 0.741 | 0.682 | 12 |
| 25 | 150 | 3000 | HSS | 9 | 0.572 | 0.413 | 0.594 | 0.526 | 23 |
| 26 | 150 | 3000 | Carbide | 3 | 0.592 | 0.838 | 0.898 | 0.776 | 7 |
| 27 | 150 | 3000 | TiN-Coated | 6 | 0.672 | 0.896 | 0.935 | 0.834 | 3 |
| Source of Variation | DoF | SS | MS | F | p | Contribution (%) |
|---|---|---|---|---|---|---|
| Feed Rate (F) | 2 | 0.066 | 0.033 | 16.84 | 0.00 | 12.92 |
| Spindle Speed (S) | 2 | 0.120 | 0.060 | 30.37 | 0.00 | 23.29 |
| Drill Material (D) | 2 | 0.265 | 0.132 | 67.07 | 0.00 | 51.44 |
| Reinforcement Percentage (R) | 2 | 0.028 | 0.014 | 7.1 | 0.01 | 5.45 |
| Pooled Error | 18 | 0.036 | 0.002 | 6.90 | ||
| Total | 26 | 0.514 | 100.00 |
| Level | F | S | D | R |
|---|---|---|---|---|
| 1 | 0.7159 | 0.5733 | 0.5197 | 0.6924 |
| 2 | 0.6419 | 0.6439 | 0.675 | 0.6469 |
| 3 | 0.5954 | 0.736 | 0.7586 | 0.6139 |
| Delta | 0.1204 | 0.1627 | 0.2389 | 0.0786 |
| Rank | 3 | 2 | 1 | 4 |
Publisher’s Note: MDPI stays neutral with regard to jurisdictional claims in published maps and institutional affiliations. |
© 2022 by the authors. Licensee MDPI, Basel, Switzerland. This article is an open access article distributed under the terms and conditions of the Creative Commons Attribution (CC BY) license (https://creativecommons.org/licenses/by/4.0/).
Share and Cite
Rubi, C.S.; Prakash, J.U.; Čep, R.; Elangovan, M. Optimization of Process Variables in the Drilling of LM6/B4C Composites through Grey Relational Analysis. Materials 2022, 15, 4860. https://doi.org/10.3390/ma15144860
Rubi CS, Prakash JU, Čep R, Elangovan M. Optimization of Process Variables in the Drilling of LM6/B4C Composites through Grey Relational Analysis. Materials. 2022; 15(14):4860. https://doi.org/10.3390/ma15144860
Chicago/Turabian StyleRubi, C. Sarala, J. Udaya Prakash, Robert Čep, and Muniyandy Elangovan. 2022. "Optimization of Process Variables in the Drilling of LM6/B4C Composites through Grey Relational Analysis" Materials 15, no. 14: 4860. https://doi.org/10.3390/ma15144860