1. Introduction
The uncertain hazards that are present during the construction process are referred to as risk factors. To ensure the efficient completion of construction projects, project managers generally implement a risk control mechanism. A risk control mechanism encompasses risk identification, risk assessment, and risk management. Project managers apply various methods to identify the relationship between risks and project quality (risk identification), quantify the harmfulness of risk factors (risk assessment), and manage major risk factors (risk management) through measures such as reinforcing the inspection of major risk factors. Risk managements play a key role in the success of construction projects. A lack of risk identification and evaluation might result in insufficient risk management, which considerably hinders the appropriate use of project resources [
1]. Poor resource balancing often results in the risk of resource conflict in project management [
2]. Zavadskas et al. [
3] reported that construction risks originate from different construction companies and construction sites and thus are multisource risks. Zhi [
4] divided construction project risks according to their sources into internal and external risks. Internal risks refer to major variables in a construction project related to the local market or local construction industry. External risks refer to uncertain variables in a construction project related to the company undertaking the project and the characteristics of the project. Given the effect of construction risks on project duration, quality, and budgeting, construction project managers must thoroughly understand the risks involved in and characteristics of a construction project [
5].
Studies have mainly conducted literature reviews, questionnaire surveys, and expert interviews to identify construction risk factors. El-Sayegh and Mansour [
6] performed a detailed review of the literature to identify 33 risks related to construction projects and devised a questionnaire to collect expert opinions on the probabilities and effects associated with these risks. Rostami and Oduoza [
1] conducted semistructured interviews and identified 10 key construction project risks, including delays in payments, client variations, design variations, inaccurate cost estimates, and tight project schedules. Wu et al. [
7] reviewed the literature and conducted a questionnaire survey to identify 12 key risk factors in the construction of underground metro stations. Viswanathan and Jha [
8] referenced the opinions of experts who possessed abundant knowledge on international construction projects and used factor analysis to determine concrete risk factors. Ji et al. [
9] invited experts to an on-site seminar to identify 20 key construction risks and divided the identified risks into personnel, device, material, environment, and supervision.
For complicated and uncertain large-scale construction projects, information from various dimensions and subsystems is recorded during the construction process to mitigate risks [
10]. The analysis of risk incidents is highly dependent on the quality of records; problems in recording and heterogeneity in incident data might result in conflicts when analyzing the relationship between attributes [
11]. Because all the aforementioned studies adopted a short data collection period, they failed to analyze systematic risks. Moreover, some of these studies obtained data through literature reviews, which resulted in inconsistent research designs for investigating risk factors. Furthermore, the questionnaires administered to the research participants in the relevant aforementioned studies were vulnerable to subjective interpretation. To overcome the aforementioned disadvantages, 948 construction auditing records from 1993 to 2020 were collected for analysis in the present study. These records were established according to the inspection guidelines developed by the Taiwanese government (Public Construction Commission, Executive Yuan) to reduce construction risks and improve construction quality. These guidelines require experts and scholars to visit construction sites and perform construction inspections by using a formal inspection form. The inspection standards are consistent and objective. At the time of writing this paper, the construction inspection guidelines in Taiwan have been in place for more than 20 years and have facilitated the accumulation of considerable construction-related data, which can indicate construction risks and quality. Therefore, in-depth research should be conducted on the relationship between construction risks and quality by using construction inspection data. The results of such research might act as a reference for devising construction risk management strategies.
In the design and analysis of risk models, the workload and difficulty increase exponentially when a higher number of risks is involved. Thus, the complexity of the corresponding expert searching process increases, and the created models are not applicable to real situations [
12]. In this study, construction inspection data comprise information on 499 variables. Multicollinearity problems might exist between these variables, which increases their evaluation difficulty. Moreover, when correlation exists between variables, analyses of these variables often contain redundant information. Consequently, variables in the same dimension have an excessively high weight or correlated variables are repeatedly used, which causes illogical evaluation results to be obtained. Therefore, developing performance indicators and establishing a prioritization framework can help managers focus on the key components of management and more effectively allocate limited resources within their organizations [
13]. In the present study, construction inspection variables were divided into five risk dimensions, namely the owner and supervisory unit dimension, contractor and labor dimension, material and equipment dimension, construction defects dimension, and relevant risks dimension. Subsequently, a questionnaire survey was performed among personnel working in construction-related fields to identify 19 major risk factors. A hybrid analytic hierarchy process (AHP)–artificial neural network (ANN) model was then employed to predict the relationship between the major risks and the quality of construction projects in Taiwan. Big data on construction can be used to train the aforementioned model, which can identify major construction risks and compile association rules from complex data rapidly and automatically. The proposed AHP–ANN method is exploratory in nature and can be used to determine useful prediction models.
Most early studies on construction risks used traditional investigative statistics or multivariate techniques for analysis; however, these approaches cannot be used for effectively analyzing the multidimensional data and dynamic characteristics of construction projects. Thus, machine learning techniques were used in later studies to analyze the risk characteristics of numerous construction projects. These characteristics were subsequently used for implementing effective risk management strategies. Machine learning techniques transcend the framework of statistical analysis and enable sample-based analysis to be replaced with big-data-based or population-based analysis for examining correlations, trends, or models that were previously difficult to investigate; thus, these techniques have high application value. Big data are difficult to analyze using traditional data processing techniques. Machine learning is used to design a model to learn trends. It involves making predictions on the basis of properties learned from training data [
14]. Only complicated models or models with high expressive power can be used to acquire abundant information contained in massive data [
15]. In addition, the type of machine learning method suitable for analyzing the collected data depends on the characteristics of the problem of interest. Different machine learning techniques are suitable for processing different types of data; an “absolutely perfect” machine learning method does not exist. Furthermore, machine learning is generally combined with other techniques to solve complicated problems and process massive amounts of data.
The AHP systematizes complex problems through a hierarchical structure. It divides decision-making elements into multiple dimensions; hierarchically decomposes and structures a problem from multiple dimensions to divide a large, complex problem into multiple small subproblems; and assesses these subproblems individually. This process simplifies the decision-making process for complex problems. In contrast to the multi-criteria decision-making component of the Simple Multi-Attribute Rating Technique (SMART), which adopts a direct rating model, the AHP constructs a pairwise comparison matrix by conducting a pairwise comparison of attributes to determine the weights between criteria. The SMART only evaluates a single attribute, whereas the AHP conducts a pairwise comparison to provide decision makers with a basis for comparing and improving the validity of their models and decisions through consistency tests.
In this study, the AHP was used to compute the weights of major risk factors, and an ANN was used to predict the relationships between major risks and the quality of Taiwanese construction projects. The AHP is the most complete and flexible technique for implementing qualitative risk management for construction projects [
16]. An ANN is a machine learning method that can overcome the disadvantages of statistic tools, namely their inability to be used for automatic data mining. The integrated AHP–ANN model developed in this study incorporates the advantages of the AHP and an ANN. This model can be used to devise construction risk management strategies and prevent risk occurrence, thereby improving project quality. Moreover, employing multiple methods (Delphi and AHP approaches) can overcome the limitations of a single methodology [
17]. Hybrid decision science methods (ANP and quality function deployment) were integrated to improve the ability to consider relationships among the critical factors and their impact [
18]. Although the technique for combining the AHP and an ANN has been used in other studies, it is rarely used to predict construction risks and project quality. The present study can fill this gap and provide an alternate project management model for the construction industry. In this study, standard construction inspection data collected by the Taiwanese government were used to identify the risks influencing project quality. The integrated AHP–ANN model can rapidly and effectively evaluate construction risks, thereby providing alternative solutions and preventive strategies for construction problems.
Since the implementation of the Public Works Construction Quality Auditing Mechanism in 1993, considerable data on construction quality auditing have been collected in Taiwan. Given that construction risks influence project management performance and construction quality, the relationship between the importance of risk factors and construction quality is worthy of examination. The developed model can serve as a powerful tool for project managers to perform systematic evaluations and to mitigate major risks in construction. Machine learning models can be predictive or descriptive. The developed model can be used to obtain knowledge from data and acquire prediction results to enable project managers to devise suitable risk mitigation strategies that can reinforce risk management strategies and effectively improve construction project quality.
2. Literature Review
Machine learning is a powerful method for extracting information from big data and developing prediction models [
14]. In machine learning, features are extracted for executing specific operations, including classification, regression, and clustering [
19]. Machine learning can be used to mine big data and obtain various patterns [
20], including association-, classification-, prediction-, clustering-, estimation-, and sequence-related patterns. In particular, an ANN can perform classification and prediction. In classification tasks, an ANN uses induction training sets to identify the relationship between a “target” and a “label.” These training sets comprise known target–label sets, and an ANN first identifies the relationship between a target and a label before generalizing the labels of unlabeled targets to perform predictions [
21]. In summary, machine learning involves learning a set of rules from instances (i.e., examples in a training set). These rules can then be used to create a classifier for classifying new instances [
22].
Machine learning approaches are divided into supervised learning and unsupervised learning. Supervised learning involves learning with a labeled training data set to create a classification or regression model, which can be used to predict unknown labels. A specific feature of a sample is input into the model, which then outputs the label corresponding to the sample. In unsupervised learning, the input sample does not need to be labeled; the learning algorithm makes predictions according to the features learned from the sample. Moreover, the training process does not require labeled training data, and the developed learning algorithm can automatically cluster input data. Because labeled training data are not required in unsupervised learning, this method is suitable for determining the optimal eigenvector for data classification [
23]. In recent years, machine learning has been successfully applied in many engineering fields; however, this method requires a considerable amount of labeled data [
15].
The objective of supervised learning is to establish a model or a function for accurately predicting uncertain outputs of future instances [
14]. Supervised learning models are divided into classification and regression models. Classification models are used when the output is discrete, whereas regression models are used when the output is continuous. Both models are used for predicting, classifying, and identifying unknown data. Classification algorithms include decision tree, Naïve Bayes classifiers, Bayesian networks, and logistic regression; regression algorithms include linear regression, K-nearest neighbor, and AdaBoost. Depending on the desired type of data output, ANNs, support vector machine (SVM), random forest, and classification and regression tree (CART) can be used to execute classification or regression models. Unsupervised learning tasks include clustering and association rule mining, and common unsupervised learning algorithms include the K-means and Apriori algorithms.
Numerous scholars have applied machine learning algorithms in studies on construction projects. Gondia et al. [
24] used decision tree and Naïve Bayes classifiers to predict the delay risks of a construction project. Chattapadhyay et al. [
25] applied a genetic-algorithm-based K-means clustering algorithm to identify high-risk factors and allied subrisk components from 63 risk factors for mega construction projects. Sousa and Einstein [
26] combined a geological prediction model with a construction strategy model to perform risk analysis during tunnel construction; both models were based on Bayesian networks. Fan [
27] employed a machine learning method involving association rule mining and a Bayesian network to identify the relationship between defects and their occurrence probabilities. Khalef and El-adaway [
28] used random forest to predict the risks of contractual changes to airport improvement projects. Kifokeris and Xenidis [
29] applied SVM to identify and assess a project’s risk sources. They obtained a classification model that can be used for accurately predicting a project’s constructability type. Despite being a powerful machine learning algorithm, SVM cannot always be applied to data with extreme distribution characteristics [
30].
Traditional machine learning techniques cannot provide accurate predictions for data with high volatility and uncertainty [
31]. An ANN model can be used to construct nonlinear variable models for effectively solving problems with random variables and predicting complex and highly nonlinear functions. ANNs are suitable for processing incomplete or noisy data and solving highly complex and uncertain problems through decision making based on human intuition [
32]. Previously, descriptive data or sample features designed by experts were required when using machine learning in practical applications. In particular, the quality of the designed features has a crucial influence on the generalization performance of a machine learning model. However, an ANN uses neural network technology to learn specific features and complete complex learning tasks effectively.
ANNs were originally used for pattern recognition [
33]. ANNs have powerful learning ability and nonlinear fitting ability, and they have been applied in various fields as a powerful tool for solving numerical simulation problems [
34]. Adeli and Yeh [
35] performed the first study on the use of neural networks in civil and structure engineering. Subsequently, neural networks have been widely applied in civil engineering fields. Studies have used ANNs to solve construction safety problems [
11,
36], predict the costs of construction projects [
37,
38,
39], and predict the strength of concrete materials [
40,
41,
42,
43]. Because of their powerful nonlinear fitting ability, ANNs can accurately reflect nonlinear relationships. Scholars have successfully used ANNs to predict risks for construction projects [
44]. Bai et al. [
2] employed an ANN model to predict the severity of project risks. Park et al. [
45] used an ANN to assess potential risks for areas surrounding underground box structures. Jin et al. [
46] conducted sample learning and prediction by using a backpropagation neural network (BPNN) model to perform risk scores for construction projects.
3. Research Methodology
3.1. Analytic Hierarchy Process
The AHP is a multicriteria decision-making method proposed by Saaty [
47]. In the AHP, pairwise comparison is performed to generate criteria weights. Before calculating the weights, consistency index tests are conducted to determine the ranking of the criteria and select the optimal solution. In the AHP, a series of factors (criteria) that influence the target are analyzed, and pairwise comparison is performed between factors to determine the weight and decision-making priority of each problem. The results of the AHP can assist decision makers in selecting the optimal solution. The AHP can be used to process uncertain or subjective data to develop a hierarchical structure based on logical relationships. Such a structure enables decision makers to understand the relationships between each relevant factor, which allows for the analysis of additional criteria and the calculation of factor weights.
The AHP is a multiple-attribute assessment method that can be used to divide complicated problems into attributes in a hierarchy. Accordingly, a hierarchical framework can be established on the basis of decision-making objectives, which can then be used to establish the hierarchical relationships between decision-making criteria. According to the number of factors in the hierarchy, each criterion can be further divided into subcriteria. The choices for assessment are presented at the bottom of the hierarchy. Pairwise comparison is conducted to determine the relative importance of two factors on the same layer (dimension) to a specific factor on a higher layer. The importance is rated on a scale of 1–9, and pairwise comparison matrices are developed. The eigenvectors of each comparison matrix are then obtained and multiplied with the importance rating of each factor to determine the factor weights, which are subsequently used to obtain the total score of each choice.
In the AHP, interactions between factors on the same layer (dimension) are presented using arrows arranged in a circular form. The relationships between factor priorities must exhibit the properties of transitivity (i.e., if A is better than B and B is better than C, then A must dominate C) and strength (i.e., if A is two times better than B and B is three times better than C, then A must be six times better than C). However, given that complete transitivity between factors is rare, factors that exist intransitivity are acceptable if they pass the consistency ratio test. In the AHP, the relative importance of factors in each hierarchy is calculated to establish pairwise comparison matrices. The results of the pairwise comparison of the factors are assessed on a scale of 1–9. After assessment by experts and scholars, the comparison results for the importance of each factor are presented in the pairwise comparison matrix A, which is expressed as follows:
where
aij =
wi/
wj, and
wi and
wj represent the weights of
i factor and
j factor, respectively. Given that
aij = 1/
aji, A is considered a positive reciprocal matrix. If all pairwise comparison values exhibit transitivity, then A is considered a consistent matrix. After establishing the pairwise comparison matrix, numerical analysis is conducted using eigenvalue solutions to obtain the eigenvector of this matrix. According to the theory of numerical analysis, if A is an
n ×
n consistent matrix, the relationship between the eigenvector (X) and eigenvalue (
λ) of matrix A can be expressed as presented in Equation (2). Equation (3) is obtained through the transposition of Equation (2).
When the eigenvector (X) is a nonzero vector, then det(A −
λI) = 0. By solving this determinant, the
n eigenvalues (
λ) in matrix A are obtained. Let W be the weight vector of the
n attributes; thus, W = [
w1,
w2, …,
wn]
T. The vector product of matrix A and the weight vector W is obtained using Equation (4). Saaty [
44] suggested inputting matrix A to obtain the maximum eigenvalue (
λmax); therefore, AW =
λmaxW. The parameter
λmax is obtained using Equation (5).
Because of the different levels of importance in each layer, an examination should be conducted regarding whether the layer structures exhibit consistency to ensure that the decision maker’s evaluations remain consistent. In consistency testing, a consistency index (CI) is used for evaluating the overall consistency of pairwise comparison matrices. A CI of less than 0.1 indicates that the results are not completely consistent but are still within the acceptable error range. The CI is expressed in Equation (6), in which
λmax represents the maximum eigenvalue of matrix A, and n represents the order of the matrix. For complicated problems involving additional pairwise comparisons, the order of the pairwise comparison matrix is increased, which increases the difficulty of determining consistency. To account for the differences in the CI of different orders, Saaty [
47] proposed the calculation of the consistency ratio (CR) by using the CI and random index (RI;
Table 1) The CR is calculated as follows: CR = CI/RI. When the CR is less than 0.1, the matrix is considered consistent.
3.2. ANN-Based Machine Learning
ANNs are network structures composed of connected artificial neurons. By modifying the weights of the connections between artificial neurons, decision makers can simulate scenarios according to their perception and judgment. The output of each neuron is obtained using Equation (7), in which
xi represents the input value,
wi represents the weight of the neuron connection,
bi represents the bias, and
yi represents the output value. By transferring the principles of biological neural networks to ANNs, scientists have enabled the use of advanced mathematical and statistical calculations to solve complex problems. ANNs can obtain information from the external environment. By using network structures and learning algorithms to train ANNs, decision makers can control the output to obtain the desired outcome.
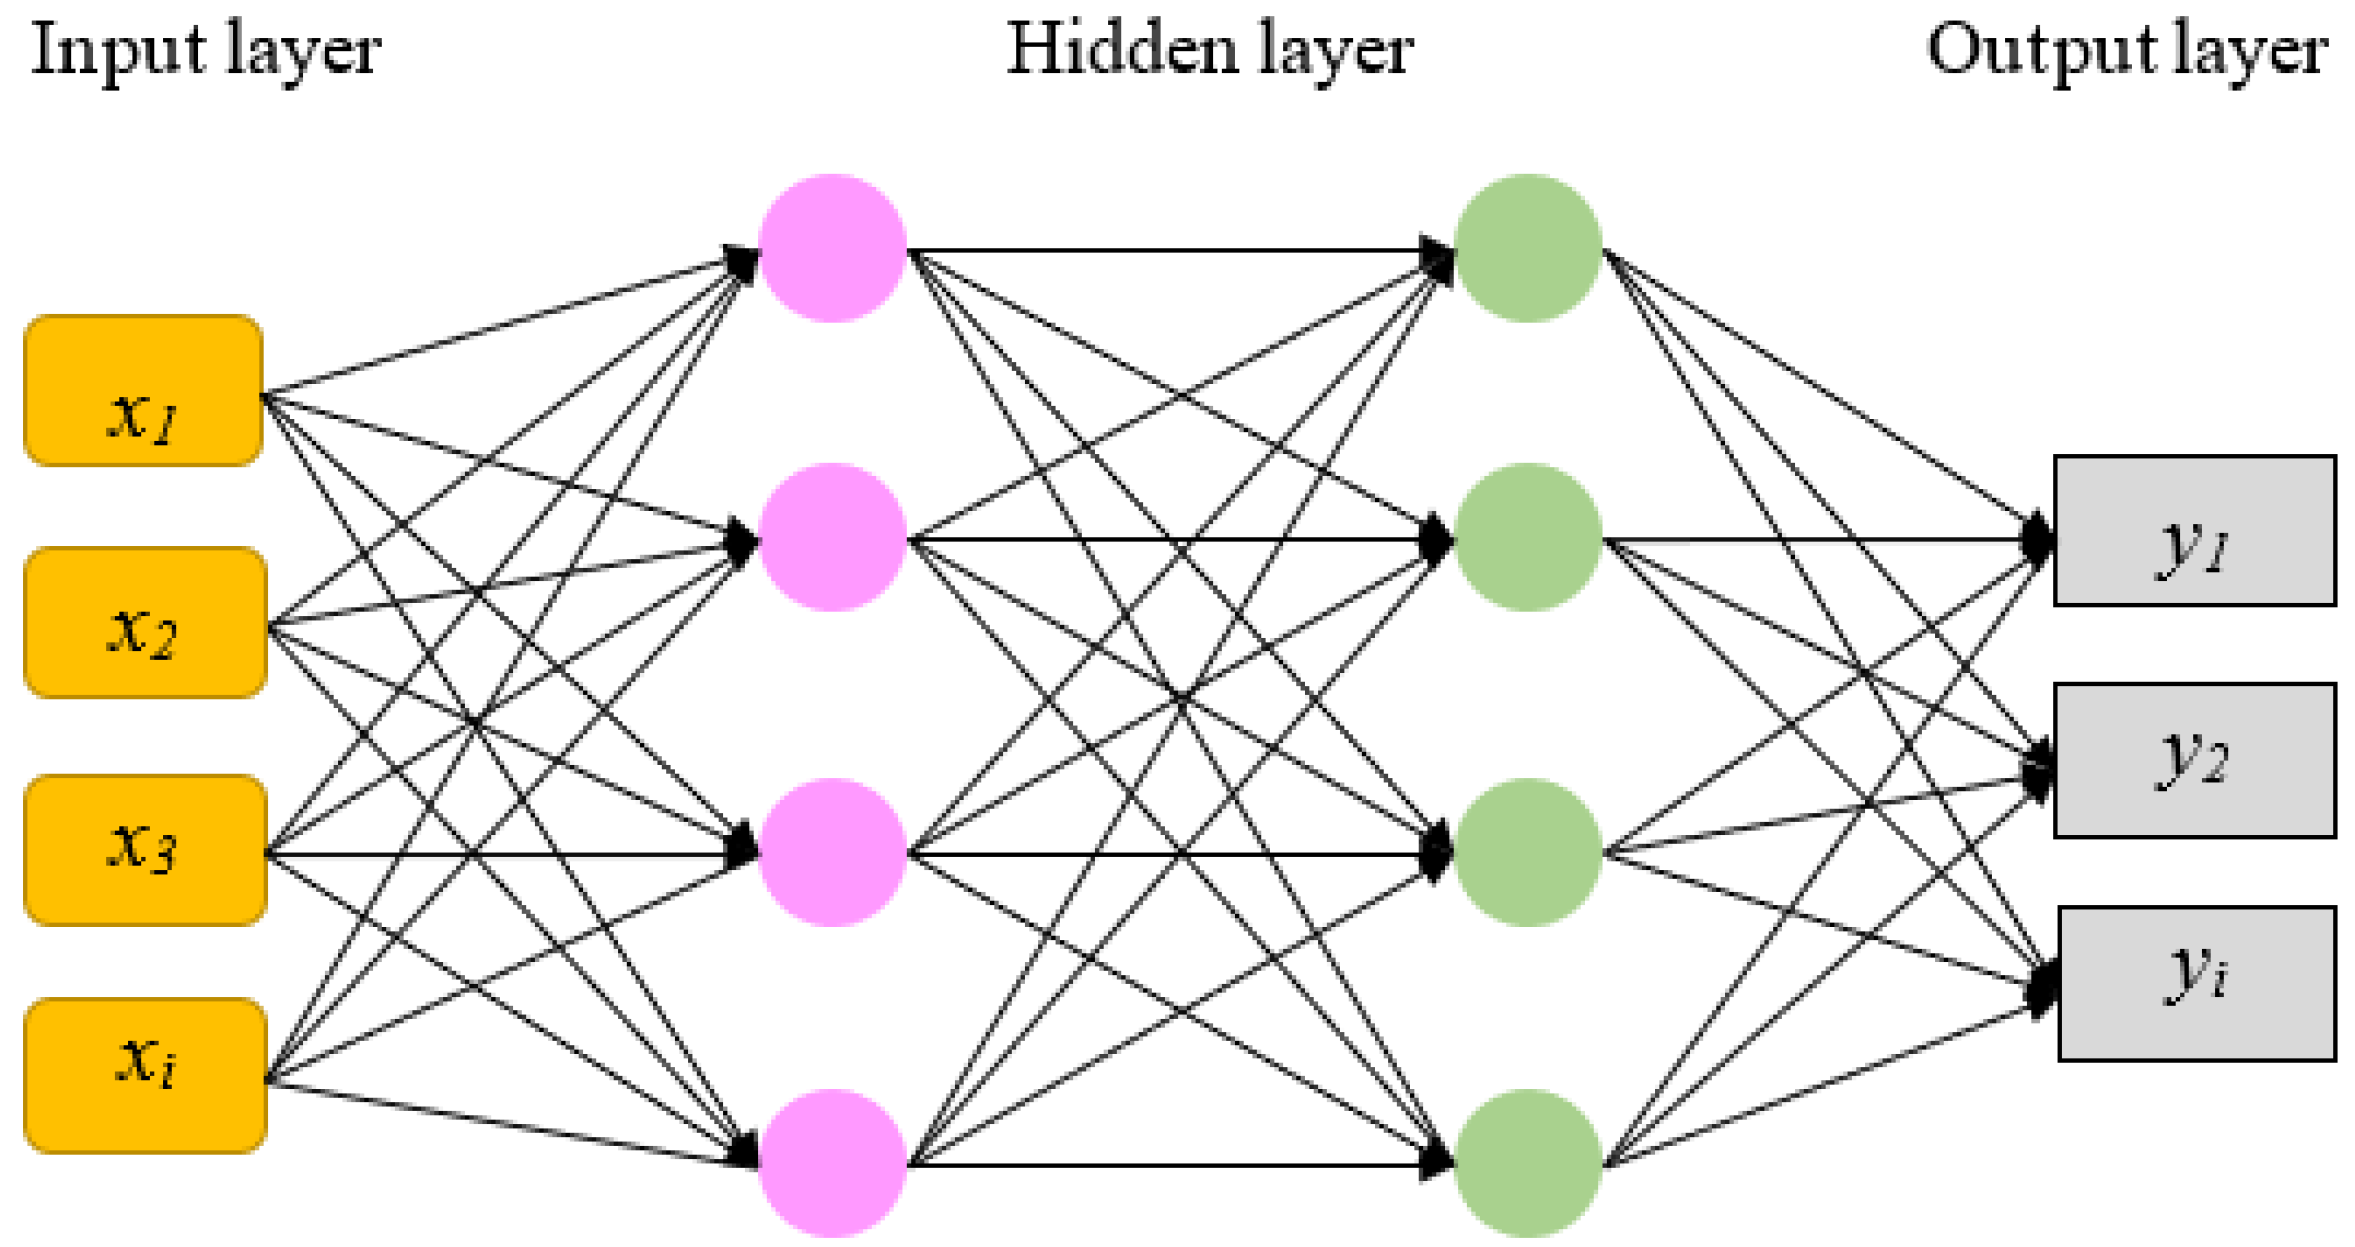
ANNs comprise an input layer, hidden layers, and an output layer (
Figure 1). The input layer receives data from the external environment and converts the input data into suitable network signals according to the characteristics of the problem. Each neuron in the input layer only receives one input variable, which is then passed to the neuron in the next layer. The number of neurons in the input layer is equal to the number of input variables received. The hidden layers, which are located between the input and output layers, serve as an internal structure where interactions occur for solving nonlinear problems. The number of hidden layers and the numbers of neurons in these layers are fixed and can be freely adjusted according to the data complexity. The use of a higher number of hidden layers results in a longer computation time, during which local optimization might occur, which causes overfitting. When fewer neurons cannot be used for processing complicated problems, the output layer processes the data output to the external environment. The number of neurons in the output layer is determined according to the problem. In the output layer, nonlinear transfer functions are used to convert output data into output signals, which serve as a reference for predicting possibilities.
During ANN training, the input parameters are randomly initialized, and loop computation is performed to output the training results. The training results are compared with the actual results to obtain the loss function. The input parameters are constantly updated until a minimal loss function value is achieved. After the error threshold is reached, the loop computation is stopped. An ANN training model combines backpropagation (BP) and stochastic gradient descent to minimize errors. First, BP is used to compute the weight of the connections between neurons in each layer. Second, an optimized objective function is used to determine the quality of each weight. Because BP networks have excellent nonlinear mapping capabilities, the ANN can approximate continuous functions for model learning. A study on deep neural network learning indicated that stochastic gradient descent is an effective optimization method [
48].
Nonlinear functions are used in ANNs as activation functions (e.g., the sigmoid and tanh functions) to approximate any function. Activation functions must be differentiable to enable the computation of the partial derivative of the loss function with respect to the weights when using BP to update the gradient. Basically, a two-layer neural network can approximate most functions. In ANN training, the input (
xi), weight (
wi), and bias (
bi) are used to calculate the weighted sum of each neuron. Therefore, the parameters of the activation function are defined as the connection weights of input layer neurons and hidden layer neurons [
49]. Commonly used ANN activation functions include the rectified linear unit (ReLU), which are expressed in Equation (8), respectively. To perform BP, a feature and a true value label are required. First, the feature is input into the neural network and processed by each hidden layer until it reaches the output layer. Subsequently, the loss function is used to compute the error between the output result and the true label. Finally, the weights and bias of the neuron connections are updated according to the error to minimize the error of the loss function (e.g., cross-entropy) and measure the per-sample training loss. The per-sample training loss is expressed in Equation (9), in which
p(
y) and
q(
ŷ) represent the true value label and the probability distributions of predicted output, respectively.
3.3. Construction Auditing Mechanisms and Data
To create an effective construction management system, the Taiwanese government established the Public Works Construction Quality Auditing Mechanism in 1993. This regulation was introduced to prevent or mitigate the various types of risks faced by personnel working in construction projects and to improve construction project quality. In accordance with the quality inspection scoring system for public buildings in Taiwan, the auditor is required to visit the construction site and perform construction inspection tasks. Subsequently, the auditor notifies the construction agency and company of the inspection results and provides the construction team with an opportunity to clarify construction methods or make improvements. Finally, an auditing committee meeting is conducted to discuss the construction defects, auditing score, and auditing grade and to determine the construction quality of the project. The results are then submitted by the construction agency to the Public Construction Management Information System (PCMIS). The auditing results might serve as a reference for contractors to improve quality management operations, for construction agencies to perform project evaluations, and for the selection of excellent construction companies. By encouraging construction supervisors to comply with quality assurance practices and ensuring that contractors perform quality assurance, the Public Works Construction Quality Auditing Mechanism achieves the goal of improving the quality of public construction in Taiwan. Systematic risk management, effective regulatory procedures, and attention to construction quality are essential in the construction process for completing the construction project within the contracted period.
In accordance with the Public Works Construction Quality Auditing Mechanism, the Taiwanese government systematically records the construction information provided by auditors on the PCMIS. Subsequently, statistical analysis is performed on the collected data, and improvement measures are proposed to improve the quality of public constructions and project management performance. In the present study, defects identified in construction auditing and auditing scores were used to divide major construction risks into five risk dimensions, namely the owner and supervisory unit dimension, contractor and labor dimension, material and equipment dimension, construction defects dimension, and relevant risks dimension. Moreover, auditing scores were calculated as the average of all auditors’ assessment scores, and the calculated auditing scores were used to determine the auditing grade. Grades A, B, C, and D represent auditing scores of 90–100, 80–89, 70–79, and below 70, respectively.
Construction auditing data comprise text and numerical records collected during the entire construction process. By using machine learning to perform data mining, data rules and data models can be extracted. These rules and models can be used to obtain useful information and knowledge for risk assessment and management. The results can provide a reference for project managers to implement suitable decision-making strategies. However, construction auditing data have a high number of dimensions and are complicated. To achieve effective data mining and analysis through machine learning, key feature variables must be identified according to the problem, and data preconditioning must be performed to eliminate errors and simplify the extracted data model. Ayhan and Tokdemir [
50] reported that to transform recorded information into big data, the problem must be inspected to the last detail to ensure that data processing is conducted correctly. The preconditioning process comprises data cleaning, data selection, and data transformation. After preconditioning is completed, a comprehensive database is established for effectively accessing, analyzing, and using data.
Data cleaning: Construction auditing data often contain errors. Data on defects and risk factors should be compiled and documented. Moreover, missing, incomplete, abnormal, outlier, inconsistent, and invalid data should be eliminated. Data selection: In accordance with the step-by-step process of machine learning algorithms, key features in the data should be selected to obtain optimal training results. Data transformation: Text data should be transformed into a binary format and discrete numerical data for ANN processing. Jafarzadeh et al. [
39] indicated that a high number of predictor variables might result in overlearning. Therefore, a screening method for selecting key factors from big data is essential for ensuring the accuracy of ANN predictions.
The PCMIS is a quality inspection scoring system for public works established by the Taiwan government in 1993. In this study, 948 construction auditing records from 1993 to 2020 were collected from the PCMIS. These records contain a total of 948 auditing scores, 499 defects items (risk factors), and 9596 defect frequencies. The experts were interviewed to identify five risk dimensions (46 risk factors) from PCMIS, and a questionnaire survey (Likert scale) was performed among personnel working in construction-related fields to identify 19 major risk factors from five risk dimensions. The four main research procedures are detailed as follows (
Figure 2):
- (1)
Evaluation based on a Likert scale: The risks extracted from the PCMIS were divided into five dimensions, namely the owner and supervisory unit dimension, contractor and labor dimension, material and equipment dimension, construction defects dimension, and relevant risks dimension. A Likert scale was used to perform a questionnaire survey, quantify the importance of each risk factor, and identify major risks in construction projects.
- (2)
AHP: The AHP was used to conduct pairwise comparison between the five risk dimensions. The Likert scale scores of the risk dimensions were used as a comparison scale to determine the weight of each risk dimension and importance of each major risk. The major risks were used as the input variable for predicting project quality, and auditing scores served as the basis for project quality predictions.
- (3)
ANN processing: An ANN with a size of 1500 × 1500 × 1 was constructed. The input layer comprised 19 input variables (major risks). The first and second hidden layers contained 1500 neurons. The output layer contained one neuron, which was used to predict the output value (probability) of the project quality. A total of 70% of the collected data were used for training, and the remaining 30% of the data were used for testing. ReLU was used as the activation function in the input layer and hidden layers, and the sigmoid function was used as the activation function in the output layer.
- (4)
Model assessment: The developed AHP–ANN model was assessed in terms of its prediction accuracy and learning loss. The results obtained with this model were used to determine the relationships between major risks and project quality.
4. Discussion
4.1. Questionnaire Analysis of Likert Scale
In this study, a questionnaire survey was conducted on the major risks encountered by personnel involved in Taiwanese construction projects by using a 5-point Likert scale (5 = “Very important”, 4 = “Important”, 3 = “Neutral”, 2 = “Low importance”, and 1 = “Not at all important”). The point range of the Likert scale can be increased to 9 points or reduced to 2 points. However, having an excessive number of scale points may increase the difficulty of completing the questionnaire for participants, and having an insufficient number of scale points may prevent the collected data from fully expressing the various degrees of participant intention. Given that 46 risk factors were rated in the questionnaire, a 5-point Likert scale was selected to ensure that the participants were not deterred from completing the questionnaire because of its lengthiness and to increase the validity of the questionnaire. The structure of the research sample for the valid questionnaire responses is described in the following text. First, with regard to occupation or the role in construction projects, 6.6%, 26.3%, 41.2% and 25.9% of the participants were project directors, construction site managers or personnel, personnel related to the construction project (planners, designers, and advisers), and project managers and supervisory personnel, respectively. Second, with regard to tenure in the construction industry, 14.0%, 29.2%, 21.4%, and 31.4% of the participants had 0–2, 2–10, 10–20, and more than 20 years of experience, respectively. Third, with regard to residential location, 26.7%, 5.8%, 66.3%, and 1.2% of the participants resided in northern Taiwan, central Taiwan, southern Taiwan, and eastern Taiwan, respectively.
The construction auditing mechanism is a top–down quality management process. The government establishes the format of the inspection form, experts conduct on-site auditing, and project-related personnel implement construction and management operations. Therefore, 46 risk factors were selected from the five risk dimensions defined by experts and researchers. To identify the major risk factors, project-related and experienced personnel were invited to participate in the questionnaire survey. This approach ensured that the survey results were consistent with actual construction practices. The questionnaire content was closely related to the participants’ professional work experience in Taiwan’s construction industry. A total of 250 questionnaires were distributed, and 243 valid responses were retrieved; thus, the valid response rate was 97.2%. The obtained sample size satisfied the following requirement of Marsh and Hau [
51]: an effective sample size should be no less than 150, and the optimal sample size is over 200. Statistical analysis of the effective samples revealed that the data had a multivariate normal distribution [
52]. The absolute values of the maximum kurtosis and maximum skewness were less than 7 and less than 2, respectively. Results indicated that each risk dimension had a reliability higher than 0.9; thus, the internal consistency coefficients (Cronbach’s α) of the dimensions were acceptable [
53]. The reliability values (
Table 2) obtained for the owner and supervisory unit dimension, contractor and labor dimension, material and equipment dimension, construction defects dimension, and relevant risks dimension were 0.98, 0.99, 0.95, 0.98, and 0.95, respectively. These results indicate that the adopted questionnaire has reliable internal consistency. The aforementioned reliability and distribution analysis results indicate that the adopted questionnaire is reasonable. Subsequently, a five-level histogram was mapped on the basis of the Likert scale scores and the 46 risk factors (
Figure 3), and the top two-fifths of the risk factors (i.e., those with a score of >994) were selected as the major risk factors.
4.2. Analysis Obtained Using the AHP
In this study, the construction auditing checklist of the PCMIS was divided into five risk dimensions. The owner and supervisory unit dimension is coded as O and contains 13 risk factors; the contractor and labor dimension is coded as C and contains 10 risk factors; the material and equipment dimension is coded as M and contains seven risk factors; the construction defects dimension is coded as D and contains nine risk factors; and the relevant risks dimension is coded as R and contains seven risk factors. A total of 19 major risks were identified for Taiwanese construction projects in this study (
Figure 4).
The aforementioned five risk dimensions were used in the AHP framework. Pairwise comparison was performed to determine the relative importance of the risk factors in terms of their mean Likert scale scores, and the maximum eigenvalues of the five risk dimensions were obtained. These eigenvalues represent the weights of the 19 major risk factors. After using Equation (10) to standardize matrix A into A’, the row mean of the standardize matrix was calculated to obtain the factor weights (W = [wi]T), as presented in Equation (11). The eigenvectors of O, C, M, D, and R were [0.1930, 0.2076, 0.1998, 0.2032, 0.1964]T. By using Equations (5) and (6), λmax was obtained to be 5.0, and the CI was determined to be 0.507 × 10⁻⁹ (<0.1); thus, the consistency requirement was met.
The weights (scores) of the risk factors were directly obtained through the Likert scale in the questionnaire. However, the relative effects between multiple factors in a given dimension were not considered. The AHP analyzed problems through a hierarchical structure and correlations, estimated the relative importance of the factors in a given layer (dimension), and conducted evaluations with a pairwise comparison matrix. In other words, two given factors in a layer were evaluated by using the factors of the previous layer as the evaluation standard for calculating the relative importance or contribution of the two factors. Because the factor weights obtained through the AHP were relative weights that ranged between 0 and 1 and add up to a sum of 1, the convergence speed and accuracy of the model could be increased when the weights were input into the ANN.
Row factors and standardization →
4.3. ANN Parameter Setting
An ANN is a method for performing supervised machine learning in which the number of neurons in each layer determines the efficiency and accuracy of model computation. Therefore, understanding the operation and principles of each network layer and variable is conducive for establishing a suitable deep neural network to obtain the desired results. The ANN constructed in this study comprised one input layer, two hidden layers, and one output layer. (1) Input layer: For the convenience of network training, the text data used for training and validation were transformed into numerical data, and the transformed data were used to represent the input features. For example, the values of each major risk factor were used as weights (eigenvalue vectors) in the AHP. The goal values were set as the auditing score ranges of the four auditing grades, and the data dimensions were set as 19 × 4 × 948 in accordance with the collected 948 auditing projects. (2) Hidden layers: The two hidden layers of the constructed network contained 1500 neurons each. A sufficient number of neurons and layers enables an ANN to approximate complicated continuous functions. ReLU was used as the activation function in both hidden layers because of its unlimited output range. Moreover, because of the high gradient descent speed, the training duration for these layers was short. (3) Output layer: The Softmax function was used as the activation function of the output layer. The construction auditing records were classified into different grades according to the corresponding auditing scores and were used to predict the auditing grade (construction project quality) for each input data point.
The learning rate affects the results of ANN learning and determines the number of parameters input per update. An excessively high or low learning rate might have adverse effects on model prediction results. If the learning rate is excessively high, the developed model might exhibit excessive deviation. Moreover, if the learning rate is excessively low, the developed model has a low convergence speed. A suitable learning rate can result in a high model training speed. The learning rate is determined in the parameter adjustment process, during which stochastic gradient descent is used to determine the optimal weight and bias combination. These parameters and functions are repeatedly tested to achieve the optimal prediction accuracy. The optimal learning rate enables the accurate updating of the derivative of stochastic gradient descent, which allows the minimal loss function to be achieved in each epoch. In this study, the Adam optimizer was used to optimize the learning parameters of the constructed ANN.
Table 3 presents the structural layers and parameters of the constructed ANN.
5. Results
5.1. The Major Risk Factors
Three major risk factors were identified in the owner and supervisory unit dimension: “O1: No records of quality auditing”, “O2: No follow-up improvement records for defects”, and “O8: Defects in quality management supervision.” This identification indicates that supervisory tasks have a crucial influence on construction risks. Seven major risk factors were identified in the contractor and labor dimension, which was the dimension with the most major risks in this study. These risks are closely related to quality planning and management. Three major risk factors were identified in the material and equipment dimension: “M1: The quality of the materials and equipment used does not meet the requirement”, “M2: The hold points for the inspection of the materials and equipment do not meet the requirements”, and “M3: Lack of random testing material and equipment.” These major risks highlight the importance of quality testing for construction materials and equipment. Next, two major risk factors were identified in the construction defects dimension: “D1: Lack of or defects in rectification and preventive measures” and “D2: Cold joints, beehives, or cavities in concrete production.” For effectively improving construction quality, construction teams must actively implement rectification and preventive measures and prevent defects in concrete production. Finally, four major risk factors were identified in the relevant risks dimension. Among these risks, “R4: Construction personnel do not use safety and protective tools” had the highest score, which indicates that construction site safety is a crucial concern of personnel involved in construction projects.
5.2. Results of ANN Prediction and Model Assessment
The collected data were divided into a training dataset and validation dataset. The training dataset was used to compute the gradient and update connection weights, and the validation dataset was used to assess errors. Training was completed when the errors for the training dataset reduced and the errors for the validation dataset increased, during which the model had the minimum error for the validation dataset. To achieve high prediction accuracy, model training was performed using the training dataset. In each iteration, the batch size of updates was 30 samples. For an ANN model, the number of epochs refers to the number of times the model processes the entire training dataset. A higher number of epochs generally results in a higher number of iterations and better model performance. The model training process involves the processing of multiple epochs of data until the model can correctly classify or predict the training data. In this study, the number of epochs was set as 100. After 100 epochs, the ANN model achieved prediction accuracies of 85.5% for the training datasets (
Figure 5). Finally, the prediction accuracy of the proposed testing set was 85%.
Similar to other supervised learning models, ANN models require large quantities of labeled data for training. In particular, ANNs must repeatedly perform training by using the same sample to determine the optimal weights. The training process is repeated until the minimum error is achieved (i.e., error between the labeled and predicted values) and an accurate classification is obtained. In this study, the categorical cross-entropy function was used to compute the training loss (learning errors) for 100 epochs. Initially, the training loss decreased rapidly, and it then stabilized by the 20th epoch. The final training loss was determined to be −1.5 in relation to the optimal value (
Figure 6).
Managers can use the proposed AHP–ANN model for accurately and rapidly extracting valuable information from big data. Thus, this model can effectively support managers in decision making. Given that machine learning is an exploratory method, the analysis direction must be determined before conducting data mining. The results of data mining might be unpredictable. However, novel and useful knowledge can be obtained through machine-learning-based training and testing, and this knowledge can be used to construct a decision-making model for construction management. The AHP–ANN method provides several advantages; it addresses various weaknesses in several dimensions and simplifies the dimensions of a considerable number of risk factors to identify the major risk factors and estimate their influence. In addition, it can decompose complex problems one by one and establish a hierarchical structure comprising five risk dimensions, enabling managers to understand the attributes of the factors that affect quality and to effectively manage the major factors. When an empirical model is derived from a large volume of data and the mathematical framework of a system is unclear such that conventional statistical methods based on appropriate assumptions cannot be applied, an ANN-based prediction model becomes useful. However, because the training and model derivation process of an ANN is a black box, the ANN is at a disadvantage because it has difficulty explaining the logical reasoning and meaning of a model in accordance with the applied parameters.
In machine learning, a large volume of historical data are used to predict future actions or outcomes. In this context, prediction involves inputting the features of known variables or factors (e.g., importance) and classifying or regressing the output results. When an unknown set of variables is input into a machine learning model, the model can calculate the probability value on the basis of past experiences and further classify its results. An advantage of an ANN is that it introduces a nonlinear function as an activation function, which can approximate any function. That is, an ANN can produce distributions that approach the distribution of known variables. In the present study, construction auditing defects (major risk factors) reported between 1993 and 2020 in Taiwan were used as input variables, and auditing scores (project quality) were used as output results. When major risk factors affect a project, the prediction model can be employed to estimate the construction quality of the project. Although the accuracy of a prediction model can be verified using known training data, the classification of a prediction can only be obtained through the actual outcome in addition to observation and verification.
6. Conclusions
To improve the quality of public construction, the Taiwanese government established a construction auditing system that implements regular auditing. Experts and researchers are employed to conduct on-site quality audits with a standardized checklist (499 defective items). For each audited project, one to three experts or researchers spend a day to identify the defects in the design, construction, and supervision of the project. Subsequently, they provide a rating on the basis of defect severity and actual construction conditions. The auditing results and identified defects are registered in the PCMIS by the construction agency. If major defects are identified in a project or a score of less than 70 is given, the relevant personnel responsible for the project are penalized or fined. The AHP–ANN model proposed in the present study was established on the basis of a large volume of training data in the PCMIS. It is suitable for the auditing of public construction projects in Taiwan. When defects (major risk factors) are identified, a prediction of project quality can be obtained by using the model. Therefore, project managers can conduct an examination with the standardized checklist and evaluate the construction quality of their projects prior to an actual government construction audit. Managers can also learn about risk factors through this model and adopt the appropriate risk management and control measures.
On the basis of construction auditing records from 1993 to 2020 obtained from the PCMIS, five risk dimensions were identified in this study. Subsequently, a questionnaire survey was performed to identify major risk factors. The AHP was then used to determine the importance of each major risk factor, and an ANN was constructed to predict the relationships between major risks and project quality. The constructed ANN model achieved prediction accuracies of 85% for the training and testing datasets. Construction managers must possess a certain understanding of construction risks and construction quality to assess construction risks reasonably, identify meaningful risk factors, and prevent major risks so that the construction project is successfully completed before the deadline.
In this study, a hybrid AHP–ANN model was developed to predict major risk factors and project quality. The characteristics of the major construction risks identified by the developed model provide a reference for risk management. The contributions of this study are described in the following text. First, auditing records from the PCMIS were used to establish five risk dimensions and determine the weights of 19 major risk factors. Construction managers can establish strategies for effectively managing or reducing construction risks according to the determined weights. Second, by using an ANN, unknown features of construction risks were identified from the collected auditing records. Project managers can find valuable patterns and trends from them. Third, an AHP–ANN model was developed to identify factors influencing construction quality from a large quantity of construction data. This model provides accurate predictions of construction quality, and its results can be used as a reference to develop decision-making strategies for construction management.
The hybrid AHP–ANN model for project quality prediction is a case-based knowledge model that is based on the body of knowledge. It makes full use of past cases or data to predict outcomes. By improving its analyses and predictions on the basis of a large volume of historical data, the model learned features from the auditing data, identified hidden rules or knowledge, and produced predictions with improved accuracy. It can be regarded as a function built on an auditing dataset that comprises features. Through the organization of decision-making elements through a hierarchical structure and the incorporation of the opinions of experts and experienced personnel, the model can clarify the relationship between major risk factors and project quality and help managers to develop solutions and countermeasures. This model can contribute to the body of knowledge for construction by continually accumulating data and inputting such data into its knowledge base.
In the present study, an ANN and construction auditing data were applied to predict construction quality outcomes; however, the selection of risk factors was dependent on experts or policymakers, which is a limitation of the study. Nevertheless, managers can still use the prediction results of the study in practical applications and improve their management through these results. Future studies should employ a deep learning model to automatically determine risk factors and adjust the weights and biases of these factors to obtain improved prediction results.


