1. Introduction
Demand for wireless services has increased exponentially since the mid-1980s when cell phones were first introduced [
1]. As of 2020, the leading indicator survey of the wireless communications industry—conducted by the Cellular Telecommunications and Internet Association (CTIA) [
2]—estimated the number of wireless subscribers in the U.S. to be about 443 million. This report also notes that the total value of the wireless industry now exceeds that of insurance, hotels, restaurants, and transportation industries combined. To that end, it is well established that present demand conditions show that more infrastructure is needed to support wireless growth.
The industry responded by greatly increasing the number of cell towers. There are over 150,000 cell towers within the U.S., which are built and managed mostly by cell tower companies—not the national cell phone carriers. Of these towers, 63% are owned by the three largest cell tower providers: American Tower, Crown Castle, and SBA Communications [
3]. The remaining towers are mostly owned by smaller, regional companies.
When faced with the challenge of evaluating proposed locations for new towers, regional cellular companies often seek guidance from national carriers, consultants, or specialized network design and optimization software, such as Atoll [
4]. A site selection process facilitated by any of the information sources mentioned above is likely to consider a plethora of criteria—which, it should be noted, can vary considerably from company to company. Still, these recommendation lists can easily have hundreds of potential sites, and—due to time and cost constraints—it is not feasible for regional cell tower companies to act on all. Since national carriers typically pay a variable monthly rate to regional cell tower companies based on throughput serviced, these cell tower companies are motivated to select the tower locations that would maximize network throughput. Throughput, measured in megabytes, is the amount of data and, to a much smaller extent, voice transmitted between the tower and cell phones.
The purpose of this paper is to not only determine relative predictors of cell tower throughput, but also to prioritize potential cell tower sites on the recommendation list for less populated areas. Recommended sites have already been vetted for topography, power, access and proximity to sensitive sites such as hospitals and schools.
The contributions of this paper are threefold. First, this study improves our understanding of how cell tower site selection decisions can be made based on throughput prediction models derived from aggregated data sources. Second, it extends the current literature on cell tower site selection in that it leverages the digital divide research to inform model creation. Third, it provides a useful template not only for carriers living in a 4G world, but also those that have expanded into 5G services, since 4G is not being replaced, but rather serving as a building block for 5G.
The remainder of this paper is organized as follows:
Section 2 provides a thematic literature review focused on the various lines of inquiry that informed our work.
Section 3 introduces our conceptual model. In
Section 4, we present the measures and exploratory analysis; this is followed by
Section 5, which describes the methodological approach of our study. In
Section 6, we present our results.
Section 7 provides a discussion of the findings. In
Section 8, we discuss the corporate implications of our research. Finally, in
Section 9 we discuss the study’s implications and make our concluding remarks.
2. Literature Review
2.1. Spatial Placement and Associated Health Concerns
Telecommunication engineers typically have three overarching goals in mind when analyzing coverage maps to determine new tower placements: expansion, capacity, and quality [
5]. These goals alone can be quite vexing but there are many other factors to consider, such as demand factors, health considerations, town ordinances, power availability, and ease of site access to name a few [
6]. With regard to addressing the problem of spatial placement, many researchers have proposed network design solutions [
7,
8,
9,
10]. Additionally, specialized software can be purchased to address some of the geographic and physical considerations including the software program Atoll. The Atoll program tends to work best in municipal areas as rural areas may be impacted by undocumented aspects of terrain, such as tree lines.
Health issues related to cellular transmissions [
11,
12,
13], especially the location of base stations, are of particular concern. Base stations, which essentially allow a network of cell towers to be interconnected, are not recommended to be located in the vicinity of hospitals and elementary schools [
14]. Some studies even explored the potential adverse health effects due to cell phone usage and non-ionizing radiation in general [
1,
15]. That being said, to date, scientific studies have shown no clear link between the invisible radio frequency emissions of cell towers and the health of humans or animals [
16].
2.2. Demand Factors Related to Cellular Transmissions
Considerable research relating to demand factors for cellular transmissions can be derived from internet mobility and digital divide studies. Mobile internet studies tend to examine individual patterns of usage and digital divide studies examine gaps in internet usage. Digital divide studies profile the population segments of internet access and the use of information and communication technologies [
17].
The most obvious indicators of cellular demand are population density for the area [
5,
18] and the concentration of businesses operating in the vicinity. The low levels of these indicators in rural areas have led to pronounced digital divides [
19]. Several government programs have addressed this divide, including the COVID-relief bill [
20]. However, even when internet services are available, many smaller businesses may not be equipped to fully exploit mobile internet [
21].
Divides may also occur due to socio-economic factors. In 2014, Gerpott and Thomas [
22] conducted a large meta-analysis of 174 past studies concerning mobile internet usage. Mobile internet was largely defined as internet accessed via smartphones. Their meta-analysis examined age, gender, education, and income. Gender was the least conclusive with an average correlation of 0.00. A small relationship was found with age, which had an average correlation of −0.14; however, its credibility interval included zero. Both education level and income had a positive impact on mobile internet usage; the average correlation was 0.18 and 0.13, respectively.
The relationship between mobile internet usage, age, and income is not always clear. Ghose and Han [
23] questioned whether a linear relationship exists between usage and age as they found an inverted U relationship. Likewise, Prince et al. [
24] suggested the same type of relationship between income and usage. They also asserted that decreased usage for lower income customers may be due to data caps.
Mobile internet usage by minorities has been difficult to ascertain. A recent Pew research survey [
25] showed no racial and ethnic differences were found when it comes to smartphone ownership. However, differences do emerge for mobile internet usage. For example, 25% of Hispanics report being “smartphone” only internet users. Similarly, Quintanilla [
26] reported that minorities tend to take advantage of hotspots more so than Whites. Minorities usually have less access to broadband services than Whites [
27].
The mobility of mobile internet and cell phone usage has also been studied. Surprisingly, most mobile usage still occurs largely at fixed locations such as home, school, work or friends’ homes [
22]. However, some studies [
28] have shown that focusing on only census tracts can be too limiting. By and large, the pattern of usage for truly mobile internet and cell phone usage can be quite complex [
28].
Given the growth in cellular transmission and the amount of resources devoted to closing the digital divide, the differences in profiles may be closing rapidly. In fact, a 2017 Deloitte [
29] survey shows the gaps closing between differences in racial or socio-economic profiles.
The authors do not know of any academic studies where researchers have predicted actual cell tower throughput based on aggregate competitive and demand factors. Yet the authors did find one study that shared some similarities, namely Prieger’s 2013 paper that sought to predict the count of cell towers, based on a limited set of predictors [
18]. The authors of the present study go beyond Prieger’s work in that our research predicts cell tower throughput and incorporates many more predictors.
Additionally, the authors identified a gap in terms of how site selection was performed by carriers. Several carriers informed us that they had not identified an informative predictive model to prioritize spatially determined tower locations. Instead they relied on the the number of complaints received in a service area. This research aims to fill the research gap noted above and improve overall cell tower site selection.
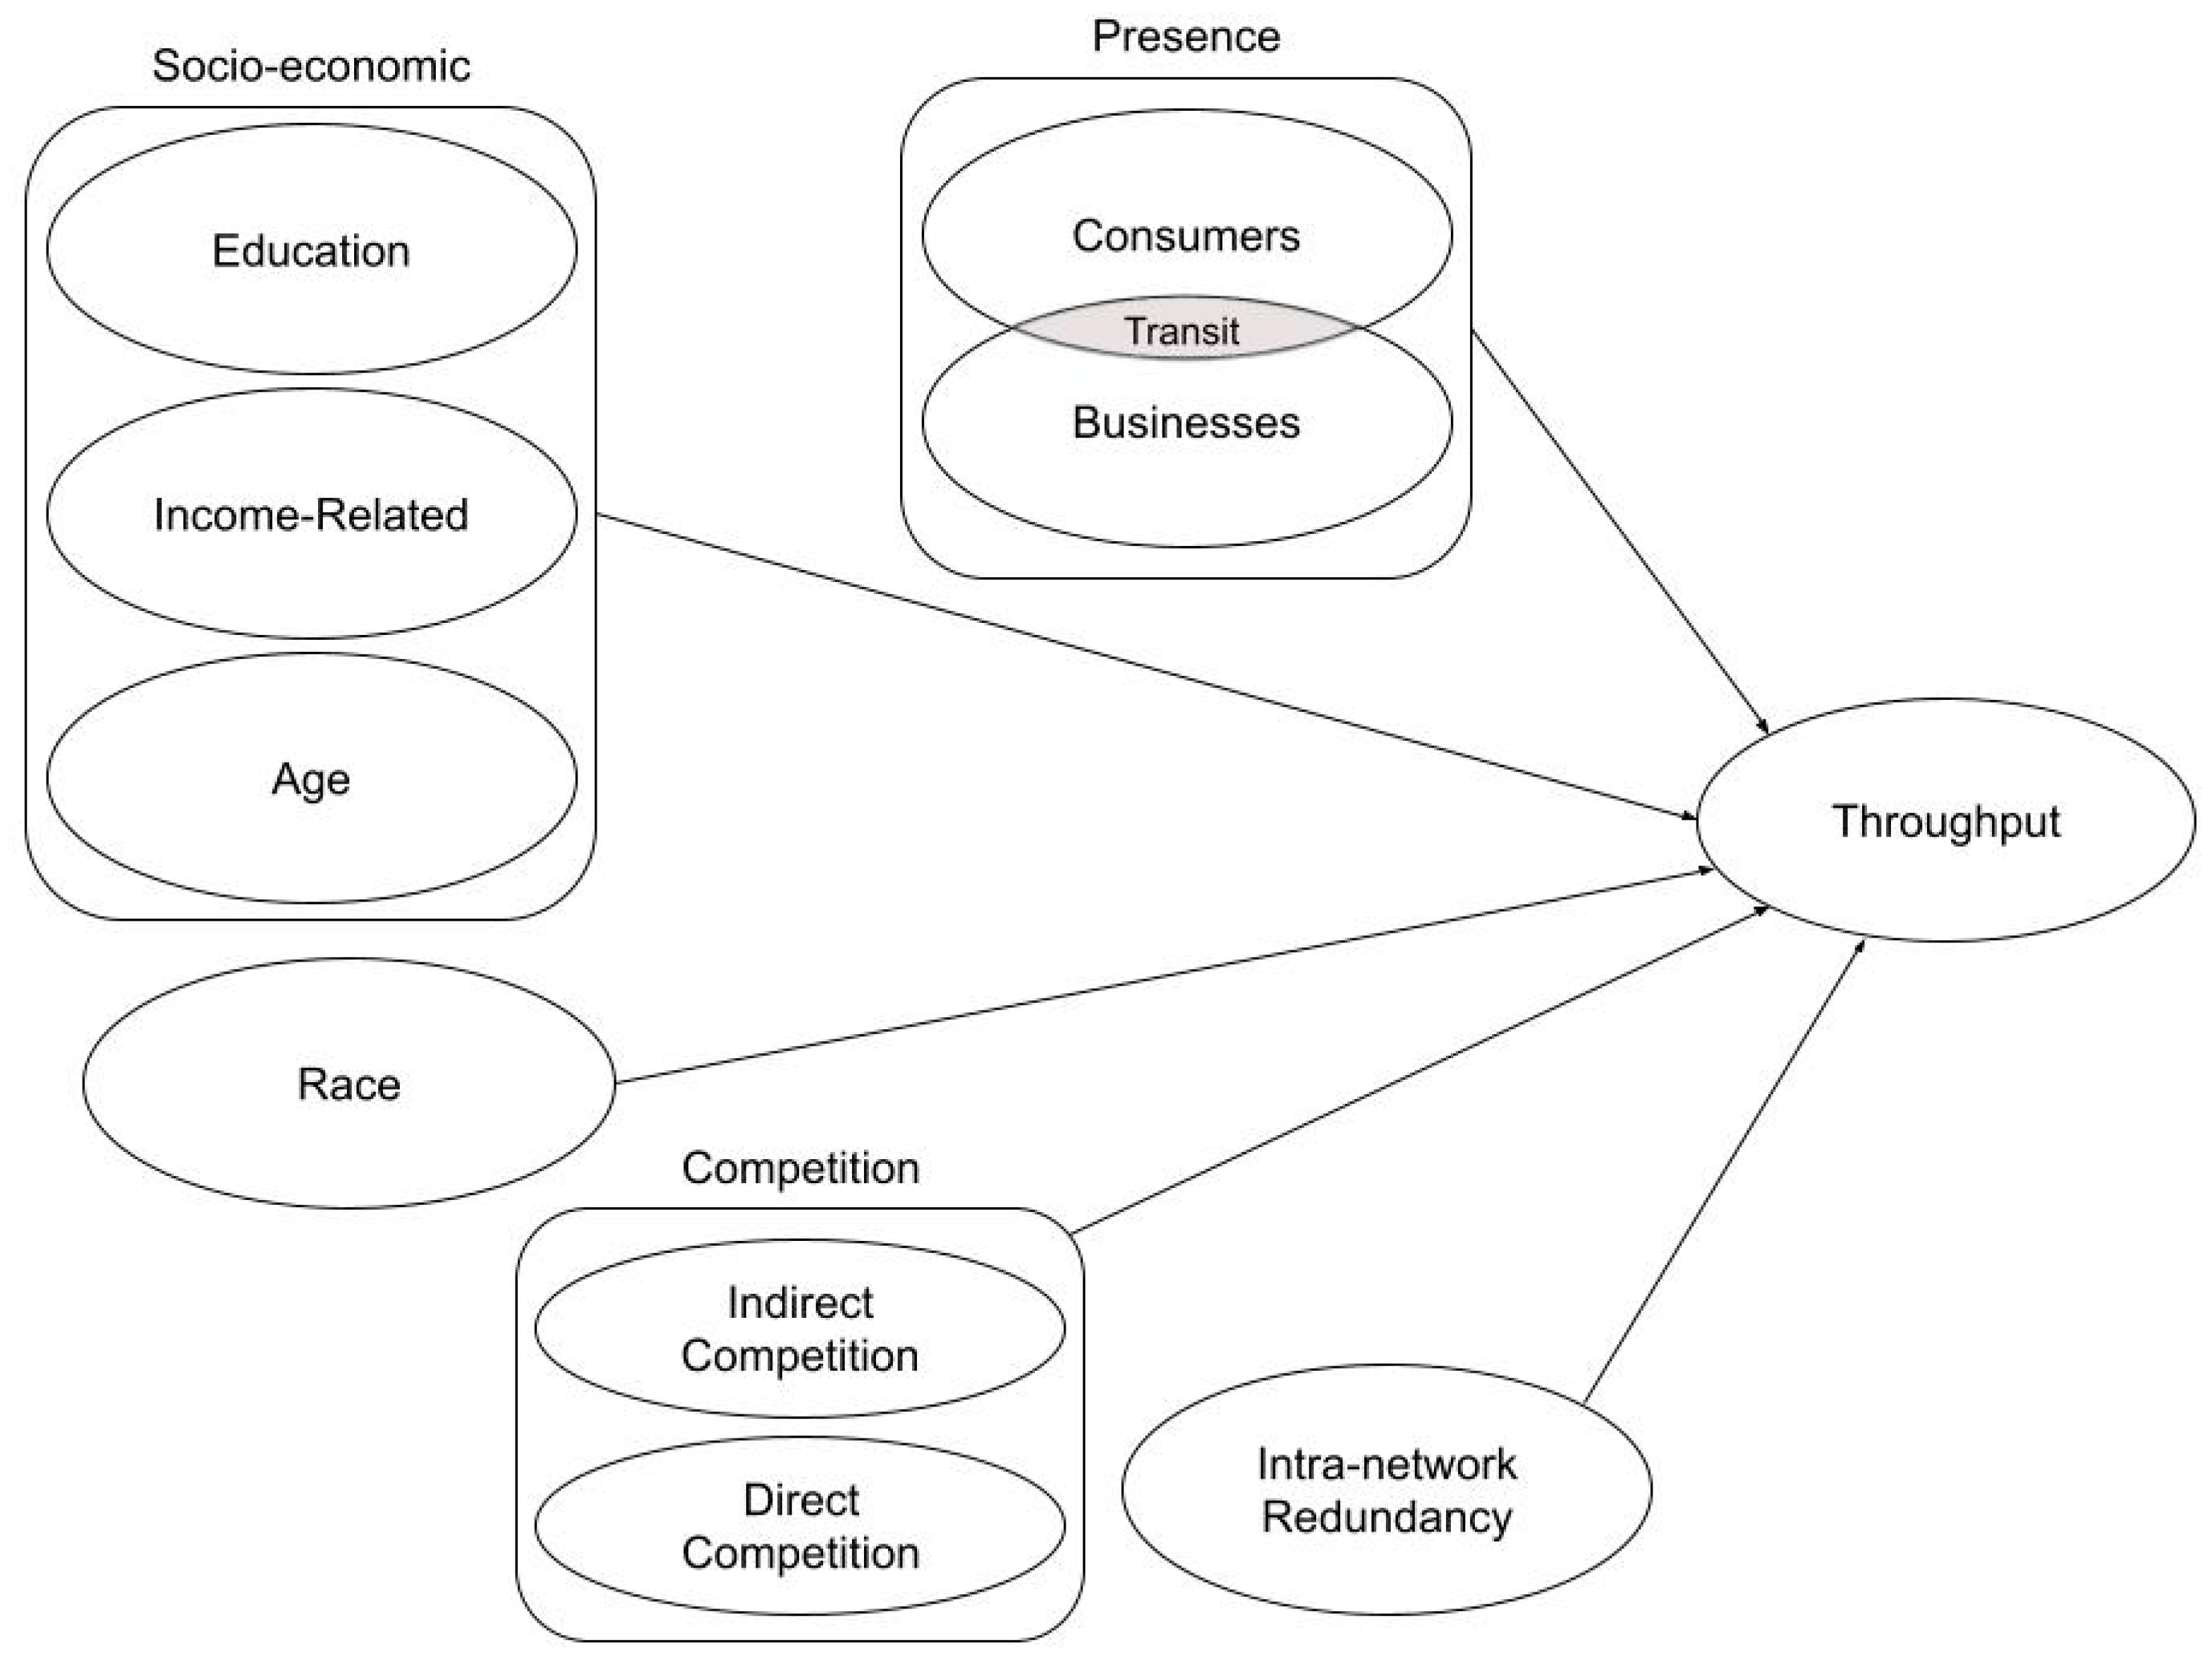
3. Conceptual Model
Given the above literature review, the conceptual framework in
Figure 1 is proposed to examine both the demand and competitive predictors of cell tower transmission. Socio-economic, race, and consumer/business presence are included as antecedents of throughput. Moreover, it should be noted that the intersection of consumer/businesses presence represents the truly mobile aspect that may occur in vehicles or by roadways. Beyond socio-economic factors, race, and consumer/business presence, our modeling framework considered two other factors: competition and intra-network reliability. Indirect competition could be Wi-Fi transmissions carried through broadband technologies such as cable, fiber, or satellite transmissions. Direct competition could be other cellular carriers that are available in the immediate vicinity of the tower. Intra-network reliability refers to the presence of a neighboring company tower meant to handle peak demand and handovers (a handover occurs when an ongoing call or data session is transferred from one channel to another channel). However, it is important to remember that such towers would cannibalize each other’s demand under normal conditions. In this study, a neighboring tower is always defined as being within a 5-mile radius of the tower, which is the approximate reach of a given tower. This is typical for rural settings, but in more metropolitan areas the distance could be less. Ultimately by considering all these factors in the modeling process, we hoped that the framework would prove to be a fairly accurate reflection of demand.
The factors used in this model are all measured at an aggregate level as unit-level data (end consumers [customers or businesses], and competitive towers) are often unavailable. As a consequence, one socio-economic variable, gender, was excluded, as there is little variation at an aggregate level. Furthermore, the average correlation between gender and usage from Gerpott and Thomas’s [
22] meta-analysis was zero. Age and income were maintained due to their non-zero correlation, as well as their potential non-linear relationships.
4. Measures and Exploratory Analysis
4.1. Regional Cell Tower Company
To implement the above model, a regional cell tower company from Wisconsin was selected, Bug Tussel Wireless (BTW, Green Bay, WI, USA). BTW’s original mission was to provide reliable broadband wireless internet connectivity to its customers, who, for the most part, live outside metropolitan areas. As the company grew, it realized that defining reliable internet connectivity required a partnership with a national cell phone carrier.
Bug Tussel, like many tower companies, was looking for ways to prioritize cell tower site recommendations. Previous reliance on subject matter experts (SMEs), internal/industry-based tools, and key performance indicators (KPIs) did not always lead to tower site selections that maximized throughput. Consequently, BTW desired a more data-directed approach that could help them visualize the problem, as well as provide them with predictive and explanatory models for site selection. The data for most predictors were derived from publicly available information sources. These predictors and their sources are explained in sufficient detail to allow study replication with other tower companies.
4.2. Potential Predictor Variables
The data used for the predictors within the framework comes from seven major sources: Wisconsin Department of Transportation, Open Cell ID, U.S. Biz Data, the U.S. Census, the Federal Communications Commission, Google Maps, and BTW.
Table 1 below shows the variable categories, the indicators, the data sources and the type of measure.
Table 1 provides more details as to how the conceptual model in
Figure 1 can be operationalized from a measurement point of view. For example, the socio-economic construct “education” can be obtained from the U.S. Census. Specifically, the census provides measures at a county level to indicate what percentage of the population has at least a college degree. For modeling purposes, the sign of the relationship between education and throughput is assumed to be positive due to its correlation, as reported in the meta-analysis study of the literature review. Likewise, all table footnotes of “1”, indicate relationships supported from past studies. Footnotes of “2” indicate proxies of cellphone demand which are all assumed to be positive. Footnotes of “3” indicate competitive media which are assumed to negatively impact throughput. Finally, footnotes of “4” indicate redundancy in the company network which is assumed to negatively impact throughput for the tower.
4.2.1. Socio-Economic
All socio-economic indicators were obtained from the U.S. Census [
30] and measured at the county level. County-level measures were chosen since cell tower customer base tends to be broader than the demographics specific to a census tract or block [
28]. Education was measured as the percentage of people who had a bachelor’s degree or higher. Income was presented as the median household income (measured in 1000 s). Age information was limited and represented as the percentage of individuals 65 or older. Education and income are assumed to be positively related to throughput while age, in this case, is assumed to be negative.
4.2.2. Race
Race information was represented as the percentage of people who identify as White-only in the U.S. Census. As observed by previous research, race is an important factor with regard to the digital divide [
27] and the use of hot spots [
26]. In Wisconsin, 87% of citizens fell into this category [
30]. The majority race is assumed to be negatively associated with throughput.
4.2.3. Competition
Competitive factors represent either the availability of other cellular services in the area or broadband services that could be used in lieu of cellular data. Knowledge of such competitive factors is highly desirable, but there can be difficulties in accessing that information. Competitive carriers usually do not disclose such information due to privacy and safety reasons (see the Stored Communications Act and Fourth Amendment of the U.S. Constitution) [
31]. Instead, it may be possible to use a proxy which is the neighboring count of cells. It should be noted that there is a difference between the number of cell towers and the number of cells. It is unlikely for a single cell tower to have just one antenna with a 360° range; rather, it is common for a single cell tower to have multiple antennas. For example, a single cell tower might have four antennas, each with a 90° range, thereby creating four unique cells, each with its own Cell ID (see
Figure 2). Towers typically have between 3 to 15 antennas per carrier [
32]. Cell IDs can be obtained from the open database: OpenCellID [
33].
An overlay of Wisconsin cell ID locations (displayed in light gray) and actual BTW tower sites (displayed in black) are shown in
Figure 3. Naturally, the darker gray areas occur near major municipal areas and along highways.
Another competitive factor is broadband access. High-speed broadband could potentially reduce cellular demand due to substitution of cellular data transmission either by direct Wi-Fi access or even Wi-Fi assist [
34]. For this study, only fast broadband services of over 100 Mbps were considered [
35] for both cable and a few qualifying satellite services. This information was obtained from the Federal Communications Commission (FCC) [
36]. Since the broadband providers self-report this information, the maximum advertised throughputs could be hard to achieve [
37].
Fiber optics was not considered due to its relative lack of availability in many of the rural areas where BTW operated. Two binary variables were created to represent whether high-speed cable or high-speed satellite services were available in the immediate area. All competitive factors are assumed to be negatively associated with throughput.
4.2.4. Network Redundancy
The number of neighboring BTW towers was calculated for each potential site. Neighboring BTW towers are mainly present to increase reliability, permit handovers, and to accommodate peak demands [
8]. Neighboring towers are assumed to be negatively associated with throughput as they can cannibalize throughput from each other.
4.2.5. Business Presence
Business presence data were derived from the U.S. Biz Data databases [
38]. U.S. Biz Data is a scrape of publicly available web pages and thus, it required a fair amount of data preparation to remove duplicates, clean, and reformat. Some fields, such as employee counts may not be populated or may represent the counts for the entire company instead of the desired location. For large businesses, employee counts were cross-checked using additional sources of information, such as the company’s website.
Ultimately the data we obtained from U.S. Biz Data were used to created two business variables. One variable simply represented the number of companies that occupied the same service area as a neighboring tower (business count). The other variable was an indicator of business size. This variable, formatted with an escalating scale, took into account the presence of small, medium, and large businesses. The levels of this indicator variable were 0 for small-sized business (i.e., companies with less than 100 employees), 1 for medium-sized business (100–499 employees), and 2 or more for large-sized business (500+ employees). In particular, the large level was incremented by one for every additional 500 employees. To that end, it is worth noting that only two large businesses took on levels beyond 2. These levels helped with handling the imprecision of employee counts and reduced the impact of small businesses.
4.2.6. Consumer Presence
Consumer presence was measured by the county population (measured in 1000s), a recreational water indicator, the mean travel time to work (MTTW) indicator, and the maximum traffic flow of neighboring roads. The latter two variables are not necessarily exclusive to consumers—that is, they could include vehicular traffic due to businesses as well. All traffic count data were measured in 1000s.
Two variables were derived from the U.S. Census [
30]: county population and MTTW. The state of Wisconsin contains 72 counties, of which BTW operates in 29. MTTW was the commute time for work, which was likely overestimated during the pandemic. Both these consumer presence variables were assumed to be positively associated with demand.
The average annual daily traffic (AADT) data was collected from the Wisconsin Department of Transportation (DOT) [
39]. AADT is estimated from roughly 3000 traffic count sites in the state of Wisconsin; however, only 300 are continuously monitored. Therefore, some AADT values may be several years old, depending on when they were last surveyed.
Figure 4 is a screenshot of the monitoring sites near the La Crosse area, which is an important market for BTW. Since neighboring highways may have several monitoring sites, it was decided to use the maximum value of all neighboring traffic count sites for each tower.
The last variable was a recreational water indicator, which was an important consideration before COVID-19, but became even more applicable during the pandemic. Since “Stay-at-Home” orders further encouraged remote working, some employees took advantage of this by working near recreational areas or in vacation homes. Wisconsin has many popular tourist destinations associated with its many lakes, which number in excess of 15,000.
To determine if a BTW tower neighbored a recreational water body, a proxy variable was created using Google Maps. That is, the map view was used to determine the number and size of neighboring bodies of water. The recreational water indicator was then coded as 0 for no recreational bodies of water and 1 if there was a single, small recreational body of water in the neighboring area. If there were several small bodies of water or a large body of water in the area, then the recreational water indicator was coded as 2. It should be further noted that the Google satellite view was also used to ensure that the bodies of water in the area were in fact recreational. For example, cranberry bogs, which are prevalent in Wisconsin, are decidedly non-recreational and therefore were excluded from the recreational water indicator.
4.2.7. COVID Trend
From the beginning of March 2020 through May 2021 at a time when “Stay-at-Home” orders were common, BTW network data showed noticeable shifts in throughput for towers in recreational areas. As a case in point,
Figure 5 shows a time series of throughput for a single tower in the Sparta recreational area from January 2019 to May 2021, with a distinct uptick in throughput after March 2020. True, there were many cell towers that experienced increased throughput at this time period, but only those near recreational areas saw such a pronounced shift.
5. Method
The first goal is to determine if a predictive model with a significant R2 can be establish as that would help management prioritize sites. The second goal is to develop an explanatory model to help management understand and informally assess sites. The latter goal also will help confirm the directionality of the relationships between predictors and cell phone usage (i.e., throughput) as noted in prior studies.
To expedite the creation of the best predictive model, a model screening feature was used in JMP Pro 16, a relatively automated modeling process. The model screening process examines numerous machine learning and statistical models that could be used for prediction of the continuous response variable. Eight models were selected by default including: decision trees, random forest, boosted tree, boosted neural network, support vector machine, multivariate regression, Lasso regression, and K-nearest neighbors (KNN). Since the models are predictive in nature and can be treated as a black box, all of the measures in
Table 1 were used.
A reduced regression model was also created for explanatory purposes. Explanatory models can be more difficult to develop due to issues such as multicollinearity; thus, it is not possible to select all variables for the final model. Four criteria were used to govern the final selection of variables into the regression model. First, a variable must have a statistically significant correlation with the dependent variable. Second, the squared correlation among the independent variables cannot be so high as to violate Klein’s rule [
40]. Third, if the inclusion of a predictor results in a sign reversal for a significant beta, the predictor was removed. Fourth, all the variable inflation factors (VIFs) should be less than 5.0 [
41].
Determining variable importance from a regression model can be challenging [
42]. A widely used family of importance measures considers the averaging of relative importance over all orderings of independent variables. Theil and Chung [
43] suggested an information theoretic measure that could be used to quantify the amount of information in an ordered set of independent variables. The information measure is calculated as log
2 (1 − R
2), which can be further decomposed to give a unique additive importance for each independent variable in bits. The bits for each of the independent variables are then converted into percentages by dividing by the sum of all bits [
44]. These percentages represent the relative importance.
6. Results
6.1. Predictive Model
In total, there were 259 towers with complete case data. The dependent variable was average monthly throughput measured in megabytes using the timespan of 1 March 2020 through 31 May 2021. A start date of 1 March 2020 was chosen, as this was when the BTW network data showed the most noticeable change in tower throughput due to the COVID-19 pandemic. However, the start date for some towers may be later if they were more recently constructed.
The model screening results with their average out-of-sample R
2 is shown in
Table 2. A five-fold cross-validation procedure was used for out-of-sample evaluation. The highest R
2 was used to select the most dominant model for predictive purposes, which was a gradient boosted neural network. The gradient boosted neural network had an average R
2 of 52.42%, while the lowest performing model, KNN, had an R
2 of 26.46%.
The R
2 values for all the folds of the dominant model (i.e., the gradient boosted neural network) are shown in
Table 3. The R
2 values range from 40.84% to 63.46% and their variation is indicative of some unique tower sites in the data, to be explained later.
The R2 for the dominant predictive model (i.e., the gradient boosted neural network; 52.42%) was quite large compared to internal existing models. For comparison purposes, the company’s current KPI, retainability, was no longer effective as it had an R2 of 2%.
6.2. Explanatory Model
The correlations between the predictors and the response variables are shown in
Table 4. Significant correlations are marked with an asterisk and variables with insignificant correlations (Percentage 65+, Percentage College, and Travel Time) are not considered for inclusion within the regression model.
Using Klein’s rule for multicollinearity, three variables were further examined: cell ID count, business count, and traffic count. The cell ID count was found to share a high correlation with both business count (0.7926) as well as traffic count (0.7630). Given this issue—plus the reality that cell ID count was not a true measure of competitive towers—the decision was made to drop this variable from consideration.
Table 5 shows the regression results for cell tower throughput using the final list of selected variables. In this table, the beta values, robust standard errors, t ratios,
p values, and variance inflation factors (VIF) are shown for each variable. The robust standard errors were used, as the model displayed heteroscedasticity with a significant Breusch–Pagan test.
All variables, except business count, satellite presence, and traffic count, are statistically significant (p < 0.05). The VIFs are relatively low with the largest value being 2.32, indicating that multicollinearity is moderate.
The summary statistics for the regression model with the PRESS value are displayed in
Table 6. The R
2 (41.85%) and adjusted R
2 (39.50%) are relatively close. The PRESS statistic has a substantive drop, which indicates some unique cell tower locations.
Three unique locations are worthy of mention (i.e., larger prediction errors), Mineral Point, La Crosse, and Merrimac. These sites were unique in that they were impacted by ordinances, topography, and tourists respectively. First, Mineral Point is listed on the National Register of Historic Places, and therefore government ordinances prevent cell towers from being built in that area [
45]. As a result, surrounding towers are utilized less efficiently, due to distance and topography. Second, the La Crosse area is known for its unique topography, characterized by large natural bluffs. These bluffs pose considerable challenges for predicting throughput as such rapid elevation changes are known to affect tower performance. Finally, the Merrimac site has a ferry that crosses Lake Wisconsin. Tourists tend to use data-intensive cell services—such as watching videos—while waiting for and/or riding the ferry. Thus, we concluded that this behavior likely caused throughput in Merrimac to differ from what might otherwise be expected in the area.
Finally, Theil and Chung’s relative importance [
43] results are shown in
Figure 6. The business indicator is the most important variable at 28.33%, followed by population (17.56%), neighboring BTW towers (14.86%), percentage White (11.91%), and recreational water (10.71%). The remaining variables were each under 6% importance with the insignificant variables being the least important.
7. Discussion
7.1. Directionality and Significance of Explanatory Variables
Of the 14 study variables we initially identified as potential predictors, all were found to have a significant correlation with throughput except travel time, percentage bachelors+, or percentage 65+. In the following paragraphs we provide additional commentary on these variables in particular.
With regard to the travel time, it should be pointed out that while travel time itself was not correlated with throughput, traffic count was. We believe that there are three points here that are worthy of further consideration. First, since “Stay-at-Home” eliminated many individuals’ need to commute, we believe that there were fewer cars on the road at the time of the study, and by extension, less demand for cell service while driving. Second, we felt it logical to assume that the more data-intensive services, such as watching videos, were less common among driving individuals/passengers than they were among stationary ones. However, that is expected to change with the advent of more driver-assisted technologies. Third, it is important to remember that only about 10% of traffic count sites in Wisconsin are continuously monitored. Therefore, this measure is somewhat limited in terms of how well it represents actual prevalence of travel.
The two socio-economic variables that did not show significant correlation with throughput were age and education. As mentioned previously, these two variables were operationally defined as the percentage of people over 65 and the percentage of people with a bachelor’s degree or higher. With regard to the age variable, we did not consider this result to be surprising, as only a small, aggregated age range was available from the census (i.e., people over 65 represented a relatively small percentage of the population). On the other hand, education’s impact on demand for cellular data service is not so easily ascertained as it is for household internet subscriptions [
46]. True, more educated households are typically more affluent, which suggests greater demand for cellular service. However, it is also known that smartphone ownership is more prevalent than desktop or laptop ownership in households with lower levels of education, which suggests the opposite.
7.2. Explanatory Regression Model and Importance Plot
Although the correlations are important, the relationships within the regression model and the importance plots provide a more explanatory picture. Population, as expected, was one of the most important variables, but it was eclipsed by the business indicator variable. That is to say, for businesses, it is not the total number of businesses neighboring a tower that is important but rather the presence of medium or large businesses. Of course, type of business is also a consideration, but that data was not readily available.
The race variable (i.e., percentage of Whites) was found to have a negative impact on throughput in the regression model. This suggests that minorities rely more on cellular data transmissions than individuals who regard themselves as White-only. This finding is in line with other studies that examined how race affects cellular demand [
26]. Ultimately, household income was the only socio-economic variable that remained in the model, and its overall importance was less than four percent. This may suggest that the digital divide regarding socio-economic factors is closing.
Another interesting finding in the regression model was that the presence of high-speed cable or satellite did not decrease throughput, as hypothesized; rather, those variables yielded a positive beta estimate. As such, it appears that locations with high-speed broadband connections do not diminish the amount of cellular data services used. The reasons for this could range from multitasking on different devices to using devices that provide “Wi-Fi Assist” [
34]. Wi-Fi Assist is designed to aid wireless connection when broadband services are not performing at optimal speeds.
8. Corporate Implications
This analysis and the process employed—especially the integration of inexpensive external data sources—has had a positive impact for BTW. In fact, the company’s Chief Executive Officer, Steve Schneider, described the operational benefits of this study as follows:
“This project was very beneficial to our company—it shows that a diligent effort to learn our business and analyze our data can provide new insights. We are planning several new projects, some of which are quite complex. However, our newly-created data analytics advisory board and our university partnership gives us confidence that we will be successful. Telecommunication is a fast-changing field, and we need data analytics to successfully navigate it.”
Beyond the obvious result of improved tower sites ranking, this research brought about the following four important changes at BTW: (1) increased involvement with medium/large business, (2) increased involvement with its national carrier, (3) increased attention paid to government proposals, and (4) increased attention paid to recreational bodies of water.
Although the tower company is not currently privy to individual customers, it is more likely to be able to determine that information for medium to large companies. As such, BTW decided that salespeople will call on such companies that neighbor a potential tower site to see if they are interested in contracting with their partner carrier.
It was also decided that BTW should partner more closely with its national carrier so that BTW can use joint marketing information and share data on site assessments. Through such collaboration it was learned that its national carrier’s site recommendations were largely governed by customer complaints. In light of this realization, BTW felt responsible for taking a more data-driven approach to site selection, especially if it wanted to increase service as a whole.
BTW was also involved in several government proposals to close the digital divide for rural communities. Specifically, BTW has been working to reduce the digital divide for rural communities, including Native American reservations. The research emphasizes the importance of cell towers for expanding mobile internet in communities with a larger minority presence. The company was exploring more ways to expand its customer access to not only cell towers but also landlines. The company had some experience with the latter, but decided that for some communities, rolling out both types of services would be beneficial as this study showed that there really is not much cannibalization between broadband and cellular data services.
The last change had to do with recreational bodies of water. It was known that some recreational bodies of water, such as Lake Wisconsin, could lead to high demand. Still, there was an air of uncertainty among BTW personnel as this demand was a bit seasonal (i.e., it diminished in winter months). This analysis, however, showed that, despite some seasonality, the recreational water indicator was more important than was originally anticipated. As a result, BTW personnel weighted this variable a little more than they did in the past.
In a more general sense, this case study provides a template for how data integration and analysis can be achieved inexpensively for other cell tower companies. While a data-driven approach is often superior, the acquisition of that data can be resource-intensive, especially if clean data is desired [
47].
9. Limitations and Conclusions
This research was based on one case study of a Midwest cell tower company that operates primarily in rural areas. Therefore, generalizations of this work should be made only with the utmost caution. Another important point to note is that the data for this study came largely from public sources, meaning that information about BTW’s individual customers, or its potential customers, remained unknown. As such, the analysis dealt with aggregated measures, which may not be able to detect underlying relationships as effectively.
The one purchase data set was U.S. Biz Data, for 49 USD. As advertised, the data does require a fair amount of cleaning. More expensive sources of data might allow researchers to better vet the number of businesses and the size of businesses near a tower.
Moreover, there are additional variables that could be examined beyond those we considered in this present study. For example, future research might take a more nuanced view of business demand by using North American Industry Classification System (NAICS) codes to ascertain industry type. Demand for cellular services may vary considerably by industry and not all medium/large businesses should be considered relevant.
Finally, the timeframe of this study overlapped with the pandemic period, and, therefore, it is possible that the importance of some variables, such as traffic count, may change as restrictions are lifted. However, we believe that many of the changes that occurred as a result of “Stay-at-Home” order are not temporary phenomena but, rather, the beginning of more permanent changes in human behavior.
This research has provided a more developed understanding of the benefits of data analytics used in the telecommunications industry. The purpose of the model was to improve the prediction of cell tower throughput as a means of evaluating new cell tower locations. To that end, this study provides regional cell tower companies with a data-driven process for prioritizing the site recommendations they receive from national carriers. In fact, the process described in this paper proved is especially valuable as the resultant approach offers an alternative to the usual internal KPI measurements, which were not strongly correlated with revenue.


