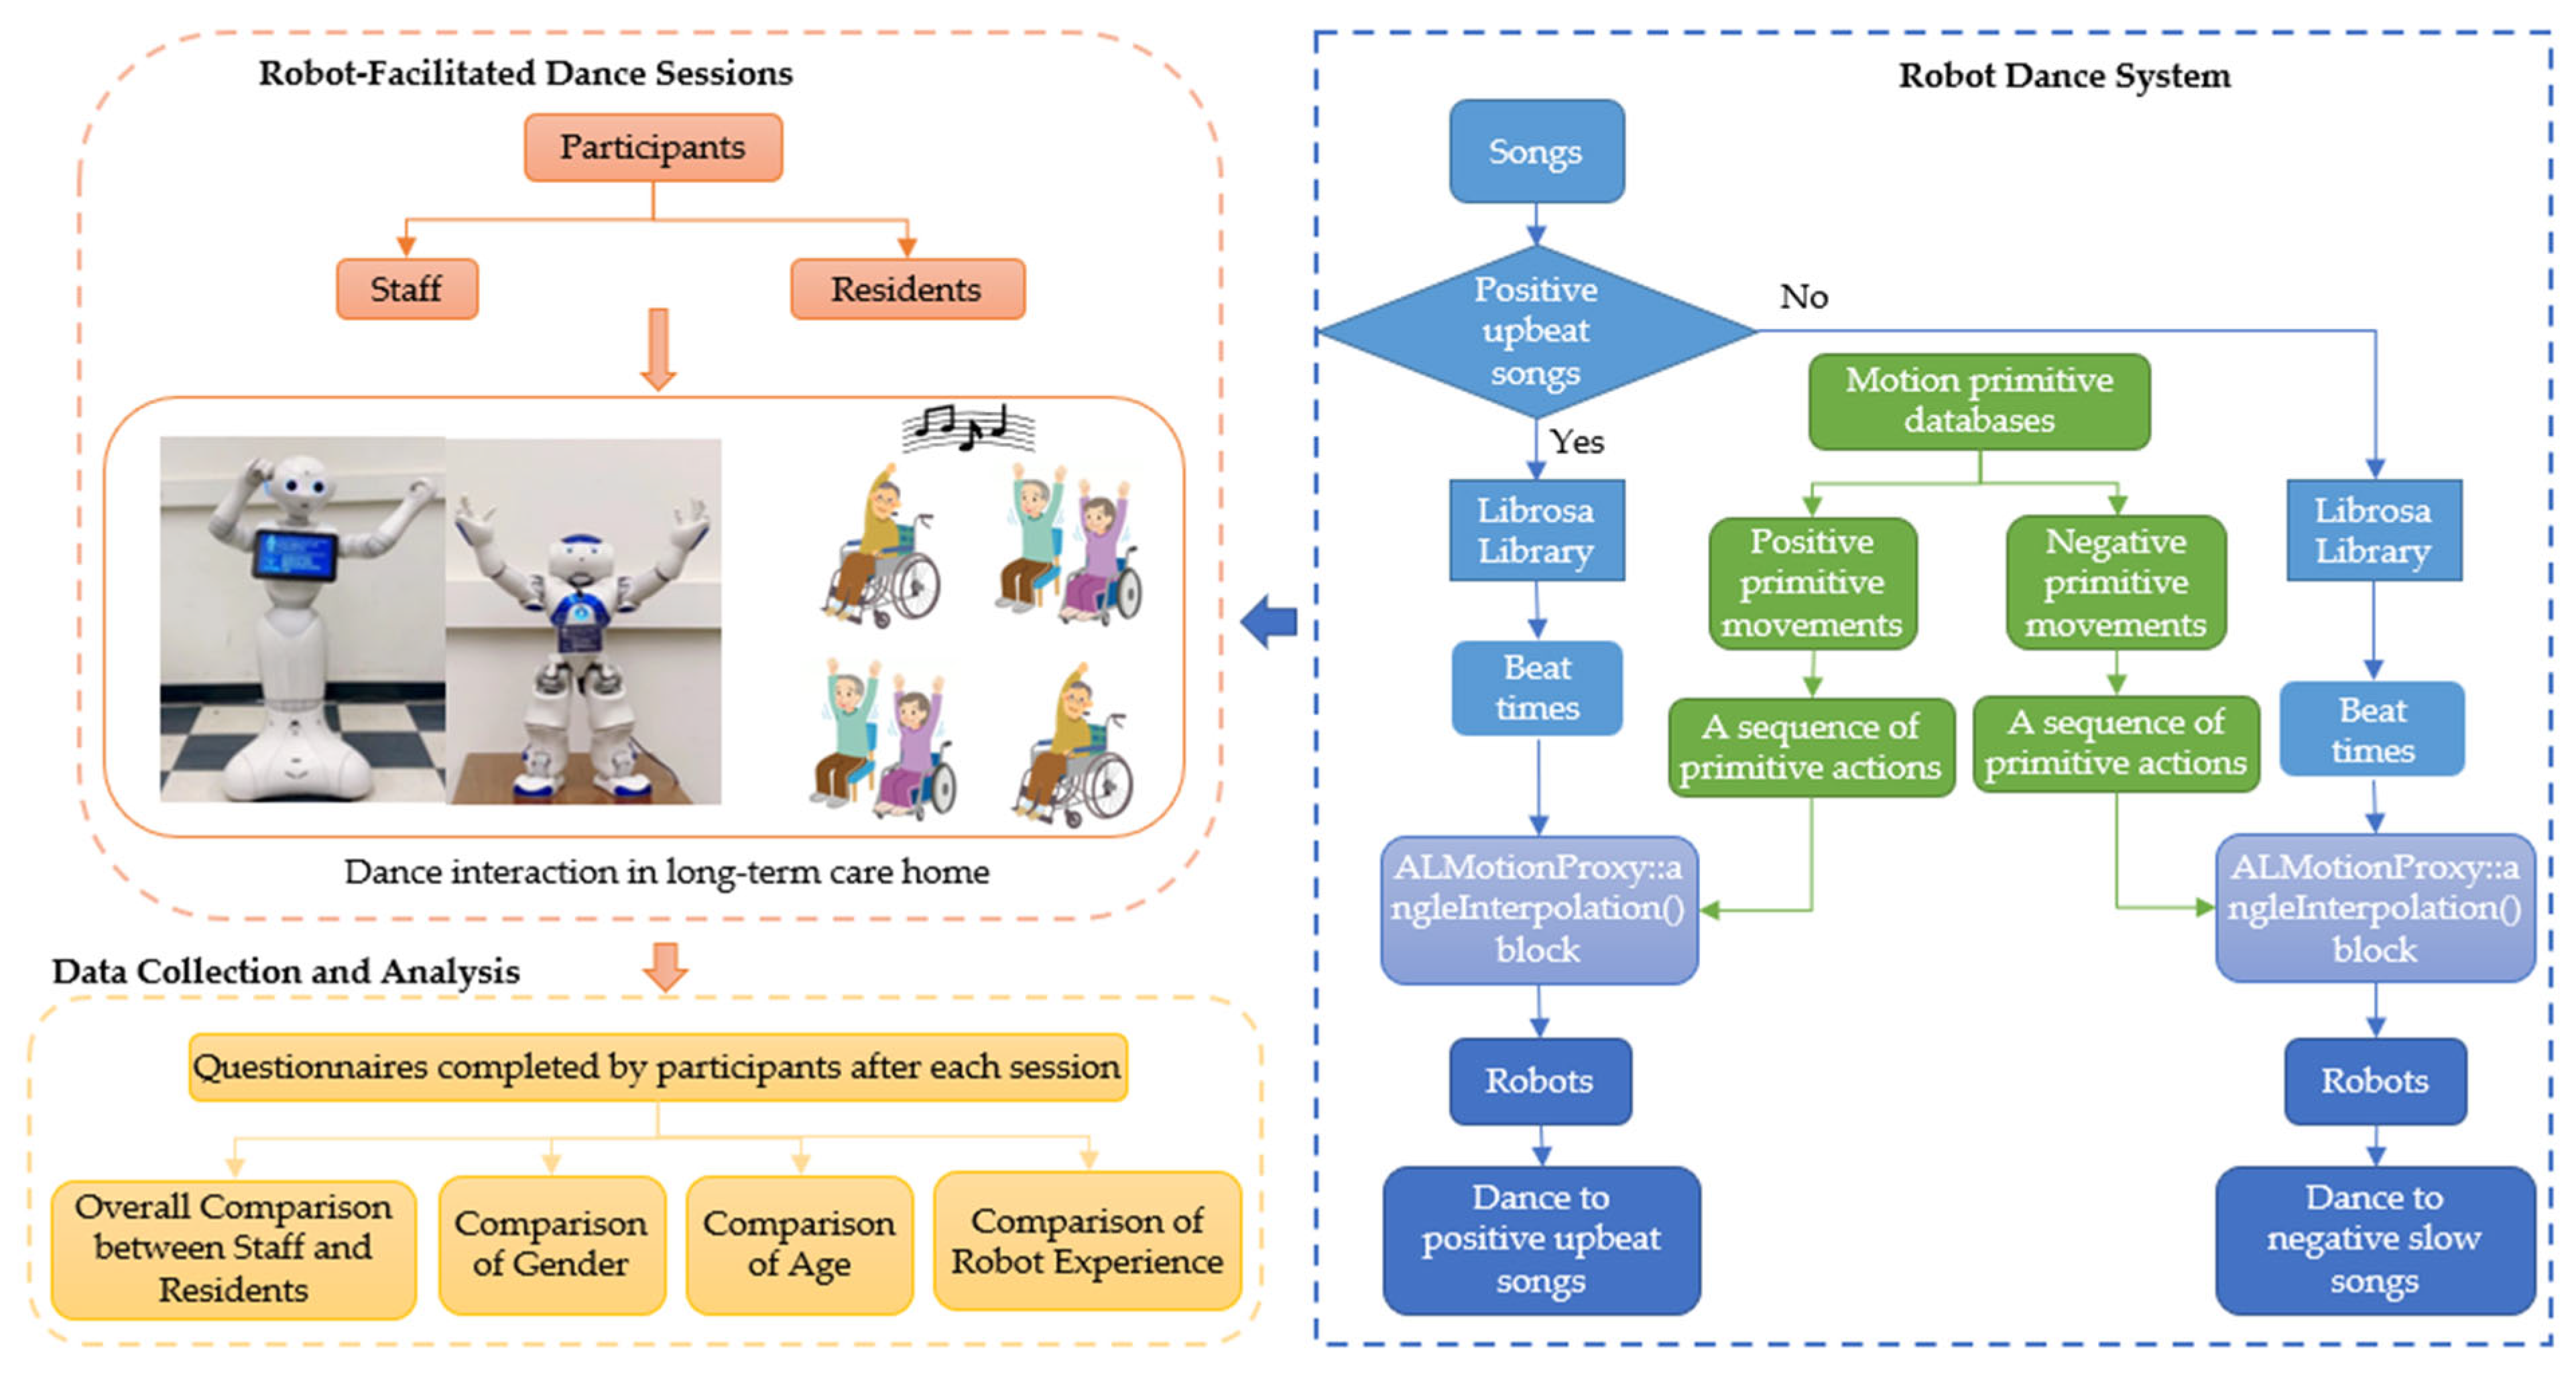
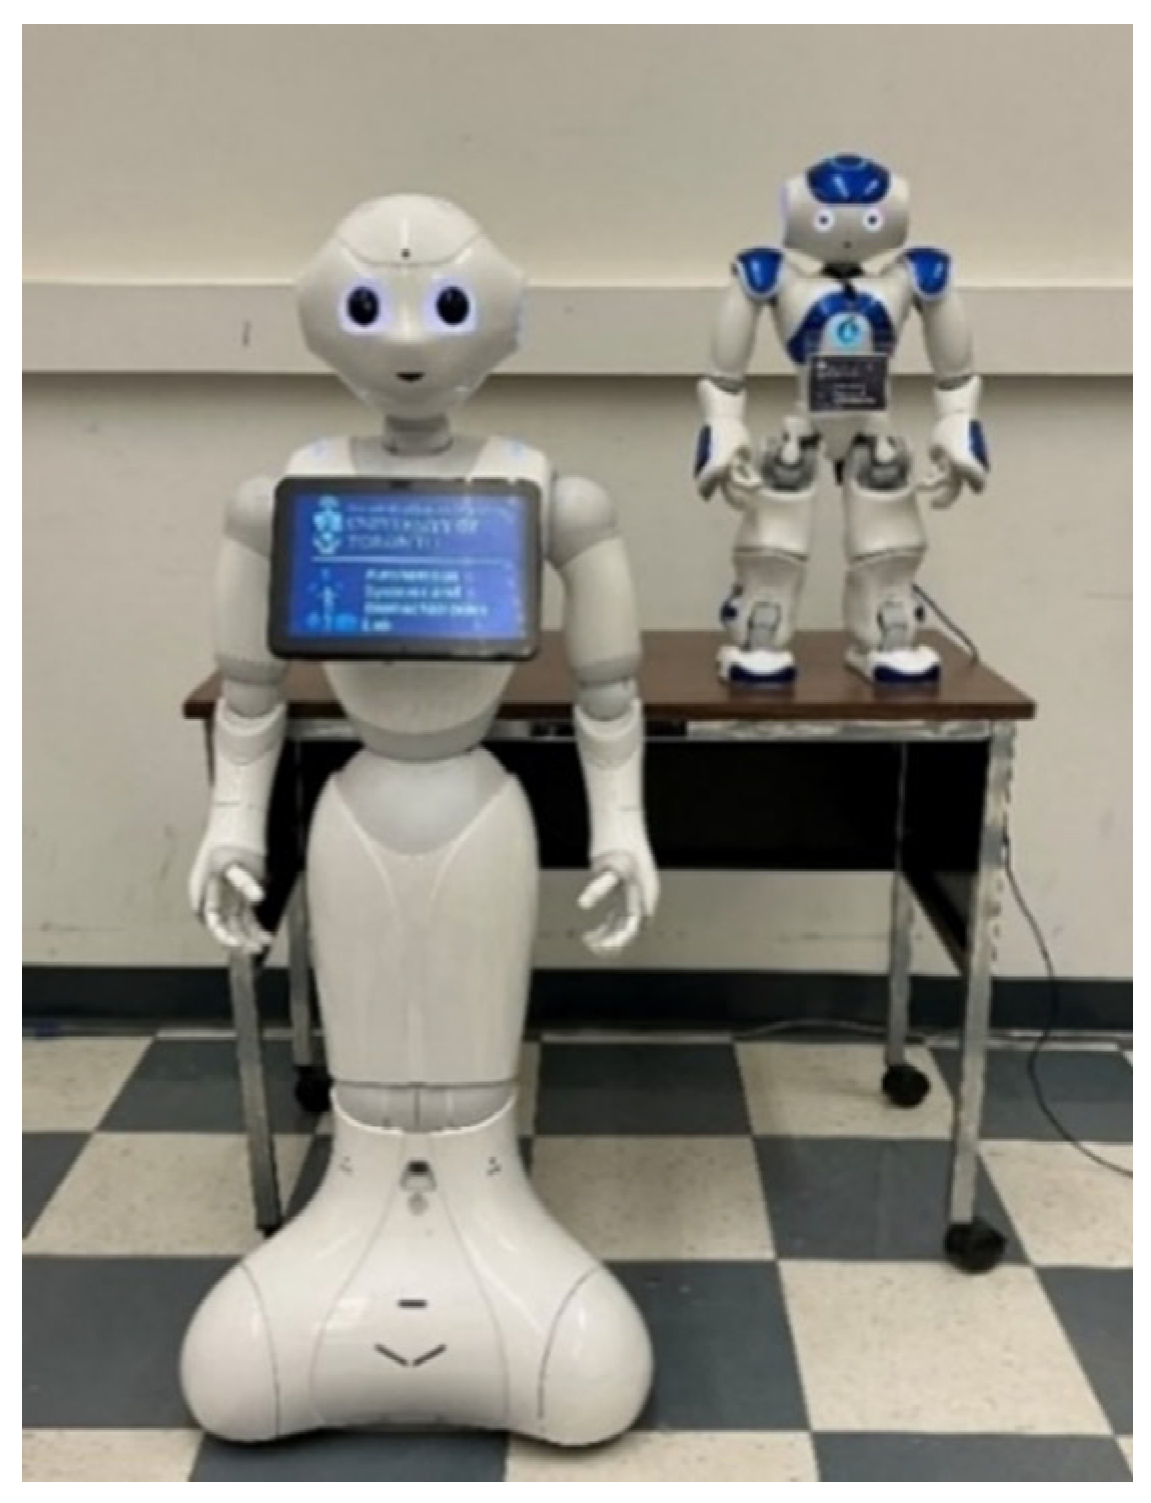
The results were analyzed to examine and compare the staff and resident groups’ perceptions regarding the robot-facilitated dance sessions and to observe the statistical relationships with the demographic factors. We conducted nonparametric Mann–Whitney
U (MWU) tests [
51] to determine if statistically significant differences exist between the responses of the two independent groups: staff and residents. To investigate the influence of demographic factors, we conducted nonparametric tests to determine significant differences using: (1) the Kruskal–Wallis (KW) test [
52] for the multiple age groups within the staff and residents groups and (2) MWU test [
51] for gender, age and prior robot experience between the staff and residents groups and gender and prior robot experience within the staff and residents groups.
4.1. Staff and Resident Comparison
The staff participant group included fifty-four people, and the resident participant group consisted of twenty-seven people.
Table 5 presents the overall descriptive statistics for both the staff and resident questionnaires, and
Figure 3 shows the corresponding box and whisker plots for these groups with respect to the statements in the questionnaires. Both staff and residents positively rated the majority of statements in the questionnaires with a
= 4 or higher.
Table 6 presents the statistical MWU tests results for the comparison of the staff and resident group responses. The staff (
= 4,
IQR = 2) had a higher median score for their intent to use a robot for dance activities than the residents (
= 3,
IQR = 1), with a statistically significant difference: MWU (
U = 938.5,
p = 0.019). Differences in median scores were determined between the residents and staff for statements on the perceived ease of use (S3), perceived safety (S7) and perceived enjoyment (S8). Namely, the robots were rated as easier to use (
= 5,
IQR = 1.75) and safer (
= 5,
IQR = 1) by the residents, and the residents thought a robot would make the dance activity more fun (
= 5,
IQR = 1) than the staff group (all three statements:
= 4,
IQR = 2). However, these differences were not statistically significant: MWU (
U = 559.5,
p = 0.127), MWU (
U = 585.5,
p = 0.129), and (
U = 602.5,
p = 0.171), respectively.
4.2. Gender
Of the fifty-four participants in the staff group, 38 participants responded as women and 10 participants as men (6 did not specify gender), whereas, for the twenty-seven participants in the resident group, 12 responded as women, 12 as men and 3 did not specify.
Figure 4 and
Figure 5 present the box and whisker plots for gender for both the staff and residents, and
Table 7 presents the nonparametric test results for the demographic factors within these two groups, including gender. For the staff group, women (
= 4) had the same median score as men (
= 4) for statements on perceived usefulness (S1:
IQR = 2 and 1.5; S2:
IQR = 2 and 0), perceived ease of use (S3:
IQR = 2 and 1) and perceived safety (S7:
IQR = 2 and 0.75); however, they (
= 5,
IQR = 1.75) did rate the robots higher for intent to use (S9) than men (
= 4,
IQR = 1.5) did. Staff who were men (
= 5,
IQR = 2) had more positive attitudes towards the robots (S5) than the women staff (
= 4,
IQR = 1) did based on their median scores. There were no statistically significant differences found between men and women for the staff group with respect to gender, as determined by the MWU tests (
p > 0.05).
With respect to the resident group, men ( = 5, IQR = 0.25) thought that, in general, it was more useful to have a robot help with recreational activities than women ( = 4, IQR = 2.5), with a statistically significant difference: MWU (U = 18, p = 0.04). Residents who were men also rated S4 and S7 higher than residents who were women with respect to their median scores. Both women and men residents ( = 5, IQR = 1) rated the robot high on perceived enjoyment (S8). The only statement that women residents had a higher median score for than the men residents was intent to use a robot for dance activities (S9). However, MWU tests showed that there were no statistically significant differences for these other statements (S2–S5 and S7–S9) between women and men in the resident group (p > 0.05).
We then compared results between these two groups to determine any differences in the responses.
Table 8 presents the MWU test results between the staff and resident groups for the three demographic factors. When comparing resident men and staff men, the resident group (
= 5,
IQR = 1) thought that having a robot facilitate the dance activity was safer than the staff group (
= 4,
IQR = 0.75), with a statistically significant difference: MWU (
U = 96,
p = 0.017). Men in the resident group had higher median scores than men in the staff group did for the robots with respect to perceived usefulness (S1:
= 5,
IQR = 0.25; S2:
= 4.5,
IQR = 2 versus S1:
= 4,
IQR = 1.5; S2:
= 4,
IQR = 0), perceived ease of use (S3:
= 5,
IQR = 2 versus
= 4,
IQR = 1) and emotional adaption (S4:
= 5,
IQR = 2 versus
= 3.5,
IQR = 1). However, men in the staff group rated the robots higher for positive attitude (S5:
= 5,
IQR = 2 versus
= 4,
IQR = 1) and intent to use (S9:
= 4,
IQR = 1.5 versus
= 3,
IQR = 1) than men in the resident group. The MWU tests showed that there were no statistically significant differences for these other statements between men in the resident and staff groups.
Women in the resident group had similar median scores as women in the staff group for the majority of the statements. The exception being that women in the resident group rated the robots higher for perceived enjoyment (S8) than women in the staff group ( = 5, IQR = 1 versus = 4, IQR = 1), whereas women in the staff group had higher intent to use (S9) than women in the resident group did based on the median scores ( = 5, IQR = 1.75 versus = 4, IQR = 1). However, there was no statistically significant differences found between women in the resident and staff groups, as determined by the MWU tests (p > 0.05).
4.3. Age
The ages of the staff ranged from 22 to 65 years (
μ = 40.2,
σ = 12.7), and the ages of the residents were between 57 and 93 (
μ = 76.7,
σ = 11). Staff ages were categorized into four common age groups for further analysis [
53]: 18–24 (
n = 17), 25–44 (
n = 18), 45–64 (
n = 11) and 65+ (
n = 2). The ages of the residents were also distributed into two of these common age groups: 45–64 (
n = 3), and 65+ (
n = 14). Six staff and ten residents did not specify their ages. We noticed that the 65+ age group for staff and 45–64 age group for residents only consisted of two and three participants, respectively. However, this was expected, since the typical retirement age in Canada is 65 years old and over [
54].
Figure 6 and
Figure 7 present the box and whisker plots of the ages for staff and residents. The robots had higher median scores for the youngest staff age group for a reduced workload (S6:
= 5,
IQR = 0), perceived safety (S7:
= 5,
IQR = 1) and intent to use (S9:
= 5,
IQR = 0) than all other staff age groups. Both the youngest and oldest staff age groups had higher median scores for positive attitude (S5) and perceived enjoyment (S8) (
= 5,
IQR = 0) than the middle staff age groups. However, the KW tests showed that there were no statistically significant differences in these statements for the staff group (
p > 0.05).
In the resident group, both age groups rated the majority of the statements as high ( ≥ 4). The only exceptions being for emotional adaption (S4) and intent to use (S9), where the 65+ group rated this statement more neutral ( = 3, IQR = 2 and = 3.5, IQR = 1), respectively. The younger (45–64 in age) resident age group ( = 5, IQR = 2) thought that it was more useful to have a robot help with recreational activities (S1) than the older (65+ in age) resident age group ( = 4, IQR = 2). The KW tests showed that there were no statistically significant differences in all the statements for the resident group (p > 0.05).
4.4. Prior Robot Experience
In the staff group, 28 people responded that they had no prior robot experience (no experience), 20 responded they had seen robots at museums, science centers or on TV (beginner experience), 2 people responded that they had seen robots used at their workplace delivering packages or medicine or interacting with residents (intermediate experience), no one responded that they had hands-on experience using a robot in a healthcare setting (advanced experience) and 4 people did not specify any prior robot experience. As the sample size was small for anyone with intermediate or advanced experience, the staff were categorized into two experience groups: no experience (n = 28) or limited experience (i.e., beginner and intermediate) (n = 22). In the resident group, 13 participants had no prior robot experience (n = 13), 12 participants had limited robot experience (n = 12) and 2 participants did not specify prior robot experience. Namely, no residents had intermediate or advanced robot experience.
Figure 8 and
Figure 9 show the box and whisker plots of robot experience for both the staff and residents. Staff who had no prior robot experience had higher median scores than the staff who had limited prior robot experience on perceived usefulness in having a robot help with recreational activities (S1:
= 5,
IQR = 2 versus
= 4,
IQR = 1.75), positive attitude (S5:
= 5,
IQR = 2 versus:
= 4,
IQR = 2), perceived enjoyment (S8:
= 5,
IQR = 1 versus
= 4,
IQR = 2) and intent to use (S9:
= 5,
IQR = 1.5 versus:
= 4,
IQR = 2). The MWU tests showed that there were no statistically significant differences between these experience levels within the staff group (
p > 0.05).
Residents who had limited prior robot experiences had higher median scores than residents who had no prior robot experience for perceived usefulness in having a robot help with recreational activities (S1: = 5, IQR = 1 versus = 4, IQR = 1.25), perceived ease of use (S3: = 5, IQR = 1 versus = 3.5, IQR = 2.25) and perceived enjoyment (S8: = 5, IQR = 0 versus = 4, IQR = 1). However, residents who had no prior robot experience rated their intent to use the robots higher than residents who had limited prior robot experience (S9: = 4, IQR = 1 versus = 3, IQR = 1) based on the median scores. Both groups thought that such robot-facilitated dance activities were useful in enhancing wellbeing (S2: = 4, IQR = 2 and = 4, IQR = 1.25). The MWU tests showed that there were no statistically significant differences between these experience levels within the resident group (p > 0.05).
Comparing staff and resident responses, staff who had no robot experience had higher median scores than residents who had no robot experience for perceived usefulness in having a robot help with recreational activities (S1: = 5, IQR = 2 versus = 4, IQR = 1.25), positive attitude (S5: = 5, IQR = 2 versus = 4, IQR = 2), perceived enjoyment (S8: = 5, IQR = 1 versus = 4, IQR = 1) and intent to use (S9: = 5, IQR = 1.5 versus = 4, IQR = 1). Residents with no robot experience had higher median scores than the staff in this experience group for perceived safety (S7: = 5, IQR = 1 versus = 4, IQR = 2). However, there was no statistically significant difference found between the resident and staff groups with respect to no prior robot experience, as determined by the MWU tests (p > 0.05). Conversely, participants who had limited robot experience in the resident group ( = 5, IQR = 1) thought it would be easier for them to follow the robot during the dance sessions (S3) than participants who had limited robot experience in the staff group ( = 4, IQR = 2), with a statistically significant difference determined: MWU (U = 192, p = 0.031). Furthermore, participants who had limited robot experience in the resident group ( = 5, IQR = 0) also thought a robot would make the dance activity more fun (S8) than participants who had limited robot experience in the staff group ( = 4, IQR = 2) with a statistically significant difference: MWU (U = 202, p = 0.011).