Article

Shift of N-MYC Oncogene Expression in AML Patients Carrying the FLT3-ITD Mutation

Almazov National Medical Research Centre, 2 Akkuratova Str., Saint Petersburg 197341, Russia
*
Author to whom correspondence should be addressed.
Pathophysiology 2023, 30(3), 296-313; https://doi.org/10.3390/pathophysiology30030024
Submission received: 5 May 2023 / Revised: 20 June 2023 / Accepted: 29 July 2023 / Published: 1 August 2023
(This article belongs to the Special Issue MYC in Regeneration and Tumorigenesis)

Abstract

:
Mutations in the FLT3 gene not only lead to abnormalities in its structure and function, but also affect the expression of other genes involved in leukemogenesis. This study evaluated the expression of genes that are more characteristic of neuroblastoma but less studied in leukemia. N-MYC oncogene expression was found to be more than 3-fold higher in primary AML patients carrying the FLT3-ITD mutation compared to carriers of other mutations as well as patients with normal karyotype (p = 0.03946). In contrast to the expression of several genes (C-MYC, SPT16, AURKA, AURKB) directly correlated to the allelic load of FLT3-ITD, the expression of the N-MYC oncogene is extremely weakly related or independent of it (p = 0.0405). Monitoring of N-MYC expression in some patients with high FLT3-ITD allelic load receiving therapy showed that a decrease in FLT3-ITD allelic load is not always accompanied by a decrease in N-MYC expression. On the contrary, N-MYC expression may remain elevated during the first three months after therapy, which is additional evidence of the emergence of resistance to therapy and progression of AML.

1. Introduction

To date, target oncogene mutations arising from chromosomal abnormalities and associated with the course of malignant blood disease, as well as its outcome, have been well-studied. The detection of oncogene defects due to chromosomal abnormalities in acute myeloid leukemia (AML) allows us to divide these disorders into three main groups. The first group of chromosomal aberrations that do not result in the loss of genetic material includes reciprocal chromosomal translocations and inversions, which cause formation of chimeric (fusion) oncogenes. Such changes cause abnormalities in the function of genes encoding transcription factors involved in hematopoiesis. Carrying these gene mutations, taking into account modern treatment regimens, is usually associated with a favorable prognosis [1]. The second group of chromosomal aberrations includes deletions leading to irregular losses of genetic material. Mutational changes in these genes are associated with an unfavorable prognosis, and the pathogenesis of the disease is often caused by dysfunction of anti-oncogenes [2]. Finally, the third group includes cases in which no visible karyotype abnormalities are detected (normal karyotype). As a rule, patients with normal karyotype constitute an intermediate prognostic group. However, this group can be subdivided into different prognostic subgroups that include rare mutations which respond differently to treatment. In particular, detection of the D816V mutation in exon 17 of the C-KIT gene in 1% of AML patients with normal karyotype correlates with a poor prognosis [3]. In addition, rearrangements of the MLL gene are known to occur in 6% of patients with normal karyotype, which is also characterized by an unfavorable course of the disease [4]. Finally, mutations occurring in the FMS-like tyrosine kinase gene FLT3 (FMS-like tyrosine kinase) are more frequently found in patients with normal and less frequently abnormal karyotypes; for example, in combination with low-risk (AML1-ETO, CBFβ-MYH11/A, NPM1/A) or high-risk mutations (DEK-NUP214, NUP98-NSD1) [5,6,7,8,9]. Moreover, detection of rare mutations of oncogenes DEK-NUP214, NUP98-NSD1 (<1%) correlates with detection of FLT3 gene mutations in 90% of cases.
Among mutational changes in the FLT3 gene, the most common are internal tandem duplications (ITD) detected in the juxtamembrane domain of the FLT3 gene, and they account for 25–30% of all AML cases, which often correlates with resistance to treatment and an unfavorable prognosis of the disease [7]. Point mutations in the tyrosine kinase domain (TKD) of the FLT3 gene are less common and account for up to 3–10% of all cases [10]. Their prognostic significance remains unclear. They can be detected both as primary, in the onset of the disease, and secondary, during treatment, which is an indicator of patient resistance to treatment and progression of malignant blood disease [11,12]. It is known that the detection of FLT3-ITD mutation in hematopoietic stem cells is associated with inhibition of terminal myeloid differentiation, the appearance of immature cells in the peripheral blood, characterized by the inability to perform their intended functions [13,14]. Apparently, the occurrence of tandem duplications, including FLT3-ITD, is associated with the formation of hairpins on the lagging DNA strand caused by replication errors, which leads, in some cases, to the appearance of palindromes [15]. During carcinogenesis, tandem-duplicated genes in the synthesized DNA chain are preserved due to disturbances in the nucleotide mismatch repair system. It is known that, in leukemia, mutations in the FLT3 gene encoding the receptor protein lead to spontaneous dimerization of the receptor and formation of the enzyme active center, the basis of which is the activation loop (A-loop). Due to the resulting mutations in the FLT3 gene, constitutive activation of the FLT3 protein occurs and triggers a cascade of reactions that is longer in duration than normal. This contributes to changes in the expression of genes that control the cell cycle and cause an increase in proliferation, block differentiation, and inhibit apoptosis [16]. In particular, FLT3-ITD was previously found to activate STAT5, which translocates into the nucleus to bind DNA and express STAT5-responsive genes, including C-MYC [17]. Recently, the results of determining gene expression, including fusion oncogenes, in 33 adult AML patients using microarray RT-qPCR were presented [18]. In addition to detecting overexpression of several genes, these researchers observed overexpression of the C-MYC oncogene in AML1-ETO mutation carriers. Previously, another group of scientists found increased expression of the N-MYC oncogene in hematopoietic cells of children with AML who were carriers of AML1-ETO or CBFβ-MYH11 mutations [19]. However, in both cases, the potential mechanism of N-MYC or C-MYC involvement in leukemogenesis is unknown. Nevertheless, by analogy with neuroblastoma and other tumors, it can be assumed that some mitotic serine/threonine kinases (AURKA, AURKB) and transcription factors (SPT16) may be involved to maintain increased expression, particularly of the N-MYC oncogene in leukemia. Moreover, these biomarkers control the pericentromeric localization of cohesin, which is involved in DNA replication and ensures sister chromatid cohesion until segregation is imminent at anaphase in mitosis. It should be noted that cohesin subunits knockdown impaired proliferation in neuroblastoma cells expressing N-MYC but had no inhibitory effect in control cells [20]. Recently, it became known that cohesin dysfunction is often associated with the detection of FLT3 gene mutations in AML [21].
At present, the occurrence of the FLT3-ITD internal tandem duplication tends to be regarded as a late event in the pathogenesis of AML, while an early event preceding or concomitant with the occurrence of FLT3 gene mutations remains unknown [22]. The main objective of this work was to quantify the expression of some genes (C-MYC, N-MYC, SPT16, AURKA, AURKB) that are more characteristic biomarkers for neuroblastoma with poor prognosis, but less studied in AML patients, including carriers of FLT3-ITD mutation with high allelic load. Initially, we determined the expression of the C-MYC (WT1) oncogene in primary patients with AML (n = 44) belonging to two different patient groups: FLT3-ITD-negative (n = 30) and FLT3-ITD-positive (n = 14). We found a slight excess of the mean level of C-MYC (WT1) oncogene expression in patients from the FLT3-ITD-positive group compared to the FLT3-ITD-negative group (C-MYC, p = 0.005011; WT1, p = 0.008042). Then, we decided to additionally determine the expression of the N-MYC oncogene and the nearest circle of regulatory genes (SPT16, AURKA, AURKB) whose expression is often elevated in neuroblastoma and remains unstudied in adult patients with AML, including FLT3-ITD mutation carriers. According to the present work, there was a significant, more than 3-fold higher, level of N-MYC oncogene expression in FLT3-ITD mutation carriers compared to FLT3-ITD-negative group of patients. In addition, it was required to find out whether at least one of the studied biomarkers could be used to assess minimal residual disease (MRD) in some patients (n = 4), FLT3-ITD mutation carriers, during the first three months of receiving therapy.

2. Materials and Methods

2.1. Ethics and Experimental Design

The study was carried out in compliance with the principles of the Helsinki Declaration of the World Medical Association with the consent of the Ethics Committee of the Federal State Budgetary Institution “Almazov National Medical Research Centre” of the Ministry of Health of the Russian Federation (conclusion of 31 October 2019). According to the research, all patients were divided into two groups based on the results of FLT3-ITD mutation detection.

2.1.1. Inclusion Criteria

The study was conducted in primary patients (n = 44) with acute myeloid leukemia (AML) who were diagnosed in the Almazov National Medical Research Centre. The average age of the patients was 39 (18–72) years. Information on the comorbidities and sex of the study patients is presented in Table S1. All bone marrow (BM) samples were taken at the onset of the disease. Some of them (n = 4) were taken for monitoring, if treatment permitted.

2.1.2. Exclusion Criteria

Patients with acute promyelocytic leukemia (APL) were excluded from the study because there were no primary patients among them.

2.2. RNA Extraction and cDNA Synthesis

RNA was isolated from 1 mL of total BM cells using the QIAamp RNA Blood Mini Kit (Qiagen, Hilden, Germany). Lysis solution was added to the cell suspension and further processing was performed according to the protocol. RNA was eluted in 30 µL of RNase-free buffer. The reverse transcription (RT) reaction was carried out according to the procedure for cDNA synthesis using the RevertAid H Minus First Strand cDNA Synthesis Kit (Fermentas, Vilnius, Lithuania).

2.3. DNA Extraction

gDNA was isolated from 0.2 mL of total BM cells using the QIAamp DNA Mini Kit (Qiagen) according to the manufacturer’s protocol. DNA was eluted in 50 μL of buffer AE (10 mM Tris·Cl, 0.5 mM EDTA, pH 9.0).

2.4. Screening of Target Oncogene Mutations, including FLT3 Gene Mutations

To detect various oncogene mutations (AML1-ETO, CBFβ-MYH11, PML-RARα, BCR-ABL, DEK-NUP214, NUP98-NSD1, MLL-AF4), cDNA was amplified using microarray real-time PCR after reverse transcription (RT) [23]. Each sample for PCR contained 1× PCR buffer, 2.5 mM of each dNTP, 10 pM forward and reverse primers, 6 pM FAM-labeled probe at the 5′-end, 10 ng of cDNA, and 5 units of Taq polymerase (Evrogen, Moscow, Russia). Commercially synthesized oligonucleotides were the same as those published previously [24,25,26,27]. Thermocycling steps included the initial denaturation at 95 °C for 120 s followed 50 cycles: 95 °C for 3 s and 60 °C for 30 s were performed on an AriaDNA amplifier (Lumex, St. Petersburg, Russia).
To detect target mutations in the NPM1, C-KIT, and FLT3 genes, amplification of gDNA was performed on a DNA Engine Dyad Peltier Thermal Cycler (Bio-Rad, Hercules, CA, USA). Each PCR sample contained 1× PCR buffer, 2.5 mM of each dNTP, 10 pM forward and reverse primers, 100 ng of gDNA, and 5 units of Encyclo Taq polymerase (Evrogen, Moscow, Russia). Commercially synthesized oligonucleotides and thermal cycling conditions were the same as for PCR followed by direct Sanger sequencing. Mutations in exons 14, 15, and 20 of the FLT3 gene were determined using PCR and agarose gel electrophoresis. To confirm the mutations detected, direct Sanger sequencing was performed using an ABI PRISM 3110 genetic analyzer (Applied Biosystems, Waltham, MA, USA) as described previously [28]. The mutations localized in exon 12 of the NPM1 gene and exon 17 of the C-KIT gene were analyzed by direct Sanger sequencing as presented before [29,30].

2.5. Determination of the Allelic Load of FLT3 Gene Mutations

To determine the allelic load of the FLT3-ITD (FLT3-TKD) mutation, a DNA sample (2–4 ng) was amplified using PCR. It should be noted that the PCR conditions were the same as described above, except that each sample contained 1 pM of forward and reverse primers (the forward primer was labeled 6-FAM at the 5′-end). Commercially synthesized oligonucleotides and thermal cycling conditions were the same as those specified for PCR followed by Sanger direct sequencing [28]. To detect the allelic load of the FLT3-TKD D835 mutation, PCR products were digested with EcoRV restriction enzyme before capillary electrophoresis. After fragment analysis was performed, the peak areas for wild type and mutation were estimated using software for the Nanofor-05 sequencer (Helicon, Moscow, Russia).

2.6. Quantitative Gene Expression Analysis

To quantify mRNA transcripts of the tested genes (WT1, SPT16, AURKA, AURKB, N-MYC, C-MYC), the target oncogenes (CBFβ-MYH11/A, AML1-ETO, NPM1/A), and the GAPDH reference gene, cDNA samples were amplified by RT-qPCR. To determine the gene expression of WT1, CBFβ-MYH11/A, AML1-ETO, and NPM1/A, RT-qPCR was performed using the Fusion Quant Kit (Qiagen), the Universal PCR Master Mix (Applied Biosystems), and commercially synthesized oligonucleotides, whose nucleotide sequences, together with the RT-qPCR protocol, have been published previously [24,25,31,32]. Expression of N-MYC, C-MYC, SPT16, AURKA, and AURKB genes was assessed by RT-qPCR using the Universal PCR Master Mix Kit (Applied Biosystems) and commercially synthesized oligonucleotides that were selected using the NCBI system (Table S2). Each PCR sample contained 1× Universal PCR master mix, 10 pM forward and reverse primers, 6 pM FAM-labeled probe at the 5′-end, and 100 ng of cDNA. Thermocycling steps included holding at 50 °C for 2 min, and holding at 95 °C for 10 min, followed by 50 cycles: 95 °C for 15 s and 60 °C for 1 min. The PCR results were analyzed using the RotorGene 6000 thermal cycler software (Corbett Research, Sydney, Australia) after generating calibration curves with standard dilutions of plasmid DNA (101–106). The threshold levels of quantitative gene expression of WT1, AURKA, AURKB, SPT16, N-MYC, and C-MYC in BM cells of healthy donors (n = 10) did not exceed 2.5 × 10², 9.2 × 10², 1.0 × 10³, 8.6 × 10⁴, 2.3 × 10⁵, and 4.5 × 10⁵ copies/GAPDH. An excess of these values was considered as an increase in expression.

2.7. Cytogenetic Study

Preparation of chromosome spreads and subsequent chromosome differential staining were performed according to the assay described previously [33]. The karyotype pathology was interpreted by analysis of 20 mitoses by standard karyotyping and/or 200 interphase nuclei after fluorescence in situ hybridization (FISH).

2.8. Statistical Analysis

Comparative analysis of the average expression levels of the genes under study in two different groups of patients was performed using a one-way ANOVA with Bonferroni’s post-test for multiple analysis. The relationship between the relative expression of the genes under study and the allelic load of the FLT3-ITD mutation was assessed after plotting the XY correlation plot with the line of best fit and determining the linear regression coefficient. The correlation association between the insertion length (allelic load value) of the FLT3-ITD mutation and the achievement of remission (disease outcome) in patients from two different groups was assessed using the χ2 test.

3. Results

3.1. Analysis of Oncogene Mutations in Primary AML Patients

According to the cytogenetic study performed in primary patients with AML (n = 44), an abnormal karyotype was detected in 21 patients, while the karyotype of the remaining 23 patients was normal. Molecular genetic screening of target oncogene mutations was also performed. According to the mutations identified, all patients were divided into two groups (Table 1). The FLT3-ITD-negative group (n = 30) consisted of patients who had no mutations in the FLT3 gene but one of the other two mutations was detected: AML1-ETO [t(8;21)(q22;q22)] (n = 13), CBFβ-MYH11/A [inv16(p13;q21)] (n = 8), and patients with normal karyotype (n = 9), in whom no mutations were identified. Of note, that 5 of the 30 patients mentioned above had the NPM1/A gene mutation, 3 of whom were AML1-ETO carriers and two others were CBFβ-MYH11/A carriers. The FLT3-ITD-positive group (n = 14) consisted of patients with normal karyotype who were carriers of FLT3 gene mutations: FLT3-ITD or FLT3-ITD/FLT3-TKD. The FLT3-TKD mutation was detected in one patient who was also a carrier of the FLT3-ITD mutation. The frequency of the FLT3-TKD mutation among the AML patients studied was 2.3%, whereas the frequency of the FLT3-ITD mutation did not exceed 31.8%. Of note, 7 of the 14 FLT3-ITD carriers had the NPM1/A gene mutation (Table 1 and Table S3). In all FLT3-ITD mutation carriers, the duplication insertion length was determined as previously described [34]. In total, 8 of the 14 FLT3-ITD carriers had an insertion length greater than 39 bp, whereas the remaining 6 patients had an insertion length shorter than 39 bp. The present study showed no significant differences with respect to complete hematological remission (CHR) or mortality in FLT3-ITD carriers with different insertion lengths: >39 bp vs. <39 bp (Table 2).

3.2. Determination of Allelic Load of FLT3-ITD Gene Mutation

In addition, the allelic load of the FLT3-ITD mutation was determined in all patients belonging to the FLT3-ITD-positive group. A total of 6 patients had an allelic load below 0.5 (0.15–0.49), whereas the remaining 8 patients had an allelic load above 0.5 (0.64–6.3). At the same time, carriers of the FLT3-ITD mutation with a lower (<0.5) allelic load achieved CHR more frequently than carriers with a higher (>0.5) allelic load (Table 2). Of note, in 1 patient who had a low (0.45) allelic load at baseline, a course of induction therapy followed by therapy with the tyrosine kinase inhibitor gilteritinib (120 mg/day) resulted in the achievement of CHR and a complete molecular response. However, the patient subsequently developed pulmonary failure due to SARS-CoV-2 infection, followed by death.

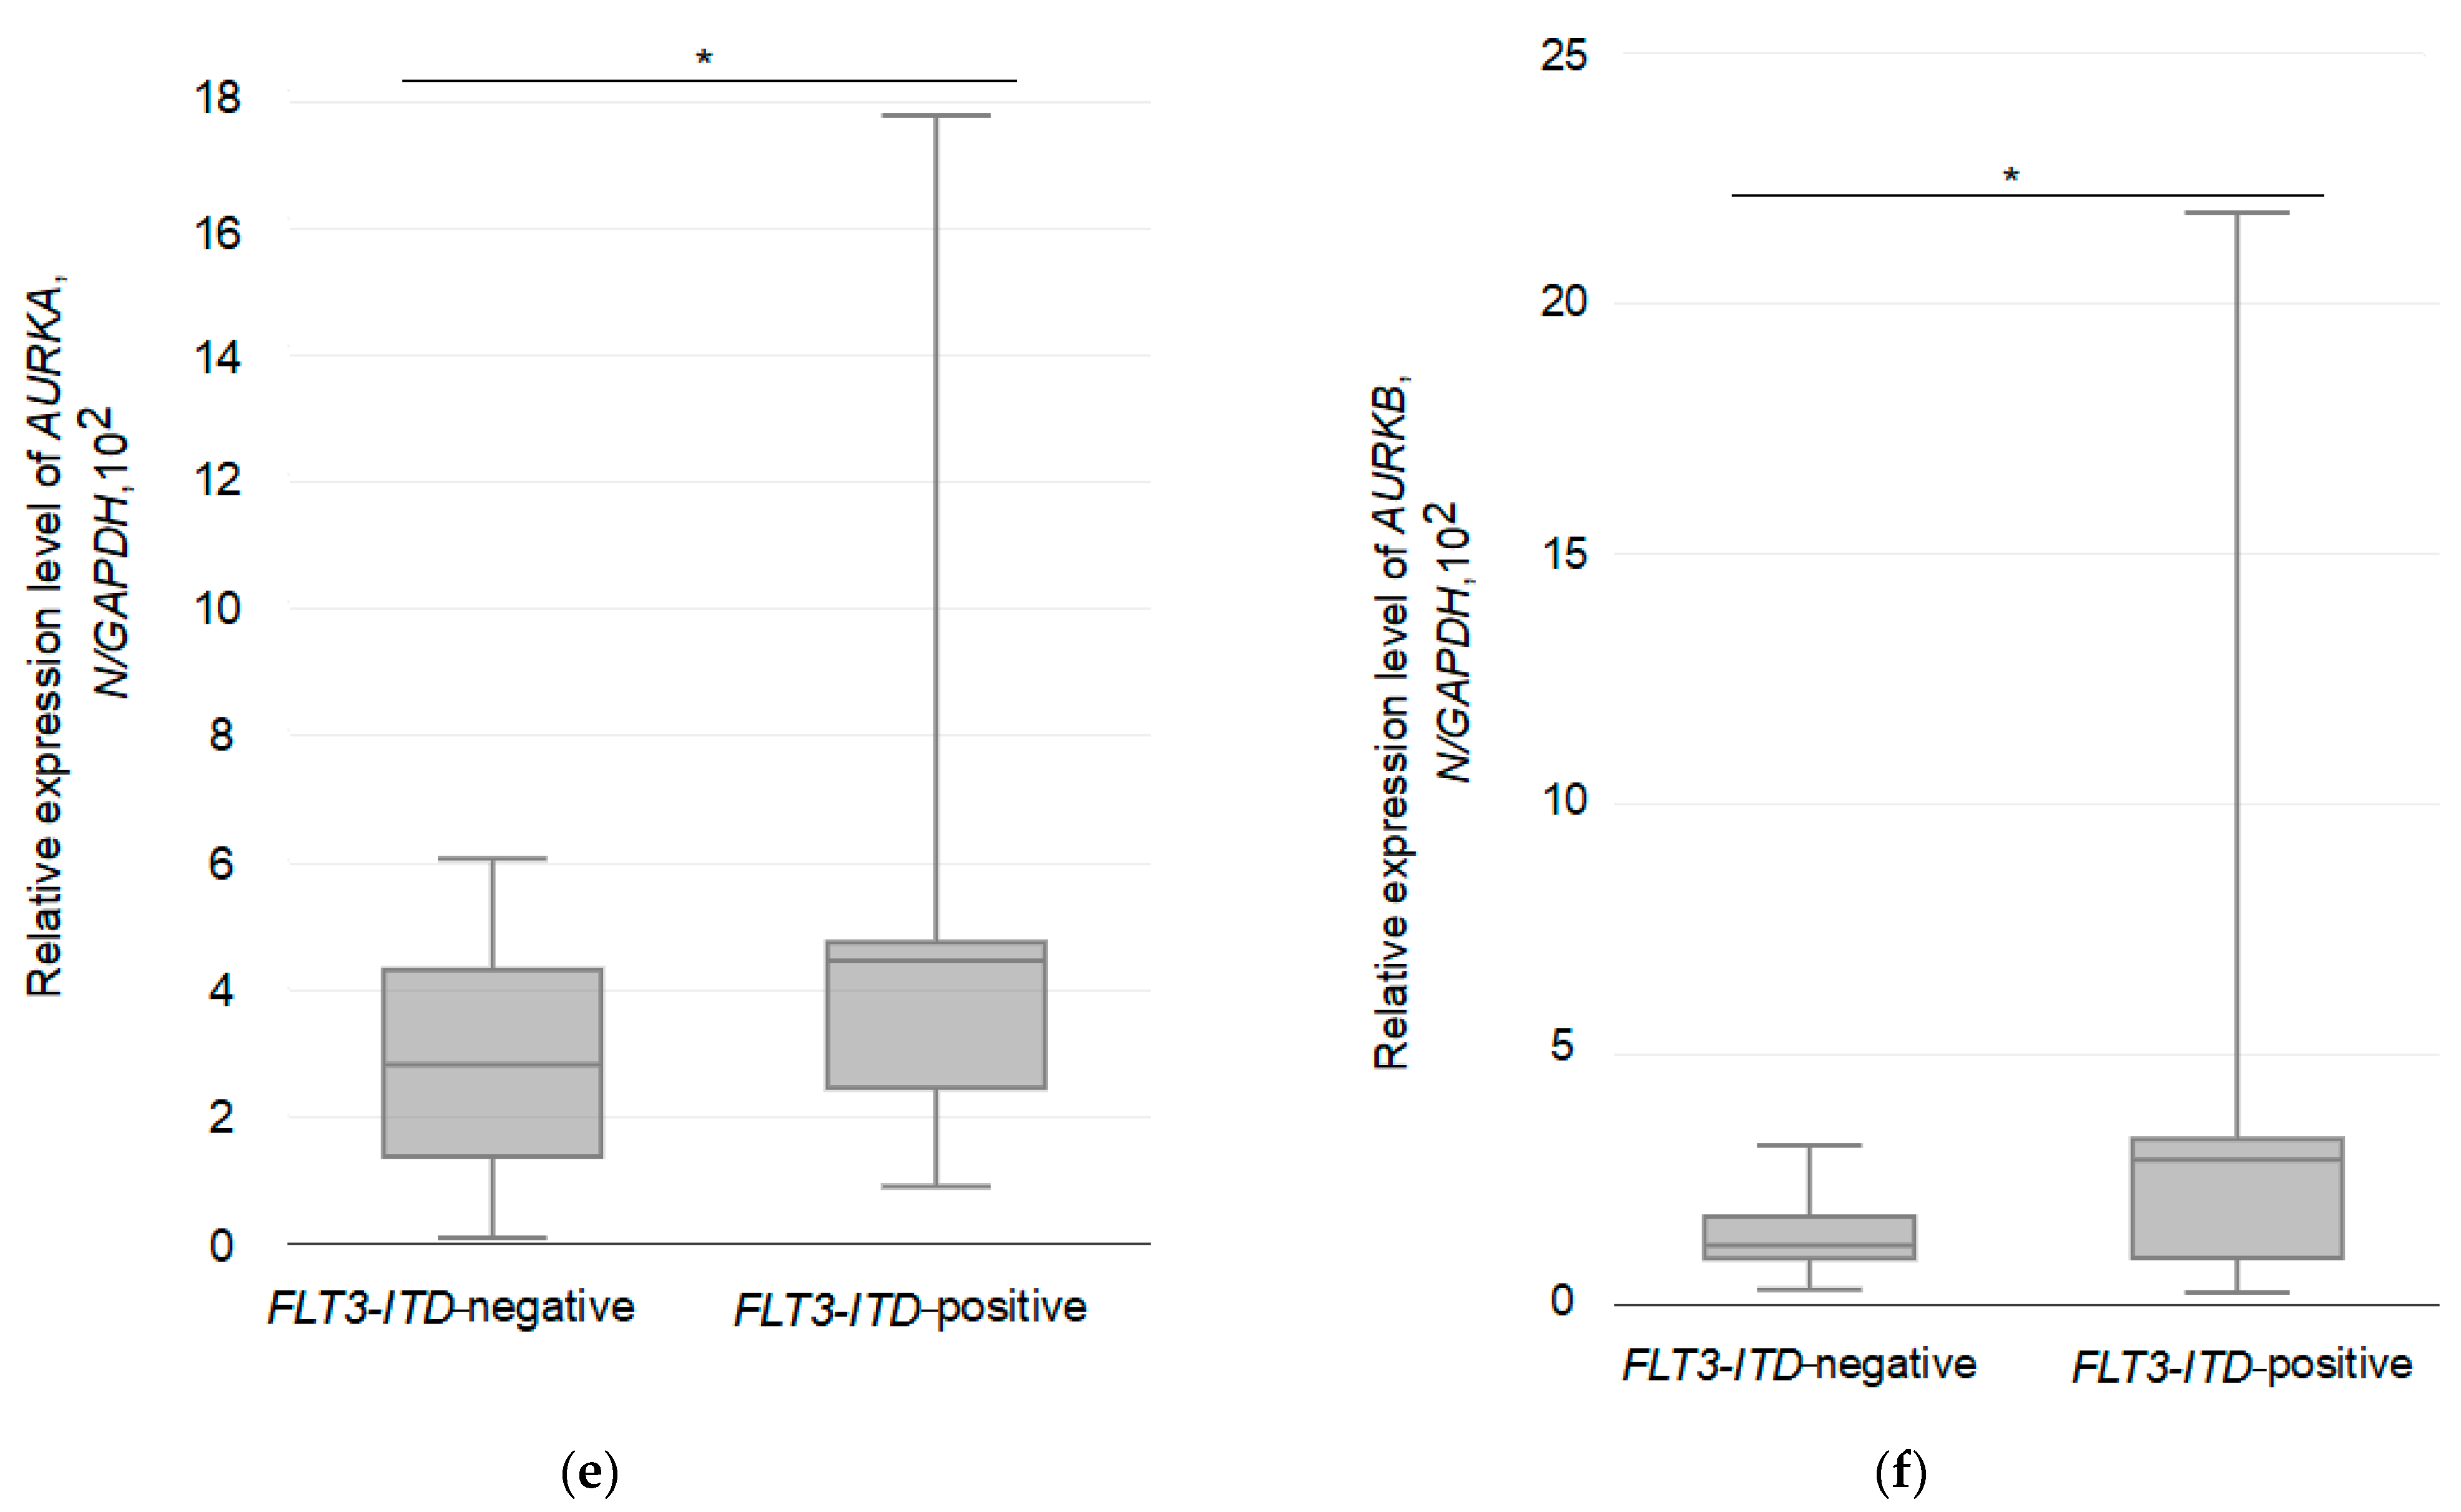
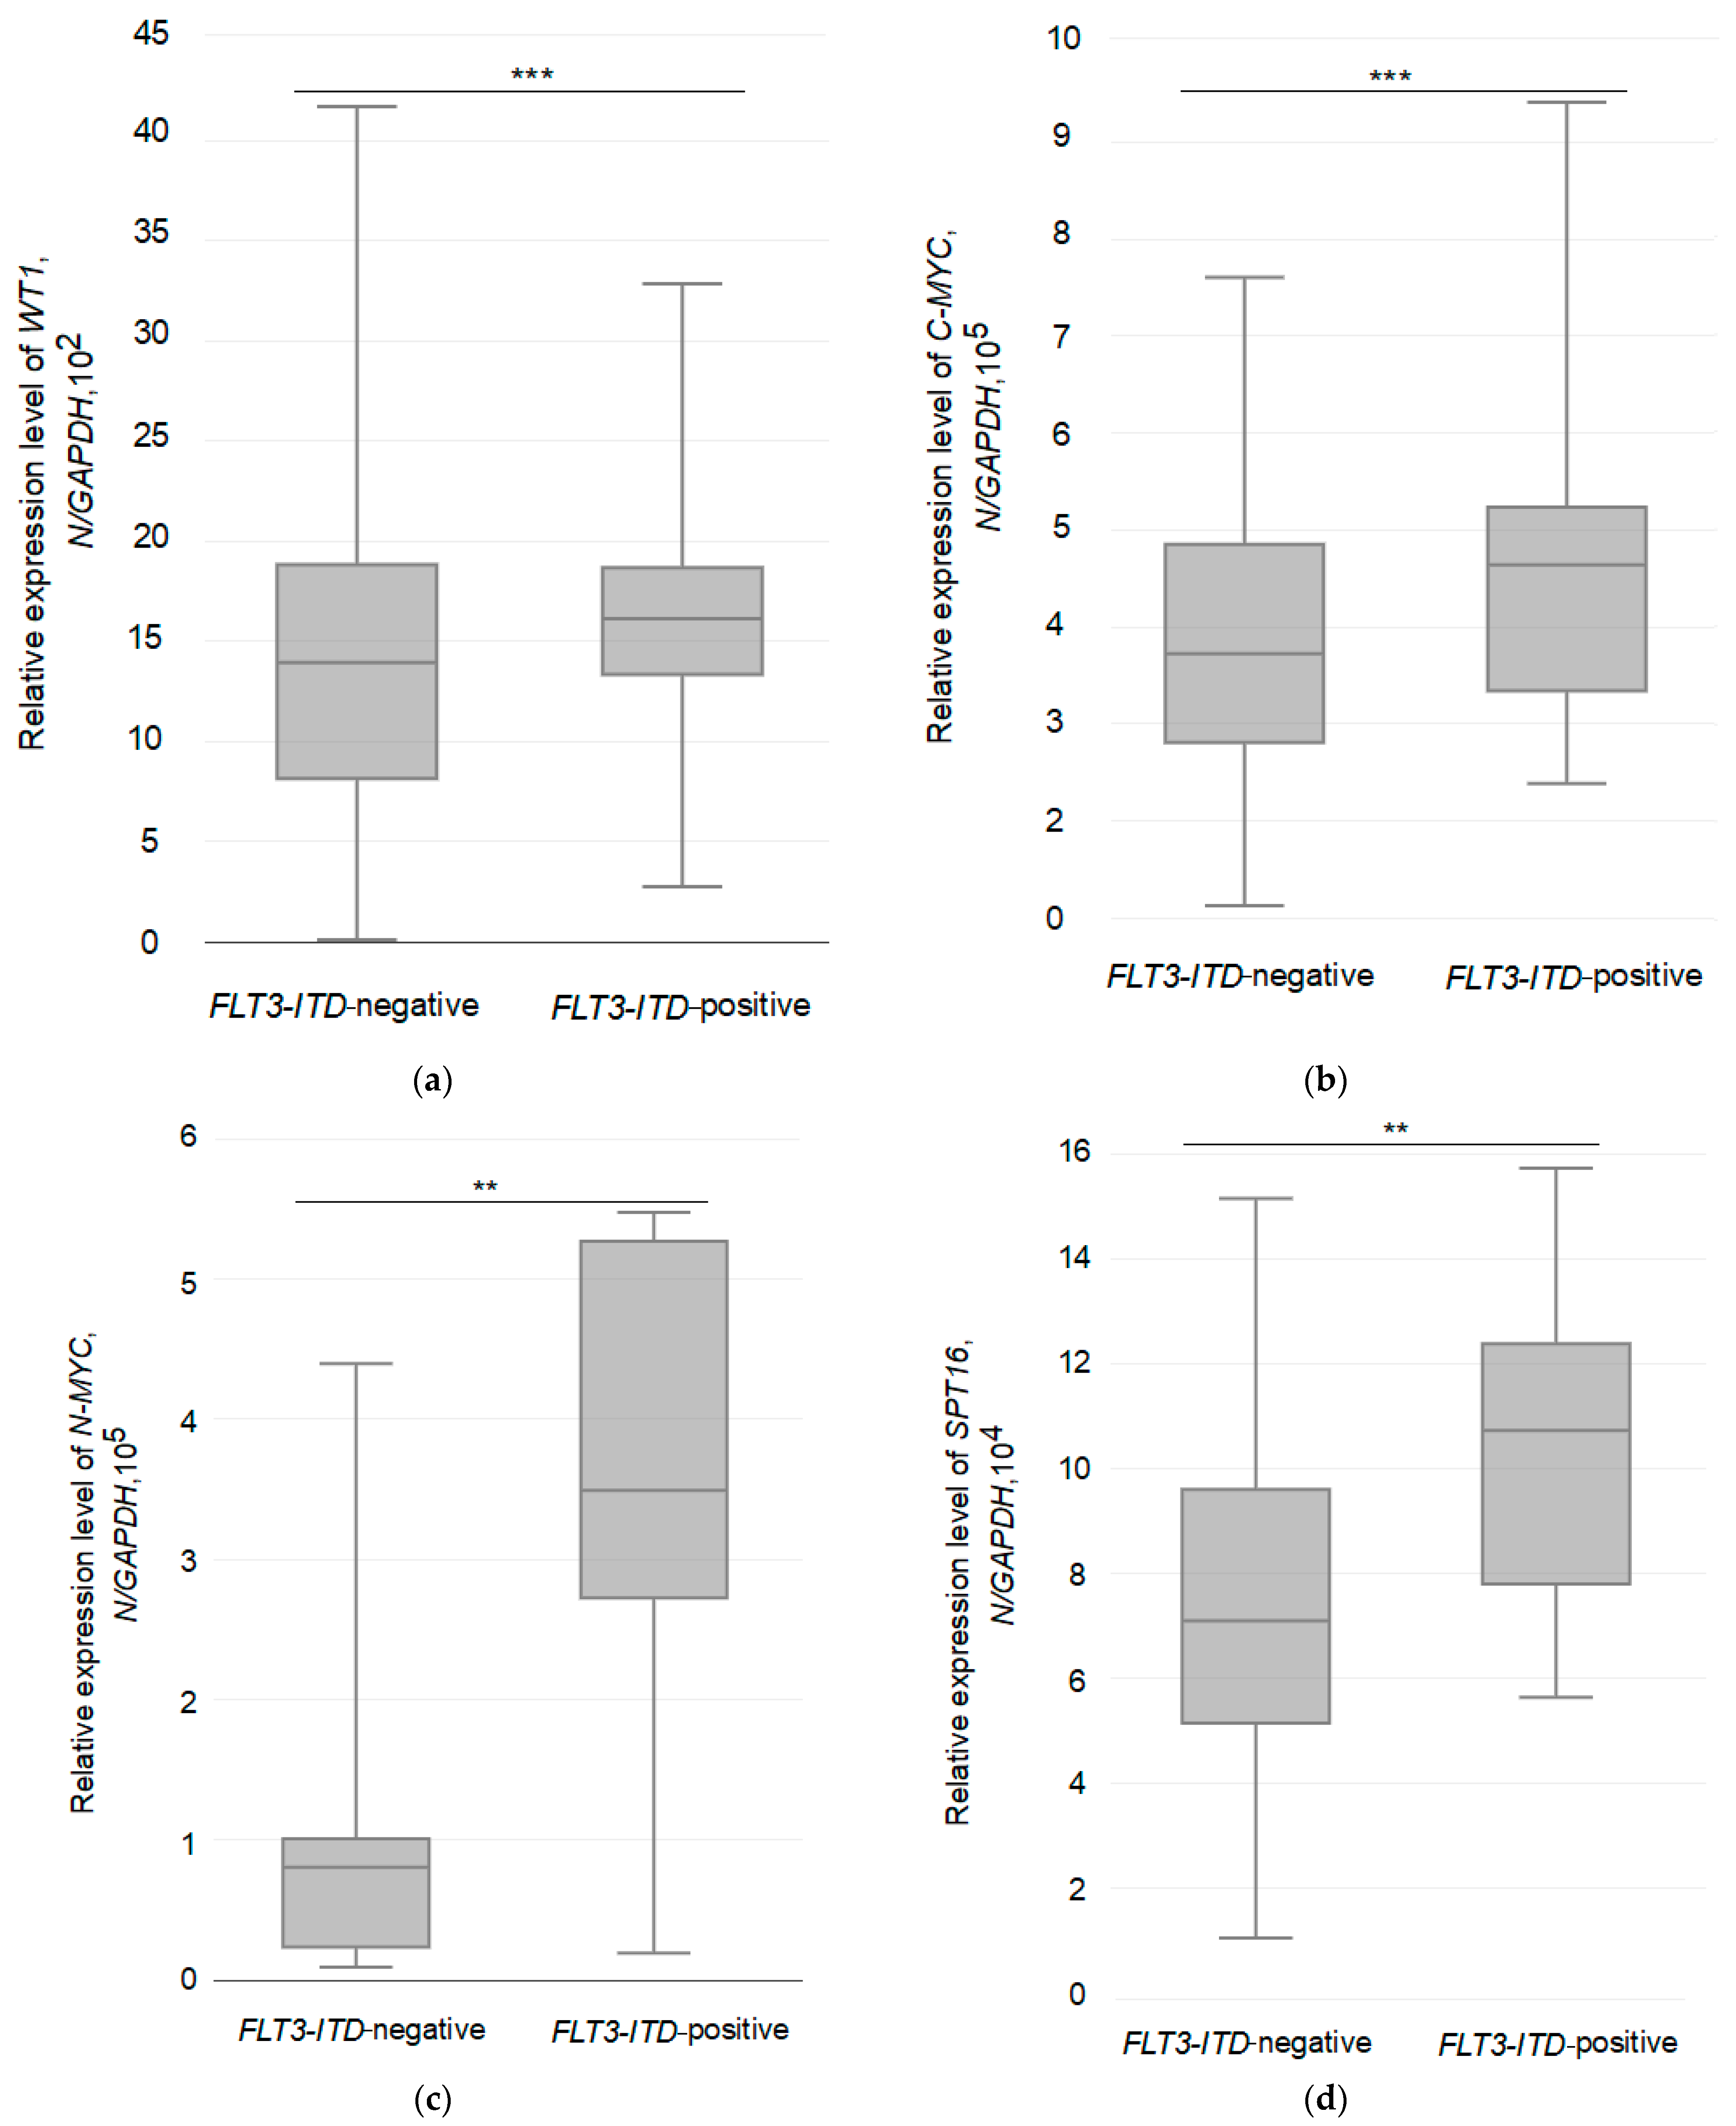
3.3. Relative Expression of the Studied Genes in Two Different Groups of AML Patients

The expression levels of several genes, including WT1, C-MYC, N-MYC, SPT16, AURKA, and AURKB, were quantitatively analyzed in all primary AML patients. The differences in gene expression data between the groups are shown in Figure 1a–f. According to the results of comparative analysis, the average expression levels of WT1 and C-MYC oncogenes were higher in FLT3-ITD mutation carriers: 1.6 × 10³/GAPDH and 4.6 × 10⁵/GAPDH (Table 3). Whereas, in the remaining patients belonging to the FLT3-ITD-negative group, the average expression level of WT1 and C-MYC oncogenes was lower and did not exceed the following values: 1.4 × 10³/GAPDH and 3.8 × 10⁵/GAPDH. Moreover, the average level of N-MYC oncogene expression was also higher in FLT3-ITD mutation carriers (3.4 × 10⁵/GAPDH) than in the group of FLT3-ITD-negative patients (0.8 × 10⁴/GAPDH). However, in contrast to the average expression levels of WT1 and C-MYC oncogenes, the average expression level of the N-MYC oncogene was markedly different in the FLT3-ITD-positive group compared to the negative group, exceeding it more than 3-fold, as shown in Figure 1a–c. Of note, N-MYC oncogene overexpression was detected in 2 FLT3-ITD-negative patients carrying AML1-ETO and in the majority (11 of 14, 78.5%) of FLT3-ITD-positive patients. Elevated C-MYC oncogene expression was detected in 13 AML patients, including FLT3-ITD-negative (AML1-ETO, n = 5; CBFβ-MYH11/A, n = 2; normal karyotype, n = 2) and FLT3-ITD-positive (n = 4) patients. In contrast, increased expression of the WT1 oncogene was detected in the majority of AML patients (39 of 44), regardless of the group to which they belonged.
As for the average expression levels of the SPT16, AURKA, and AURKB genes in the two different groups, they were highest in the FLT3-ITD-positive (1.0 × 10⁵/GAPDH, 4.2 × 10²/GAPDH and 3.1 × 10²/GAPDH) group (Table 3). In the FLT3-ITD-negative group, the mean expression levels of the SPT16, AURKA, and AURKB genes were lower and did not exceed the following values: 7.7 × 10⁴/GAPDH, 2.8 × 10²/GAPDH, 1.3 × 10²/GAPDH. The range of changes in the expression of the studied genes in both groups is shown in Figure 1d–f. Increased expression of SPT16 was detected in FLT3-ITD-positive (n = 9) and FLT3-ITD-negative (AML1-ETO, n = 5; CBFβ-MYH11/A, n = 4; normal karyotype, n = 2) patients. AURKA/B overexpression was detected in 1 patient carrying the FLT3-ITD mutation. Thus, despite a slight (WT1, C-MYC, AURKA, AURKB) or pronounced (SPT16, N-MYC) increase in the average expression level of the above mentioned genes in the FLT3-ITD-positive group compared to the FLT3-ITD-negative group, the difference between them was statistically significant only for four genes: WT1, C-MYC, N-MYC, and SPT16 (Table 3).

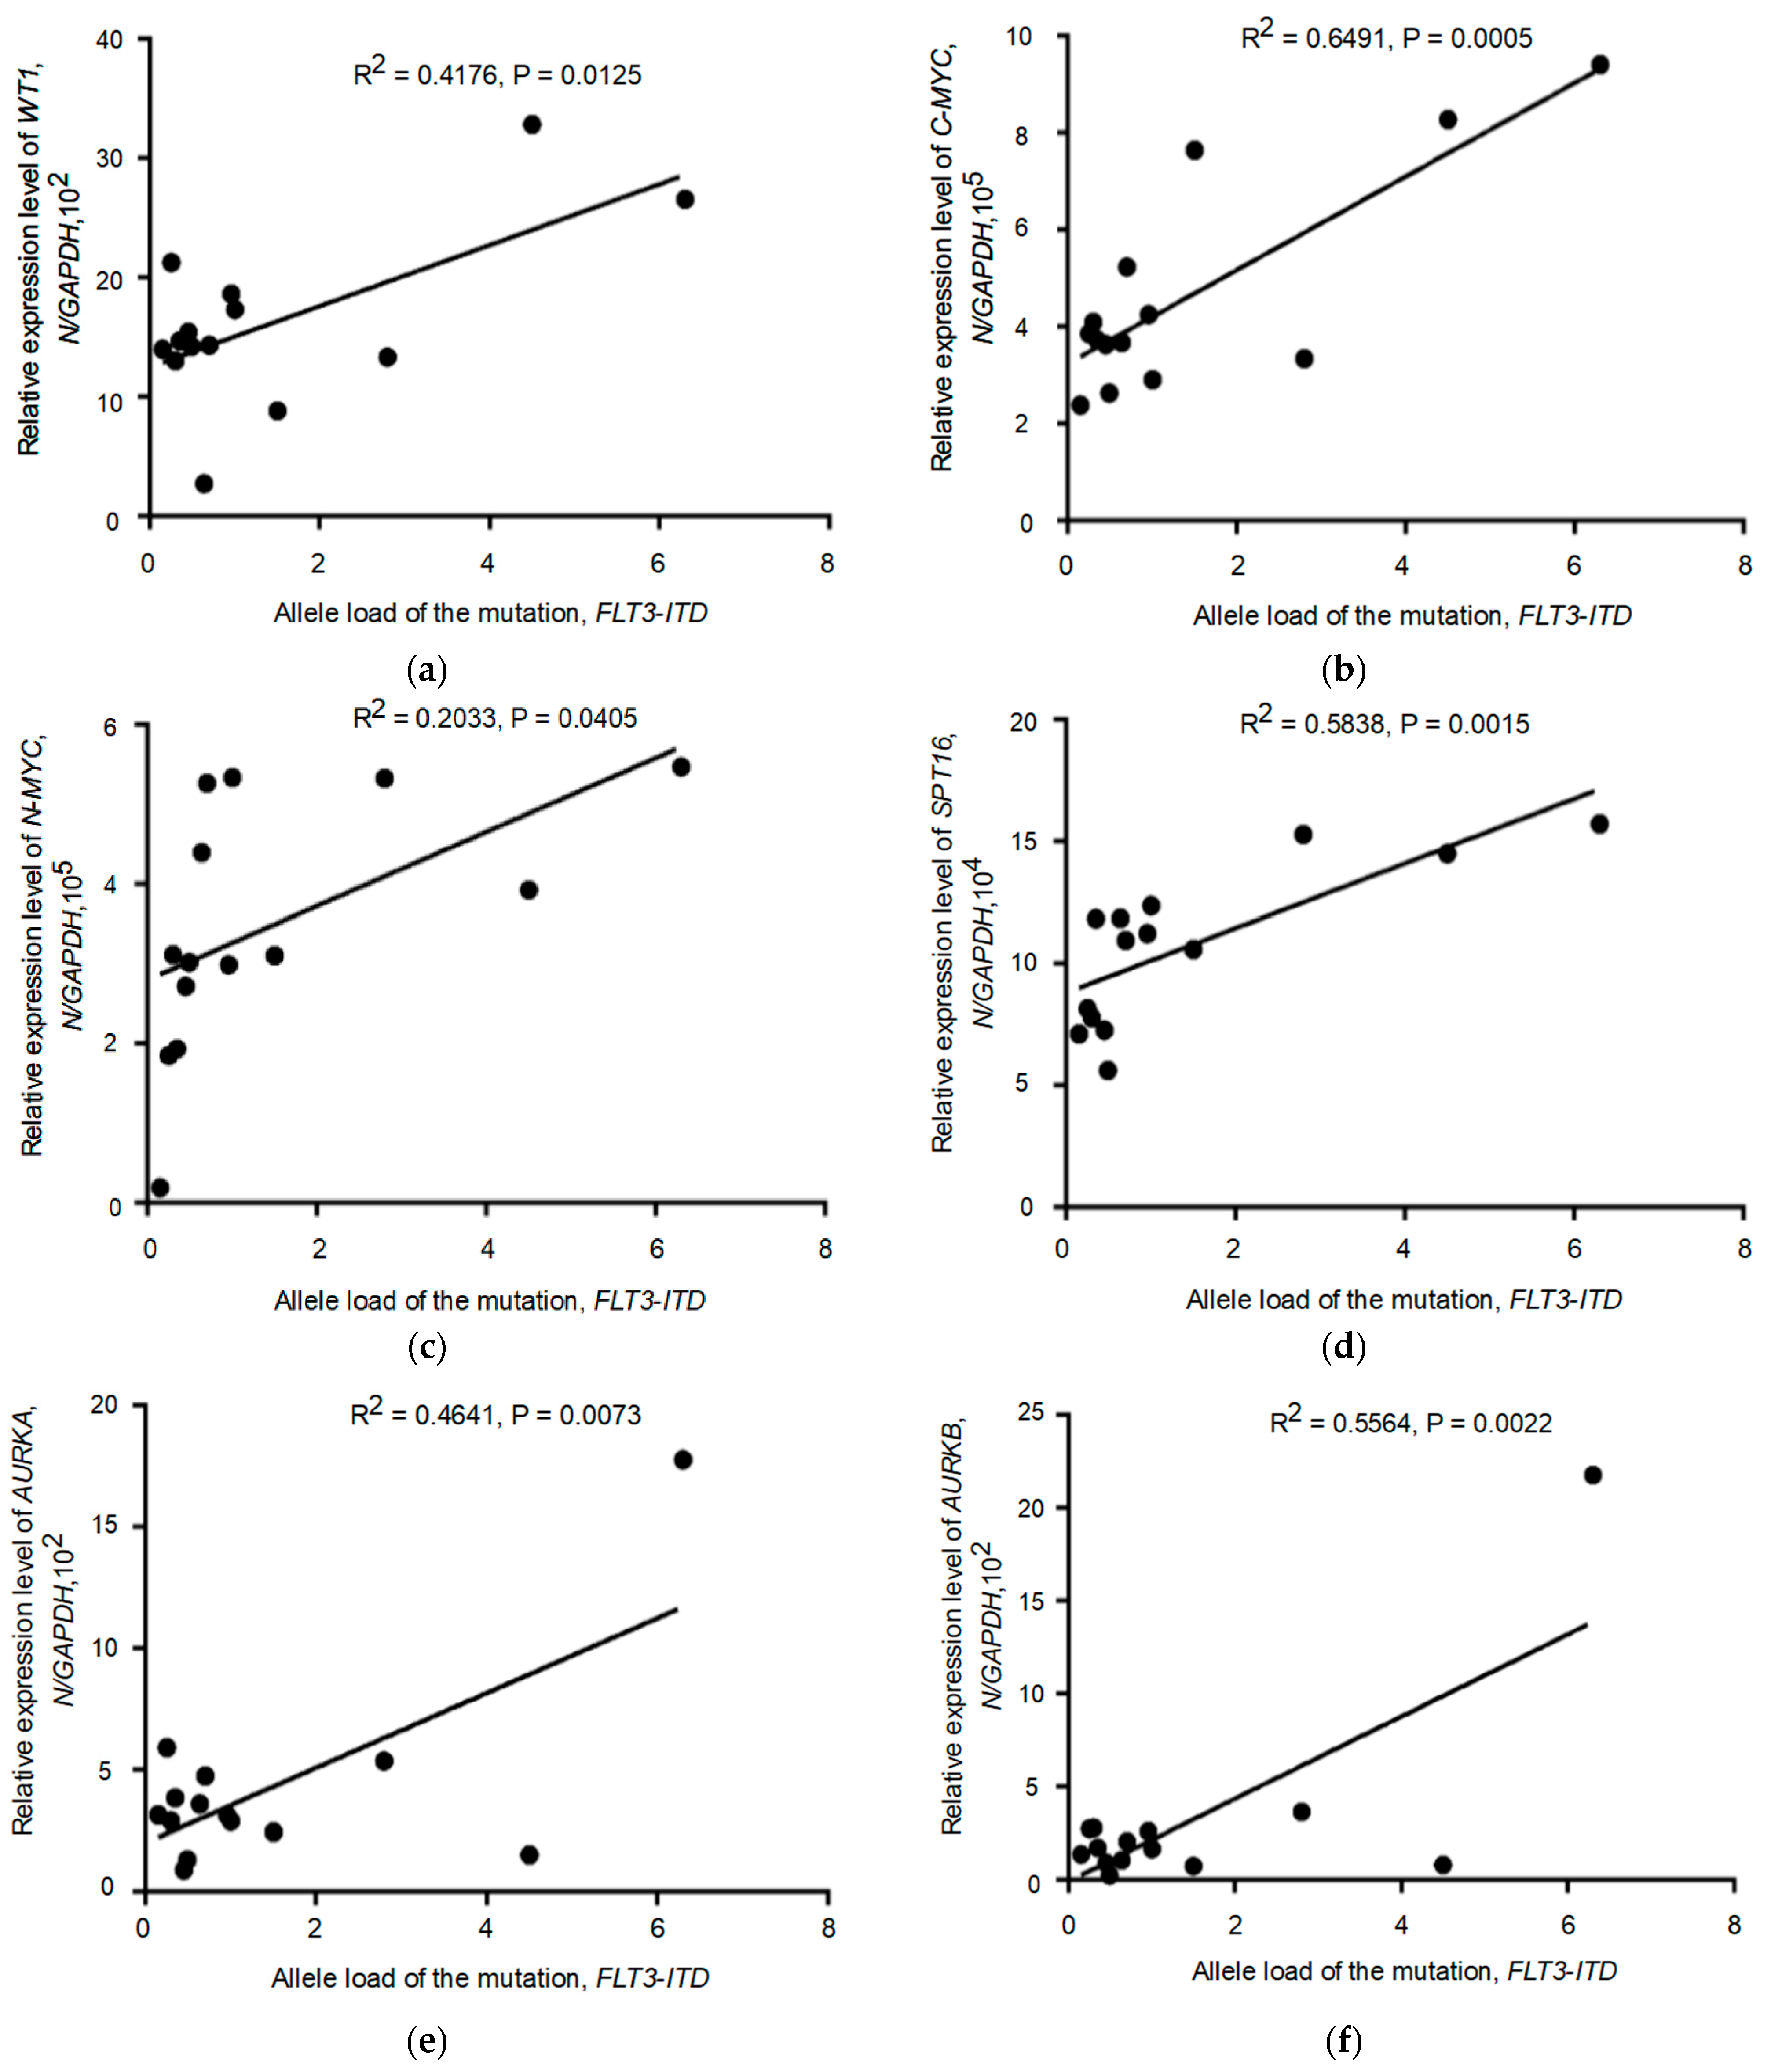
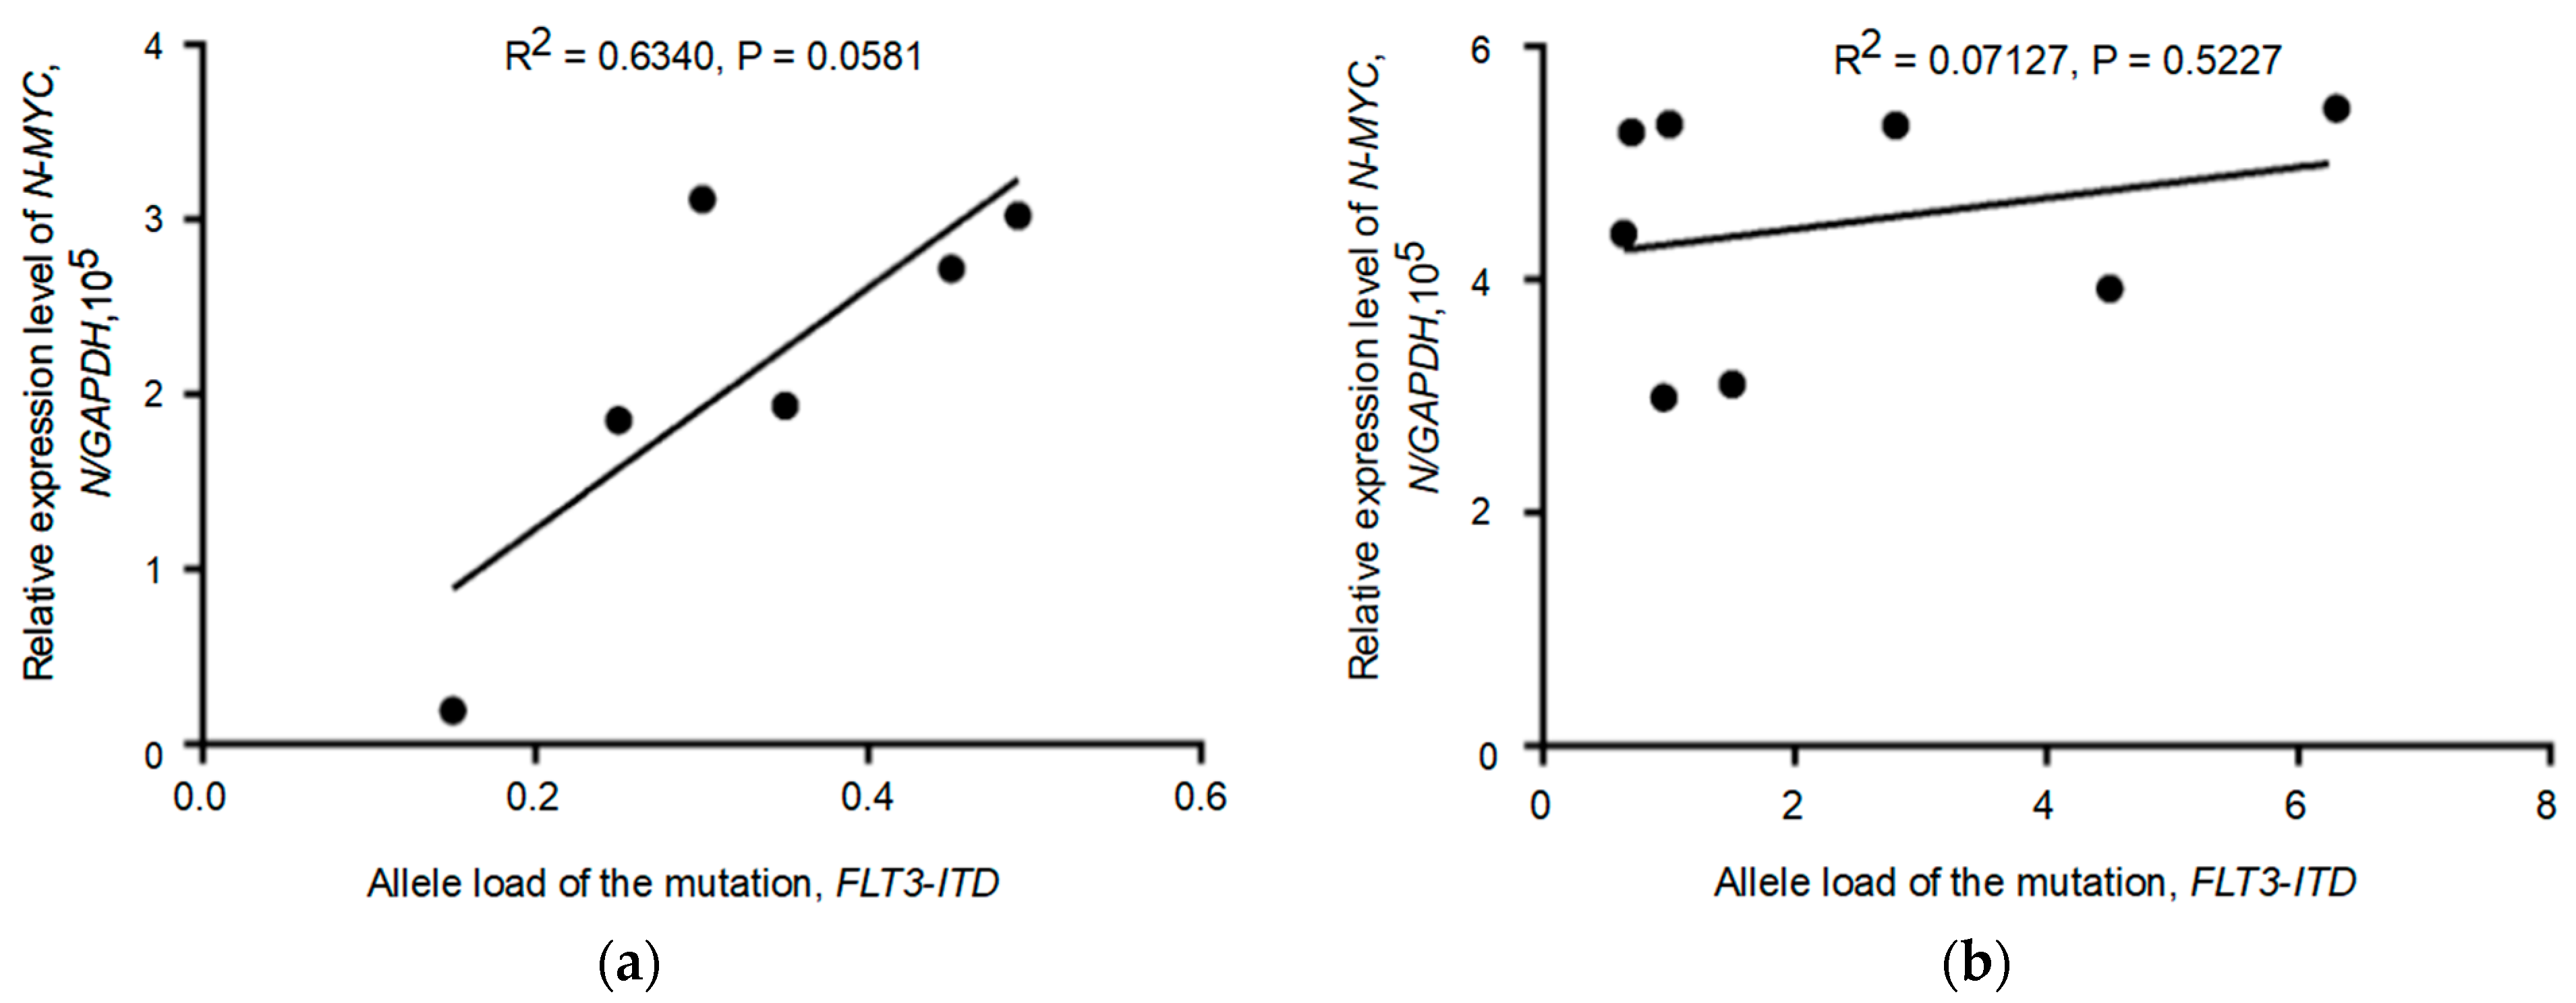
3.4. Relationship between the Expression of the Tested Genes and the Allelic Load of the FLT3-ITD Mutation

Correlation analysis was performed to determine the relationship between the relative expression level of the studied genes (WT1, C-MYC, N-MYC, SPT16, AURKA, AURKB) and the allelic load value of the FLT3-ITD mutation in the FLT3-ITD-positive group (Table S3). The results are shown in Figure 2a–f.
The expression levels of five genes (WT1, C-MYC, SPT16, AURKA, AURKB) were shown to correlate with increased FLT3-ITD allelic load (p = 0.0125, p = 0.0005, p = 0.0015, p = 0.0073, p = 0.0022). As for the N-MYC oncogene, correlation analysis showed a weak or absent association between N-MYC gene expression and FLT3-ITD allelic load in patients carrying the FLT3-ITD mutation (p = 0.0405). We then analyzed patients in two subgroups with FLT3-ITD allelic load thresholds above and below 0.5 (>0.5 vs. <0.5). In this case, we found no significant correlation between N-MYC expression and FLT3-ITD allelic load in both patient subgroups, as shown in Figure 3a,b.
We also determined the fold change of gene expression in patients carrying the FLT3-ITD mutation depending on allelic load. As a result, we found 1.1, 1.5, 1.6, 1.7, 2.0, and 2.6-fold increases in gene expression levels of WT1, SPT16, AURKA, C-MYC, N-MYC, and AURKB in FLT3-ITD mutation carriers with higher (>0.5) allelic load compared with FLT3-ITD carriers with lower (<0.5) allelic load, as shown in Figure 4a,b.

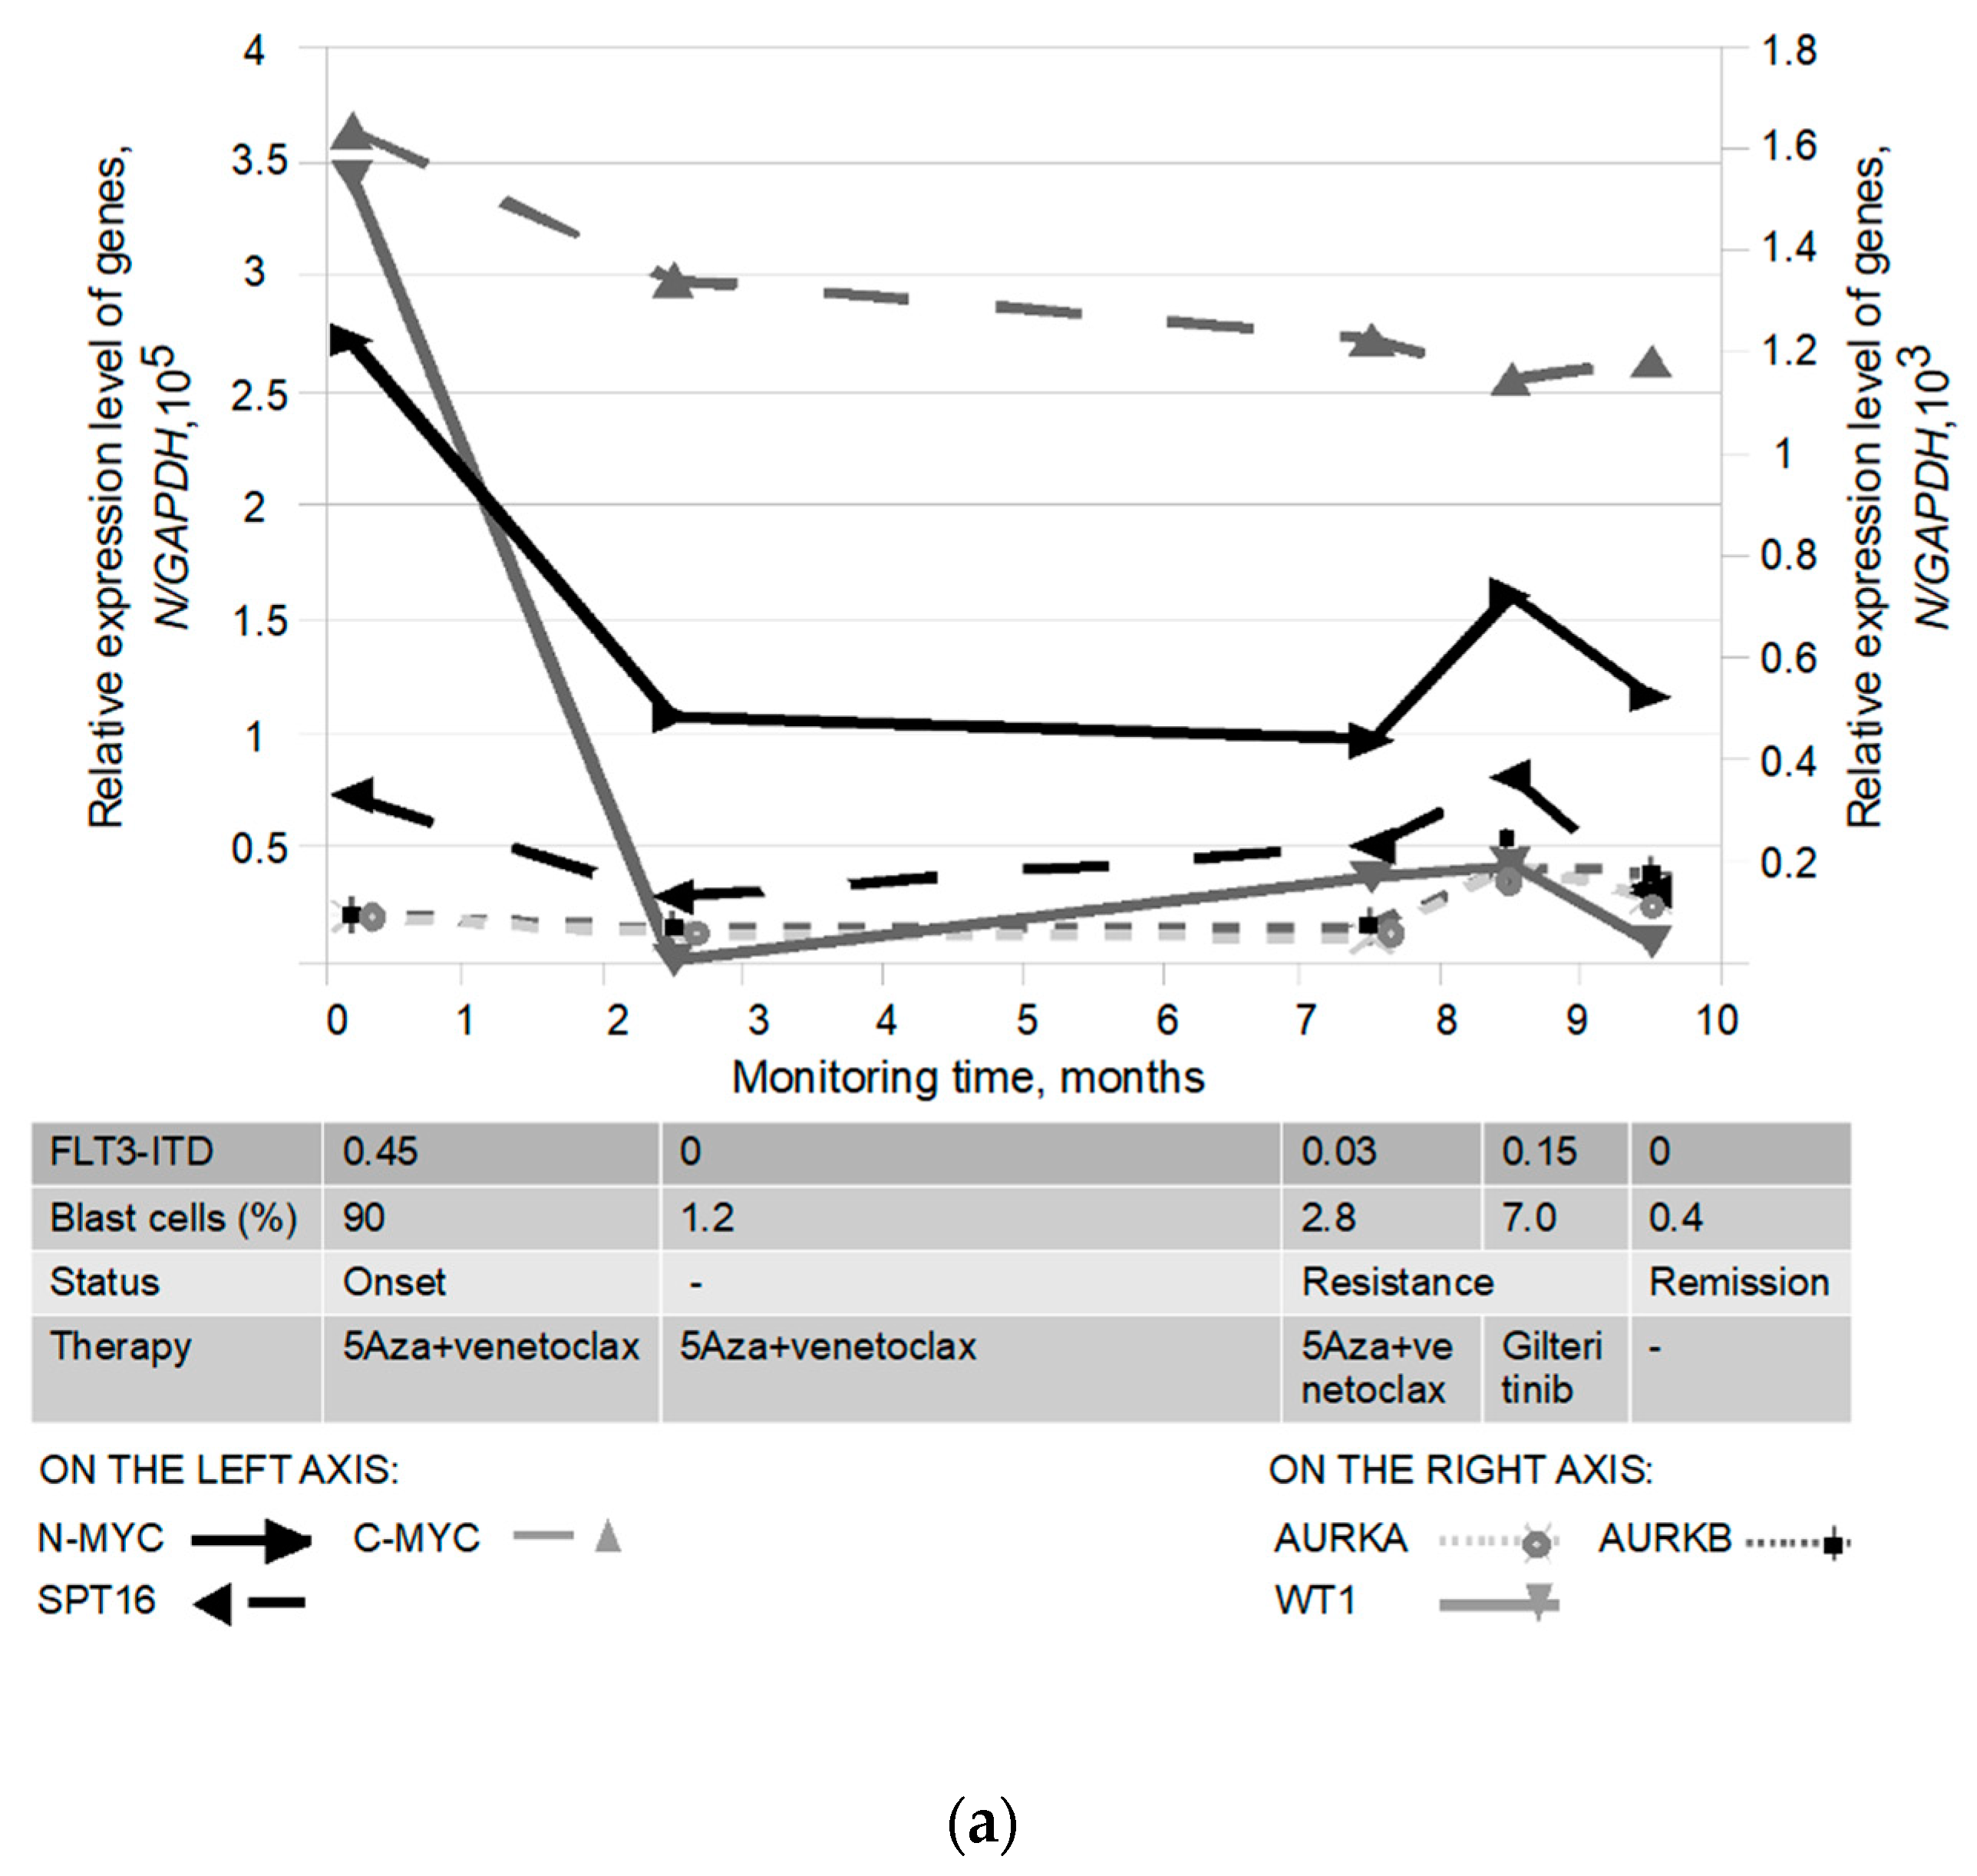
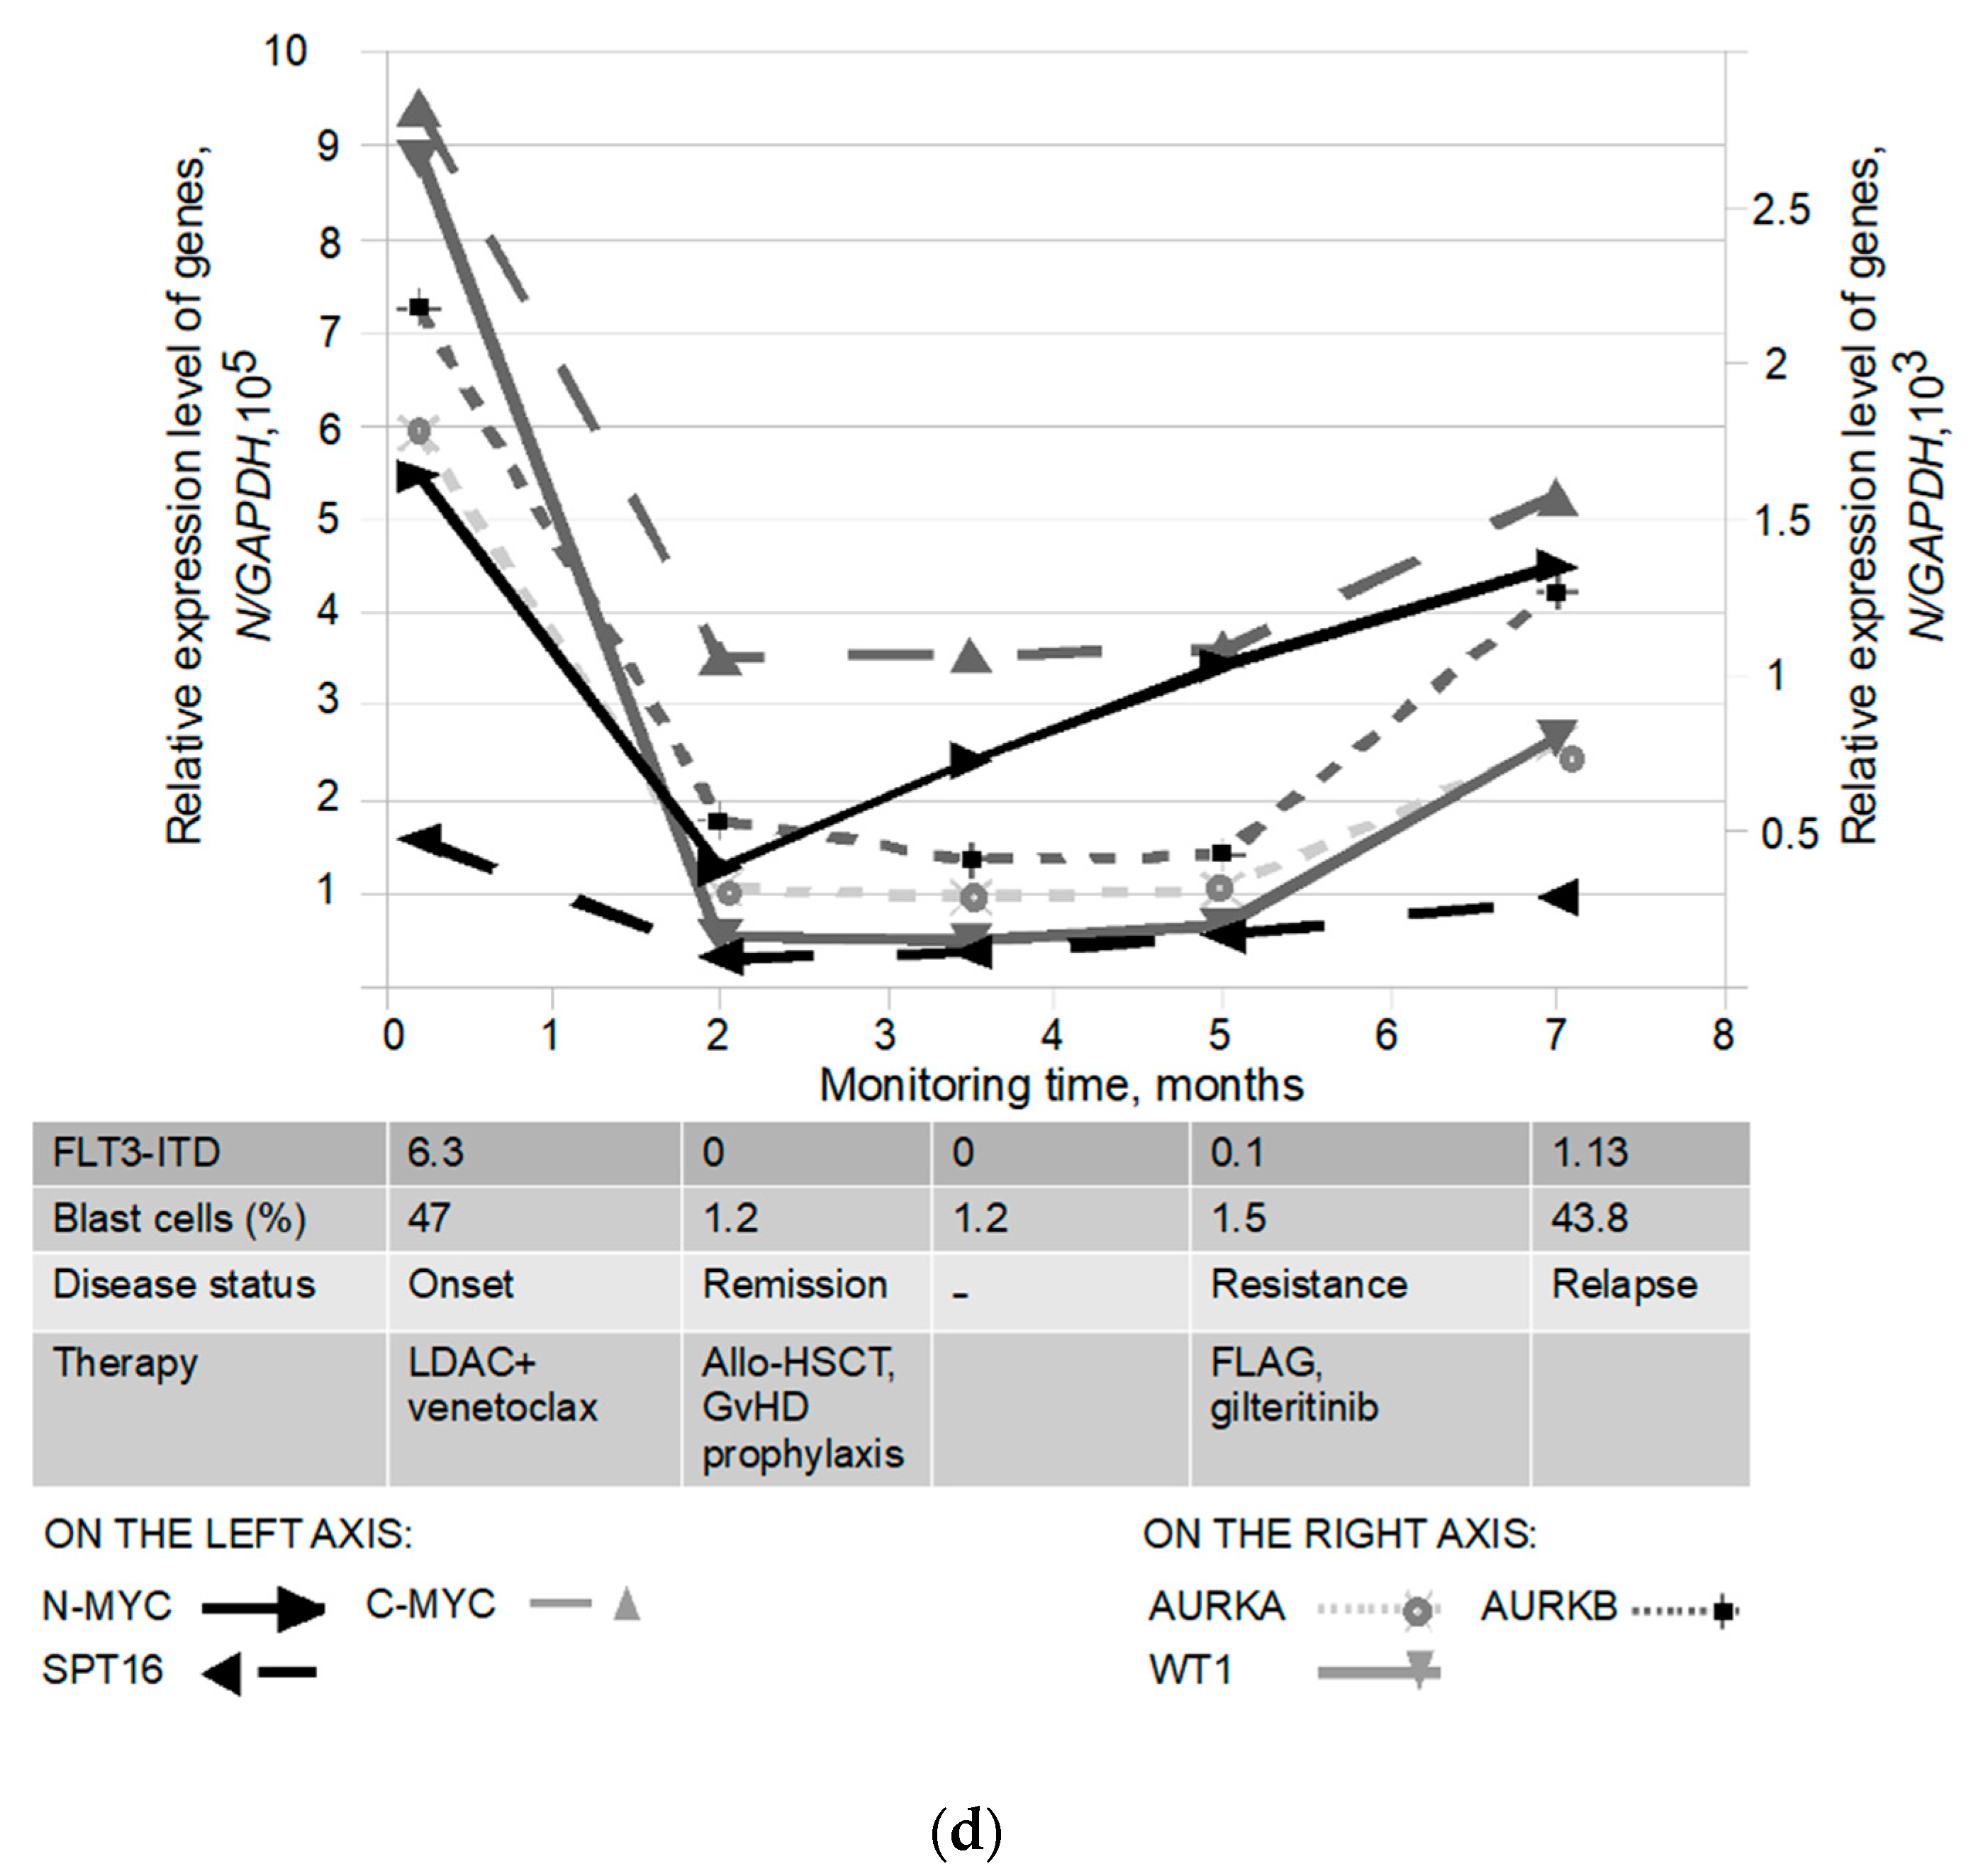
3.5. Biomarker Monitoring in FLT3-ITD Carriers Receiving Therapy

In addition, we assessed the allelic load of the FLT-ITD mutation and the expression levels of the studied genes (WT1, C-MYC, N-MYC, SPT16, AURKA, AURKB) in four patients who received therapy. The results of monitoring in the above patients (A, B, C, D) are presented in Table S4 and Figure 5a–d.
According to Figure 5a,b, two patients (A and B) had a low (0.45 and 0.49) FLT3-ITD allelic load in the onset of AML and simultaneously overexpressed N-MYC (2.7 and 3.0 × 10⁵/GAPDH) and WT1 (1.5 and 1.4 × 10³/GAPDH) oncogenes. After therapy, both patients achieved CHR and full molecular response. All investigated biomarkers of both patients returned to normal, including a decrease in N-MYC (WT1) oncogene expression. However, one of these patients (A), as mentioned above, was infected with SARS-CoV-2 one month after achieving remission, resulting in pulmonary failure and death. As shown in Figure 5c,d, the other two patients (C and D) initially had a high (2.8 and 6.3) FLT3-ITD allelic load and N-MYC overexpression (5.3 and 5.4 × 10⁵/GAPDH). Moreover, both patients had increased expression of the WT1 (1.3 and 2.6 × 10³/GAPDH) and SPT16 (1.52 and 1.57 × 10⁵/GAPDH) genes. However, only one of these patients had elevated AURKA and AURKB gene expression (1.7 and 2.1 × 10³/GAPDH). The first patient (C) received the tyrosine kinase inhibitor gilteritinib (120 mg/day; hematopoietic stem cell transplantation was not recommended because of cardiac parameters) after induction therapy. The patient achieved hematological remission with partial recovery of peripheral blood (platelet counts) and simultaneous reduction of FLT3-ITD allelic load (0.1). During 3 months of therapy, the expression of WT1, C-MYC, AURKA, AURKB decreased and did not exceed normal levels, whereas the expression of N-MYC (SPT16) increased. Four months later, the patient relapsed and died. The second patient (D) received myeloablative conditioning, allogeneic hematopoietic stem cell transplantation (allo-HSCT), and chemotherapy. During 3 months after transplantation, the FLT3-ITD allelic load was undetectable or reduced. At the same time, the expression of WT1, C-MYC, AURKA, AURKB, and SPT16 did not exceed normal values. On the contrary, N-MYC expression gradually increased. Five months after transplantation, the patient relapsed (blasts: 43.8%; FLT3-ITD: 1.13), resulting in a fatal outcome. Of note, N-MYC expression was significantly elevated in both patients after therapy, despite decreased FLT3-ITD allelic load. At the same time, the development of treatment resistance was observed in both patients.

4. Discussion

Initially, target oncogene mutations including FLT3 gene mutations were identified in the majority of primary AML patients (n = 35). Validation showed that the frequency of detected mutations did not differ from the data of other studies [35,36,37]. All patients were divided into two different groups. The first, FLT3-ITD-negative group consisted of carriers of other mutations (AML1-ETO, CBFβ-MYH11/A) and patients without detectable mutations (normal karyotype). The second, FLT3-ITD-positive group consisted of carriers of FLT3 gene mutations. In the FLT3-ITD-positive group of patients, we additionally assessed the allelic load and insertion length of FLT3 gene mutations. This study showed that patients with a lower (<0.5) FLT3-ITD allele load achieved CHR significantly more often than patients with a higher (>0.5) FLT3-ITD allele load (Table 1). This is consistent with data published previously [38]. However, we found no significant difference between subgroups of patients carrying a shorter or longer insertion (>39 bp vs. <39 bp) of the FLT3-ITD mutation with respect to achieving complete remission and the occurrence of fatal outcomes (Table 1). This conclusion is supported by analysis of larger patient populations in subgroups [39].
In addition, the expression levels of WT1, C-MYC, N-MYC, SPT16, AURKA, and AURKB genes were determined in all patients belonging to two different groups. The analysis showed that the average level of WT1 oncogene expression was higher in FLT3-ITD mutation carriers compared to FLT3-ITD-negative patients, carriers of other mutations (AML1-ETO, CBFβ-MYH11), or patients with normal karyotype (p = 0.0125). This is consistent with previously published data [40,41]. According to our analysis, overexpression of WT1 was detected in the majority (39 of 44, 88.6%) of patients studied. Increased expression of WT1 oncogene detected in the debut of AML is known to be an important prognostic indicator. Monitoring the expression of this biomarker makes it possible to determine MRD in patients receiving therapy, as well as to assess the risk of relapse [42].
According to the present study, there was an increase in the average level of C-MYC oncogene expression in both groups among patients with primary AML. However, the difference between the average levels of C-MYC expression in these groups was poorly pronounced. C-MYC overexpression was detected in 13 AML patients; 4 of whom were carriers of the FLT3-ITD mutation and the remaining 9 patients were carriers of other mutations (AML1-ETO or CBFβ-MYH11) or had normal karyotype. It should be noted that no unfavorable cytogenetic abnormalities that could lead to increased expression of the C-MYC oncogene were detected among all the patients studied, as previously shown [43]. One of the causes of C-MYC overexpression in AML may be the increased activity of the transcription factor BRG1 (SMARCA4), which binds to chromatin and is part of the SWI/SNF protein complex [44,45]. It is known that the transcription factor BRG1 is essential for the survival and maintenance of the self-renewal potential of AML cells (mouse cell lines carrying the cbfβ-myh11 or mll-af9 mutation). Another reason for C-MYC overexpression in AML may be the increased expression of the AML1 (RUNX1) gene. At least, a simultaneous increase in the expression levels of both genes is known to correlate with the pathogenesis of AML [46]. However, we did not determine the expression of BRG1 and AML1 genes.
It is interesting to note that this study revealed a more than 3-fold increase in the average level of N-MYC gene expression in the FLT3-ITD-positive group compared to the FLT3-ITD-negative group (p = 0.03946). At the same time, increased N-MYC oncogene expression was detected in the majority of patients (11 of 14, 78.5%) carrying the FLT3-ITD mutation. Previously, elevated N-MYC oncogene expression detected in children with AML and T-ALL has been shown to correlate with poor prognosis [19,47]. Only recently, it became known that, in mice with artificially induced myeloproliferative disease after injection of hematopoietic myeloid stem progenitors carrying the flt3-itd mutation, an increase in N-MYC oncogene expression was found [48]. N-MYC oncogene is known to promote stem cell self-renewal in BM and is one of the key genes whose transfection in healthy mice leads to AML development [19]. Recently, N-MYC overexpression was also found in children with neuroblastoma [49]. Later it was shown that overexpression of N-MYC oncogene in neuroblastoma cells is maintained with the participation of SPT16 transcription factor [50]. Both SPT16 and SSRP1 are part of the FACT (facilitates chromatin transcription) protein complex and participate in chromatin remodeling [51,52]. AURKA/B protein can also increase N-MYC expression in neuroblastoma. In this case, AURKA/B binds to N-MYC and prevents its ubiquitination with the participation of FBW7 ligase, which leads to the stabilization and accumulation of N-MYC in the cancer cell [53].
Interestingly, in the present study, we found a simultaneous 1.5-, 1.6-, 1.7-, 2.0-, and 2.6-fold increase in SPT16, AURKA, C-MYC, N-MYC, and AURKB gene expression in primary AML patients carrying a high (>0.5) FLT3-ITD mutation allelic load compared with low (<0.5) FLT3-ITD allelic load carriers. In contrast to all genes studied, whose expression correlated with increasing allelic load, N-MYC oncogene expression was moderately associated with low (<0.5: 0.15–0.49) allelic load and was independent of high (>0.5: 0.64–6.3) allelic load. It is known that FLT3-ITD mutation carriers with an allelic load of more than 0.5 have a markedly worse prognosis than patients with an allelic load of less than 0.5 [38]. Also, there is a view that the allelic load threshold (≥0.78) of the FLT3-ITD mutation is most suitable for an unfavorable prognosis. [7]. Some researchers believe that patients with a low (<0.5) FLT3-ITD allele load have a favorable prognosis if they are also carriers of NPM1 gene mutations [38]. Other researchers refute this statement [54]. It is possible that the number of copies of the mutant NPM1 gene could be relevant to the prognosis of FLT3-ITD-positive patients with different FLT3-ITD allelic load thresholds. However, in our case, this assumption may be true only in part. Thus, a reduced number (2–3, no multiplication by 100) of NPM1/A gene copies was found in 4 of 6 patients with a low (<0.5) allelic load of the FLT3-ITD mutation, whereas only 3 of 8 patients with a high (>0.5) allelic load of FLT3-ITD had an elevated number (11–25) of NPM1/A gene copies (data not shown). Thus, it is still unclear which additional causes may contribute to a worse prognosis in patients carrying the FLT3-ITD mutation. One such adverse phenomenon may be a 2-fold increase in N-MYC oncogene expression in carriers of the FLT3-ITD mutation with a high allelic load compared to carriers of FLT3-ITD with a low allelic load.
Biomarker monitoring in some FLT3-ITD carriers showed that patients with high allelic load and N-MYC (SPT16) overexpression were characterized by more pronounced resistance to treatment compared to FLT3-ITD carriers with low allelic load (Figure 5a–d). Thus, two patients (C, D), carriers of the FLT3-ITD mutation with a high allelic load, showed increasing resistance to treatment, in one case after gilteritinib therapy and in the other after allo-HSCT followed by therapy (FLAG+gilteritinib). At the same time, N-MYC expression levels were markedly elevated in both patients during the first 3 months after initiation of therapy, despite the reduced FLT3-ITD allelic load, which supports tumorigenesis. By analogy with neuroblastoma, we can assume that an additional transcription factor is required to maintain N-MYC oncogene expression in AML patients carrying the FLT3-ITD mutation. According to the results obtained on a limited group of patients with the FLT3-ITD mutation receiving therapy, we cannot claim that this factor is SPT16. However, it is interesting to note that both targets, N-MYC and SPT16, are involved in cohesin accumulation on chromatin, including the AT-rich pericentromeric region (where the FLT3 gene on chromosome 13q12 is localized), which could lead to replication stress and promote carcinogenesis. Testing this hypothesis regarding the involvement of N-MYC (SPT16) in the pathogenesis of AML, resulting in cohesin accumulation and impaired DNA replication, requires additional experiments using cell lines derived from FLT3-ITD-positive AML patients.

5. Conclusions

The present work shows that N-MYC overexpression is extremely weakly related to or independent of allelic load of the FLT3-ITD mutation in AML patients. In some FLT3-ITD carriers after gilteritinib treatment, a decrease in FLT3-ITD mutation allelic load is not always accompanied by a decrease in N-MYC expression, but instead may lead to its overexpression. This is associated with the emergence of treatment resistance and leukemia progression. Thus, simultaneous determination of FLT3-ITD mutation allelic load and N-MYC oncogene expression level is reasonable for both disease onset and MRD monitoring during the first three months after therapy. This will allow to more effectively predict the course of AML and prevent the development of relapses. However, the question of what contributes to increased N-MYC expression levels independently of FLT3-ITD remains open.

Supplementary Materials

The following supporting information can be downloaded at: https://www.mdpi.com/article/10.3390/pathophysiology30030024/s1. Table S1—Information on the comorbidities and sex of the study patients. Table S2—Nucleotide sequences of commercially synthesized oligonucleotides selected using the NCBI system. Table S3—Evaluation of relative expression levels of the studied genes (WT1, C-MYC, N-MYC, SPT16, AURKA, AURKB) and FLT3-ITD mutation including FLT3-ITD allele load in primary AML patients. Table S4—Biomarker monitoring in FLT3-ITD mutation carriers (n = 4) during therapy.

Author Contributions

Conceptualization, K.B. and A.Z.; methodology, K.B., E.K., Y.F., I.C., E.L., L.G., Y.O. and A.Z.; validation, K.B., E.K., Y.F., I.C., E.L., L.G., Y.O. and A.Z.; formal analysis, K.B., E.K., Y.F., I.C., E.L., L.G., Y.O. and A.Z.; investigation, K.B., E.K., Y.F., I.C., E.L., L.G., Y.O. and A.Z.; resources, K.B., E.K., Y.F., I.C., E.L., L.G., Y.O. and A.Z.; data curation, A.Z.; writing—original draft preparation, K.B.; writing—review and editing, K.B., E.K. and A.Z.; visualization, K.B.; supervision, A.Z.; project administration, A.Z.; funding acquisition, K.B., E.K., Y.F., I.C., E.L., L.G., Y.O. and A.Z. All authors have read and agreed to the published version of the manuscript.

Funding

This work was funded by the Ministry of Science and Higher Education of the Russian Federation (Agreement № 075-15-2022-301).

Institutional Review Board Statement

The study was carried out in compliance with the principles of the Helsinki Declaration of the World Medical Association with the consent of the Ethics Committee of the Federal State Budgetary Institution “Almazov National Medical Research Centre” of the Ministry of Health of the Russian Federation (conclusion of 31 October 2019).

Informed Consent Statement

Informed consent was obtained from all subjects involved in the study.

Data Availability Statement

The datasets presented in this article are not publicly available as all patient data are anonymized.

Conflicts of Interest

The authors declare no conflict of interest.

References

  1. Look, A.T. Oncogenic transcription factors in the human acute leukemias. Science 1997, 278, 1059–1064. [Google Scholar] [CrossRef] [PubMed] [Green Version]
  2. Caligiuri, M.A.; Strout, M.P.; Gilliland, D.G. Molecular biology of acute myeloid leukemia. Semin. Oncol. 1997, 24, 32–44. [Google Scholar] [PubMed]
  3. Schnittger, S.; Kohl, T.M.; Haferlach, T.; Kern, W.; Hiddemann, W.; Spiekermann, K.; Schoch, C. KIT-D816 mutations in AML1-ETO-positive AML are associated with impaired event-free and overall survival. Blood 2006, 107, 1791–1799. [Google Scholar] [CrossRef] [Green Version]
  4. Caligiuri, M.A.; Strout, M.P.; Lawrence, D.; Arthur, D.C.; Baer, M.R.; Yu, F.; Knuutila, S.; Mrózek, K.; Oberkircher, A.R.; Marcucci, G.; et al. Rearrangement of the ALL(MLL) in acute myeloid leukemia with normal cytogenetic. Cancer Res. 1998, 58, 55–59. [Google Scholar]
  5. Kim, H.G.; Kojima, K.; Swindle, C.S.; Cotta, C.V.; Huo, Y.; Reddy, V.; Clug, C.A. FLT3-ITD cooperates with inv(16) to promote progression to acute myeloid leukemia. Blood 2008, 111, 1567–1574. [Google Scholar] [CrossRef] [PubMed] [Green Version]
  6. Dovey, O.M.; Cooper, J.L.; Mupo, A.; Grove, C.S.; Lynn, C.; Conte, N.; Andrews, R.M.; Pacharne, S.; Tzelepis, K.; Vijayabaskar, M.S.; et al. Molecular synergy underlies the co-occurrence patterns and phenotype of NPM1-mutant acute myeloid leukemia. Blood 2017, 130, 1911–1922. [Google Scholar] [CrossRef] [Green Version]
  7. Thiede, C.; Steudel, C.; Mohr, B.; Schaich, M.; Schakel, U.; Platzbecker, U.; Wermke, M.; Bornhäuser, M.; Ritter, M.; Neubauer, A.; et al. Analysis of FLT3 activating mutations in 979 patients with acute myelogenous leukemia: Association with FAB subtypes and identifica-tion of subgroups with poor prognosis. Blood 2002, 99, 4326e35. [Google Scholar] [CrossRef] [Green Version]
  8. Akiki, S.; Dyer, S.A.; Grimwade, D.; Ivey, A.; Abou-Zeid, N.; Borrow, J.; Jeffries, S.; Caddick, J.; Newell, H.; Begum, S.; et al. NUP98-NSD1 fusion in association with FLT3-ITD mutation identifies a prognostically relevant subgroup of pediatric acute myeloid leukemia patients suitable for monitoring by real time quantitative PCR. Genes Chromosomes Cancer 2013, 52, 1053–1064. [Google Scholar] [CrossRef]
  9. Oyarzo, M.P.; Lin, P.; Glassman, A.; Bueso-Ramos, C.E.; Luthra, R.; Medeiros, L.J. Acute myeloid leukemia with t(6;9)(p23;q34) is associated with dysplasia and a high frequency of flt3 gene mutations. Am. J. Clin. Pathol. 2004, 122, 348–358. [Google Scholar] [CrossRef]
  10. Stirewalt, D.L.; Radich, J.P. The role of FLT in haematopoietic malignancies. Nat. Rev. Cancer 2003, 3, 650–665. [Google Scholar] [CrossRef]
  11. Daver, N.; Schlenk, R.F.; Russell, N.H.; Levis, M.J. Targeting FLT3 mutations in AML: Review of current knowledge and evidence. Leukemia 2019, 33, 299–312. [Google Scholar] [CrossRef] [Green Version]
  12. Kiyoi, H.; Kawashima, N.; Ishikawa, Y. FLT3 mutations in acute myeloid leukemia: Therapeutic paradigm beyond inhibitor development. Cancer Sci. 2020, 111, 312–322. [Google Scholar] [CrossRef] [PubMed] [Green Version]
  13. Zheng, R.; Small, D. Mutant FLT3 signalling contributes to a block in myeloid differentiation. Leuk. Lymphoma 2005, 46, 1679–1687. [Google Scholar] [CrossRef] [PubMed]
  14. Al-Mawali, A.; Gillis, D.; Lewis, I. Immunoprofiling of leukemic stem cells CD34+/CD38−/CD123+ delineate FLT3/ITD-positive clones. J. Hematol. Oncol. 2016, 9, 61. [Google Scholar] [CrossRef] [PubMed] [Green Version]
  15. Kiyoi, H.; Towatari, M.; Yokota, S.; Hamaguchi, M.; Ohno, R.; Saito, H.; Naoe, T. Internal tandem duplication of the FLT3 gene is a novel modality of elongation mutation which causes constitutive activation of the product. Leukemia 1998, 12, 1333–1337. [Google Scholar] [CrossRef] [PubMed] [Green Version]
  16. Li, L.; Piloto, O.; Kim, K.T.; Ye, Z.; Nguyen, H.B.; Yu, X.; Levis, M.; Cheng, L.; Small, D. FLT3/ITD expression increases expansion, survival and entry into cell cycle of human haematopoietic stem/progenitor cells. Br. J. Haematol. 2007, 137, 64–75. [Google Scholar] [CrossRef] [PubMed]
  17. Chatterjee, A.; Ghosh, J.; Ramdas, B.; Mali, R.S.; Martin, H.; Kobayashi, M.; Vemula, S.; Canela, V.H.; Waskow, E.R.; Visconte, V.; et al. Regulation of Stat5 by FAK and PAK1 in Oncogenic FLT3- and KIT-Driven Leukemogenesis. Cell Rep. 2014, 9, 1333–1348. [Google Scholar] [CrossRef] [Green Version]
  18. Handschuh, L.; Kaźmierczak, M.; Milewski, M.C.; Góralski, M.; Łuczak, M.; Wojtaszewska, M.; Uszczyńska-Ratajczak, B.; Lewandowski, K.; Komarnicki, M.; Figlerowicz, M. Gene expression profiling of acute myeloid leukemia samples from adult patients with AML-M1 and -M2 through boutique microarrays, real-time PCR and droplet digital PCR. Int. J. Oncol. 2018, 52, 656–678. [Google Scholar] [CrossRef] [PubMed] [Green Version]
  19. Kawagoe, H.; Kandilci, A.; Kranenburg, T.A.; Grosveld, G.C. Overexpression of N-Myc rapidly causes acute myeloid leukemia in mice. Cancer Res. 2007, 67, 10677–10685. [Google Scholar] [CrossRef] [Green Version]
  20. Murakami-Tonami, Y.; Ikeda, H.; Yamagishi, R.; Inayoshi, M.; Inagaki, S.; Kishida, S.; Komata, Y.; Jan Koster Takeuchi, I.; Kondo, Y.; Maeda, T.; et al. SGO1 is involved in the DNA damage response in MYCN-amplified neuroblastoma cells. Sci. Rep. 2016, 6, 31615. [Google Scholar] [CrossRef] [Green Version]
  21. Mullenders, J.; Aranda-Orgilles, B.; Lhoumaud, P.; Keller, M.; Pae, J.; Wang, K.; Kayembe, C.; Rocha, P.P.; Raviram, R.; Gong, Y.; et al. Cohesin loss alters adult hematopoietic stem cell homeostasis, leading to myeloproliferative neoplasms. J. Exp. Med. 2015, 212, 1833–1850. [Google Scholar] [CrossRef]
  22. Yang, M.; Pan, Z.; Huang, K.; Büsche, G.; Liu, H.; Göhring, G.; Rumpel, R.; Dittrich-Breiholz, O.; Talbot, S.; Scherr, M.; et al. A unique role of p53 haploinsufficiency or loss in the development of acute myeloid leukemia with FLT3-ITD mutation. Leukemia 2022, 36, 675–686. [Google Scholar] [CrossRef]
  23. Bogdanov, K.V.; Nikulina, T.S.; Lomaia, E.G.; Slyadnev, M.N.; Zaritskey, A.Y. Identification of oncogene mutations in leukemia patients using microchip-based PCR analysis. Russ. J. Bioorganic Chem. 2017, 43, 544–551. [Google Scholar] [CrossRef]
  24. Gabert, J.; Beillard, E.; van der Velden, V.H.; Bi, W.; Grimwade, D.; Pallisgaard, N.; Barbany, G.; Cazzaniga, G.; Cayuela, J.M.; Cavé, H.; et al. Standardization and quality control studies of ‘real-time’ quantitative reverse transcriptase polymerase chain reaction of fusion gene transcripts for residual disease detection in leukemia—A Europe Against Cancer program. Leukemia 2003, 17, 2318–2357. [Google Scholar] [CrossRef] [Green Version]
  25. Beillard, E.; Pallisgaard, N.; van der Velden, V.H.; Bi, W.; Dee, R.; van der Schoot, E.; Delabesse, E.; Macintyre, E.; Gottardi, E.; Saglio, G.; et al. Evaluation of candidate control genes for diagnosis and residual disease detection in leukemic patients using ‘real-time’ quantitative reverse-transcriptase polymerase chain reaction (RQ-PCR)—A Europe against cancer program. Leukemia 2003, 17, 2474–2486. [Google Scholar] [CrossRef] [Green Version]
  26. Garçon, L.; Libura, M.; Delabesse, E.; Valensi, F.; Asnafi, V.; Berger, C.; Schmitt, C.; Leblanc, T.; Buzyn, A.; Macintyre, E. DEK-CAN molecular monitoring of myeloid malignancies could aid therapeutic stratification. Leukemia 2005, 19, 1338–1344. [Google Scholar] [CrossRef] [Green Version]
  27. Shah, A.; Sharma, A.; Katiyar, S.; Gupta, A.; Chaturvedi, C.P. Upfront Screening by Quantitative Real-Time PCR Assay Identifies NUP98::NSD1 Fusion Transcript in Indian AML Patients. Diagnostics 2022, 12, 3001. [Google Scholar] [CrossRef] [PubMed]
  28. Murphy, K.M.; Levis, M.; Hafez, M.J.; Geiger, T.; Cooper, L.C.; Smith, B.D.; Small, D.; Berg, K.D. Detection of FLT3 internal tandem duplication and D835 mutations by a multiplex polymerase chain reaction and capillary electrophoresis assay. J. Mol. Diagn. 2003, 5, 96–102. [Google Scholar] [CrossRef] [PubMed] [Green Version]
  29. Döhner, K.; Schlenk, R.F.; Habdank, M.; Scholl, C.; Rücker, F.G.; Corbacioglu, A.; Bullinger, L.; Fröhling, S.; Döhner, H. Mutant nucleophosmin (NPM1) predicts favorable prognosis in younger adults with acute myeloid leukemia and normal cytogenetics: Interaction with other gene mutations. Blood 2005, 106, 3740–4976. [Google Scholar] [CrossRef] [Green Version]
  30. Riera, L.; Marmont, F.; Toppino, D.; Frairia, C.; Sismondi, F.; Audisio, E.; Di Bello, C.; D’Ardia, S.; Di Celle, P.F.; Messa, E.; et al. Core binding factor acute myeloid leukaemia and c-KIT mutations. Oncol. Rep. 2013, 29, 1867–1872. [Google Scholar] [CrossRef] [Green Version]
  31. Østergaard, M.; Olesen, L.H.; Hasle, H.; Kjeldsen, E.; Hokland, P. WT1 gene expression: An excellent tool for monitoring minimal residual disease in 70% of acute myeloid leukaemia patients—Results from a single-centre study. Br. J. Haematol. 2004, 125, 590–600. [Google Scholar] [CrossRef]
  32. Gorello, P.; Cazzaniga, G.; Alberti, F.; Dell’Oro, M.G.; Gottardi, E.; Specchia, G.; Roti, G.; Rosati, R.; Martelli, M.F.; Diverio, D.; et al. Quantitative assessment of minimal residual disease in acute myeloid leukemia carrying nucleophosmin (NPM1) gene mutations. Leukemia 2006, 20, 1103–1108. [Google Scholar] [CrossRef] [Green Version]
  33. Verma, R.; Babu, A. Human Chromosomes: Manual of Basic Techniques; Pergamon Press: New York, NY, USA, 1989; pp. 45–67. [Google Scholar]
  34. Liu, S.B.; Dong, H.J.; Bao, X.B.; Qiu, Q.C.; Li, H.Z.; Shen, H.J.; Ding, Z.X.; Wang, C.; Chu, X.L.; Yu, J.Q.; et al. Impact of FLT3-ITD length on prognosis of acute myeloid leukemia. Haematologica 2019, 104, e9–e12. [Google Scholar] [CrossRef] [Green Version]
  35. Sallmyr, A.; Fan, J.; Datta, K.; Kim, K.; Grosu, D.; Shapiro, P.; Small, D.; Rassool, F. Internal tandem duplication of FLT3 (FLT3/ITD) induces increased ROS production, DNA damage, and misrepair: Implications for poor prognosis in AML. Blood 2007, 111, 3173–3182. [Google Scholar] [CrossRef] [Green Version]
  36. Grimwade, D.; Walker, H.; Oliver, F.; Wheatley, K.; Harrison, C.; Harrison, G.; Rees, J.; Hann, I.; Stevens, R.; Burnett, A.; et al. The importance of diagnostic cytogenetics on outcome in AML: Analysis of 1612 patients entered into the MRC AML 10 trial. The Medical Research Council Adult and Children’s Leukaemia Working Parties. Blood 1998, 92, 2322–2333. [Google Scholar] [CrossRef] [PubMed] [Green Version]
  37. Becker, H.; Marcucci, G.; Maharry, K.; Margeson, D.; Whitman, S.P.; Wu, Y.Z.; Schwind, S.; Paschka, P.; Powell, B.L.; Carter, T.H.; et al. Favorable prognostic impact of NPM1 mutations in older patients with cytogenetically normal de novo acute myeloid leukemia and associated gene- and microRNA-expression signatures: A Cancer and Leukemia Group B study. J. Clin. Oncol. 2010, 28, 596–604. [Google Scholar] [CrossRef] [Green Version]
  38. Döhner, H.; Estey, E.; Grimwade, D.; Amadori, S.; Appelbaum, F.R.; Büchner, T.; Dombret, H.; Ebert, B.L.; Fenaux, P.; Larson, R.A.; et al. Diagnosis and management of AML in adults: 2017 ELN recommendations from an international expert panel. Blood 2017, 129, 424–447. [Google Scholar] [CrossRef] [PubMed] [Green Version]
  39. Castaño-Bonilla, T.; Alonso-Dominguez, J.M.; Barragán, E.; Rodríguez-Veiga, R.; Sargas, C.; Gil, C.; Chillón, C.; Vidriales, M.B.; García, R.; Martínez-López, J.; et al. Prognostic significance of FLT3-ITD length in AML patients treated with intensive regimens. Sci Rep. 2021, 11, 20745. [Google Scholar] [CrossRef] [PubMed]
  40. Giudice, V.; Gorrese, M.; Vitolo, R.; Bertolini, A.; Marcucci, R.; Serio, B.; Guariglia, R.; Ferrara, I.; Pepe, R.; D’Alto, F.; et al. WT1 Expression Levels Combined with Flow Cytometry Blast Counts for Risk Stratification of Acute Myeloid Leukemia and Myelodysplastic Syndromes. Biomedicines 2021, 9, 387. [Google Scholar] [CrossRef] [PubMed]
  41. Spassov, B.V.; Stoimenov, A.S.; Balatzenko, G.N.; Genova, M.L.; Peichev, D.B.; Konstantinov, S.M. Wilms’ tumor protein and FLT3-internal tandem duplication expression in patients with de novo acute myeloid leukemia. Hematology 2011, 16, 37–42. [Google Scholar] [CrossRef]
  42. Cilloni, D.; Renneville, A.; Hermitte, F.; Hills, R.K.; Daly, S.; Jovanovic, J.V.; Gottardi, E.; Fava, M.; Schnittger, S.; Weiss, T.; et al. Real-time quantitative polymerase chain reaction detection of minimal residual disease by standardized WT1 assay to enhance risk stratification in acute myeloid leuke 511 mia: A European Leukemia Net study. J. Clin. Oncol. 2009, 27, 5195–5201. [Google Scholar] [CrossRef]
  43. Hsiao, T.H.; Wang, R.C.; Lu, T.J.; Shih, C.H.; Su, Y.C.; Tsai, J.R.; Jhan, P.P.; Lia, C.S.; Chuang, H.N.; Chang, K.H.; et al. Chemoresponse of de novo Acute Myeloid Leukemia to “7+3” Induction can Be Predicted by c-Myc-facitated Cytogenetics. Front. Pharmacol. 2021, 12, 649267. [Google Scholar] [CrossRef]
  44. Shi, J.; Whyte, W.A.; Zepeda-Mendoza, C.J.; Milazzo, J.P.; Shen, C.; Roe, J.S.; Minder, J.L.; Mercan, F.; Wang, E.; Eckersley-Maslin, M.A.; et al. Role of SWI/SNF in acute leukemia maintenance and enhancer-mediated Myc regulation. Genes Dev. 2013, 27, 2648–2662. [Google Scholar] [CrossRef] [PubMed] [Green Version]
  45. Pulikkan, J.A.; Hegde, M.; Ahmad, H.M.; Belaghzal, H.; Illendula, A.; Yu, J.; O’Hagan, K.; Ou, J.; Muller-Tidow, C.; Wolfe, S.A.; et al. CBFβ-SMMHC Inhibition Triggers Apoptosis by Disrupting MYC Chromatin Dynamics in Acute Myeloid Leukemia. Cell 2018, 174, 172–186.e21. [Google Scholar] [CrossRef] [Green Version]
  46. Krygier, A.; Szmajda-Krygier, D.; Sałagacka-Kubiak, A.; Jamroziak, K.; Żebrowska-Nawrocka, M.; Balcerczak, E. Association between the CEBPA and c-MYC genes expression levels and acute myeloid leukemia pathogenesis and development. Med. Oncol. 2020, 37, 109. [Google Scholar] [CrossRef] [PubMed]
  47. Astolfi, A.; Vendemini, F.; Urbini, M.; Melchionda, F.; Masetti, R.; Franzoni, M.; Libri, V.; Serravalle, S.; Togni, M.; Paone, G.; et al. MYCN is a novel oncogenic target in pediatric T-cell acute lymphoblastic leukemia. Oncotarget 2014, 5, 120–130. [Google Scholar] [CrossRef] [Green Version]
  48. Basit, F.; Andersson, M.; Hultquist, A. The Myc/Max/Mxd Network Is a Target of Mutated Flt3 Signaling in Hematopoietic Stem Cells in Flt3-ITD-Induced Myeloproliferative Disease. Stem Cells Int. 2018, 2018, 3286949. [Google Scholar] [CrossRef] [PubMed]
  49. Alaminos, M.; Mora, J.; Cheung, N.K.; Smith, A.; Qin, J.; Chen, L.; Gerald, W.L. Genome-wide analysis of gene expression associated with MYCN in human neuroblastoma. Cancer Res. 2003, 63, 4538–4546. [Google Scholar] [PubMed]
  50. Carter, D.R.; Murray, J.; Cheung, B.B.; Gamble, L.; Koach, J.; Tsang, J.; Sutton, S.; Kalla, H.; Syed, S.; Gifford, A.J.; et al. Therapeutic targeting of the MYC signal by inhibition of histone chaperone FACT in neuroblastoma. Sci. Transl. Med. 2015, 7, 312ra176. [Google Scholar] [CrossRef] [Green Version]
  51. Orphanides, G.; Wu, W.H.; Lane, W.S.; Hampsey, M.; Reinberg, D. The chromatin-specifictranscription elongation factor FACT comprises human SPT16 and SSRP1 proteins. Nature 1999, 577, 284–288. [Google Scholar] [CrossRef]
  52. Belotserkovskaya, R.; Oh, S.; Bondarenko, V.A.; Orphanides, G.; Studitsky, V.M.; Reinberg, D. FACT facilitates transcription-dependent nucleosome alteration. Science 2003, 301, 1090–1093. [Google Scholar] [CrossRef] [PubMed] [Green Version]
  53. Otto, T.; Horn, S.; Brockmann, M.; Eilers, U.; Schüttrumpf, L.; Popov, N.; Kenney, A.M.; Schulte, J.H.; Beijersbergen, R.; Christiansen, H.; et al. Stabilization of N-Myc is a critical function of Aurora A in human neuroblastoma. Cancer Cell 2009, 15, 67–78. [Google Scholar] [CrossRef] [PubMed] [Green Version]
  54. Sakaguchi, M.; Yamaguchi, H.; Najima, Y.; Usuki, K.; Ueki, T.; Oh, I.; Mori, S.; Kawata, E.; Uoshima, N.; Kobayashi, Y.; et al. Prognostic impact of low allelic ratio FLT3-ITD and NPM1 mutation in acute myeloid leukemia. Blood Adv. 2018, 2, 2744–2754. [Google Scholar] [CrossRef] [PubMed] [Green Version]
Figure 1. Range of changes in relative expression level of the studied genes in different groups in AML patients. (a,b) *** p < 0.01, (c,d) ** p < 0.05, (e,f) * p > 0.05, the above p-values were calculated by one-way ANOVA with Bonferroni’s post-test for multiple analysis, which shows the difference between the patient groups studied: FLT3-ITD-negative and FLT3-ITD-positive (Table 3).
Pathophysiology 30 00024 g001aPathophysiology 30 00024 g001b
Figure 2. Evaluation of the relationship between the relative expression level of the studied gene and the value of FLT3-ITD allelic load in AML patients carrying the FLT3-ITD mutation. (af) Relative expression level of WT1, C-MYC, N-MYC, SPT16, AURKA, AURKB genes in FLT3-ITD mutation carriers.
Pathophysiology 30 00024 g002
Figure 3. Evaluation of the relationship between the relative level of N-MYC oncogene expression and FLT3-ITD allelic load in patient subgroups with different allelic load thresholds (>0.5 vs. <0.5). (a,b) Diving patients carrying the FLT3-ITD mutation into two subgroups based on the detection of a high (>0.5) or low (<0.5) allelic load showed no significant association between N-MYC expression and FLT3-ITD allelic load in the patient subgroups studied.
Pathophysiology 30 00024 g003
Figure 4. Fold change of gene expression normalized to GAPDH in two subgroups of patients with different allelic load of FLT3-ITD mutation (>0.5 vs. <0.5). (a) Fold change of N-MYC, C-MYC, SPT16, (b) WT1, AURKA, AURKB gene expression in studied subgroups of patients.
Pathophysiology 30 00024 g004
Figure 5. Monitoring of biomarkers in AML patients; carriers of the FLT3-ITD mutation after therapy. (a,b) Quantification of gene expression in some patients with low or (c,d) high allele load of FLT3-ITD mutation.
Pathophysiology 30 00024 g005aPathophysiology 30 00024 g005bPathophysiology 30 00024 g005c
Table 1. Two groups of AML patients, according to the detected target mutations (n = 44).
The Group of Patients and the Frequency of Mutations
FLT3-ITD-NegativeFLT3-ITD-Positive
t(8;21)(q22;q22)
AML1-ETO , n ′ = 13, 29.5%;
inv16(p13;q21)
CBFβ-MYH11 , n = 8, 18.2%;
normal karyotype,
46XX, n = 4, 46XY, n = 5, 20.4%
FLT3-ITD *, n = 14, 31.8%;
′—number of patients in the group, NPM1/A, n = 3, NPM1/A, n = 2, *—NPM1/A, n = 7, —1 of 14 patients had both FLT3-ITD and FLT3-TKD mutations.
Table 2. Achievement of remission and survival in FLT3-ITD-positive group, depending on insertion length and allelic load value.
Number of Patients in the Group, n FLT3-ITD Mutationχ2 Test, Fisher’s Test, p-Value
Achievement of complete hematological remission
YesNoInsertion lengthχ2, F, p
33<39 bp0.000, 1.0000, p > 0.05
44>39bp
Survival
AliveDeadInsertion lengthχ2, F, p
24<39 bp0.389, 0.67204, p > 0.05
44>39 bp
Achievement of complete hematological remission
YesNoAllelic loadχ2, F, p
60<0.510.500, 0.00233, p < 0.05
17>0.5
Survival
AliveDeadAllelic loadχ2, F, p
51 <0.57.024, 0.02564, p < 0.05
17>0.5
†—patient mortality was caused by SARS-CoV-2.
Table 3. Relative expression of the tested genes in FLT3-ITD-negative and FLT3-ITD-positive groups of AML patients.
Group of PatientsNumber of
Patients, n
Average Level of Gene
Expression (N */GAPDH)
ANOVA with Bonferroni’s Post-Test: F-Stat, p-Value
WT1
FLT3-ITD-negative3014428.1005, 0.008042
FLT3-ITD-positive141625
C-MYC
FLT3-ITD-negative30380,5389.2243, 0.005011
FLT3-ITD-positive14465,038
N-MYC
FLT3-ITD-negative3080,5094.651, 0.03946
FLT3-ITD-positive14347,762
SPT16
FLT3-ITD-negative3077,4684.6288, 0.0399
FLT3-ITD-positive14107,399
AURKA
FLT3-ITD-negative302861.8963, 0.179
FLT3-ITD-positive14425
AURKB
FLT3-ITD-negative301320.04112, 0.8407
FLT3-ITD-positive14316
*—number of copies of the gene under study.
Disclaimer/Publisher’s Note: The statements, opinions and data contained in all publications are solely those of the individual author(s) and contributor(s) and not of MDPI and/or the editor(s). MDPI and/or the editor(s) disclaim responsibility for any injury to people or property resulting from any ideas, methods, instructions or products referred to in the content.

