
The Effect of Sodium Tetrafluoroborate on the Properties of Conversion Coatings Formed on the AZ91D Magnesium Alloy by Plasma Electrolytic Oxidation
 , ,
, , 
Abstract
:
1. Introduction
2. Materials and Methods
2.1. Preparation of Specimens
2.2. Plasma Electrolytic Oxidation (PEO) Process
2.3. Characterization of the Coatings
3. Results and Discussion
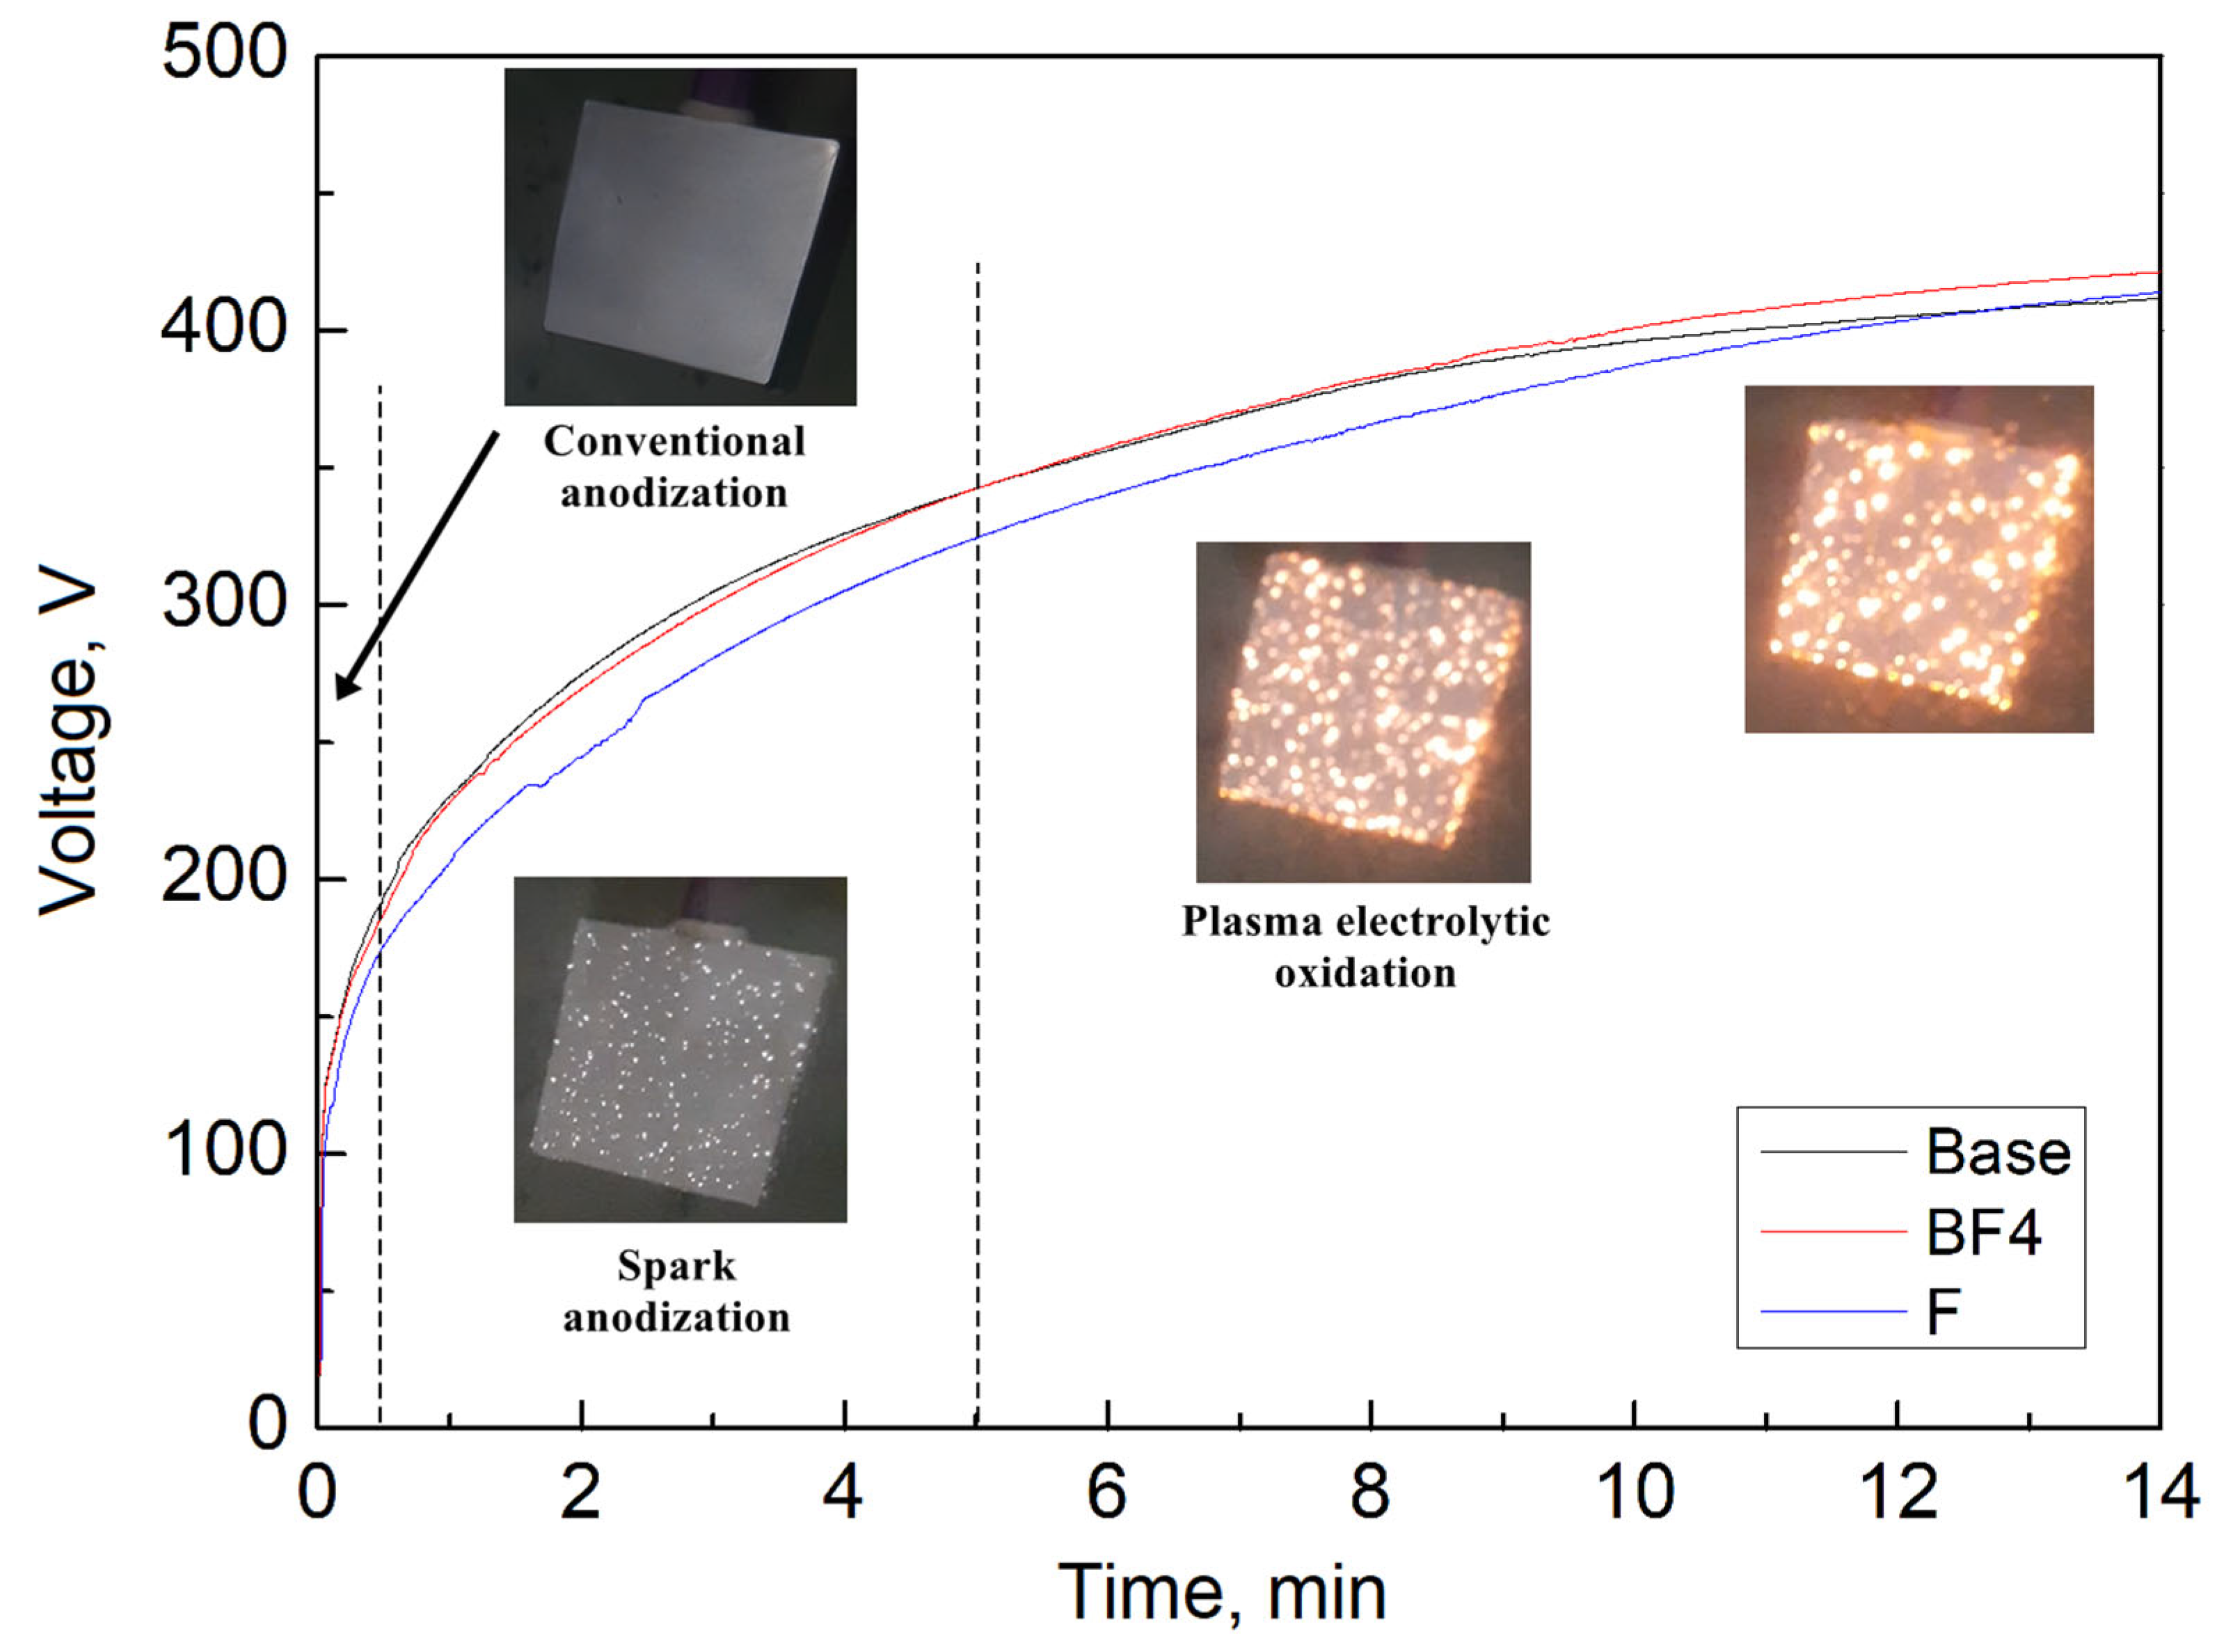
3.1. Voltage-Time Responses during PEO Process
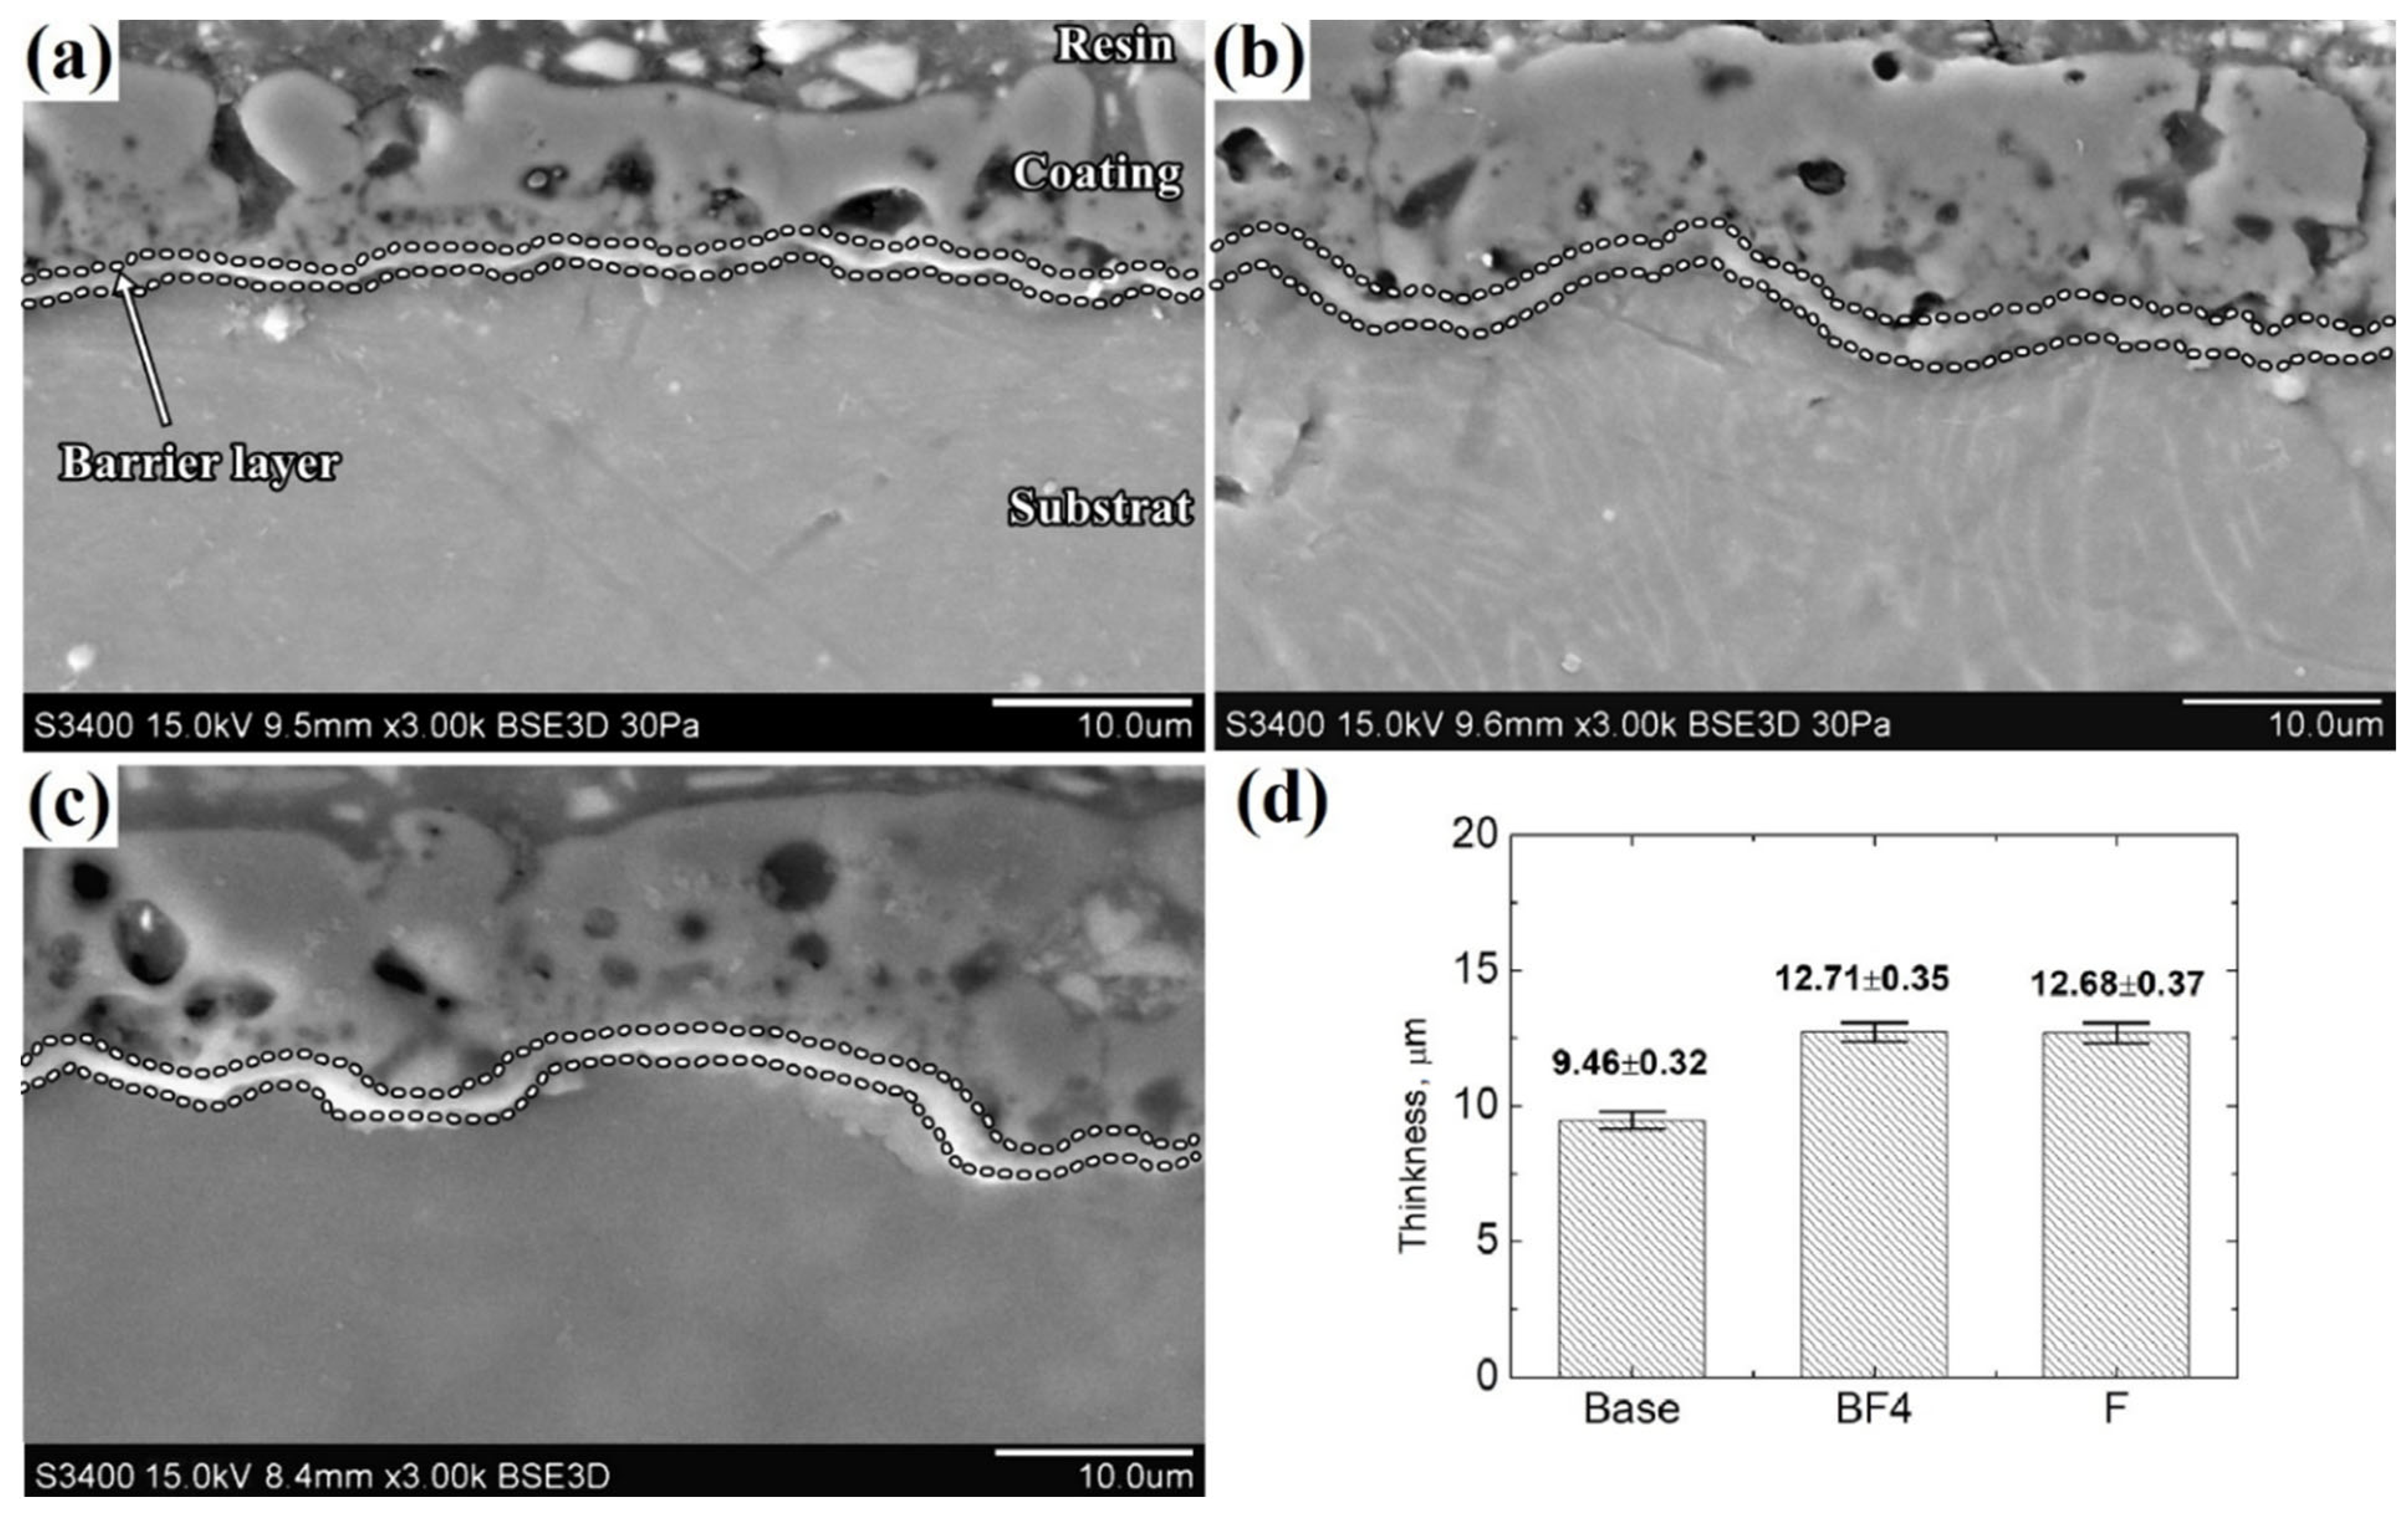
3.2. Surface and Cross-Sectional Morphology of PEO Coatings
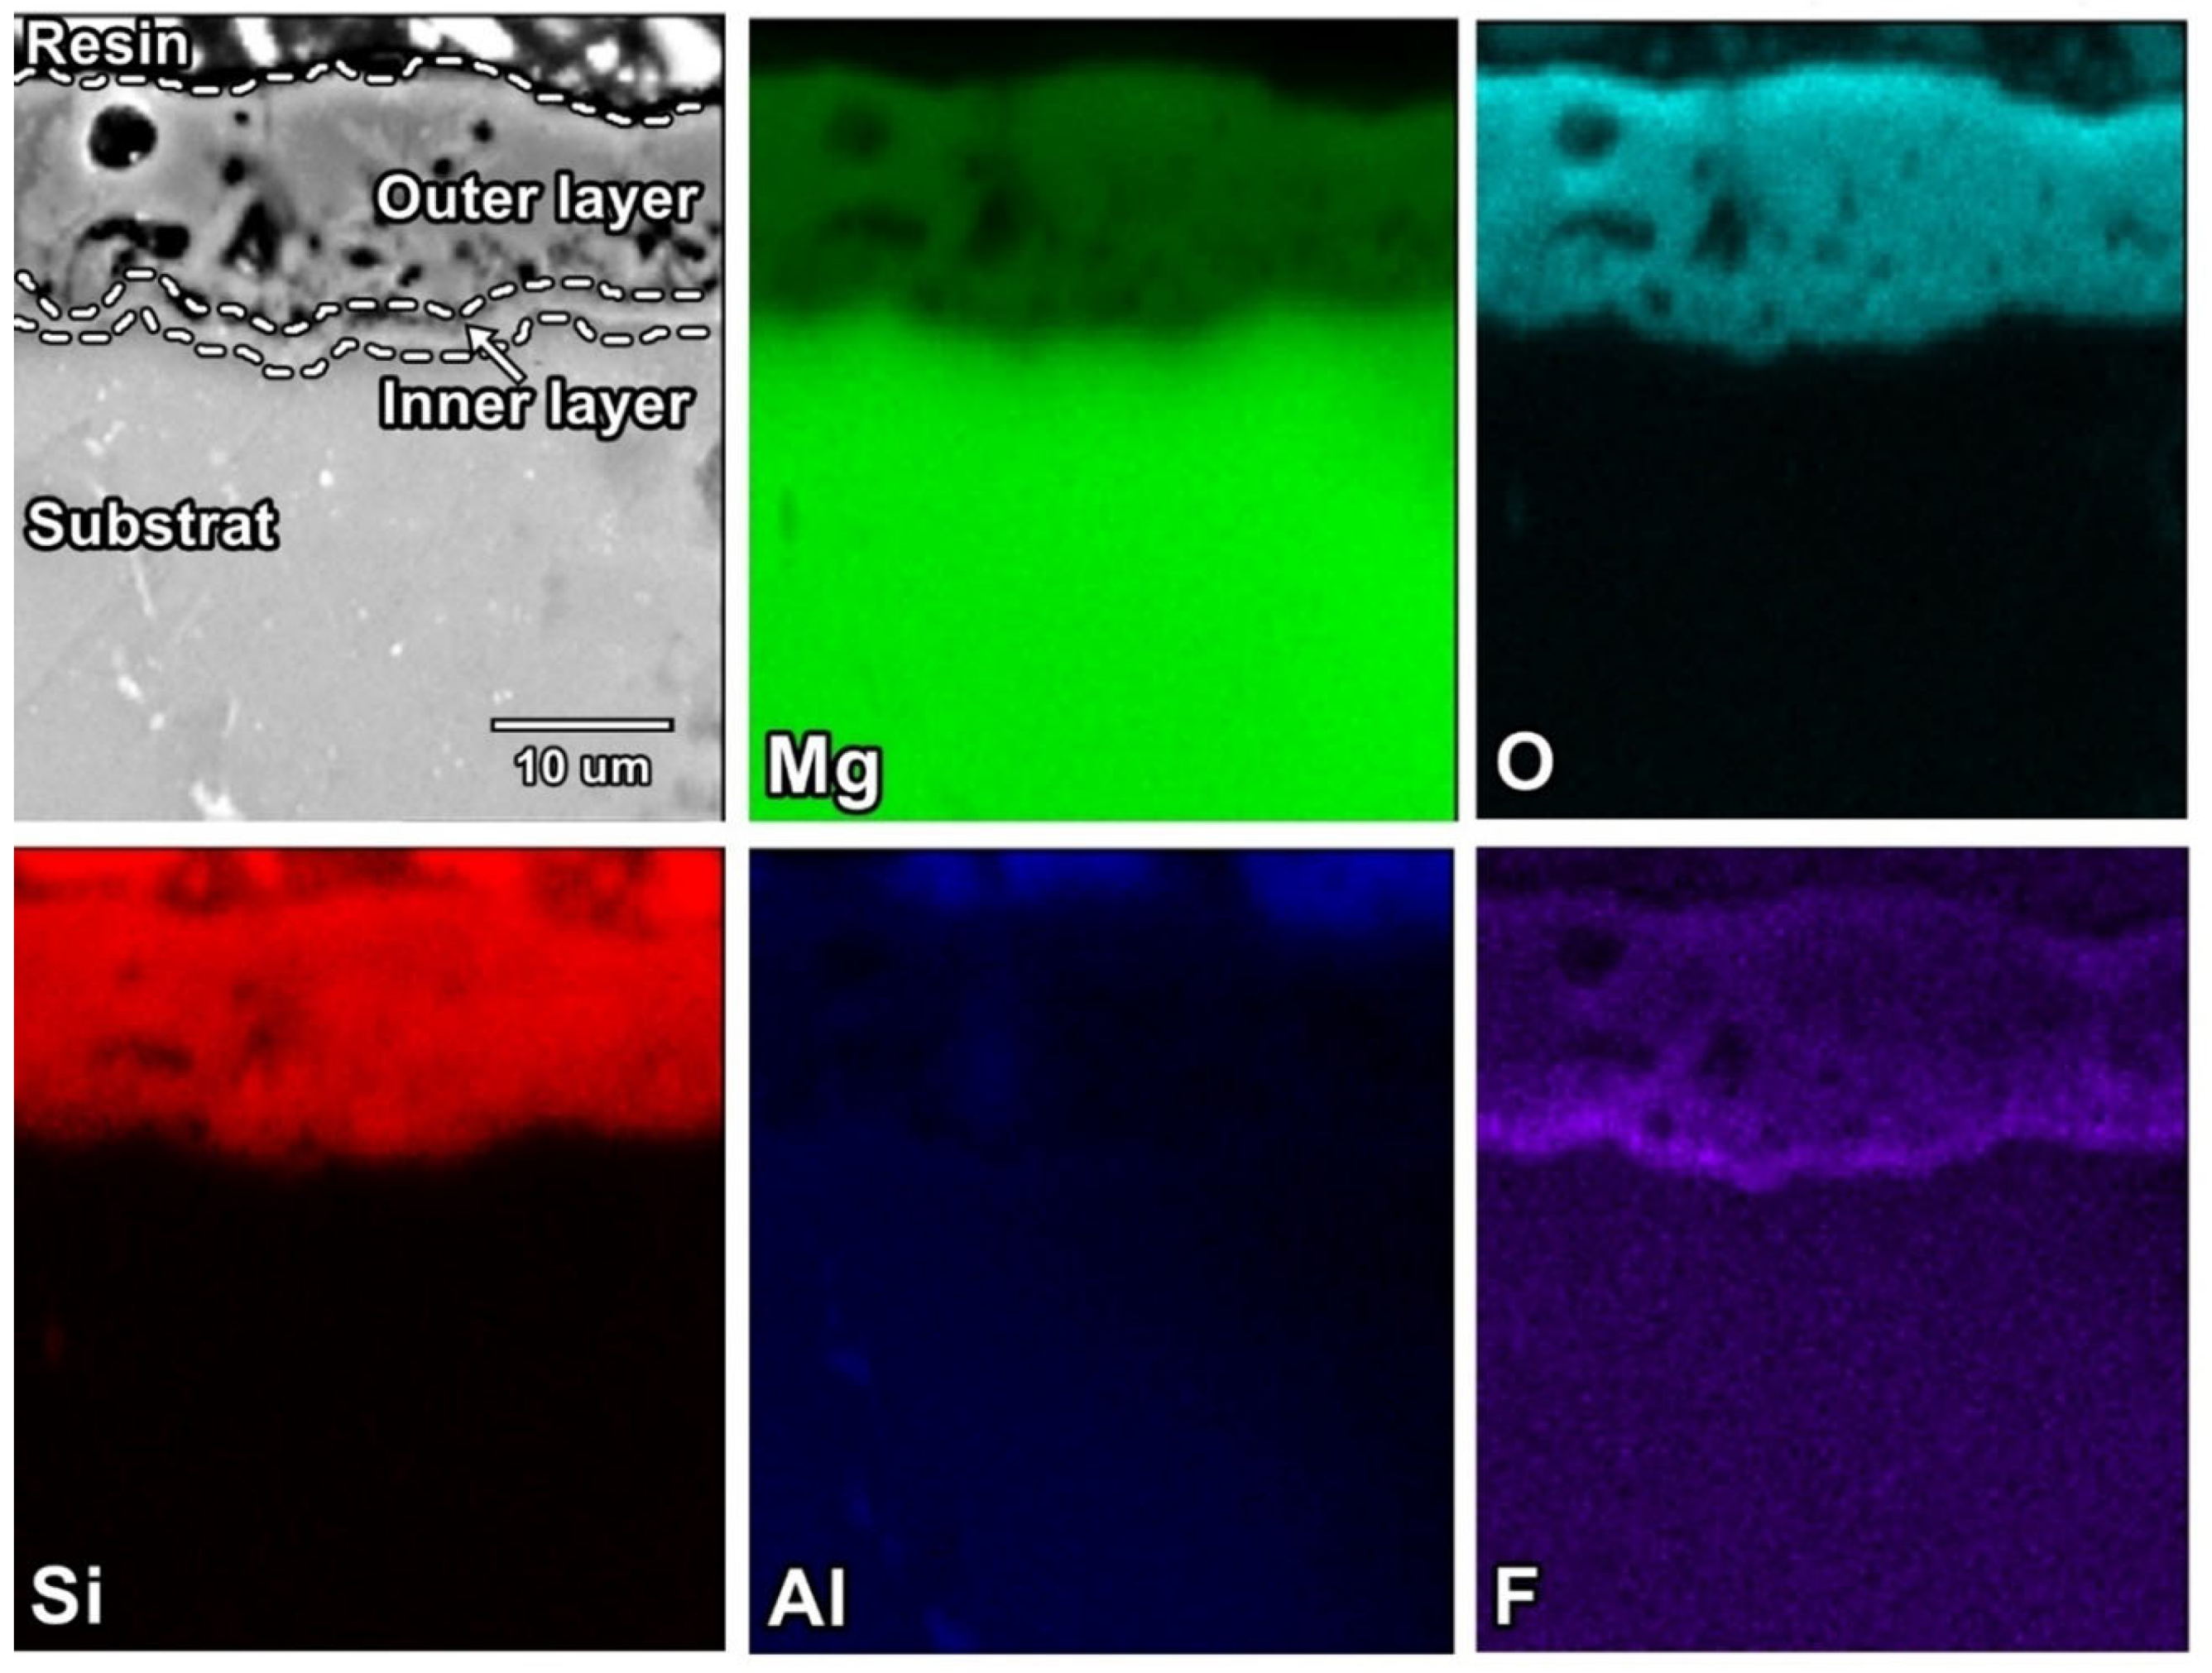
3.3. Chemical Composition Analysis of the PEO Coatings
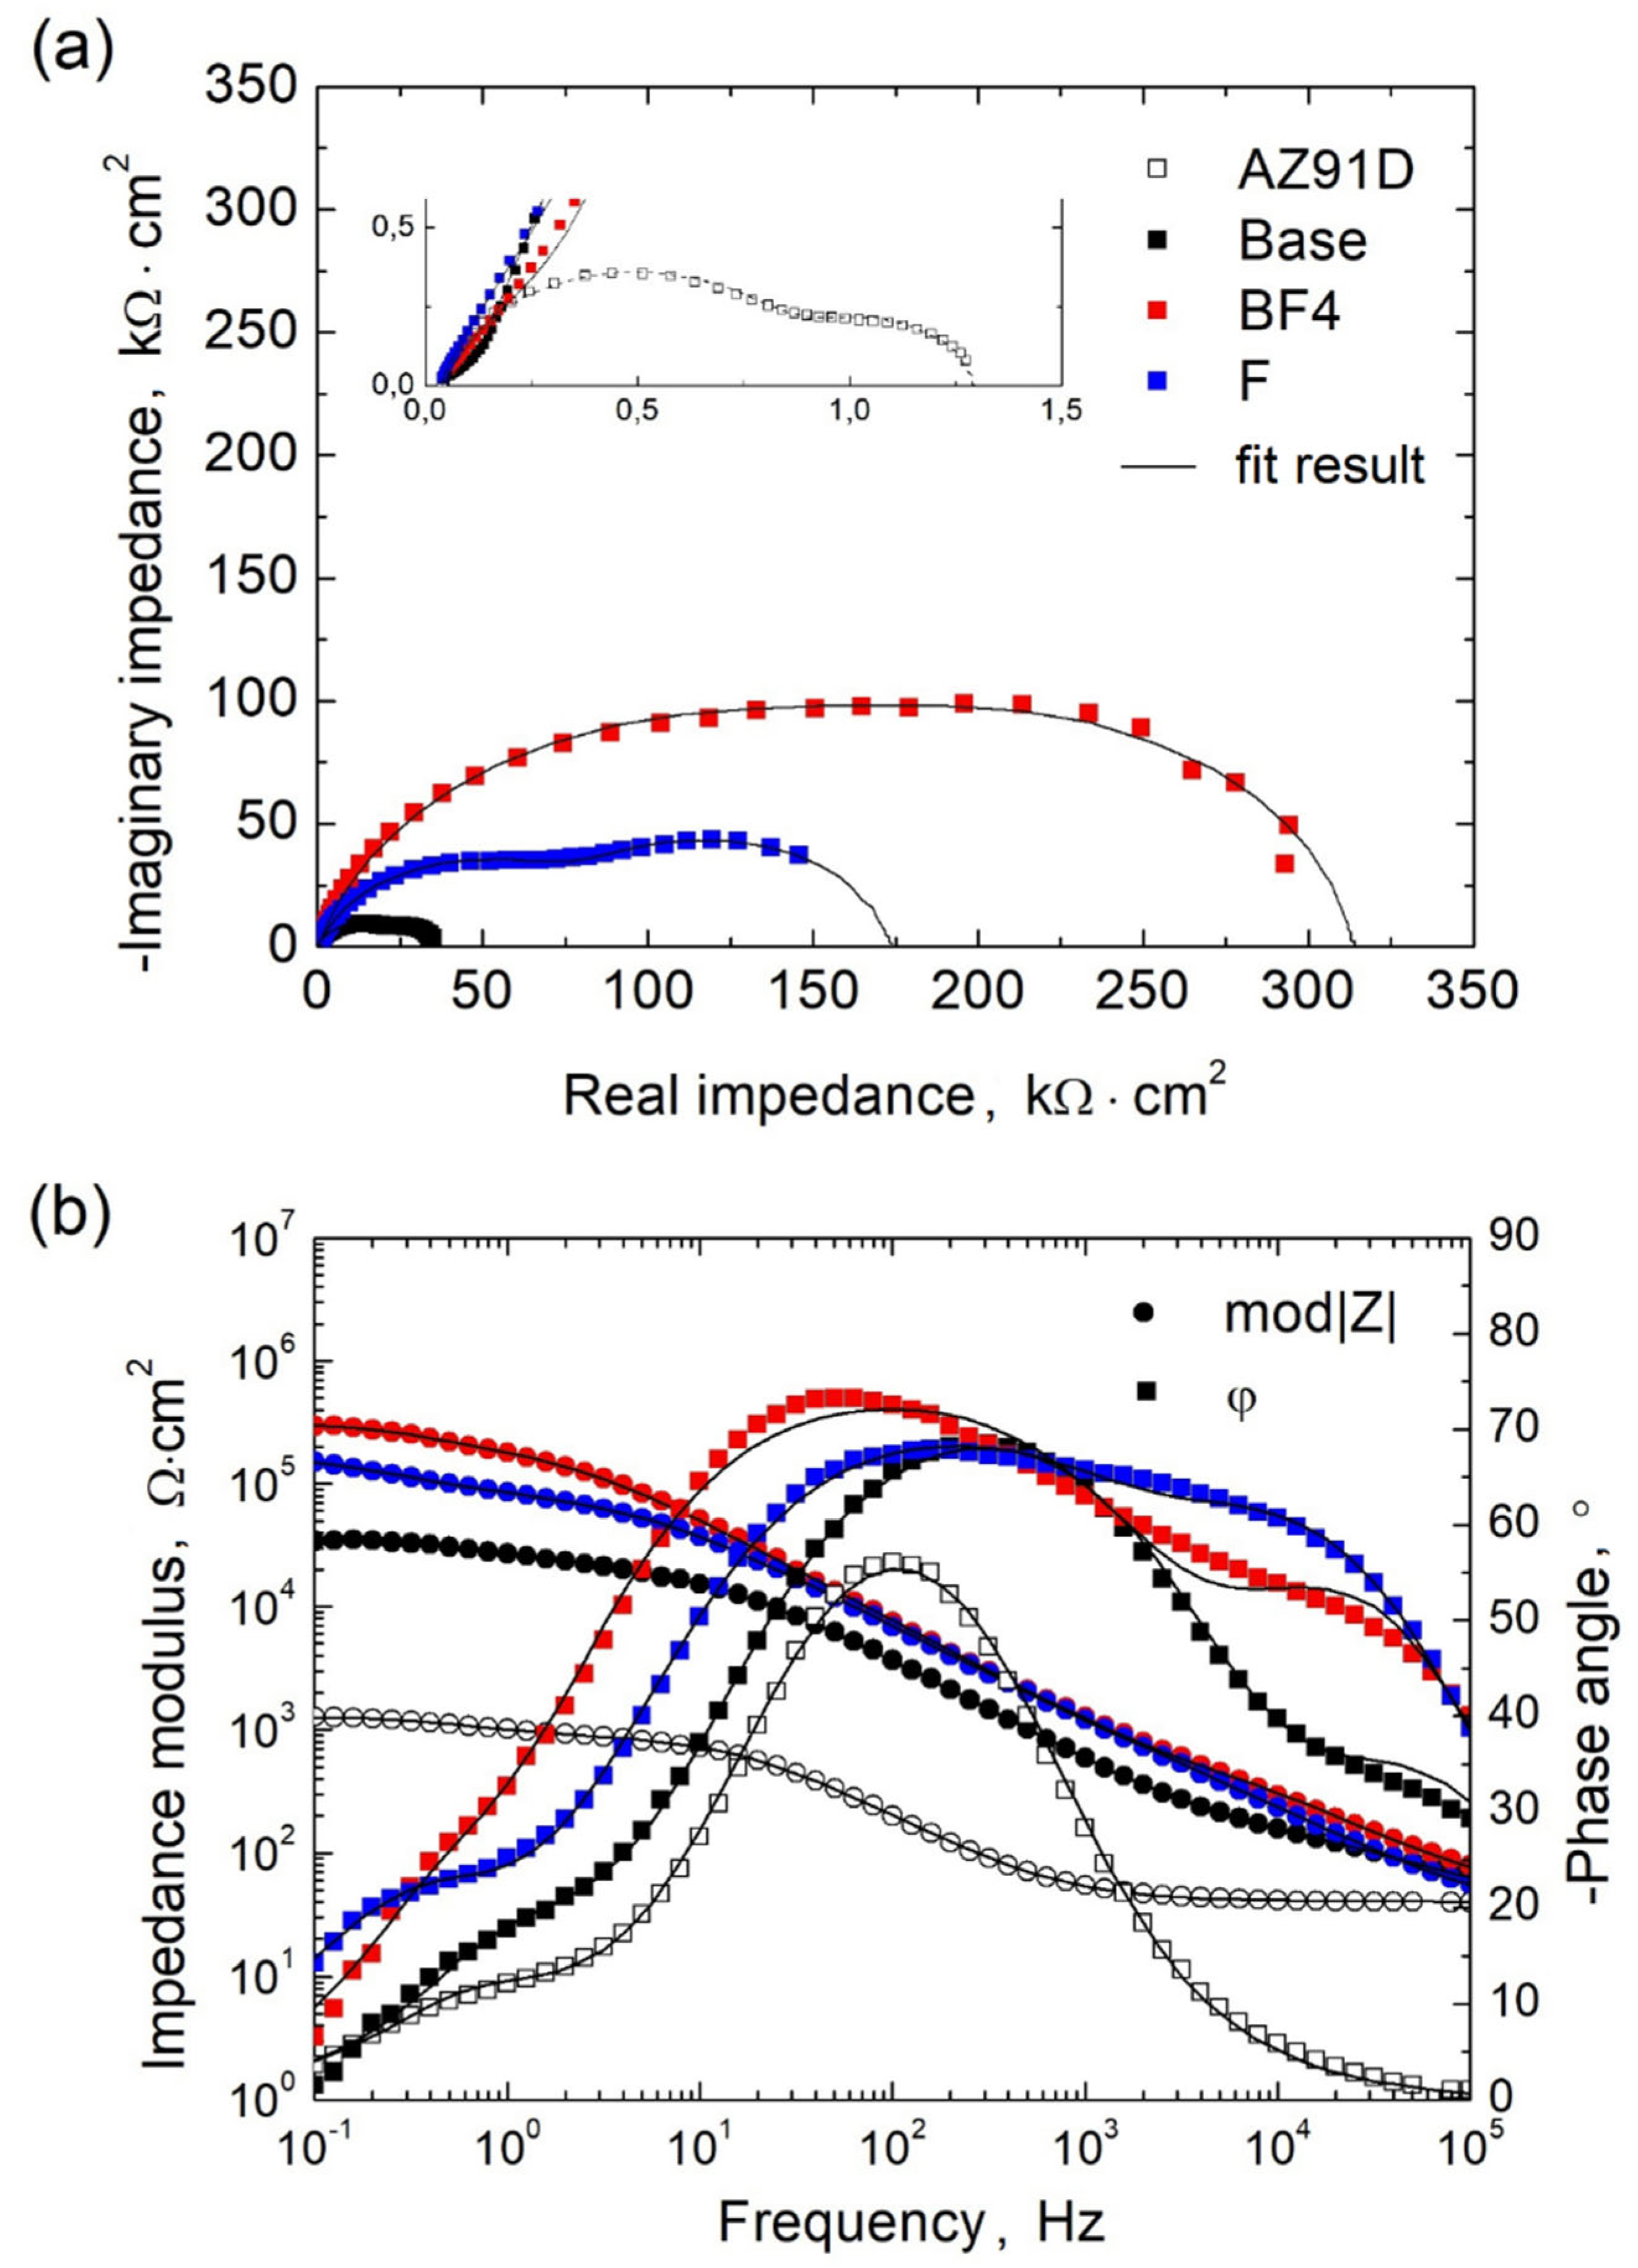
3.4. Corrosion Resistance of PEO Coatings
4. Conclusions
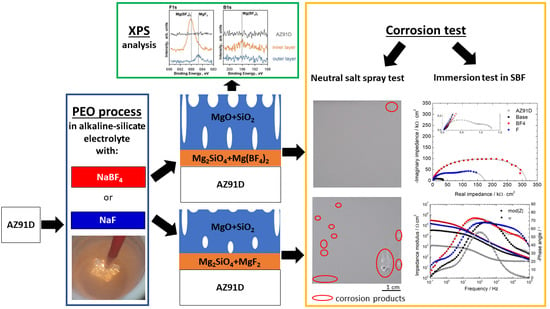
- The presence of both fluorine-containing salts in the electrolyte bath enhances the performance of the coatings produced. These coatings are thicker and show increased resistance to corrosion. However, the best barrier properties have been observed for the coating obtained from the electrolyte containing sodium tetrafluoroborate.
- Fluorine is present mainly in the inner layer. XPS studies have shown that Mg(BF4)2 occurs in the inner layer when the electrolyte bath contains sodium tetrafluoroborate and its presence is responsible for the best properties of the coatings.
- The use of sodium tetrafluoroborate in the electrolyte bath causes a visible increase in the diameter of the pores in the outer layer of the coating. However, this can be useful in increasing the adhesion of the topcoat layers.
5. Patents
- The US 11001927B2 patent has been granted from the work reported in this manuscript.
Author Contributions
Funding
Institutional Review Board Statement
Informed Consent Statement
Data Availability Statement
Conflicts of Interest
References
- Gray, J.E.; Luan, B. Protective coatings on magnesium and its alloys—A critical review. J. Alloys Compd. 2002, 336, 88–113. [Google Scholar] [CrossRef]
- El Mahallawy, N.A.; Shoeib, M.A.; Abouelenain, M.H. AZ91 magnesium alloys: Anodizing of using environmental friendly electrolytes. J. Surf. Eng. Mater. Adv. Technol. 2011, 1, 62–72. [Google Scholar] [CrossRef]
- Gerengi, H.; Cabrini, M.; Solomon, M.M.; Kaya, E. Understanding the corrosion behavior of the AZ91D alloy in simulated body fluid through the use of dynamic EIS. ACS Omega 2022, 7, 11929–11938. [Google Scholar] [CrossRef]
- Wu, C.-Y.; Zhang, J. State-of-art on corrosion and protection of magnesium alloys based on patent literatures. Trans. Nonferrous Met. Soc. China 2011, 21, 892–902. [Google Scholar] [CrossRef]
- Zhang, D.; Peng, F.; Liu, X. Protection of magnesium alloys: From physical barrier coating to smart self-healing coating. J. Alloys Compd. 2021, 853, 157010. [Google Scholar] [CrossRef]
- Chang, S.-H.; Niu, L.; Su, Y.; Wang, W.; Tong, X.; Li, G. Effect of the pretreatment of silicone penetrant on the performance of the chromium-free chemfilm coated on AZ91D magnesium alloys. Mater. Chem. Phys. 2016, 171, 312–317. [Google Scholar] [CrossRef]
- Amiri, H.; Mohammadi, I.; Afshar, A. Electrophoretic deposition of nano-zirconia coating on AZ91D magnesium alloy for bio-corrosion control purposes. Surf. Coat. Technol. 2017, 311, 182–190. [Google Scholar] [CrossRef]
- Kavitha, R.J.; Ravichandran, K.; Sankara Narayanan, T.S.N. Deposition of strontium phosphate coatings on magnesium by hydrothermal treatment: Characteristics, corrosion resistance and bioactivity. J. Alloys Compd. 2018, 745, 725–743. [Google Scholar] [CrossRef]
- Kuo, Y.-L.; Chang, K.-H. Atmospheric pressure plasma enhanced chemical vapor deposition of SiOx films for improved corrosion resistant properties of AZ31 magnesium alloys. Surf. Coat. Technol. 2015, 283, 194–200. [Google Scholar] [CrossRef]
- Li, Q.; Zhang, Q.; An, M. Enhanced corrosion and wear resistance of AZ31 magnesium alloy in simulated body fluid via electrodeposition of nanocrystalline zinc. Materialia 2018, 4, 282–286. [Google Scholar] [CrossRef]
- Harada, Y.; Kumai, S. Effect of ceramics coating using sol–gel processing on corrosion resistance and age hardening of AZ80 magnesium alloy substrate. Surf. Coat. Technol. 2013, 228, 59–67. [Google Scholar] [CrossRef]
- Hu, R.-G.; Zhang, S.; Bu, J.-F.; Lin, C.-J.; Song, G.-L. Recent progress in corrosion protection of magnesium alloys by organic coatings. Prog. Org. Coat. 2012, 73, 129–141. [Google Scholar] [CrossRef]
- Yerokhin, A.L.; Nie, X.; Leyland, A.; Matthews, A.; Dowey, S.J. Plasma electrolysis for surface engineering. Surf. Coat. Technol. 1999, 122, 73–93. [Google Scholar] [CrossRef]
- Hussein, R.O.; Nie, X.; Northwood, D.O. An investigation of ceramic coating growth mechanisms in plasma electrolytic oxidation (PEO) processing. Electrochim. Acta 2013, 112, 111–119. [Google Scholar] [CrossRef]
- Florczak, Ł.; Nawrat, G.; Kwolek, P.; Sieniawski, J.; Sobkowiak, A. Plazmowe utlenianie elektrolityczne jako metoda ochrony przed korozją magnezu i jego stopów / Plasma electrolytic oxidation as a method for protection against corrosion of magnesium and its alloys. Przemysł Chem. 2018, 97, 2145–2153. [Google Scholar] [CrossRef]
- Clyne, T.W.; Troughton, S.C. A review of recent work on discharge characteristics during plasma electrolytic oxidation of various metals. Int. Mater. Rev. 2019, 64, 127–162. [Google Scholar] [CrossRef] [Green Version]
- Sikdar, S.; Menezes, P.V.; Maccione, R.; Jacob, T.; Menezes, P.L. Plasma electrolytic oxidation (PEO) process-processing, properties, and applications. Nanomaterials 2021, 11, 1375. [Google Scholar] [CrossRef] [PubMed]
- Yao, W.; Wu, L.; Wang, J.; Jiang, B.; Zhang, D.; Serdechnova, M.; Shulha, T.; Blawert, C.; Zheludkevich, M.L.; Pan, F. Micro-arc oxidation of magnesium alloys: A review. J. Mater. Sci. Technol. 2022, 118, 158–180. [Google Scholar] [CrossRef]
- Barati Darband, G.; Aliofkhazraei, M.; Hamghalam, P.; Valizade, N. Plasma electrolytic oxidation of magnesium and its alloys: Mechanism, properties and applications. J. Magnes. Alloy. 2017, 5, 74–132. [Google Scholar] [CrossRef]
- Gnedenkov, S.V.; Khrisanfova, O.A.; Zavidnaya, A.G.; Sinebryukhov, S.L.; Egorkin, V.S.; Nistratova, M.V.; Yerokhin, A.; Matthews, A. PEO coatings obtained on an Mg–Mn type alloy under unipolar and bipolar modes in silicate-containing electrolytes. Surf. Coat. Technol. 2010, 204, 2316–2322. [Google Scholar] [CrossRef]
- Chen, Y.; Yang, Y.; Zhang, T.; Zhang, W.; Wang, F.; Lu , X.; Blawert, C.; Zheludkevich, M.L. Interaction effect between different constituents in silicate-containing electrolyte on PEO coatings on Mg alloy. Surf. Coat. Technol. 2016, 307, 825–836. [Google Scholar] [CrossRef]
- Chen, Y.; Yang, Y.; Zhang, W.; Zhang, T.; Wang, F. Influence of second phase on corrosion performance and formation mechanism of PEO coating on AZ91 Mg alloy. J. Alloys Compd. 2017, 718, 92–103. [Google Scholar] [CrossRef]
- Gawel, L.; Nieuzyla, L.; Nawrat, G.; Darowicki, K.; Slepski, P. Impedance monitoring of corrosion degradation of plasma electrolytic oxidation coatings (PEO) on magnesium alloy. J. Alloys Compd. 2017, 722, 406–413. [Google Scholar] [CrossRef]
- Liang, J.; Guo, B.; Tian, J.; Liu, H.; Zhou, J.; Xu, T. Effect of potassium fluoride in electrolytic solution on the structure and properties of microarc oxidation coatings on magnesium alloy. Appl. Surf. Sci. 2005, 252, 345–351. [Google Scholar] [CrossRef]
- Wang, L.; Chen, L.; Yan, Z.; Wang, H.; Peng, J. Effect of potassium fluoride on structure and corrosion resistance of plasma electrolytic oxidation films formed on AZ31 magnesium alloy. J. Alloys Compd. 2009, 480, 469–474. [Google Scholar] [CrossRef]
- Nawrat, G.; Wierzbińska, M.; Misztal, A.; Gonet, M.; Lach, G.; Nieużyła, Ł.; Koszorek, A. Elektrolityczne utlenianie plazmowe stopu magnezu AZ91D / Plasma electrolytic oxidation of magnesium alloy AZ91D. Ochr. Przed Korozją 2017, 60, 131–135. [Google Scholar] [CrossRef]
- Mingo, B.; Arrabal, R.; Mohedano, M.; Llamazares, Y.; Matykina, E.; Yerokhin, A.; Pardo, A. Influence of sealing post-treatments on the corrosion resistance of PEO coated AZ91 magnesium alloy. Appl. Surf. Sci. 2018, 433, 653–667. [Google Scholar] [CrossRef]
- Rehman, Z.U.; Shin, S.H.; Hussain, I.; Koo, B.H. Structure and corrosion properties of the two-step PEO coatings formed on AZ91D Mg alloy in K2ZrF6-based electrolyte solution. Surf. Coat. Technol. 2016, 307, 484–490. [Google Scholar] [CrossRef]
- Tang, M.; Feng, Z.; Li, G.; Zhang, Z.; Zhang, R. High-corrosion resistance of the microarc oxidation coatings on magnesium alloy obtained in potassium fluotitanate electrolytes. Surf. Coat. Technol. 2015, 264, 105–113. [Google Scholar] [CrossRef]
- Rehman, Z.U.; Ahn, B.H.; Song, J.I.; Koo, B.H. Effect of Na2SiF6 concentration on the plasma electrolytic oxidation of AZ31B magnesium alloy. Int. J. Surf. Sci. Eng. 2016, 10, 456–467. [Google Scholar] [CrossRef]
- Kaseem, M.; Yang, H.W.; Ko, Y.G. Toward a nearly defect-free coating via high-energy plasma sparks. Sci. Rep. 2017, 7, 2378. [Google Scholar] [CrossRef] [PubMed] [Green Version]
- Duan, H.; Yan, C.; Wang, F. Effect of electrolyte additives on performance of plasma electrolytic oxidation films formed on magnesium alloy AZ91D. Electrochim. Acta 2007, 52, 3785–3793. [Google Scholar] [CrossRef]
- Shen, M.J.; Wang, X.J.; Zhang, M.F. High-compactness coating grown by plasma electrolytic oxidation on AZ31 magnesium alloy in the solution of silicate–borax. Appl. Surf. Sci. 2012, 259, 362–366. [Google Scholar] [CrossRef]
- Sreekanth, D.; Rameshbabu, N.; Venkateswarlu, K.; Subrahmanyam, C.; Rama Krishna, L.; Prasad Rao, K. Effect of K2TiF6 and Na2B4O7 as electrolyte additives on pore morphology and corrosion properties of plasma electrolytic oxidation coatings on ZM21 magnesium alloy. Surf. Coat. Technol. 2013, 222, 31–37. [Google Scholar] [CrossRef]
- Sowa, M.; Olesiński, A.; Szumski, B.; Maciej, A.; Bik, M.; Jeleń, P.; Sitarz, M.; Simka, W. Electrochemical characterization of anti-corrosion coatings formed on 6061 aluminum alloy by plasma electrolytic oxidation in the corrosion inhibitor-enriched aqueous solutions. Electrochim. Acta 2022, 424, 140652. [Google Scholar] [CrossRef]
- Senocak, T.C.; Yilmaz, T.A.; Budak, H.F.; Gulten, G.; Yilmaz, A.M.; Ezirmik, K.V.; Totik, Y. Influence of sodium pentaborate (B5H10NaO13) additive in plasma electrolytic oxidation process on WE43 magnesium alloys. Mater. Today Commun. 2022, 30, 103157. [Google Scholar] [CrossRef]
- Florczak, Ł.; Sobkowiak, A.; Nawrat, G. Wpływ heksafluoroantymonianu sodu na właściwości powłok konwersyjnych wytworzonych podczas elektrolitycznego utleniania plazmowego stopu magnezu / The effect of sodium hexafluoroantimonate on the properties of the conversion coatings formed by plasma electrolytic oxidation of a magnesium alloy. Przemysł Chem. 2016, 95, 1414–1419. [Google Scholar] [CrossRef]
- Kokubo, T.; Kushitani, H.; Sakka, S.; Kitsugi, T.; Yamamuro, Y. Solutions able to reproduce in vivo surface-structure changes in bioactive glass-ceramic A-W. J. Biomed. Mater. Res. 1990, 24, 721–734. [Google Scholar] [CrossRef]
- Stern, M.; Geaby, A.L. Electrochemical polarization. J. Electrochem. Soc. 1957, 104, 56. [Google Scholar] [CrossRef]
- Gu, Y.; Bandopadhyay, S.; Chen, C.-f.; Guo, Y.; Ning, C. Effect of oxidation time on the corrosion behavior of micro-arc oxidation produced AZ31 magnesium alloys in simulated body fluid. J. Alloys Compd. 2012, 543, 109–117. [Google Scholar] [CrossRef]
- Xiong, Y.; Hu, Q.; Song, R.; Hu, X. LSP/MAO composite bio-coating on AZ80 magnesium alloy for biomedical application. Mater. Sci. Eng. C 2017, 75, 1299–1304. [Google Scholar] [CrossRef]
- Bordbar-Khiabani, A.; Yarmand, B.; Mozafari, M. Enhanced corrosion resistance and in-vitro biodegradation of plasma electrolytic oxidation coatings prepared on AZ91 Mg alloy using ZnO nanoparticles-incorporated electrolyte. Surf. Coat. Technol. 2019, 360, 153–171. [Google Scholar] [CrossRef]
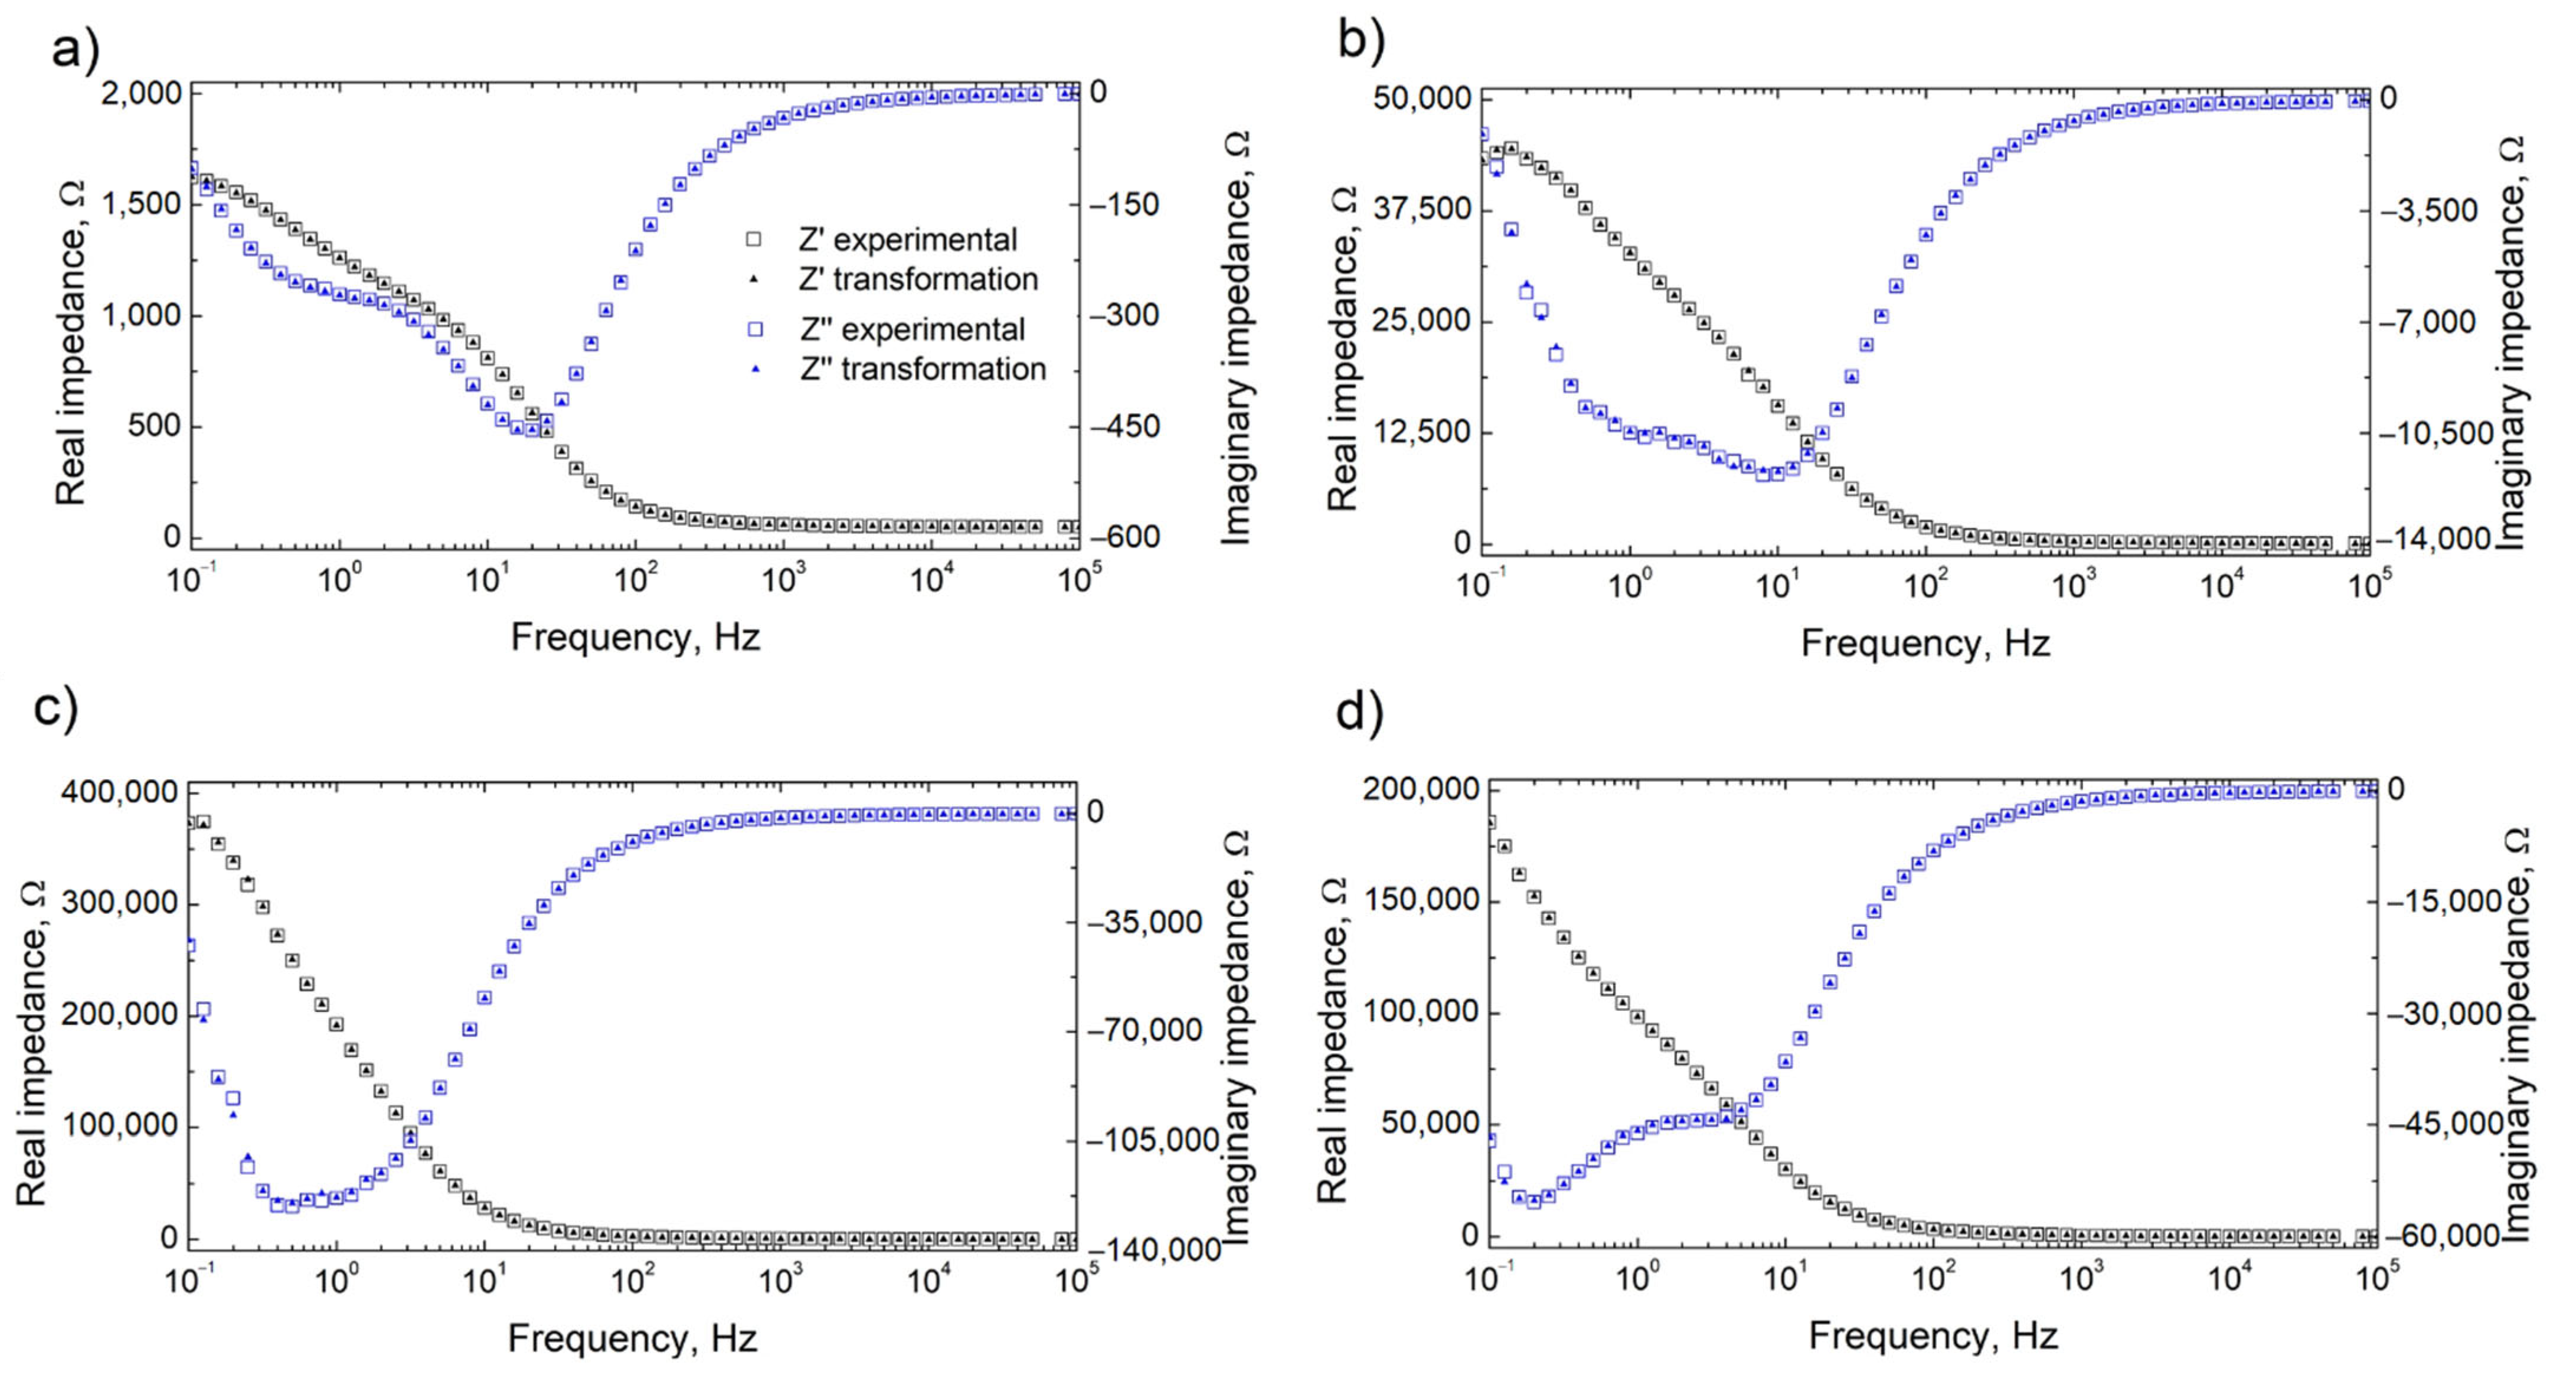
- Macdonald, D.D.; Sikora, E.; Engelhardt, G. Characterizing electrochemical systems in the frequency domain. Electrochim. Acta 1998, 43, 87–107. [Google Scholar] [CrossRef]
- Available online: https://srdata.nist.gov/xps. (accessed on 1 February 2022).
- Duan, H.; Yan, C.; Wang, F. Growth process of plasma electrolytic oxidation films formed on magnesium alloy AZ91D in silicate solution. Electrochim. Acta 2007, 52, 5002–5009. [Google Scholar] [CrossRef]
- Zhang, S.-F.; Hu, G.-H.; Zhang, R.-F.; Jia, Z.-X.; Wang, L.-J.; Wang, Y.-J.; Hu, C.-Y.; He, X.-M. Effects of electric parameters on corrosion resistance of anodic coatings formed on magnesium alloys. Trans. Nonferrous Met. Soc. China 2010, 20, s660–s664. [Google Scholar] [CrossRef]
- Sreekanth, D.; Rameshbabu, N.; Venkateswarlu, K. Effect of various additives on morphology and corrosion behavior of ceramic coatings developed on AZ31 magnesium alloy by plasma electrolytic oxidation. Ceram. Int. 2012, 38, 4607–4615. [Google Scholar] [CrossRef]
- Durdu, S.; Bayramoğlu, S.; Demirtaş, A.; Usta, M.; Üçışık, A.H. Characterization of AZ31 Mg Alloy coated by plasma electrolytic oxidation. Vacuum 2013, 88, 130–133. [Google Scholar] [CrossRef]
- Aktuğ, S.L.; Durdu, S.; Kutbay, I.; Usta, M. Effect of Na2SiO3·5H2O concentration on microstructure and mechanical properties of plasma electrolytic oxide coatings on AZ31 Mg alloy produced by twin roll casting. Ceram. Int. 2016, 42, 1246–1253. [Google Scholar] [CrossRef]
- Liu, J.; Lu, Y.; Jing, X.; Yuan, Y.; Zhang, M. Characterization of plasma electrolytic oxidation coatings formed on Mg-Li Alloy in an alkaline silicate electrolyte containing silica sol. Mater. Corros. 2009, 60, 865–870. [Google Scholar] [CrossRef]
- Chang, L.-R.; Cao, F.-H.; Cai, J.-S.; Liu, W.-J.; Zhang, Z.; Zhang, J.-Q. Influence of electric parameters on MAO of AZ91D magnesium alloy using alternative square-wave power source. Trans. Nonferrous Met. Soc. China 2011, 21, 307–316. [Google Scholar] [CrossRef]
- Yang, Y.; Wu, H. Effect of current density on corrosion resistance of micro-arc oxide coatings on magnesium alloy. Trans. Nonferrous Met. Soc. China 2010, 20, s688–s692. [Google Scholar] [CrossRef]
- Yang, J.; Lu, X.; Blawert, C.; Di, S.; Zheludkevich, M.L. Microstructure and corrosion behavior of Ca/P coatings prepared on magnesium by plasma electrolytic oxidation. Surf. Coat. Technol. 2017, 319, 359–369. [Google Scholar] [CrossRef]
- Neves, C.S.; Sousa, I.; Freitas, M.A.; Moreira, L.; Costa, C.; Teixeira, J.P.; Fraga, S.; Pinto, E.; Almeida, A.; Scharnagl, N.; et al. Insights into corrosion behaviour of uncoated Mg alloys for biomedical applications in different aqueous media. J. Mater. Res. Technol. 2021, 13, 1908–1922. [Google Scholar] [CrossRef]


| The Content of Elements, wt.% | ||||||||
|---|---|---|---|---|---|---|---|---|
| Al | Zn | Mn | Si | Ca | Fe | Ni | Cu | Mg |
| 8.77 | 0.74 | 0.18 | <0.01 | <0.01 | <0.001 | <0.001 | <0.001 | balance |
| Sample Code | Composition of Electrolyte, g/L | Molar Concentration of Fluorine, mM/L | Conductivity of Electrolyte, mS/cm |
|---|---|---|---|
| Base | Na2SiO3·5H2O: 15 NaOH: 4.2 | - | 32.1 |
| BF4 | Na2SiO3·5H2O: 15 NaOH: 4.2 NaBF4: 2 | 72.9 | 33.1 |
| F | Na2SiO3·5H2O: 15 NaOH: 4.2 NaF: 3.06 | 72.9 | 35.3 |
| Concentration of Compounds, g/L | ||||||||
|---|---|---|---|---|---|---|---|---|
| NaCl | NaHCO3 | KCl | K2HPO4∙3H2O | MgCl2∙6H2O | CaCl2 | Na2SO4 | (CH2OH)3CNH2 | HCl (1.0 M) |
| 8.035 | 0.355 | 0.225 | 0.231 | 0.311 | 0.292 | 0.072 | 6.118 | Adjusted pH to 7.4 |
| Sample Code | Breakdown Voltage, V | Final Voltage, V |
|---|---|---|
| Base | 194 | 412 |
| BF4 | 188 | 421 |
| F | 177 | 414 |
| Sample Code | Average 1 Outer Pore Diameter, µm | Average 2 Outer Pore Diameter, µm | Porosity, % |
|---|---|---|---|
| Base | 1.77 ± 2.07 | 1.26 ± 0.69 | 9.80 |
| BF4 | 2.28 ± 2.92 | 1.47 ± 1.06 | 10.22 |
| F | 1.90 ± 2.08 | 1.42 ± 0.83 | 9.72 |
| Sample Code | Layer | Elements Content, at.% | ||||
|---|---|---|---|---|---|---|
| Mg | O | Si | Al | F | ||
| Base | outer | 37.4 | 43.0 | 14.9 | 4.6 | 0.0 |
| inner | 48.8 | 37.2 | 8.2 | 5.7 | 0.0 | |
| BF4 | outer | 36.9 | 42.9 | 13.9 | 3.8 | 2.4 |
| inner | 47.2 | 32.6 | 7.7 | 5.0 | 7.4 | |
| F | outer | 33.3 | 45.5 | 15.7 | 3.5 | 1.9 |
| inner | 44.6 | 38.1 | 6.2 | 4.2 | 6.8 | |
| Sample Code | ECORR vs. SCE, V | jCORR, µA/cm2 | RP,kΩ∙cm2 | F | ||
|---|---|---|---|---|---|---|
| AZ91D | −1.60 | 29.8 | 307 | 178 | 1.65 | |
| Base | −1.62 | 1.20 | 402 | 180 | 45.01 | 3.20 × 10⁻² |
| BF4 | −1.71 | 0.26 | 478 | 242 | 265.9 | 2.76 × 10⁻³ |
| F | −1.68 | 0.45 | 431 | 250 | 152.7 | 5.93 × 10⁻³ |
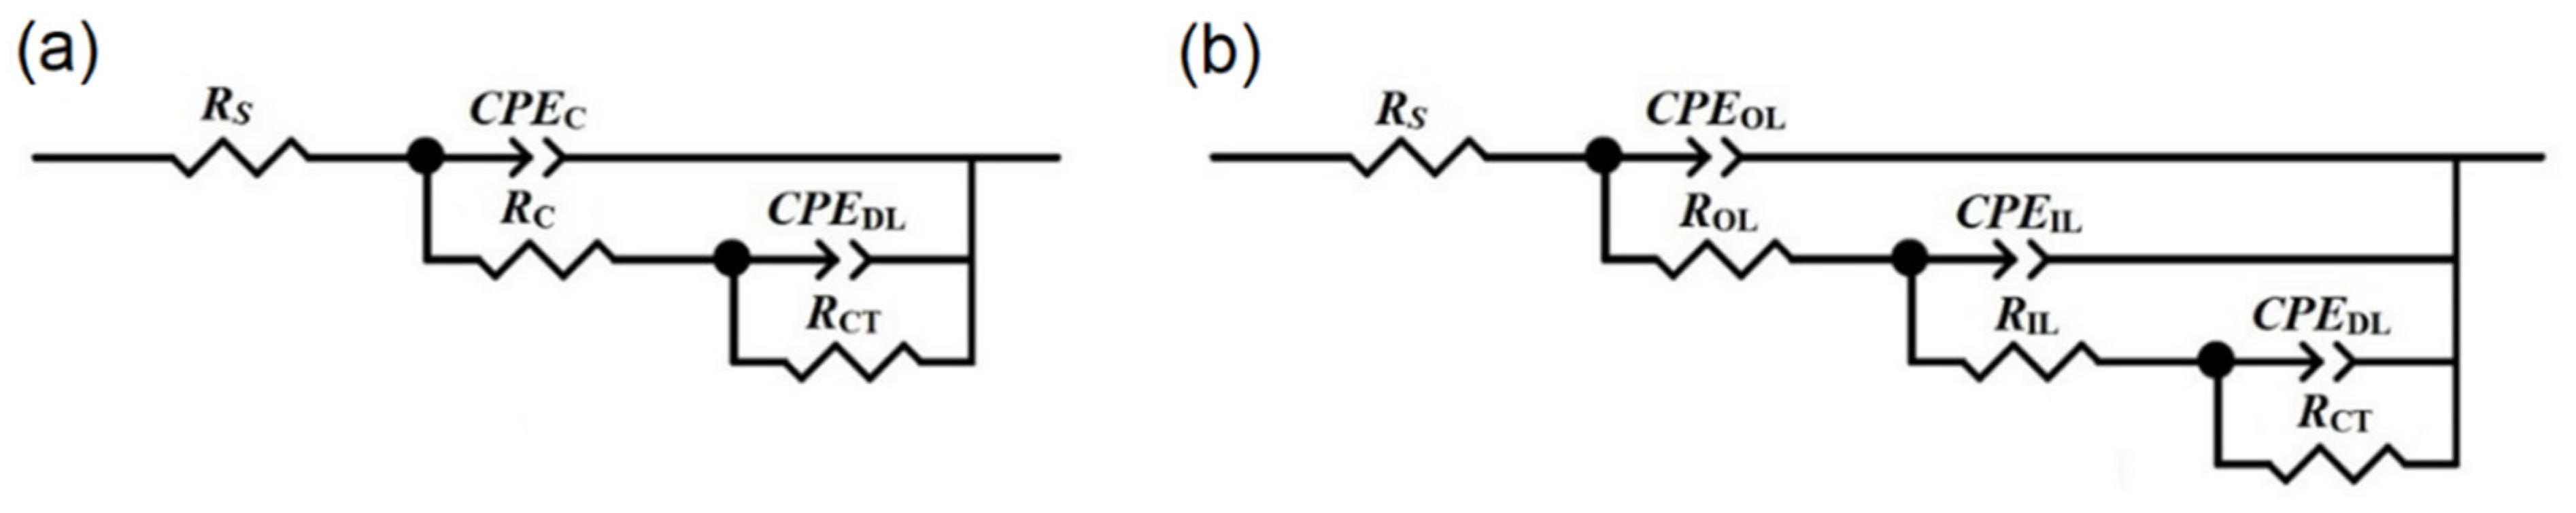
| Sample Code | RS, Ω∙cm2 | CPEC, µS∙secn/cm2 | nC | RC, Ω∙cm2 | CPEDL, µS∙secn/cm2 | nDL | RCT, Ω∙cm2 | RTOTAL, kΩ∙cm2 |
|---|---|---|---|---|---|---|---|---|
| AZ91D | 40 | 20.1 | 0.860 | 891 | 896 | 0.894 | 364 | 1.26 |
| Sample Code | RS, Ω∙cm2 | CPEOL, µS∙secn/cm2 | nOL | ROL, kΩ∙cm2 | CPEIL, µS∙secn/cm2 | nIL | RIL, kΩ∙cm2 | CPEDL, µS∙secn/cm2 | nDL | RCT, kΩ∙cm2 | RTOTAL, kΩ∙cm2 |
|---|---|---|---|---|---|---|---|---|---|---|---|
| Base | 39 | 0.651 | 0.787 | 0.172 | 0.604 | 0.864 | 23.3 | 20.6 | 0.844 | 13.2 | 36.67 |
| BF4 | 44 | 0.325 | 0.823 | 0.892 | 0.246 | 0.861 | 235.0 | 5.04 | 1.000 | 78.1 | 313.99 |
| F | 32 | 0.589 | 0.805 | 2.350 | 0.176 | 0.826 | 89.5 | 9.87 | 0.869 | 82.0 | 173.85 |
Publisher’s Note: MDPI stays neutral with regard to jurisdictional claims in published maps and institutional affiliations. |
© 2022 by the authors. Licensee MDPI, Basel, Switzerland. This article is an open access article distributed under the terms and conditions of the Creative Commons Attribution (CC BY) license (https://creativecommons.org/licenses/by/4.0/).
Share and Cite
Florczak, Ł.; Nawrat, G.; Darowicki, K.; Ryl, J.; Sieniawski, J.; Wierzbińska, M.; Raga, K.; Sobkowiak, A. The Effect of Sodium Tetrafluoroborate on the Properties of Conversion Coatings Formed on the AZ91D Magnesium Alloy by Plasma Electrolytic Oxidation. Processes 2022, 10, 2089. https://doi.org/10.3390/pr10102089
Florczak Ł, Nawrat G, Darowicki K, Ryl J, Sieniawski J, Wierzbińska M, Raga K, Sobkowiak A. The Effect of Sodium Tetrafluoroborate on the Properties of Conversion Coatings Formed on the AZ91D Magnesium Alloy by Plasma Electrolytic Oxidation. Processes. 2022; 10(10):2089. https://doi.org/10.3390/pr10102089
Chicago/Turabian StyleFlorczak, Łukasz, Ginter Nawrat, Kazimierz Darowicki, Jacek Ryl, Jan Sieniawski, Małgorzata Wierzbińska, Krzysztof Raga, and Andrzej Sobkowiak. 2022. "The Effect of Sodium Tetrafluoroborate on the Properties of Conversion Coatings Formed on the AZ91D Magnesium Alloy by Plasma Electrolytic Oxidation" Processes 10, no. 10: 2089. https://doi.org/10.3390/pr10102089