1. Introduction
The Hong Kong Exchanges and Clearing Limited introduced the Shanghai-Hong Kong Stock Connect (SH-HK Stock Connect) on 17 November 2014, and the Shenzheng-Hong Kong Stock Connect (SZ-HK Stock Connect) on 5 December 2016. Stock Connect established investment channels between Mainland China and Hong Kong stock markets for Mainland China, Hong Kong, and overseas investors through mutual order routing connectivity (
HKEX 2018). Throughout years of implementation, Stock Connect has been regarded as an opportunity to enhance market liquidity, open A-shares market and accelerate RMB internationalization (
HKEX 2018;
Wu and Gao 2015). According to
HKEX (
2018), Mainland China investors can invest in constituent stocks of the Hang Seng Composite Large Cap Index and Hang Seng Composite Mid Cap Index with a daily limit of RMB 42 billion. Meanwhile, Hong Kong investors can invest in constituent A-shares of the Shanghai Stock Exchange (SSE) 180 Index, the SSE 380 Index, the Shenzhen Stock Exchange (SZSE) Component Index and the SZSE Small/Mid-Cap Innovation Index through either the SH-HK Stock Connect Northbound or the SZ-HK Stock Connect Northbound with a daily quota of RMB 52 billion for each connect. In addition, Stock Connect includes stocks listed on both Mainland China and Hong Kong exchanges.
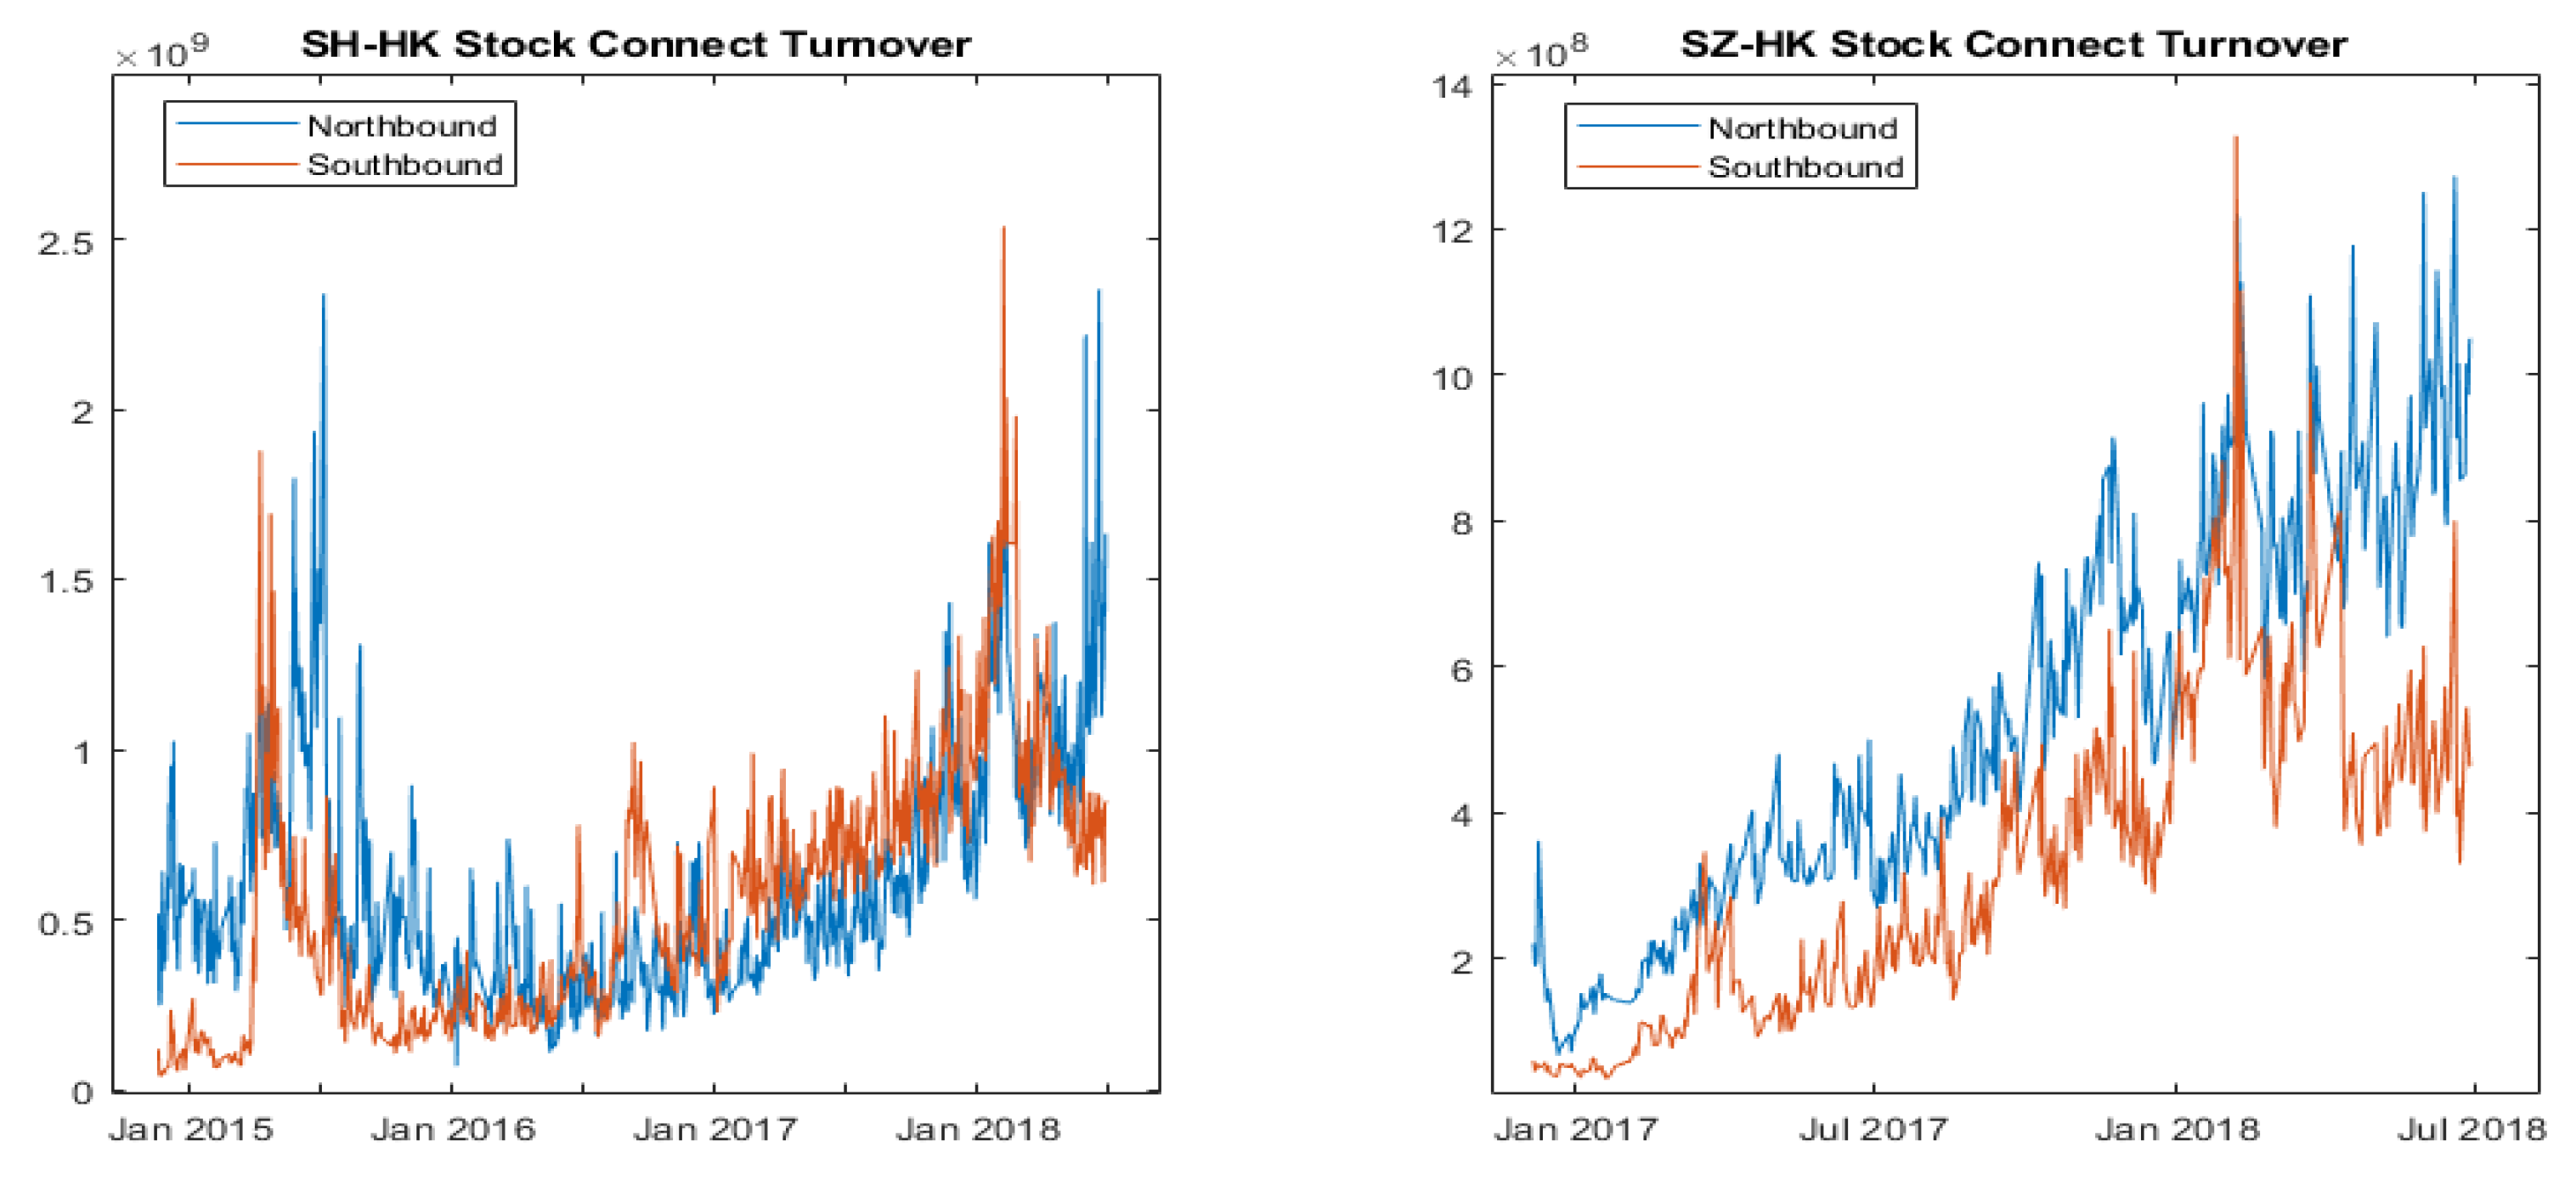
Due to different market structures of Mainland China and Hong Kong, the operations of Northbound trading and Southbound trading are different. Day trading is not permitted for Northbound and stock trading is subjected to a price limit within ±10% while there is no such limitation for Southbound. Short selling, however, is only allowed for Northbound. Moreover, the trading hours of Northbound and Southbound are not aligned. The continuous auction periods of SH-HK Stock Connect Northbound are 09:30–11:30 and 13:00–15:00; SZ-HK Stock Connect Northbound are 09:30–11:30 and 13:00–14:57; SH-HK and SZ-HK Stock Connect Southbound are 09:30–12:00 and 13:00–16:00. Furthermore, individual Mainland China investors are required to hold a balance of no less than RMB 500,000 to be eligible for Southbound trading.
After the launch of SH-HK Stock Connect, eligible Mainland China investors can purchase eligible shares listed on the Stock Exchange of Hong Kong via their own local account. It fosters the integration of Hong Kong and Mainland China stock markets and creates interaction between the two markets in various dimensions. An improved price discovery between the stocks both listed in Hong Kong and Mainland should be expected.
Hui and Chan (
2018) investigate the impact of stock connect to A-H premium. They show that A-H premium is affected more significantly by the Mainland China market than the Hong Kong market. They conclude that Mainland China market plays a dominant role in the Stock Connect.
Burdekin and Siklos (
2018) documents that the A-H premium between Hong Kong and Mainland China’s stocks rose substantially from slightly under 100% when the program was launched to nearly 150% in early 2016. In addition to the A-H premium studies,
Wang et al. (
2017) find significant effects of the Stock Connect on both Shanghai and Shenzhen stock market volatility using daily data, although the impact on the Hong Kong market is minimal.
Huo and Ahmed (
2017) investigate the impact of the SH-HK Stock Connect and conclude that Stock Connect significantly strengthened volatility spillover between the two markets. However, they find a weak and unstable cointegration relationship after the Connect, while the conditional variance of both stock markets also increased.
Given the existing studies, we investigate the relationship between market returns and trading volume under Stock Connect with unique extra information regarding the volume flows between the two markets. There are two main theories describing the relationship between the stock return and trading volume of the financial market, namely the mixture of distribution hypothesis proposed by
Clark (
1973) and sequential information arrival hypothesis proposed by
Copeland (
1976). The mixture of distribution hypothesis originally proposed by
Clark (
1973) indicates that securities’ return and trading volume follow a joint distribution conditional on the latest information. Changes of assets’ price and trading volume are due to the same underlying information arrival process and hence volume and volatility are correlated. In the sequential information arrival models,
Copeland (
1976) and later
Jennings et al. (
1981) hypothesize causal relationship between stock prices and trading volume. This class of models assumes that information is not received simultaneously by all traders. The new information is observed by each market participant sequentially. Once a new flow of information arrives in the market, traders revise their expectations and react accordingly. The lead-lag relationship of the variables arises from the different speed of response upon information arrival.
There is rich literature focusing on the empirical relationship between return volatility and trading volume.
Darrat, Rahman and Zhong (
2003) examine the contemporaneous correlation as well as the lead-lag relation between trading volume and return volatility in all stocks comprising the Dow Jones industrial average and find significant lead–lag relations between return volatility and trading volume in many the DJIA stocks in accordance with sequential information arrival hypothesis.
Lee and Rui (
2002) examine the dynamic relationship between stock market trading volume, returns and volatility for both domestic and cross-country markets based on daily data of the three largest stock markets, New York, Tokyo, and London. They use the vector autoregressive (VAR) model to explain the relationship between returns, volume and volatility. Apart from the mentioned researches, the approach of VAR model for investigating the relationship between stock returns, volatility and trading volume was employed by
Mestel et al. (
2003),
Medeiros and Doornik (
2006) and
Wang (
2004). With the existing findings of relationship between trading activity and volatility in both theoretical and empirical aspects, we extend it to the context of the Stock Connect scheme. According to the sequential information arrival hypothesis, the turnovers via Stock Connect should also reflect the view of market participants across Hong Kong, Shanghai, and Shenzhen markets. We then test whether the turnover via Stock Connect provides information about the future market volatility in addition to the trading volume and other market variables.
For the rest of this paper, we first examine the causal relationship among volatility, trading volume and Stock Connect turnover by Granger-causality test and investigate the implication of Stock Connect turnover to future volatility in the framework of VAR model. In
Section 2, we provide an overview of our research methods followed by a description of the data set in
Section 3 and empirical findings in
Section 4. In
Section 5, we summarize the results and conclude our findings.
4. Empirical Findings and Discussion
The Granger causality test results and other details such as the optimal lag lengths in VAR model and Wald statistics are presented in
Table 6. The overall results indicate that there are unidirectional relationships among Stock Connect turnover, market volatility as well as market volume. Stock Connect turnovers Granger cause RVs and market volumes, but not vice versa.
We first address if the Stock Connect turnovers Granger cause the market volatilities and trading volumes. In the Granger causality test, the null hypotheses that Stock Connect turnovers do not Granger cause market RVs and volumes for SH-HK Stock Connect are both rejected at 1% significant level. Similar results are found in SZ-HK Connect. For SZ-HK Stock Connect, the null hypotheses of no Granger causality from Stock Connect turnovers to market RVs are rejected at 10% significance level, while the null hypotheses of no Granger causality from Stock Connect turnovers to market RVs are rejected at 5% significance level. The Granger causality tests confirm that Turnovers via SH-HK and SZ-HK Stock Connect significantly affect the market volatilities and market turnovers.
However, according to
Table 6b, the casual relationship of market RVs and market volumes to Stock Connect turnovers is not as strong as the reverse. About the impact of trading volume, all the null hypotheses of no causality from market volumes to Northbound or Southbound turnovers fail to be rejected at 5% significance level. This indicates that the trading volumes do not contribute directly to Stock Connect turnovers. Higher trading volumes will not influence the activeness of cross-border investors. Similar results are observed from the impact of market volatility. Most of the null hypotheses of no causality from market volatilities to Northbound or Southbound turnovers fail to be rejected at 5% significance level. The only exceptional case is that HSI market volatilities are found to Grange cause Southbound turnovers. The null hypothesis is rejected at 5% level. This may be explained when Hong Kong stock market is more volatile, the capital from Mainland China will be more active to trade. In general, most of the cases are market volatilities or market volumes have no significance impact on either Northbound or Southbound turnovers. Summarizing the results of Granger causality test, the Stock Connect turnovers Granger cause the market volatilities and trading volumes in Both SZ-HK and SH-HK Stock Connect, but not vice versa. Therefore, there are only unidirectional relationships from Stock Connect turnovers to market RVs and market volumes.
Table 7 shows the results for estimated coefficients in the VAR models. The lag lengths of each model, which are chosen with the lowest BIC selection criteria, follow the results in
Table 6. Panel A shows the results for SH-HK Stock Connect, while Panel B shows the results for SZ-HK Stock Connect. The table includes estimated coefficients with corresponding
t-statistics and adjusted R-square. We find that the coefficients of Stock Connect turnovers in RV and market volume equations are mostly positive. For example, the coefficients of Northbound and Southbound turnover in volatility equation of Shenzhen market are 0.058 and 0.232, respectively. This implies that increase in Stock Connect turnover causes higher market volatility and market volume on the next trading day. In other words, the increase in market volatility follows the rise of activeness of the cross-border investors.
For the market volume equations, we find that the coefficients of Stock Connect turnovers in Shenzhen and Hong Kong market are statistically significant at 5% level mostly, but the coefficients do not have unified sign. For example, the coefficients of northbound and southbound in market volume equation for Shenzhen market are −0.158 and 0.151 respectively, while they are significant at 1% level. Another observation is the negative impacts of the market volatilities on market volume. For example, for SZ-HK Stock Connect, the coefficients of volatility in Shenzhen and Hong Kong market volume equation are −0.098 and −0.005, respectively. It reveals that the relatively low volume follows high market volatility. The results of estimated coefficients in
Table 7 are consistent with the results of Granger causality test in which the market RV and market volume do not have significant impact on Northbound and Southbound Volume in general.
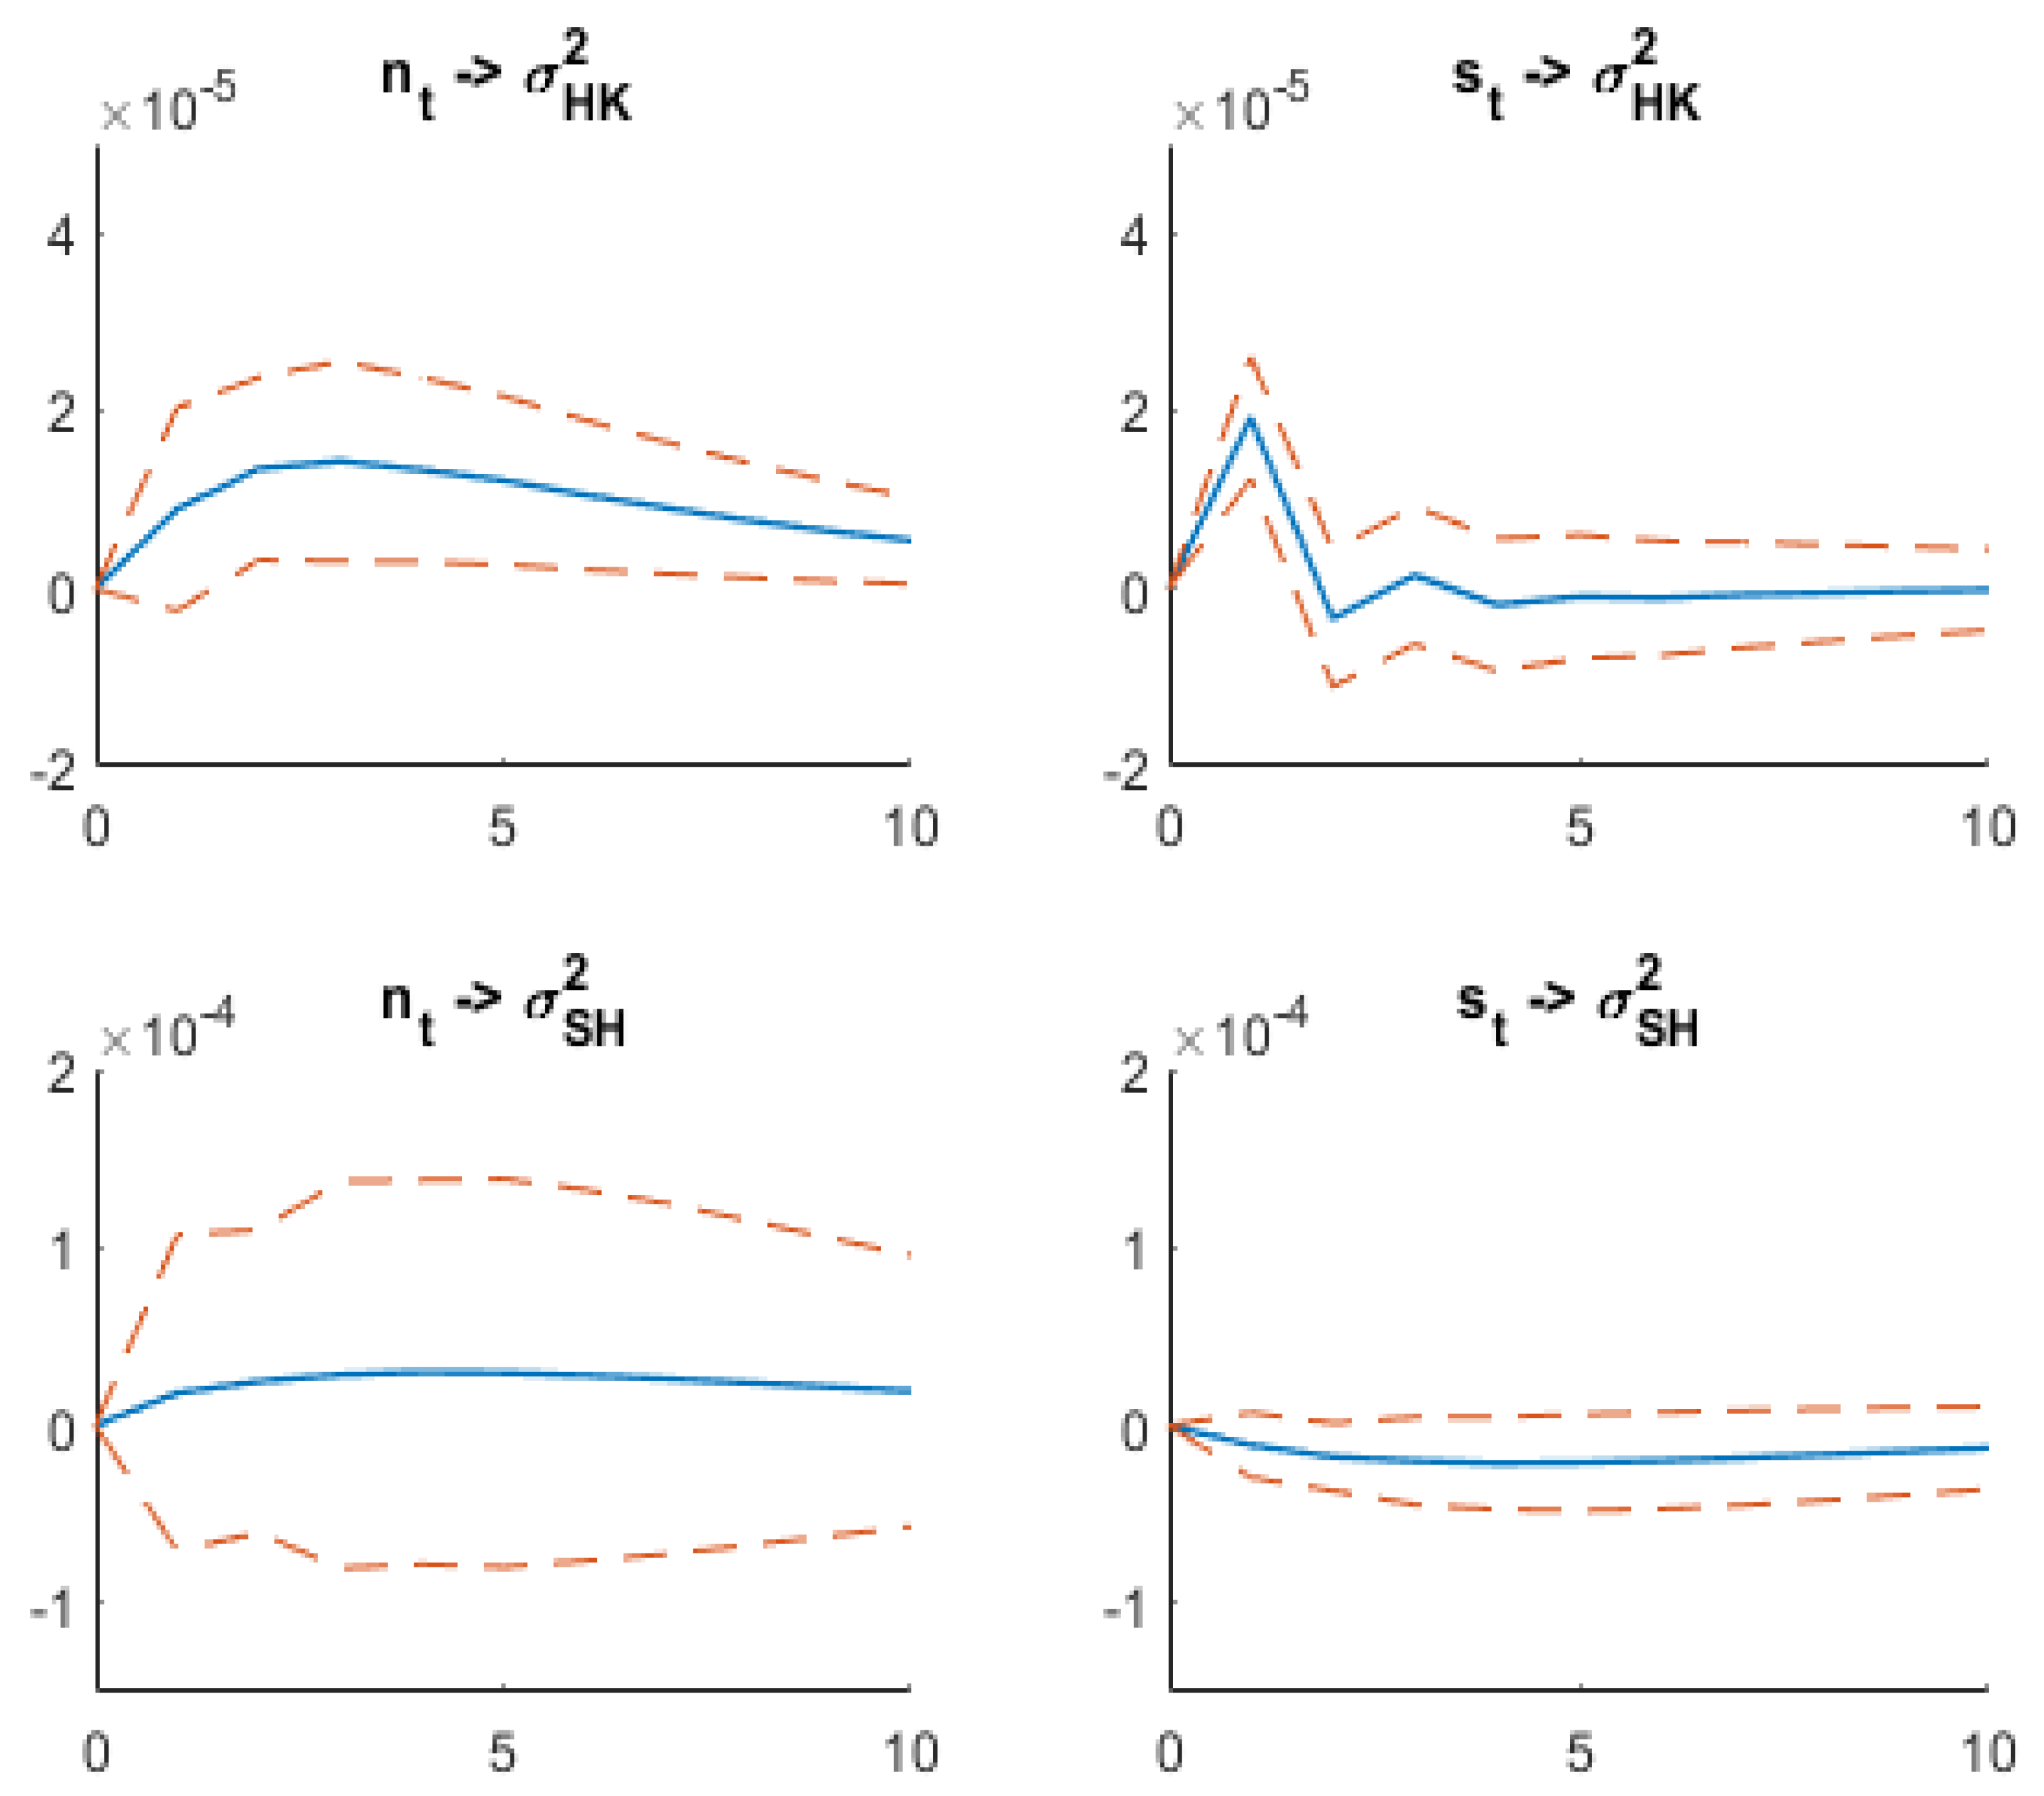
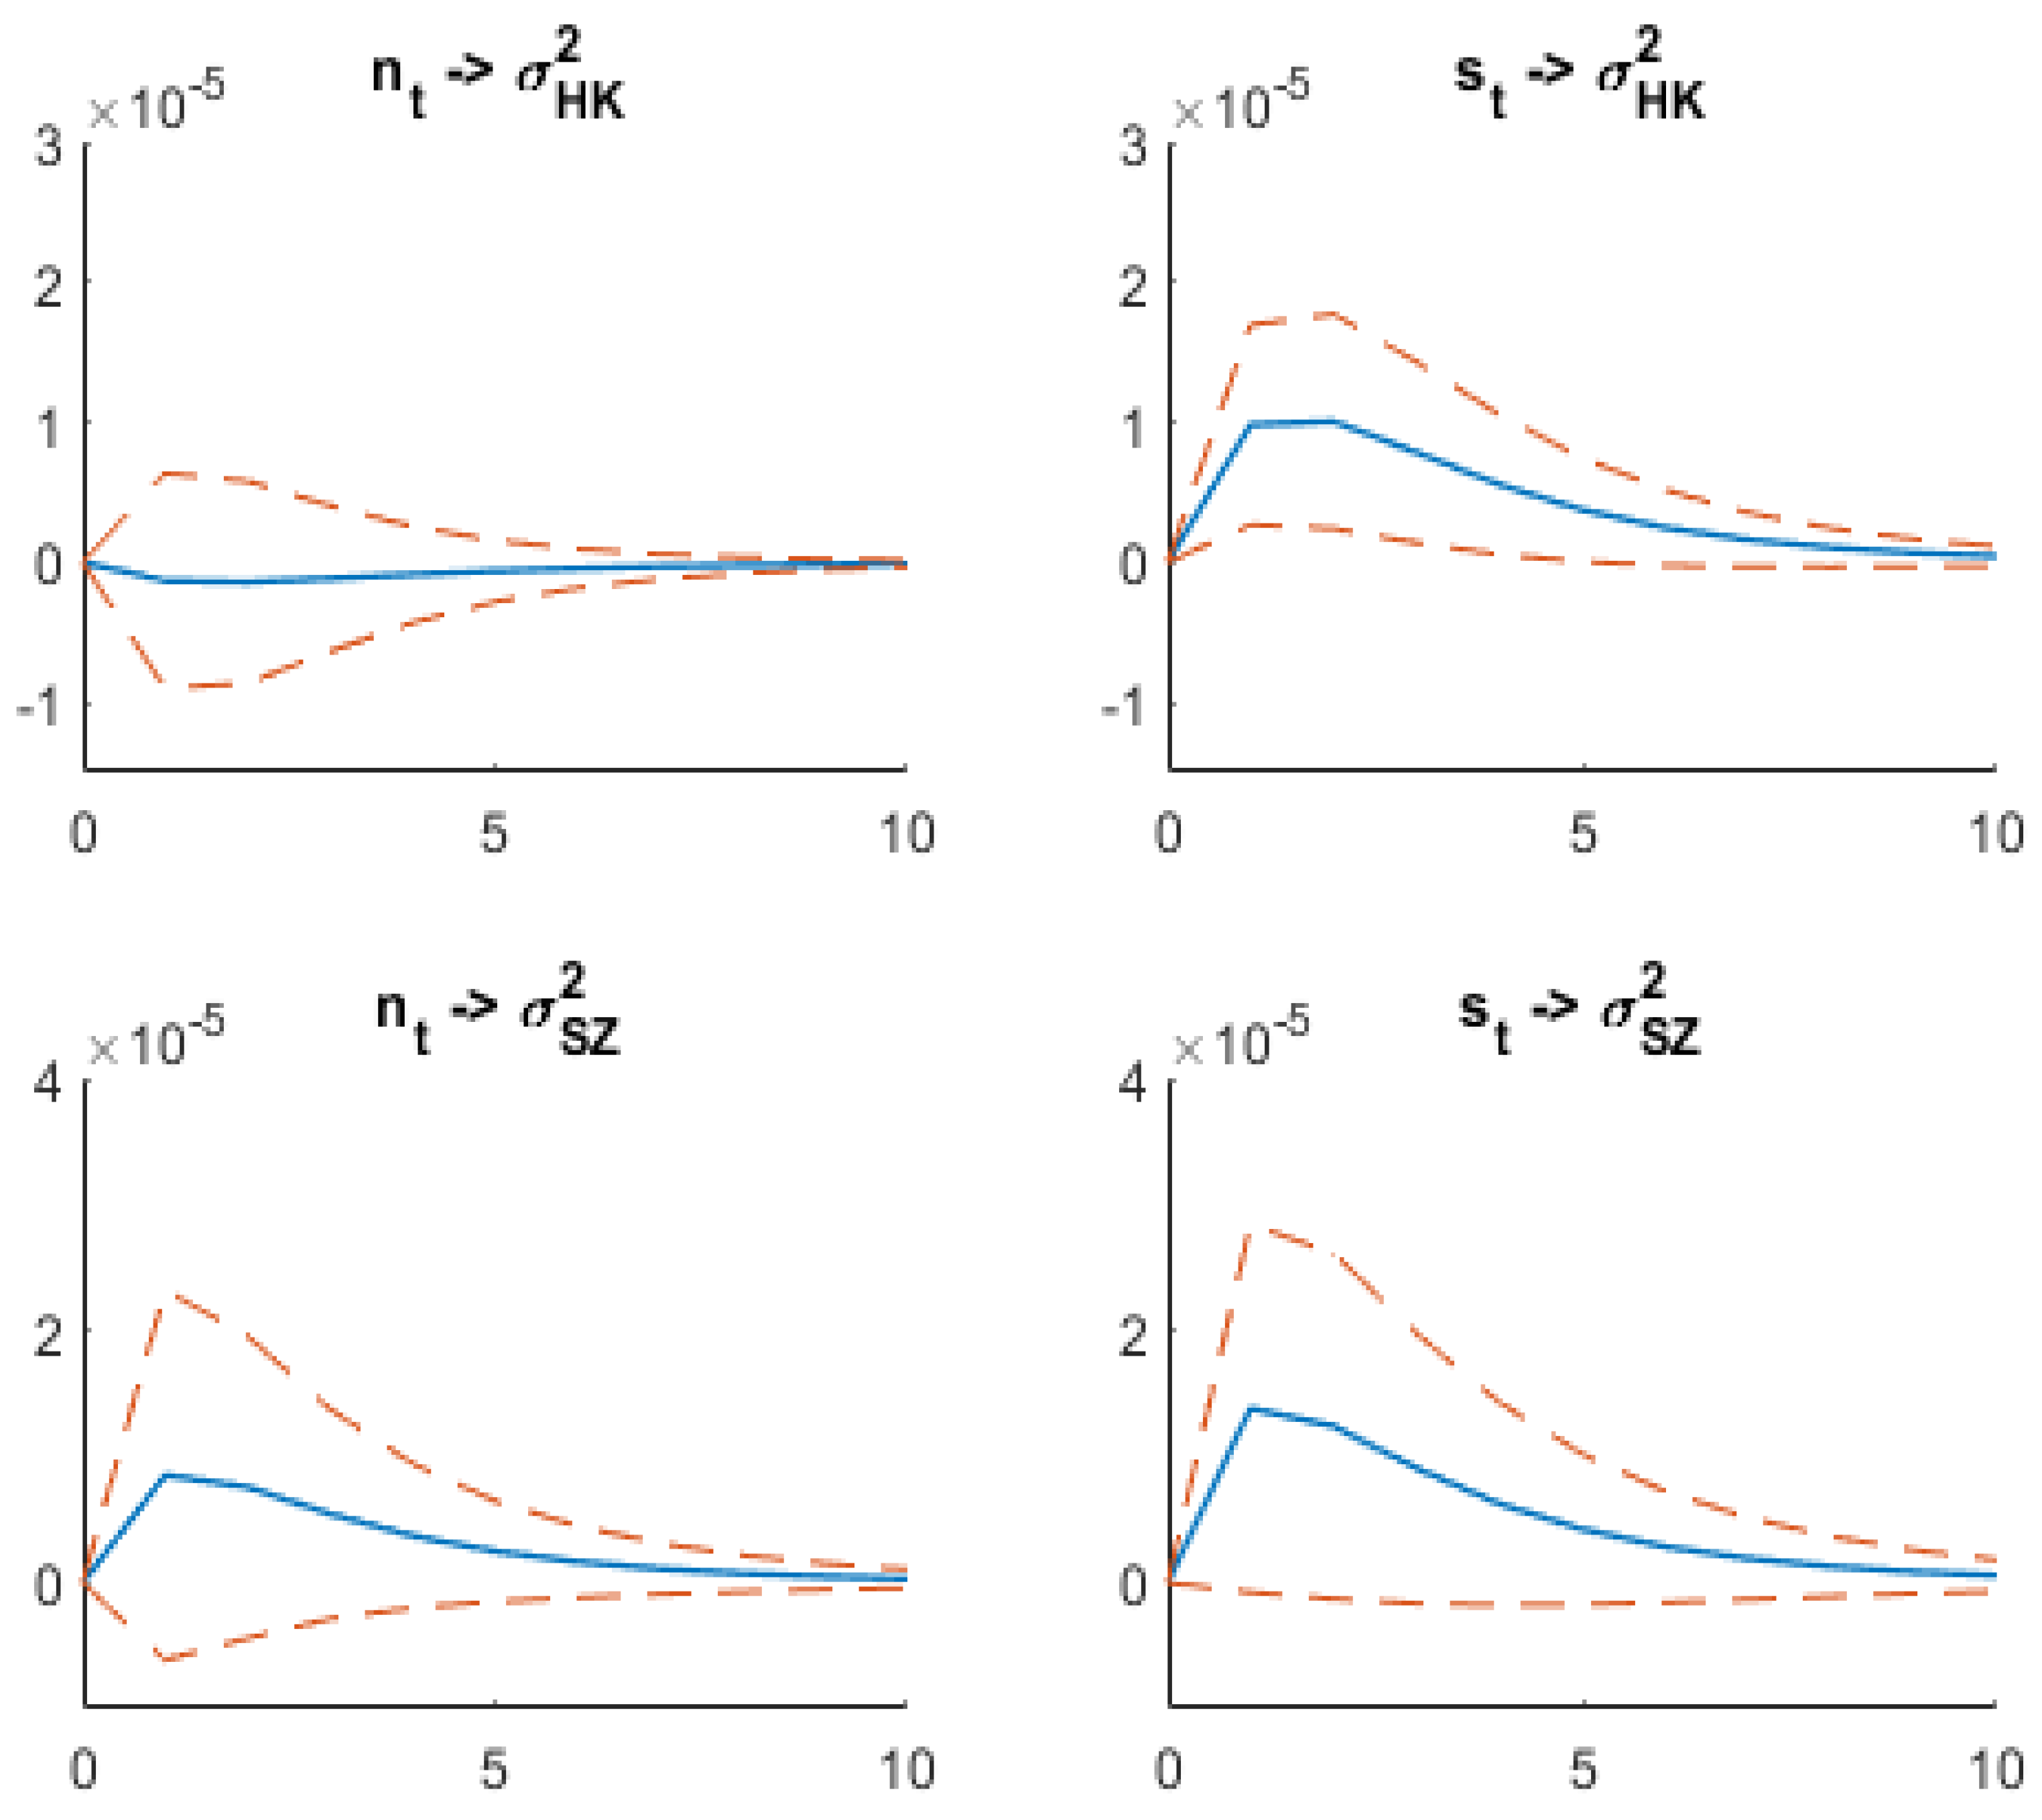
1To further investigate the relationship among Stock Connect turnovers, market volatilities and volumes, we examine how the realized volatilities are affected by the shocks of the Stock Connect turnovers via impulse response function
2, as shown in
Figure A3 and
Figure A4, along with 95% confidence intervals. We consider two groups of impulse responses in turn: realized volatility of Hong Kong and Shanghai indexes response to SH-HK Stock Connect turnover shocks and RVs of Hong Kong and Shenzhen index response to SZ-HK Stock Connect turnover shocks. From
Figure A3, we can see that Hong Kong market index has the largest response to the shock of Northbound and Southbound of Stock Connect turnovers in all cases. The Northbound and Southbound turnovers have maximum impacts on Hong Kong market index after 1 day and 4 days, respectively. In SZ-HK Stock Connect, the impact of Stock Connect turnover to Hong Kong market index is higher than that to Shenzhen market index. In general, both Northbound and Southbound Stock Connect turnovers have positive impacts on the realized volatility indexes. The only exceptional case is that Northbound of SZ-HK Connect turnover has a very small negative impact on the volatility of Hong Kong market.
In addition, we perform rolling-window regression to market volatility with the lag term of market volatility, market trading volume and Northbound and Southbound turnovers. To examine the predictive power of Northbound and Southbound of Stock Connect turnovers to the market volatilities, we compare it with the reduced models which omit the lag term of Stock Connect variables. The horizon of rolling-window regression is 250 days.
Figure A5 shows the adjusted R-square of the full model minuses that of the reduced model over time. Including Stock Connect turnovers into the regression model gives higher adjusted R-square along time. Higher adjusted R-square of the full model indicates that including the Northbound and Southbound Stock Connect turnovers gives improvements to the predictive models of market volatilities.
5. Conclusions
This paper contributes to the literature of Stock Connect turnover with a focus on the impact of Stock Connect turnovers on volatilities in Shanghai, Shenzhen and Hong Kong stock markets. Our result indicates that there are unidirectional relationships between Stock Connect turnover and market volatility in addition to trading volume. This result clearly suggests the need for a different framework to study realized volatility in stock markets with special features such as the Hong Kong stock market in the future. On the theoretical side, the results are not directly replicable in other markets without the unique trading volume data. On the practical side, our results provide enhanced risk management models for volatility sensitive investment in Hong Kong market.
Table 6 summarizes the results of Granger causality tests. Panel A shows the summary of Granger casualty test of Stock Connect turnover against market RV and market volume, while Panel B shows the summary of Granger casualty test of market RV and market volume against Stock Connect turnover. The first column includes the null hypotheses of the tests and the second column displays the implication of rejecting the null hypotheses. The optimal lag chosen for the test and the Wald statistics with
p-values are shown in the third and last columns respectively.
Table 7 displays the estimated parameters and t-statistics of Vector Autoregressive (VAR) models of realized volatilities, market volumes and Northbound and Southbound Stock Connect turnovers. The Vector Autoregressive (VAR) model is of the form
where
and
denote RVs and detrended market trading volumes in each market, respectively. Variable
and
are the different choices of categorized Stock Connect turnovers, and
are the error terms following Gaussian distribution. The optimal lag length
p is calculated by using the Bayesian information criterion (BIC).


