1. Introduction
The efficient market hypothesis (EMH) is considered one of the substantial propositions in social sciences. It is captivatingly modest, has great significance for academic theories and professional practices and is surprisingly irrepressible to empirical evidence or refutation. Even after numerous decades of research and hundreds of published articles, researchers have not yet stretched to a consensus about whether markets are efficient or not.
In an informationally efficient market, price fluctuation should be unpredictable if prices are correctly projected, that is, if they completely integrate the information and anticipations of all market participants. Anomaly returns are discovered as a result of an empirical test that relies on the joint null hypothesis to wit that financial markets are informationally efficient, and as a result of a pattern of returns that is also consistent with predefined valuation models. If the mentioned null hypothesis is rejected, we are unable to identify that the rejection is the result of either part of the hypothesis. The rejection of the hypothesis mainly considers that markets are not efficient; such conclusions are not appropriate because these hypothesis rejections could be the result of an incomplete/inappropriate model. This debate is long-standing, i.e., if markets are efficient and estimation models are correctly valuing the stocks, then why do investors have sustained excess returns? In consideration of leading arguments, this study focuses on all possible dimensions that explain the likely reasons for excess returns.
Essentially, financial anomalies are cross-sectional and time series variant returns that are not explained by any theory or paradigm;
Kuhn (
1970) explained the concept of anomaly, and it can be traced in history with his name. Anomalies are experiential results that seem to be fluctuating with developed theories of asset pricing behaviour. After anomalies are documented in the finance literature, they often seem to disappear, inverse, or weaken. This raises a question as to whether these are opportunities found in the past, but have since been arbitrarily thrown away, or whether they were just statistical abnormalities that fascinated the devotion of academics and practitioners. Robust anomalies, possibly proof of abnormal gains or asset returns, are not fully accounted for. However, theorists have struggled to give ex-post risk-based reasons for many of the anomalies identified in the literature.
According to the EMH, there is no room for excess returns, although later on, different anomalies are found and investors gain excess returns even with the existence of the EMH. Recently, the literature has found a shred of evidence that these anomalies are weak in magnitude, or sometimes their presence was just a falsification when these studies were replicated. Therefore, this narrative review article is an attempt to address this issue and to combine historical literature from every possible dimension to try to make an extensive study of the available evidence for researchers who are interested in doing their research in this particular field. In addition, this narrative review not only explains the existing knowledge of the topic based on the published research, but it is also an attempt to explain the current state of understanding on the topic.
Existing literature does not have much focus on the critique of existing anomalies as there are many anomalies that have been found to be just a falsification. Hence, this review article makes an addition to the historical literature by raising the question on the authentication of existing anomalies based on newly published evidence. While this study will not only help academics and practitioners to find extensive literature on anomalies for their future research, it will also help investors in many ways. For example, the study will help investors to calculate the expected returns on stocks by using different valuation parameters. Secondly, based on varying anomaly characteristics, this research will assist investors to create profitable portfolios in order to gain excess returns. Thirdly, this study will also be valuable for academics, practitioners and investors to authenticate the true existence of past anomalies instead of relying on existing published literature.
There are several hypotheses that motivate us to find, elaborate and criticise all the available evidence in the literature. One primary reason behind this study is the existence of the efficient market hypothesis. Finance literature has tried to criticise this theory from behavioural aspects, i.e., the existence of a fully efficient market is almost impossible in the real world. Second, in the age of digitalisation when markets are more efficient than ever, how are these anomalies still sustained? Third, the number of anomalies in literature has increased tremendously, and raises the question as to whether existing valuations models are appropriate enough. Fourth, as the number of anomalies is growing gradually, will the magnitude of the anomalies persist? Finally, some shreds of evidence have recently been found that suggest that either anomalies have disappeared or their magnitude is weaker and sometimes, it is believed that these anomalies were just a falsification or p-hacked to show significant results for publications. From the given argument, this study explored a new dimension to replicate the existing literature to authenticate its validity.
The rest of the paper is organised as follows.
Section 2 describes the efficient market hypothesis and gives a historical view of the EMH and its existence in the modern era. In
Section 3, authors explore the historical return parameters and discuss the widely used valuation models for stock returns.
Section 4 covers the cross sectional excess returns and all possible reasons for these returns.
Section 5 raises questions on the credibility of the existing literature and explores a new dimension for future research. The final section presents the conclusion of the study.
2. The Efficient Market Hypothesis
Economists and academics have broadly acknowledged the efficient market hypothesis (EMH), as defined by Fama in his important survey article “Efficient Capital Markets” (
Fama 1970), which states that securities markets are efficient in the reflection of news/information about particular stocks or about the overall market as a whole. The generally accepted view is that the information flow is smooth, and that it is incorporated into the stock market without any delay. Therefore, technical analysis, which is the study of past stock prices in an effort to forecast future prices, and fundamental analysis, which is the exploration of financial information (such as asset values and company earnings) to help investors select “under-priced” stocks, may not permit an investor to realise returns greater than those that could be gained by holding a randomly chosen portfolio of stocks, at least not with comparable risk. List of selected papers for this section are given in
Table 1.
2.1. Early Developments of the Efficient Market Hypothesis
According to
Verheyden et al. (
2013), with regards to the stock exchanges of Paris, London and New York, stock prices are the smartest reflection of market participants. L. Bachelier is considered to be one of the pioneers of the EMH: in 1900, he published “speculation theory”, in which he explored the theory that expected returns for stocks always remained zero (
Sewel 2011). The first half of the 20th century demonstrated well the randomness of stock prices, and most economists work under this assumption. (
Pearson 1905) was the first scholar who used the concept of “Random Walk”, in 1905, but he used it in the field of botany, not in the field of economics and finance. F. MacCauley used the coin-tossing game in 1925 as an example and compared it with stock prices. Later on, (
Cowles 1933) observed the trading patterns of different investors with professional expertise and found that even professional investors were unable to predict excess returns; he concluded the same results later on, in 1944, by analysing the data of the U.S. stock market. The famous economist, J.M. Keynes, renowned for his work “Real Economy”, gave insights regarding financial markets and asset pricing (
Keynes 1923). He argued that investor gains are not associated with their ability to predict excess returns, but related to the level of risk of the investment.
Post-World War 2, an increasing number of studies emerged in support of the EMH. (
Kendall and Hill 1953) concluded, through a time series experiment of 22 stocks, that stock returns are random. These results were surprising for many economists at that time (
Dimson and Mussavain 1999). Later on, (
Roberts 1959) and (
Alexander 1961) confirmed these results, once more in favour of the EMH (
Sewel 2011). This pattern was not consistent for a longer horizon, as some studies reported inverse results as well; these results, later on, created a foundation for the critics of the EMH.
Alexander (
1964) found that U.S. stock prices were not consistent with the concept of a random walk and
Steiger (
2004) found a predictable pattern in stock returns. Thus, after World War 2, studies on the EMH increased significantly, but not all studies concluded in favour of the EMH hypothesis (
Malkeil 1973).
According to (
Shiller 2003), the EMH gained immense popularity during the 1980s. E. Fama, a U.S. economist, became a classic in this field and his work was pioneering for efficient markets. He claimed that the evidence in favour of the EMH was strong, and that it could be only neglected if it was empirically tested on a large scale (
Fama 1965). The work of H. Roberts went in a new direction, where he divided efficient markets into strong and weak forms. Later on,
Fama (
1970) further extended this division and added a semi-strong form of efficiency. By considering this extension in the division, the flow of information, and its impact on the market price of stocks, market efficiency was divided into three parts. The three basic types of market efficiency are mentioned in
Figure 1.
The three versions of the efficient market hypothesis are varying degrees of the same basic theory. The strong form version of the efficient market hypothesis states that all information (both the information available to the public and any information not publicly known) is completely accounted for in current stock prices, and there is no type of information that can give an investor an advantage on the market. The semi-strong efficiency theory follows the belief that, because all public information is used in the calculation of the current price of a stock, investors cannot utilise either technical or fundamental analysis to gain higher returns in the market. The weak form suggests that the current stock prices reflect all the data of past prices and that no form of technical analysis can be effectively utilised to aid investors in making trading decisions. Advocates for the weak efficiency theory believe that, if fundamental analysis is used, under-valued and over-valued stocks can be determined.
Until 1970, the idea of EMH was prevalent amongst academics but only a little admired by professionals.
Malkeil (
1973) published the book “A Random Walk Down Wall Street” in 1973, which was considered to be a game changer for this situation.
Shiller (
2003) said that, after the book was published, the EMH was more fascinating for professionals than academics. “The random walk” concept is directly connected with the efficient market hypothesis, which is used in the literature to elaborate a series of prices, where all subsequent changes occurred randomly. The theory behind the idea of a random walk is that, if the flow of information is unimpeded and stocks instantly absorb the effect of this information, then the price fluctuations tomorrow will be due to the news/information of tomorrow; it will be independent of, or not affected by, any event which occurred on any other day. Therefore, the prices of stocks will reflect all known information and news; even uninformed investors can attain profitable returns by keeping a diversified portfolio, based on the tableau of prices in the market as generously as experts can obtain.
Capital markets are closely related to “cost efficiency”; however, other markets are analysed from a different perspective, such as “allocation efficiency” (
Durlauf and Blume 2008). Generally, in an efficient market, the fundamental information of a firm can be observed in their stock prices. In this case, the market value of a company fluctuates in a way very similar to that of the intrinsic value of the company. Therefore, these changes are inconsistent with value and cannot restrain from trading of financial assets. Uneven awareness of investors and volatile transaction costs avoid fundamental changes in the value to reflect the market prices.
Based on EMH, it is not possible to make excess returns from stocks. Therefore, if the market retains a weak form of efficiency, technical analysis yields no excess return. In a semi-strong form of efficiency, stocks not only reflect the historical prices, but reveal all publicly available information as well. Finally, in the strong form of an efficient market, stock prices reflect all information, not just limited to publicly available information.
2.2. Modern Era of Efficient Market Hypothesis and Its Critics
Entering into the 21st century, the intellectual dominance of the efficient market hypothesis was not as universally accepted, as many economists believed that stock prices were partially predictable, which began a new era of discussion; that returns on a stock can be predicted, as well as sustained. It is understood that a new generation of economists began to believe that there exist some behavioural and psychological aspects which enable the prediction of stock prices.
Lo and MacKinlay (
1990) found that “too many” consecutive transfers in the same direction permitted them to reject the hypothesis that stock prices could be described as true random walks. There were many predictable patterns, which disappeared after some time, and these patterns were a part of the published literature of economics and finance.
Schwert (
2001) explained two possible explanations for such patterns. One possible reason regarded the researchers, who were always sifting through mountains of data. They focused on those results which challenged the perceived wisdom; they focused on a particular sample or used a specific technique to get significant results, so that they could challenge the efficient market hypothesis. Therefore, it was possible that practitioners would soon realise these predictable patterns, exploit them to some extent, and then render them no longer profitable. List of selected papers for this section are given in
Table 2.
In terms of the short run—returns measured in terms of days or weeks—one possible argument that challenged the efficient market hypothesis regarded the existence of a positive serial correlation. Many studies that reported negative serial correlation can be found in the literature, as well, where these return reversals were over a more extended period of holding.
French (
1980) gave the most relevant example, where 25–40% of the deviation in extended holding period returns could be forecasted, in terms of a negative correlation with previous returns.
Poterba and Summers (
1988) also found mean reversals in the long horizon of stock holding periods.
Fluck et al. (
1997) developed an investment strategy in which they simulated data for 13 years, from 1980 to the early 1990s. Their sample consisted of stocks that were poor performers in the past 4–5 years; their strategy worked, predicting that stocks which performed poorly in the past 3–5 years would perform better in coming years and, inversely, that those stocks that performed well in previous years would perform poorly in the future.
Some researchers have argued that January is a very unusual month for stock market returns. Equally weighted or value-weighted returns in the first two weeks of this month are comparatively higher than in other periods of the year. According to
Keim (
1983), return premiums are evident for stocks with low market capitalization.
Haugen and Lakonishok (
1988) mentioned high January returns in their book, titled “The Incredible January effect”. The January effect is not only calendar anomaly; there have been some specific day of the week anomalies found in the literature. For example,
Fama (
1998) documented that there are significantly higher returns on Monday compared to the rest of the week. A significant difference has also been found in average daily returns amongst countries other than the United States (
Hawawini and Keim 1995). A considerable pattern has been observed at the turn of the month (
Lakonishok and Smidt 1988), and excess returns have been found around holidays (
Ariel 1990).
One general problem with anomalous returns is that they are not dependable from one period to another. These non-random effects, even if we consider them to be reliable, are deficient in magnitude and we cannot exploit them, as the transaction cost may elude its effect.
With technological advancements facilitating vibrant creation, sharing, and collaboration among Web users, the impact of digital media on stock markets has been increasingly prominent. Many studies have investigated the effect of digital media on stock movements (
Bollen et al. 2011).
Liu and Zhang (
2012) analysed the effectiveness of wording in clarification announcements. They found that detailed clarification of information helps to mitigate the impact of rumours, and stock prices tend to return to normal levels after 30 trading days. More notably, digitalised platforms as a governance strategy of regulating authorities have been implemented for a long time. Therefore, richer information releases by digital platforms increase market transparency (
Wang et al. 2019).
Brealey et al. (
2011) studied many blue-chip stocks and the correlation coefficient of returns over two consecutive days falls between −0.3% and 0.3%. These results give a precise prediction that the current return will not affect the return tomorrow, but one can argue, for a short period, that this period is not enough to capture potential dependencies.
Shleifer (
2000) explained that technical analysis could be applied to test stock return predictability, but this is not be applicable with a longer horizon. Although technical analysis is widely used for expected returns, it will only be useful for excess returns if there are zero transaction costs (
Parks and Zivot 2006). Technical analysis is currently less popular among researchers and academics, but is still widely used by professionals (
Mishkin and Eakins 2012).
Active portfolio management and passive portfolio management describe another favourable point for EMH. If an actively managed portfolio failed to perform better than a passively managed portfolio, then it is not lucrative to make use of market information, and the market is efficient.
Brealey et al. (
2011) found that aggregate excess returns should be zero or negative, which is consistent with the EMH.
Malkiel (
2003) obtained data from 1991 to 2001 and found that more than 70 percent of mutual funds from the U.S. earned lower returns than their benchmark. Consistent results were obtained when
Malkiel (
2011) studied an extensive data set from 1970 to 2010 and found that more than 66 percent of U.S. mutual funds yielded fewer returns than the benchmark. Mutual funds that performed well in the short term were unable to perform consistently in a more extended period.
3. Early Valuation Parameters and Models Used to Predict Excess Returns
3.1. Early Valuation Parameters
Initial valuation parameters play a vital role in the prediction of returns, and many researchers have explored this connection. Researchers have claimed that there exist financial ratios, such as price/earnings multiple ratios or dividend yield as a whole market, which have considerable predictive power in attaining excess returns. Researchers have found a strong and long-lasting tendency for small firms to generate more substantial returns than big firms and that value firms tend to out-perform growth firms. List of selected papers for this section are given in
Table 3.
3.1.1. Dividend Yield and Excess Returns
The dividend yield has the power to predict future returns, and this work, in a statistical way, was first done by
Fama (
1998) and
Campbell and Shiller (
1988). Depending on the prediction of the forecasting horizon, around 40 percent of the variance in the future stock returns of the overall stock market are predicted by the initial dividend yield of the total stock index. However, these predictions are not constant in every situation and, later on, many economists contradicted its implications and existence on a different basis. For example,
Bagwell and Shoven (
1989) and
Fama and French (
2001) suggested that this pattern was not consistent in the U.S., where one possible argument was that U.S. firms do not have a consistent pattern in the dividend. Company dividend policies, in the 21st century, have been changing, and they are focused more on share re-purchases than on dividend payouts. Therefore, the dividend yield is not as meaningful in recent times as it has been in the past. According to
Fluck et al. (
1997), this is an important issue, as this phenomenon does not frequently work with individual stocks. Investors who buy a portfolio of individual stocks with the maximum dividend yields in the market will not produce a high rate of return. A prevalent example of this high dividend investment strategy in the U.S. is the so-called “Dogs of Dow” strategy, in which investors buy ten stocks of the Dow Jones Industrial averages with the highest dividend yield. In the past, this strategy worked very well; many “Dogs of Dow” investors aggressively entered into these portfolios and sold them to individual investors. However, these stocks under-performed from 1995 to 1999.
The same type of predictability of the market as a whole, as predicted by dividend yield, can be observed in price/earnings (P/E) patterns as well.
Campbell and Shiller (
1988) stated that initial P/E ratios described as many as 40 percent of the variance of future returns. They concluded, by considering the P/E ratio, that equity returns in the past were predictable, up to some extent. Several other predictable time series patterns exist in the literature; for example, (
Fama and Schwert (
1977) argued that stock returns are affected by short-term interest rates and that returns can be predicted through interest rates.
Campbell (
1987) explained that the term structure of interest rate spreads has considerable importance in the prediction of future stock returns.
3.1.2. Firm Size and Excess Returns
Researchers have found a sturdy and long-lasting tendency for smaller firms to generate more substantial returns than big firms.
Keim (
1983) found that smaller firms had, on average, one percentage point higher return than big firms, and that this pattern has existed since 1936.
Fama and French (
1993) used data from 1963 to 1990 and made a portfolio, according to firm size. They divided stocks into deciles by size, the first decile belonging to 10 percent of the smallest firms, and the 10th decile consisting of 10 percent of the biggest firms. The results, as plotted in
Figure 2, showed a clear prediction that smaller firms generated, on average, higher monthly returns than big firms.
The critical problem here is the degree to which the higher returns of small companies represent a predictable pattern that will permit investors to make excess risk-adjusted returns. If we consider the Capital Assets Pricing Model as a true model, the value of beta measures the sensitivity/risk of a stock or the extent to which individual stock returns vary with overall market return. Here, beta is a true measure for capturing the systematic risk of the Capital Asset Pricing Model and is considered to be a true statistical measure of risk assessment; in this case, the size effect will be considered to be an anomaly.
Fama and French (
1993) found that the average relationship between return and beta was flat, instead of upward sloping, which is consistent with the predictions of the Capital Assets Pricing Model.
Furthermore, if the stocks were divided by beta deciles, 10 portfolios constructed on the basis of size would show the same type of relationship, as shown in
Figure 2. At the same time, within each size portfolio, the relationship between return and beta continues to be flat. Based on these findings,
Fama and French (
1993) suggested that the size of beta is a much better proxy for risk than beta itself, and that it should not be taken either as an anomaly or inefficiency.
Although the size factor has gained a lot of attention, questions arose during the mid-1980s. Instead of smaller firms, larger firms gained more risk-adjusted returns. One of the core reasons behind this trend was growing institutionalization in stock markets throughout the world, where managers tended to prefer big firms, due to more liquidity. Survivorship bias mostly affects small firms and some studies in the literature have focused on this issue. In the modern era, it is possible to identify those small firms who have survived and to separate them from those who did not. Therefore, researchers today can easily avoid survivorship bias, which was not possible before.
3.1.3. Value Stocks and Excess Returns
Many studies have suggested that value stocks outperform growth stocks. Stocks with a low price/earnings ratio are recognised as value stocks and these stocks gain higher returns than growth stocks, which are defined as stocks with a high price/earnings ratio. This was first identified by
Francis (
1960) and, later on, it was tested and confirmed by
Ball (
1978) and
Basu (
1983).
Kahneman and Riepe (
1988) related it to behavioural perspectives, as investors can be over-confident in their ability for the projection of high growth returns and, thus, they overpay for growth stocks. Later on, by using price/cash flow multiples,
Hawawini and Keim (
1995) obtained the same results. The stock price-to-book value ratio has been found to be a good predictor of future returns, which is a proxy measured as the total value of assets minus total liabilities and difference divided by a total number of outstanding shares. The low magnitude of this proxy is considered to be a hallmark of the so-called “value” in equity stocks and these findings have been consistent with the view of behavioural economists that investors are ready to overpay for “growth” stocks, where expectations will no longer stand with their opinion and expectations.
Fama and French (
1993) concluded that size and market-to-book ratio have a significant impact and considerable explanatory power in the prediction of expected future returns. Later,
Fama and French (
1997) concluded that the effect of the Market/Book value holds not only in the U.S., but also has an impact in many other countries.
Subsequent results still provide some questions regarding the efficiency of the market if we accept Capital Assets Pricing Model (CAPM), as has been pointed out by
Lakonishok et al. (
1994); however, even these findings could not relate to the inefficiency of the market. They argue that CAPM is unable to capture all dimensions of risk.
Fama and French (
1993) suggested that the market-to-book ratio is a risk factor that should be priced to market, but that the Capital Assets Pricing Model is unable to capture its effect. They also argued that a three-factor model, including size and market/book value risk factors, is an appropriate measure to test different anomalies.
Here, we should keep in mind that every study (or all published literature) is time-dependent, even when these studies or results hold over decades.
Ball et al. (
2019) predicted that book-to-market strategies work because the retained earnings component of the book value of equity included the accumulation and, hence, the average of past earnings.
Schwert (
2001) discussed an investment firm “Dimensional fund advisors”: this firm starts a mutual fund and selects value firms as an investment by considering the criteria defined by
Fama and French (
1993). The abnormal return on the portfolio, adjusted for the beta, was negative 0.2 percent from 1993 to 1998. These results, with the absence of abnormal returns, are consistent with those who believe that these findings regarding abnormal “value” returns are just actively managed portfolios by taking only a trending period for their study.
3.2. Excess Returns and Valuation Models
List of selected papers for this section are given in
Table 4.
3.2.1. Capital Assets Pricing Model
CAPM has faced much criticism from financial scholars, yet it is still the most widely used asset pricing model in financial research (
Rasheed et al. 2016). “Anomaly Returns”, in the context of financial economics, refer to the rejection of or relation to deficiencies in the asset pricing model (
Linnainmaa and Roberts 2016). The EMH was also closely linked with the Capital Asset Pricing Model and the substitution theory of securities (
Degutis and Novickytė 2014). The CAPM has been widely used to measure risk in testing the efficient market hypothesis since it emerged. Therefore, it is necessary to discuss CAPM and its origination, as it is not only used for risk valuation of the efficient market hypothesis; it is also used to test the different anomalies and returns.
Jianu et al. (
2017) created a model, based on physical capital maintenance, that measured the real performance of a company to obtain better information for investors.
Humans are always pursuing betterment, so that they can do their tasks more efficiently and more actively. This phenomenon is applicable in every field of life, even for researchers. Capital Assets Pricing Model (CAPM) has been used to measure the cost of equity and overall portfolio performance since 1970.
CAPM is an extension of the work of
Tobin (
1958) and
Markowitz (
1959), with the additional assumptions that: (i) Selection of investment portfolio is dependent upon expected return and variance of return for a single period; (ii) Estimates should be the same for all assets, in the measurement of mean, variance and covariance; (iii) There is no transaction cost for investment in the capital market; (iv) Assets should be divisible; (v) Short sales should not be regulated and have no restrictions at all; (vi) Investors should have an open opportunity to borrow or lend an unlimited amount of money.
Black et al. (
1972) showed some deviation in the model.
The CAPM equation, also called the security market line, is given by:
where
. is the expected return of stock or cost of equity,
is the Risk free rate of return,
is the expected rate of return of the market portfolio and market, and beta
is the measure of systematic risk of asset
which is defined by
. Equation (1) explains that the expected return is directly related to the systematic risk or covariance of an asset, which means that high risk-taking investors should have high expected returns and vice versa. If CAPM is a true predictor, then the expected return can be predicted with the knowledge of
(risk),
(rate of return), and
(market return). The market
is a measure of slope, calculated in the regression of the excess return
−
on the excess return of the market
. The market beta of a market portfolio is equal to Equation (1), which can be written as:
Equation (2) is the basis of quantitative estimation. Here, we can easily identify that, if the value of market beta is zero, there will be no excess return and, if the value of market beta is equal to 1, the excess returns will be equal to the market risk premium.
Fama and French (
1993) criticised CAPM, in that it is unable to give a true valuation of stock return and works only on the three-factor model. As indicated by the better measure of
Fama and French (
1993), one must expect that people will tend to shift towards a better measure, but survey results stated that about 73.5% of Chief Financial Officerss in the U.S. relied, to some extent, on CAPM in the estimation of the cost of equity (
Graham and Harvey 2001).
Brounen et al. (
2004) worked on the same type of study, where they carried out a survey of 313 European firms, and found that around 45% of CFOs relied on CAPM while valuing the cost of equity. Here, a question arose: why are practitioners not shifting towards the three-factor model of
Fama and French (
2004)? There could be multiple reasons for this. For example, at the start of a period, practitioners may not be completely aware of the three-factor model; it might not be cost effective, as it requires more data and information for the valuation of the additional factors; or, maybe, practitioners think that the three-factor model is not always helpful, as the three-factor model is not still better than CAPM when we study the literature in detail.
CAPM was developed by
Sharpe (
1964) and
Lintner (
1965). If CAPM is considered as a valid predictor, then it can be beneficial in the elucidation of financial issues related to capital budgeting, portfolio selection, cost-benefit analysis and similar economic issues, which require risk and return relationships. Some empirical studies, such as by
Black et al. (
1972) and
Fama and MacBeth (
1973), have provided support for CAPM. CAPM says that the expected return of each stock varies due to its market beta, because every asset has a different value of beta.
Black et al. (
1972) tested whether the time series and cross-sectional regression of excess returns on market beta were zero or not. Therefore, as CAPM explained that the differences in expected return for multiple securities are due to distinctive beta for each security, different variables add nothing to the explanation of the expected returns. With this explanation of CAPM, there may be a new empirical way to test CAPM: by adding security-specific factors that are unrelated to the value of market beta, do these factors explain the cross-section of returns or not?
For this reason,
Fama and MacBeth (
1973) added two additional variables, with monthly returns, in the estimation of the cross-sectional regression; these additional variables were squared market beta and the variance from returns regressed on the market. The purpose behind using the squared market beta was to see whether there was a linear relationship between expected return and market beta. The reason behind taking variance was to see whether beta was the only measure of risk that is required to test expected returns.
3.2.2. Three-Factor Model of Fama and French
During the period from 1980 to 1990, CAPM was heavily criticised, due to the discovery of several anomalies. These anomalies provided a challenge for CAPM: to prove that market beta was sufficient to explain expected stock returns. Some of the renowned anomalies discovered during this period (e.g., leverage, a book-to-market value of equity ratio, earnings-to-price ratio, and so on (
Basu 1977)) found that, when stocks were sorted according to earnings-to-price ratio, stock returns of high E/P ratio were higher than the prediction of CAPM.
Banz (
1981) found the size effect and observed that stocks with low market value earned higher returns than the predictions of CAPM, which meant that small stocks have a higher beta and higher expected returns than those captured by CAPM. (
Bhandari 1988) argued that leverage has a positive relationship with expected stock returns and that the proxy of leverage is the book value of the debt-to-market value of equity.
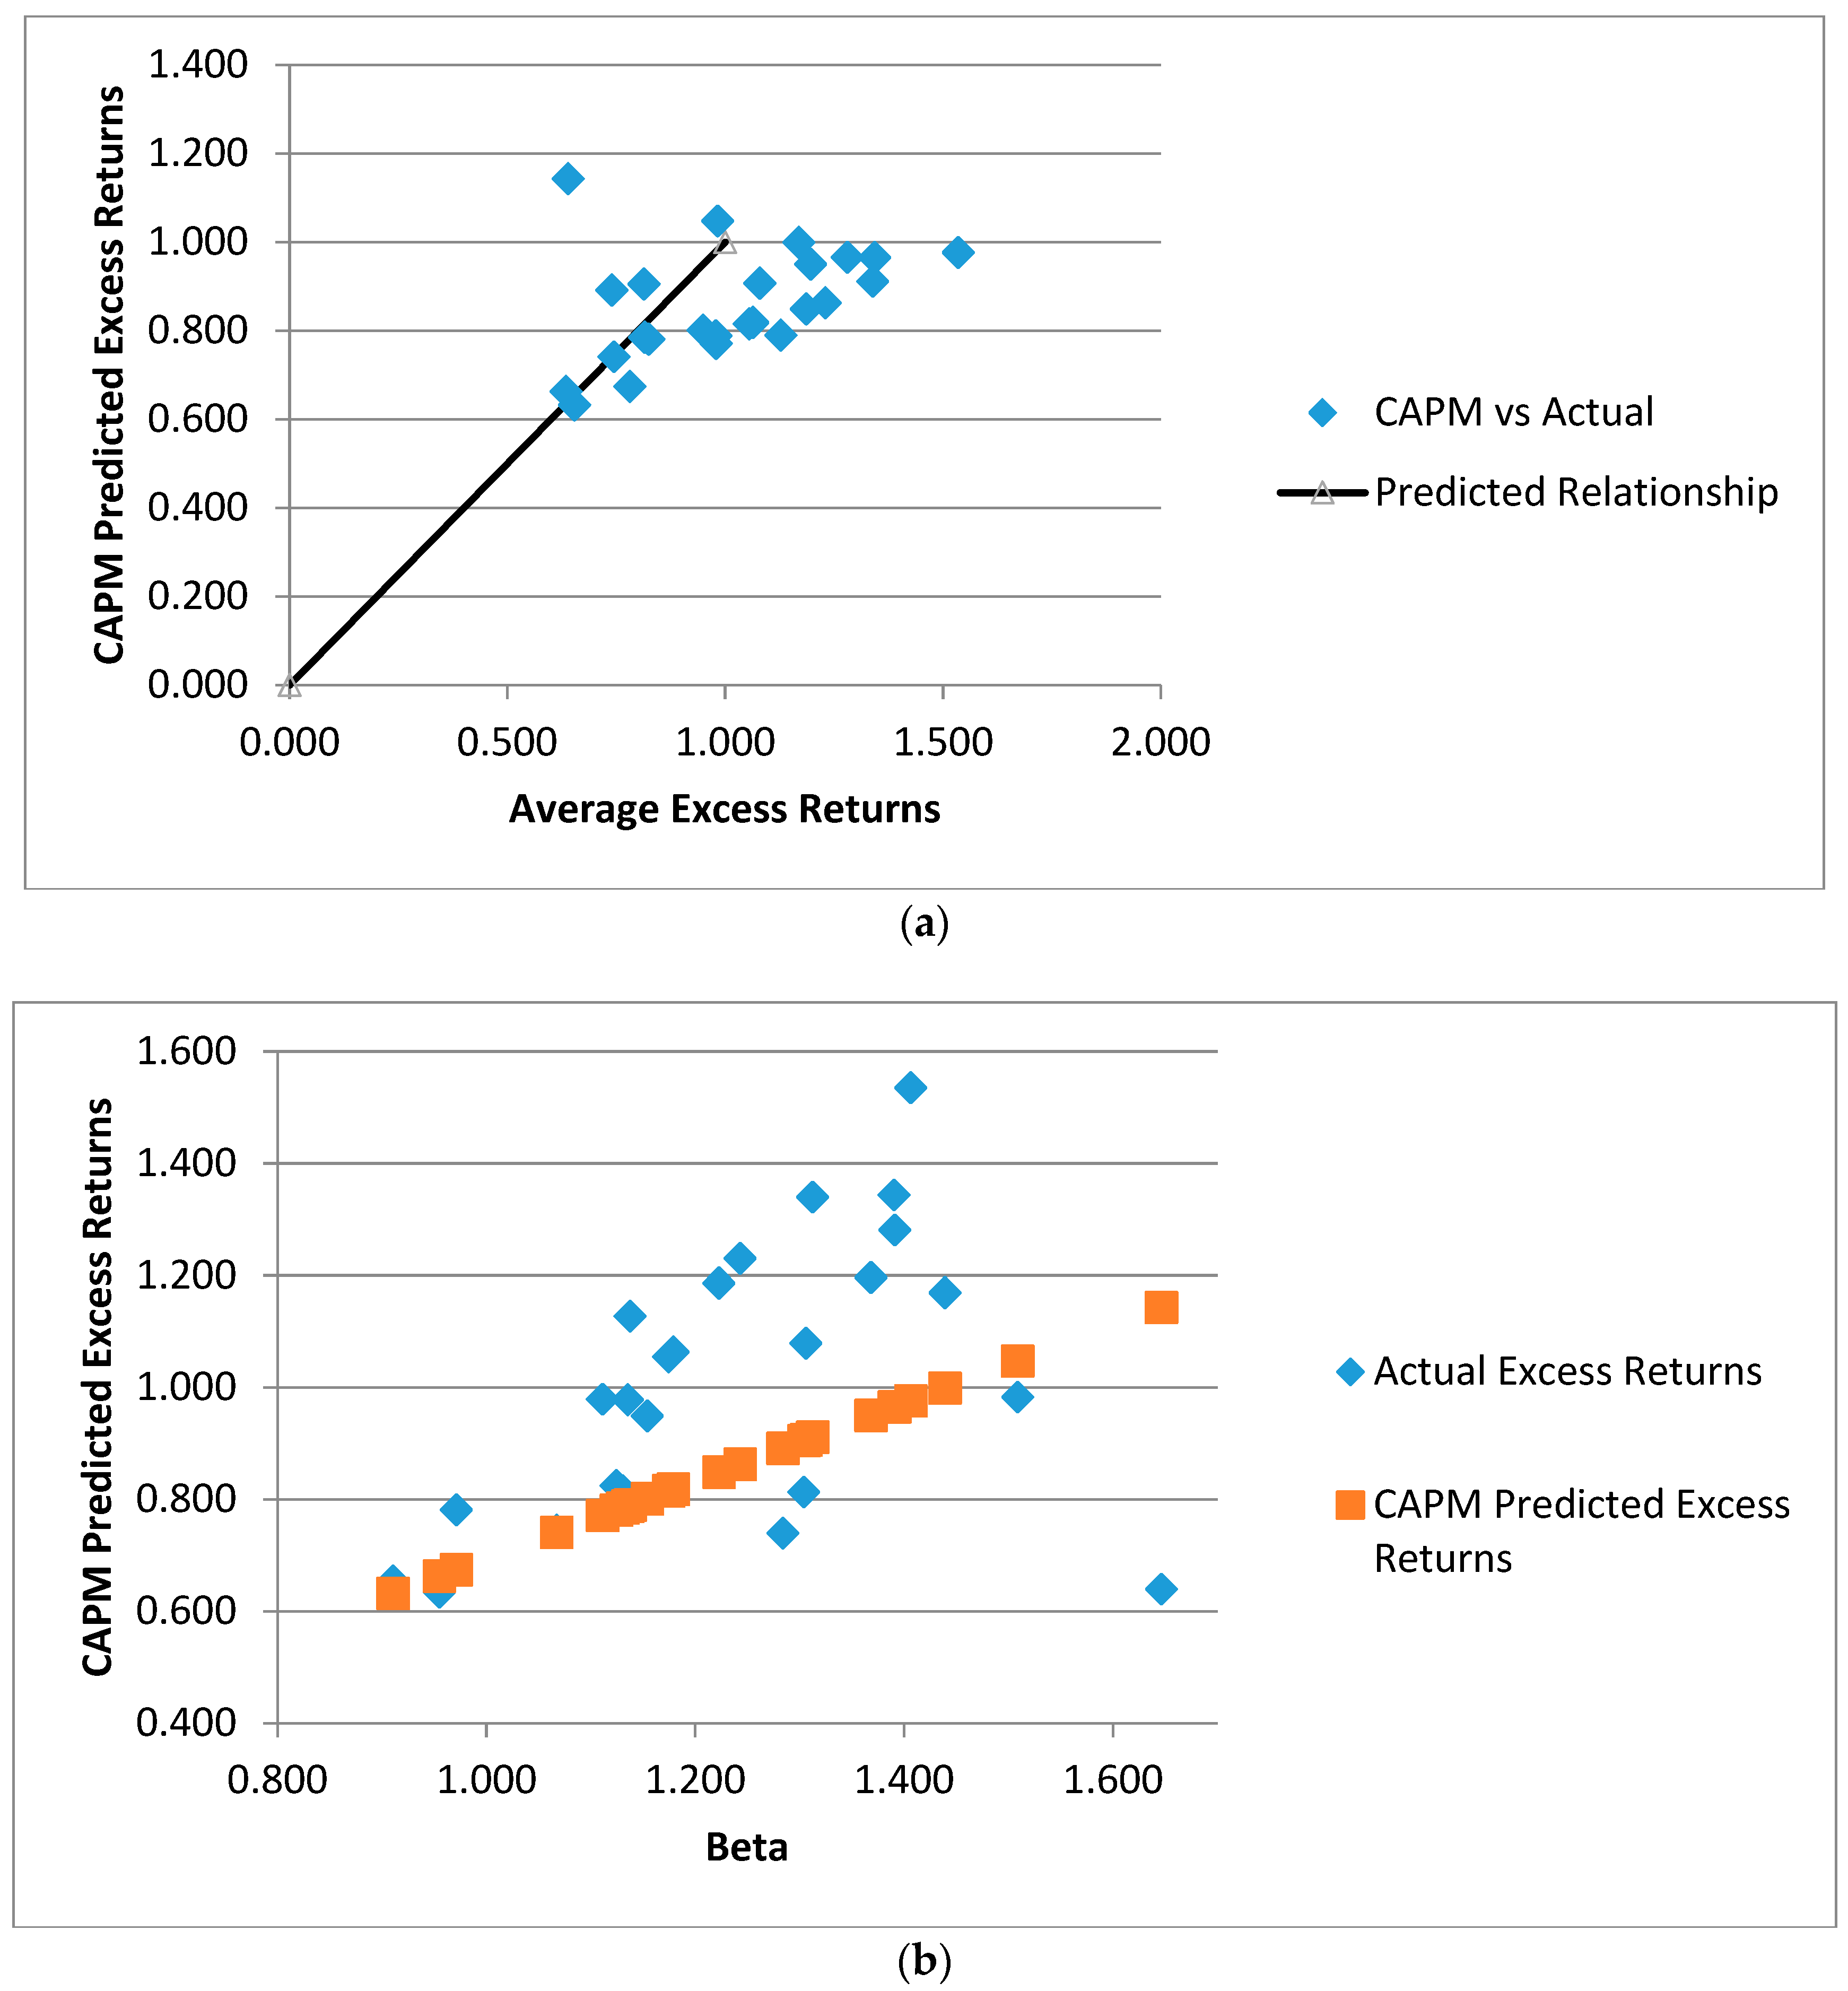
Figure 3a shows an average excess return of the FF 25 (Fama and French portfolios ranked on size and book-to-market) against the average excess return one would expect given beta. Empirically observed excess returns have no apparent relationship to the CAPM-predicted excess returns.
Figure 3b shows actual excess returns and CAPM expected excess returns against the estimated betas of the FF 25. Again, the CAPM did not explain the returns well. Furthermore, a closer review specifies that small-growth and small-value portfolios severely mismatch CAPM.
Fama and French (
1992) stated the different findings of prior studies and found that stocks with a high book-to-market ratio had higher expected returns than those measured by the market beta. The above results led to a prediction about the explanatory power of other factors for expected returns. Later, these findings led
Fama and French (
1993) to challenge the explanatory power of market beta.
They confirmed that size, debt-equity, book-to-market equity ratio and earning-price ratio have significant explanatory power to average stock returns, and also confirmed that market beta could not solely explain the average returns. Using these findings,
Fama and French (
1993,
1996) proposed a three-factor model. The Fama and French three-factor model captures portfolio performance sorted by size and book-to-market equity ratio, according to the following equation:
where
(small minus big) is the difference of returns between small and big stocks,
HML (high minus low) is a difference of returns between high Book-to-market value ratio and low book-to-market value ratio stocks, and
is the sensitivity of each particular factor of the stated variable. Fama and French argued that, if asset pricing is rational, then both factors are proxies for valuing risk. They also found an average monthly correlation between market betas and the two other stated variables. As a result, all correlation values were less than 0.15 and these values were based on the average monthly returns of individual stocks.
Fama and French (
1995) found that weak firms with persistent low earnings have a positive slope of
HML and high values of Book value of Equity/Market value of Equity, while strong firms with high earnings have a negative slope of
HML and low BE/ME ratio. Here, it is observed that “loser stocks” (low long term returns) tend towards positive slopes for both
SMB and
HML, and will gain higher average future returns; vice versa for “winner stocks” (high long term returns).
Fama and French interpreted the three-factor model as evidence of risk premium or distress premium, but did not give an explanation regarding the question “why are distress premiums priced?”
Mclean and Pontiff (
2016) and
Liu and Zhang (
2014) argued that the inclusion of distress premium in the three-factor model is either due to survivor bias or data-snooping. However, the model was also unable to explain the momentum effect, as in the situation (discussed in earlier arguments) regarding long-term winner stocks and long-term loser stocks. Hence, the Fama and French three-factor model only captures and predicts short-term return reversals and a continuation of this short-term phenomenon into longer horizons is missing and left unexplained. Anomalies are the reason for the foundation of new valuation models. As new anomalies are discovered, existing models are shown to be unable to capture these variations.
4. Reasons behind Cross-Sectional Excess Returns
List of selected papers for this section are given in
Table 5.
The literature has shown many observable firm-specific characteristics which can be used to predict cross-sectional returns (
Fama 1998;
Nagel 2005;
Mclean and Pontiff 2016). By using the Ohlson share price model for a sample of 51 listed companies on the London Stock Exchange, it was proven that investments in long-term assets influence the share price, in the case of companies that have recorded losses (
Jianu and Jianu 2018). If we go back to the findings of
Ball and Brown (
1968) and
Blume and Husic (
1973), even four decades after their conclusions, academics still disagree on the reasons behind these patterns.
Donangelo et al. (
2019) and
Favilukis et al. (
2019) argued that labour leverage may play an important role in shaping the cross-sectional variation of equity returns. Research findings show that these patterns could be explained by the three possible reasons. First, cross-sectional differences of risk are the reason behind predictability, as can be observed from the discount rate (
Fama and French 1991;
Fama 1998). Cross-sectional predictability is expected, because return variances are used to value stocks and they are a reflection of changes in the prevailing discount rates. The second explanation belongs to the behavioural aspect of finance, that mispricing is the core reason for return predictabilities (
Barberis and Thaler 2003). Therefore, marginal investors may lead towards biased expectations regarding cash flows, which might cause the creation of correlation between anomaly variables and these mistakes, which are, in turn, related to a cross-section of stocks. Updated information also changes the belief of investors; it corrects the stock prices and creates predictability of returns. The last explanation for return prediction is data mining.
Fama (
1998) argued that academics have tested thousands of variables and it is not important if some of them predict returns in their samples, even if none of the research does in reality.
These three explanations have different predictions, in each case, such as how news arrival will affect the predictability of a cross-sectional return. Therefore, the risk-based model cannot predict the cross-sectional return difference on a particular day; however, at the same time, the behavioural model will predict a high excess return at the time of a particular event and correct this erroneous expectation, as it is based on biased expectations.
4.1. Risk Differences Approach
It has been made evident that stock returns are unconditionally higher on the earning announcement date (
Frazzini and Lamont 2006).
Engelberg et al. (
2016) found that long anomaly (short anomaly) returns were higher (lower) on earning announcement days, by controlling for the fact that returns are higher on a particular earning announcement news date. Anomalies do not perform well on macro-economic news announcement days, but it is not easy to align this with the fact that an anomaly return represents compensation for consumption risk, as it is expected to be higher on these possible announcement days (
Savor and Wilsony 2013).
Savor and Wilson (
2016) found a model that could value and identify the reasons for higher returns on earning announcement days. According to their model, the premium on an earning announcement day occurs because rational investment agents infer market information of earnings from each earning announcement; therefore, the value of beta is higher for the announcing company. In contrast, they did not include the implications of unexpected higher returns on unexpected news days for the Dow Jones. They were also unable to explain the relationship between anomaly variables and analyst forecast error.
A higher risk premium was implied for investment-based models on the day of announcement of earnings in studies by
Wu et al. (
2010) and
Liu and Zhang (
2014), where an argument against the investment model where “returns of the simplest investment model are equivalent to the return on assets (ROA)” was posed, as these returns become known to investors at announcement of earnings. These models are not capable of capturing such variations and making predictions related to non-earning announcements or earning forecast errors by analysts. Hence, these investment-oriented models are still risk-based and unable to perform well for anomaly variables, during macro-economic news announcements or when market returns are high.
4.2. Behavioural Bias and Mispricing
Excess returns may be attributed to the behavioural bias of investors, as well. Many models have been developed to capture these biased behavioural anomalies, and some prominent models are based on these biased expectations (
Barberis et al. 1998), (
Daniel et al. 1988,
2001). These models capture variations that price to structural anomalies, where long-term reversals are due to biased expectations of investors towards expected future cash flows. These prices are adjusted and rectified on the public announcement of updated news. To explain this intuition,
Engelberg et al. (
2016) incorporated a simple agent-based model, in which they captured the biased expectations of the agent towards expected future cash flows and these expectations were rectified on arrival of cash flow news publicly. They found that firms whose agents had overly optimistic (pessimistic) expectations for expected cash flows had negative (positive) returns on the announcement of news. Their findings regarding the earning announcement day and return on news day were consistent with intuition in the literature.
Engelberg et al. (
2016) examined earnings forecasts of sell-side analysts and assessed the impact of biased expectations. They found that, if the analysts had biased expectations towards anomaly stocks, their projections would be more optimistic towards the short side of anomaly stocks or anomaly portfolios, and more pessimistic towards stocks on the long side of anomaly portfolios.
4.3. Data Mining
Although the above results for the earnings announcement and news days are inconsistent with risk-based explanations, it could be consistent with data mining explanations (
Engelberg et al. 2016).
Harvey et al. (
2016) argued that factors identified from theory should have fewer hurdles than factors discovered from empirical evidence. Economic theories are always based on some underlying economic principles; thus, there is little space for data mining.
Hundreds of anomalies have been discovered and documented in recent decades; data mining is one of the concerns that have become acute.
Harvey et al. (
2016) introduced a multiple testing mechanism to derive different thresholds of significance levels capturing the data mining of anomaly literature. The cut-off for this threshold continually increased as more anomalies were affected by data mining; a more recent factor is that the value of the t-statistic should be higher than three. Hence, the anomaly literature has been found to be affected by widespread p-hacking, which creates a more considerable space to test and verify the anomaly literature.
5. Replication: A Futuristic Approach
List of selected papers for this section are given in
Table 6.
Several studies have been found in the literature, some of which are in favour of EMH, and most of which are in support of predicted returns. Both types contradict each other and economists are yet to be unified on a single view. Therefore, some arguments and studies have brought forward a new dimension to solve this mystery, initiating further debate in the financial economics literature. For example,
Harvey et al. (
2016) mentioned that the reliability of factor identification from a theory is more authentic than the discovery of factors by empirical testing. Therefore, this argument creates a basis for replication of all historically discovered anomalies, in order to test the reliability of these anomaly variables.
Academics from finance and economics have consistently warned against the dangers of data mining. The basis of future research is dependent upon the success and failure of past investigations (
Lo and MacKinlay 1990). Therefore, the issue of data snooping does not affect some of the studies, which becomes more severe as these all studies have been performed in a single large data set. Furthermore, when this extensive data was scrutinised, more spurious outcomes emerged. As
Fama (
1998) mentioned, most of the anomalies disappeared when tested with value-weighted portfolios; earlier, it was tested through equal weighted portfolios.
Conrad et al. (
2003) argued that data snooping can be observed in more than one half of the in-sample relationships between average return and firm characteristics.
Schwert (
2003) found that, as anomalies became a part of literature, they seemed to weaken, reverse, or disappear with time.
Mclean and Pontiff (
2016) accounted for 97 different anomalies to test, out of the sample, and found that the average high-minus-low returns reduced when these anomalies were tested for after publications.
Harvey et al. (
2016) documented two primary reasons related to publications that may provide a reason for the high frequency of false discoveries. First, it is tough to publish an article in a top journal with negative results. Second, it is challenging to publish a replicated study in economics and finance journals, primarily when you deal with a subtle type of research. However, in many fields of natural sciences, replicated studies are published frequently in many top journals. As a result, academics from the finance and economics fields tend to focus more on discovering new factors, instead of rigorously proving and verifying existing published factors.
Harvey (
2017) found that publication biases are due to complex agency problems. Editors are more concerned with gaining citation-based impact factor and, for more citations, they prefer to publish research articles with more significant results. In this scenario, authors (most of the time) do not let research papers with weak or negative findings go for submission. More disconcertingly, authors (sometimes) go for p-hacking, to make their results more favourable for publication. Due to this situation, the authors will get a surprisingly significant and embarrassingly large magnitude of false results, which cannot be replicated. For this situation, Harvey provides a remedy, in the form of the Bayesian p-value, which incorporates economic plausibility of the underlying hypothesis as a part of the inference.
Yan and Zheng (
2017) formulated more than 18,000 fundamental signals, capturing the effect of data mining by using the bootstrap approach. They incorporated almost all published variables and factors that were tried, but not reported, in the published literature. This approach was only suited to variables which are based on past return data, such as accounting variables.
The literature of anomalies provides a basis for scientific research of the asset management industry. Exchange traded funds, which are factor-based, grew tremendously from the mid-1990s to 2016. These funds had a value of more than 1.35 trillion dollars in the U.S. stock market and accounted for around 10% of total stocks traded in U.S. markets (
Ben-David et al. 2017). With the growing importance of factor investigation, the financial press media questioned the reliability of the underlying investigated factor.
Coy (
2017) wrote: “Most investors have a vague sense they’re being ripped off. Here’s how it happens.” Researchers have more interest in creating a twist-for-prize anomaly. The subtle variation in data seems like it is the right forum for money-making. Adverse outcomes of research are put aside and positive results are submitted to a journal.
At present, finance is the only field that pursues replication of existing empirical studies seriously. The famous study of
Dewald et al. (
1986) replicated studies published in the ‘Journal of Money, Credit and Banking’, and observed inevitable errors. However, their research suggested that the existing results could not be reproduced. Dewald et al. wrote: “The replication of research is an essential component of scientific methodology. Only through replication of the results of others can scientists unify the disparate findings of various researchers’ indiscipline into a fit, consistent, coherent body of knowledge” (p. 600). Different software gives different results for the same data set and
Mccullough and Vinod (
2003) found the same pattern while testing non-linear maximization routines. They also observed that many published studies in the ‘American Economic Review’ failed to give the same results when tested with different software. (
Brodeur et al. 2016) tested more than 5000 statistical tests of published papers in the ‘Quarterly Journal of Economics’, the ‘American Economic Review’ and the ‘Journal of Political Economy’ and found a series of a troubling patterns in test statistics. The features were related to sizeable under-representation of the p-value, high
p-values, and other humps related to slightly below p-value from 5 percent. These findings made evident that academics have been p-hacking to make their results significant, in order to make them more powerful for publication and ignore that results with insignificant values do not help them in publications. Papers affected by these two situations of p-hacking can rarely be found in theoretical model-based articles, articles with old tenured authors and articles with randomised control trials.
Ioannidis (
2005) argued that there were large possibilities for false results when studies used small datasets. ‘The Economist’ reported several cases belonging to different fields of study, including Biosciences, Psychology and many other areas, where the success rate for replication of results is meagre.
Baker (
2016) published an article in ‘Nature’, where he surveyed 1576 scientists and reported that more than 80% scientists believe that the reproducibility issue for results in the published scientific literature is a dilemma for research outcomes. Reduced usage of statistical tools, publication pressure and selective reporting are three critical issues for this crisis.
Therefore, researchers believe that they should focus more on the reliability of factors obtained from empirical testing, criticizing factors based on strong theory. A new dimension of finance belongs to the replication of all those published studies, which contradict the well-established theories.
6. Conclusions and Limitations
With the existence of stock markets, investors will make mistakes by their collective judgement. It can be assured that some market participants are not rational. Consequently, excess returns in stock markets and irregularities in the pricing of stocks can be found over time, which also persist for shorter periods of time. Undoubtedly, markets can never be completely efficient, because there is no benefit or incentive for professionals to float information in the market, such that it is quickly reflected into stock prices.
The efficient market hypothesis is divided into two parts: First, inefficient markets: stock returns remain random. Second, investors cannot attain excess returns with the existence of an efficient market. The EMH was considered to be an absolute truth and found much attention during the 1980s. Many studies have concluded that markets are inefficient, and the reality of EMH now exists on relative terms. The EMH is unable to capture excess variation in stock prices, asset bubbles, seasonality effects, and the overreactions of investors, and so on. Conversely, returns from stocks were found to be random, and market participants are unable to gain consistent excess returns. Evidence of cross-sectional predictable patterns challenged the existing well-established asset pricing paradigm. Indeed, researchers should focus more on such a type of model, by additionally considering the importance of behavioural aspects.
In modern times, published literature on anomalous returns has gained much attention from academics and researchers. Therefore, in light of the anomaly literature, markets are no more efficient and investors can predict and gain excess returns by using the available room of these anomalies. Based on replication of the existing anomaly literature, a new dimension emerged, where many past studies were found to be falsified and a new discussion started on the current state of markets and reality of these anomalies.
Moreover, researchers must admit that the existing evidence regarding anomalies is not a constitutional proof and the established paradigms are wrong. The issue of data snooping, found in many types of research, gives an alarming indication regarding the reliability of these studies. Data snooping affects all aspects of return procedures, averages and variations with other anomalies and factors. Future research can gain advantage from new historical samples to obtain more insight into asset prices.
The limitations of the study are as follows: much work in the literature has been analytical, case studies and simulation-based. We identified several factors from the existing literature; however, more empirical studies will be needed for validation. The findings of this article are based on a review of more than 90 papers; however, it is still possible that some important papers might not have been included. As this paper was a qualitative analysis of studies within focused themes, personal biases might have occurred.


