The Costs and Benefits of Bank Capital—A Review of the Literature †

 ,
, 
Abstract
:1. Introduction
2. Basel Committee Long-Term Economic Impact Analysis and Subsequent Studies
2.1. Stability Benefits of Bank Capital
2.2. Cost of a Banking Crisis
2.3. Capital Requirements and Bank Funding Costs
2.4. Impact of Higher Loan Spreads on GDP
3. Results from the Research Task Force Survey and Academic Literature
4. Preliminary Conclusions and Suggestions
4.1. Assessing the Combined Evidence
4.2. Possible Improvements
Author Contributions
Funding
Acknowledgments
Conflicts of Interest
Appendix A. Long-Term Economic Impact Assessment Calibration
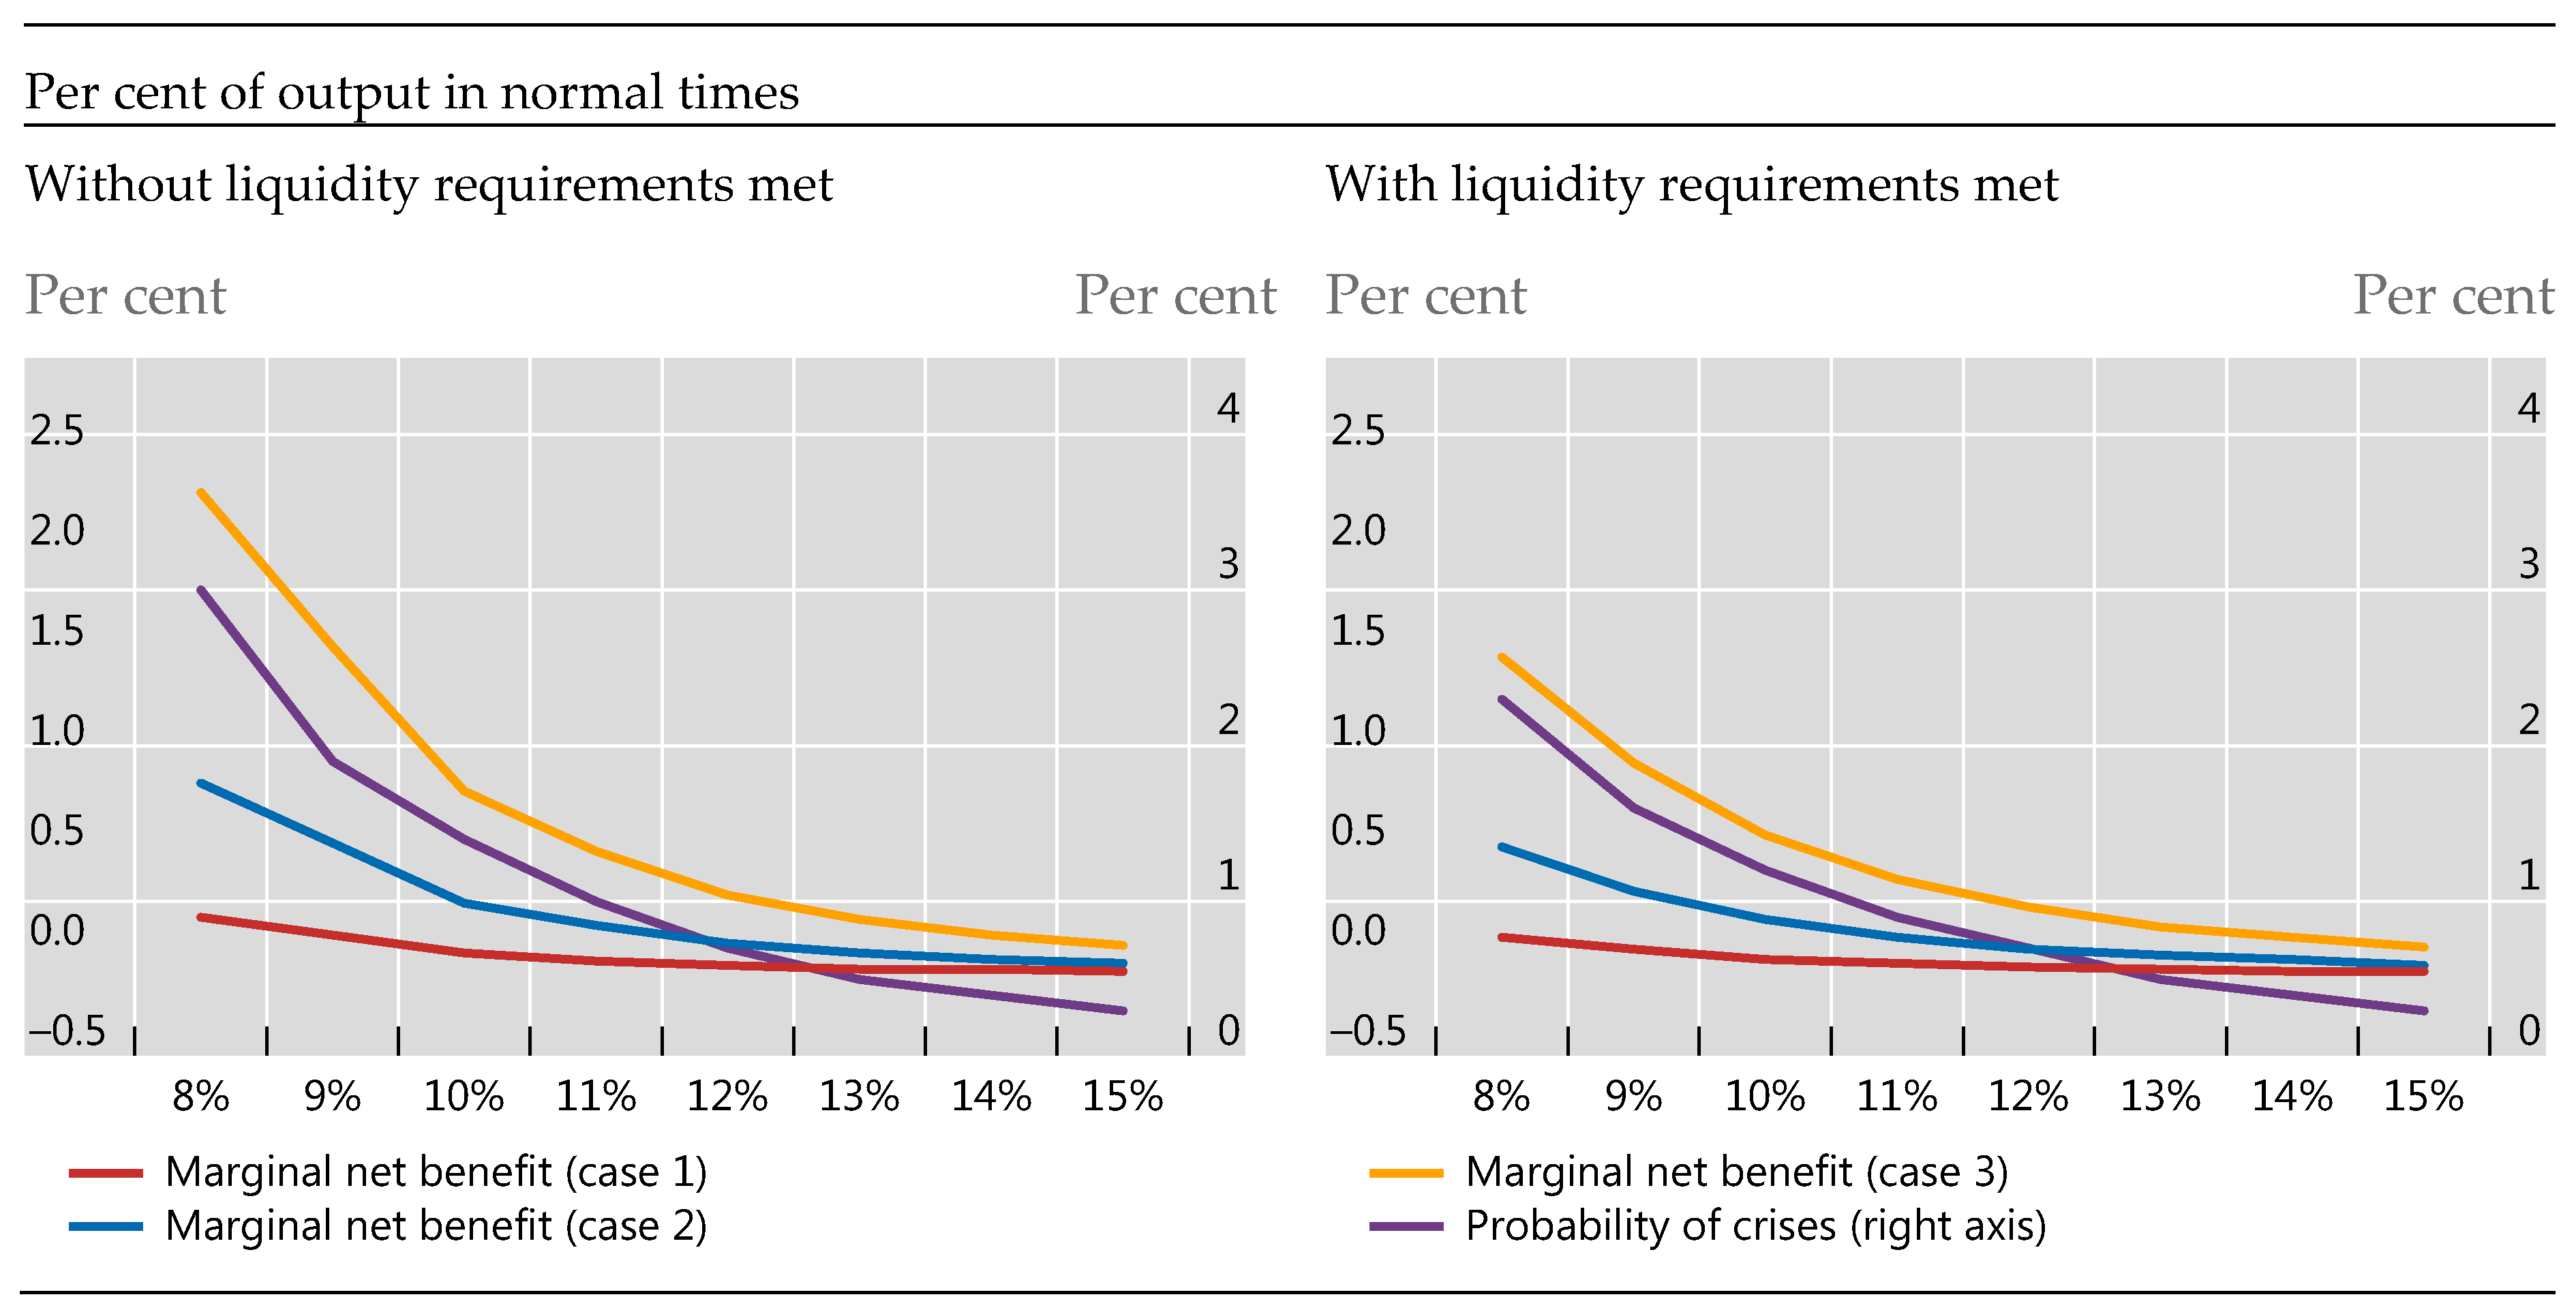
- The probability of a crisis is 4.6% for a capital ratio of 7% and declines at a diminishing rate to 0.3% for a capital ratio of 15%. Confer BCBS (2010, Table 4): the reduction in the crisis probability from increasing capital hence creates benefits;
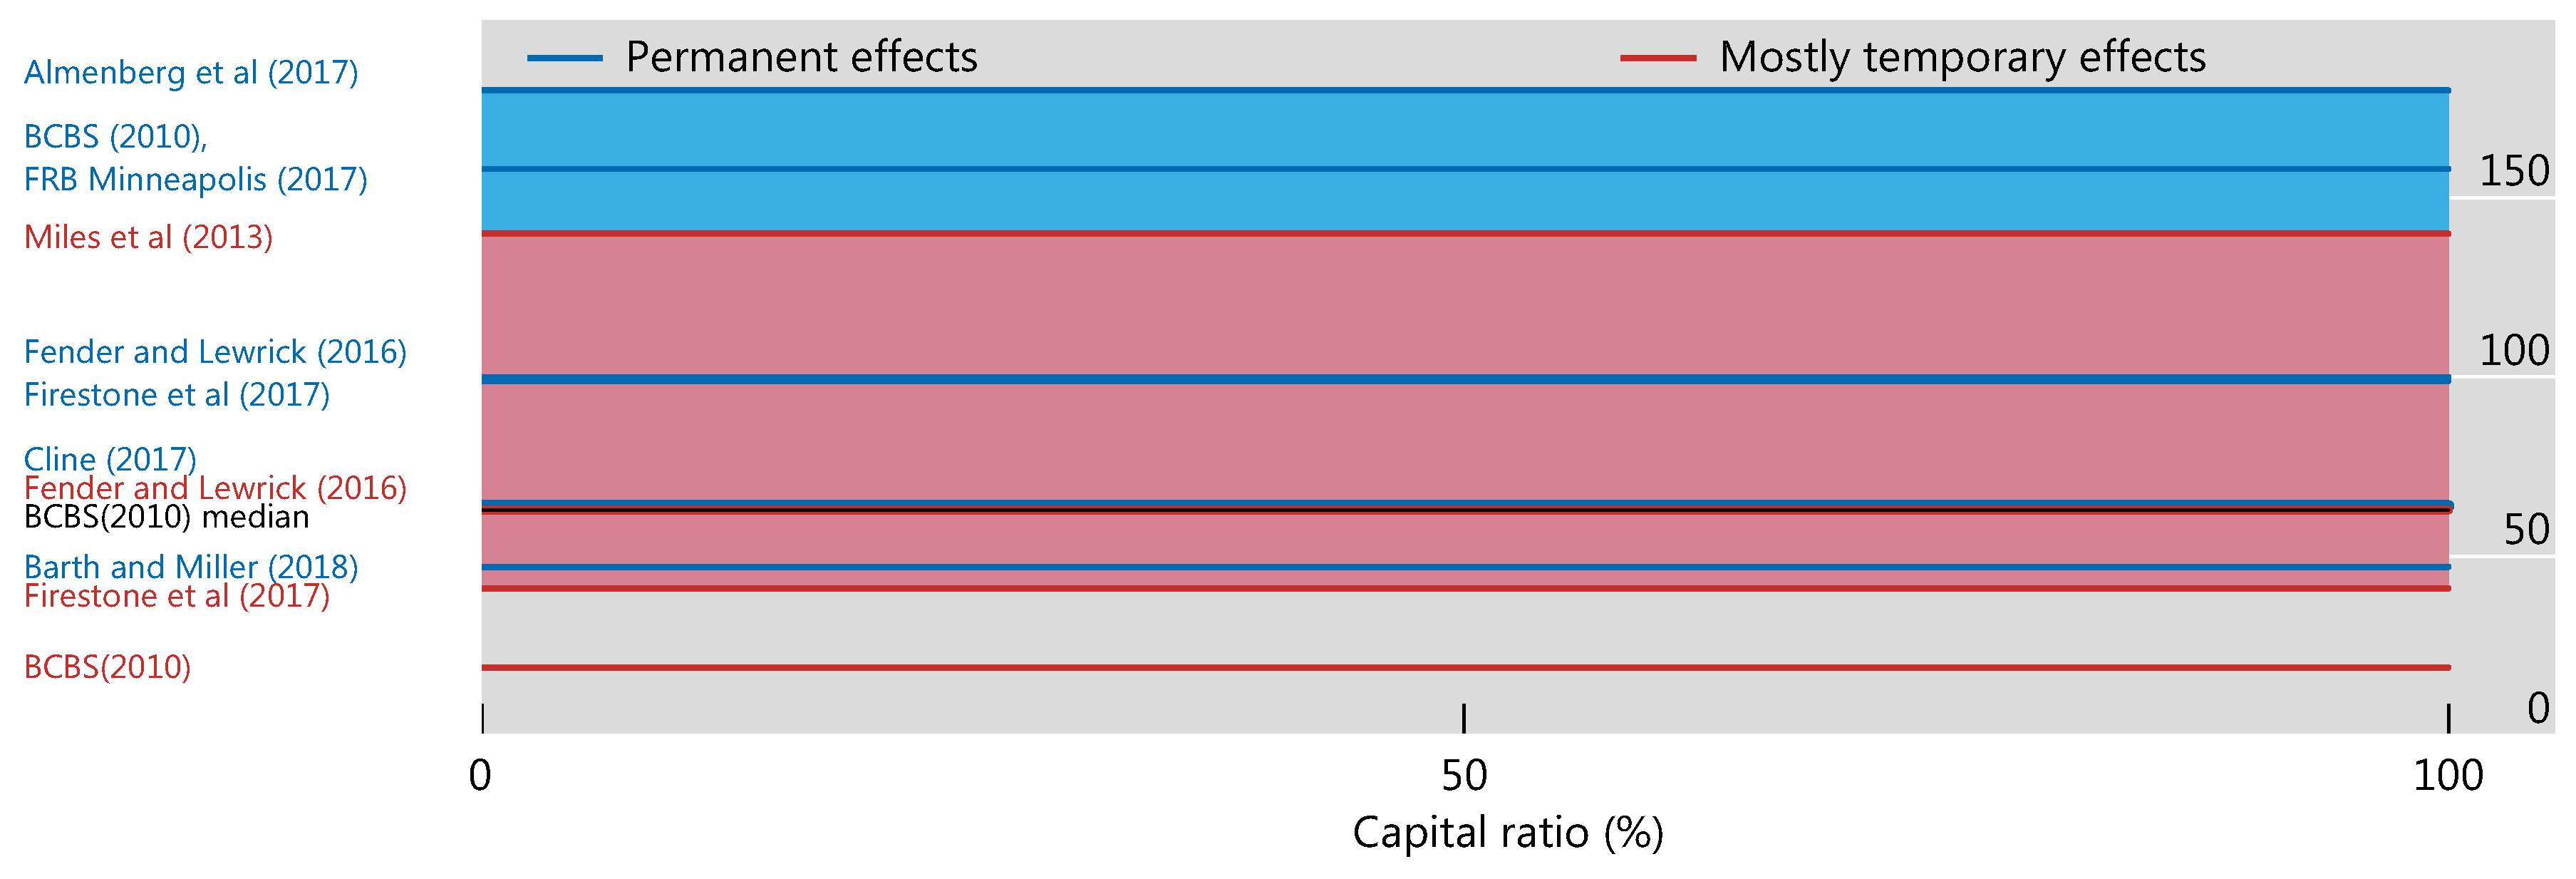
- The reduction in output in crisis periods relative to normal times is set to three different levels, depending on different assumptions of how a crisis affects trend growth. For the cases of no permanent effects, moderate permanent effects and large permanent effects, the output loss is set to 19%, 63%, and 158% of output in normal times (“normal output”), respectively;
- The opportunity cost of higher capital resources is estimated to be 0.09% of normal output;
- The benefit of reducing the amplitude of the business cycle was judged to be too uncertain to be included.

Appendix B. Benefits and Costs of Capital, Revisited30
Appendix B.1. Benefits of Bank Capital
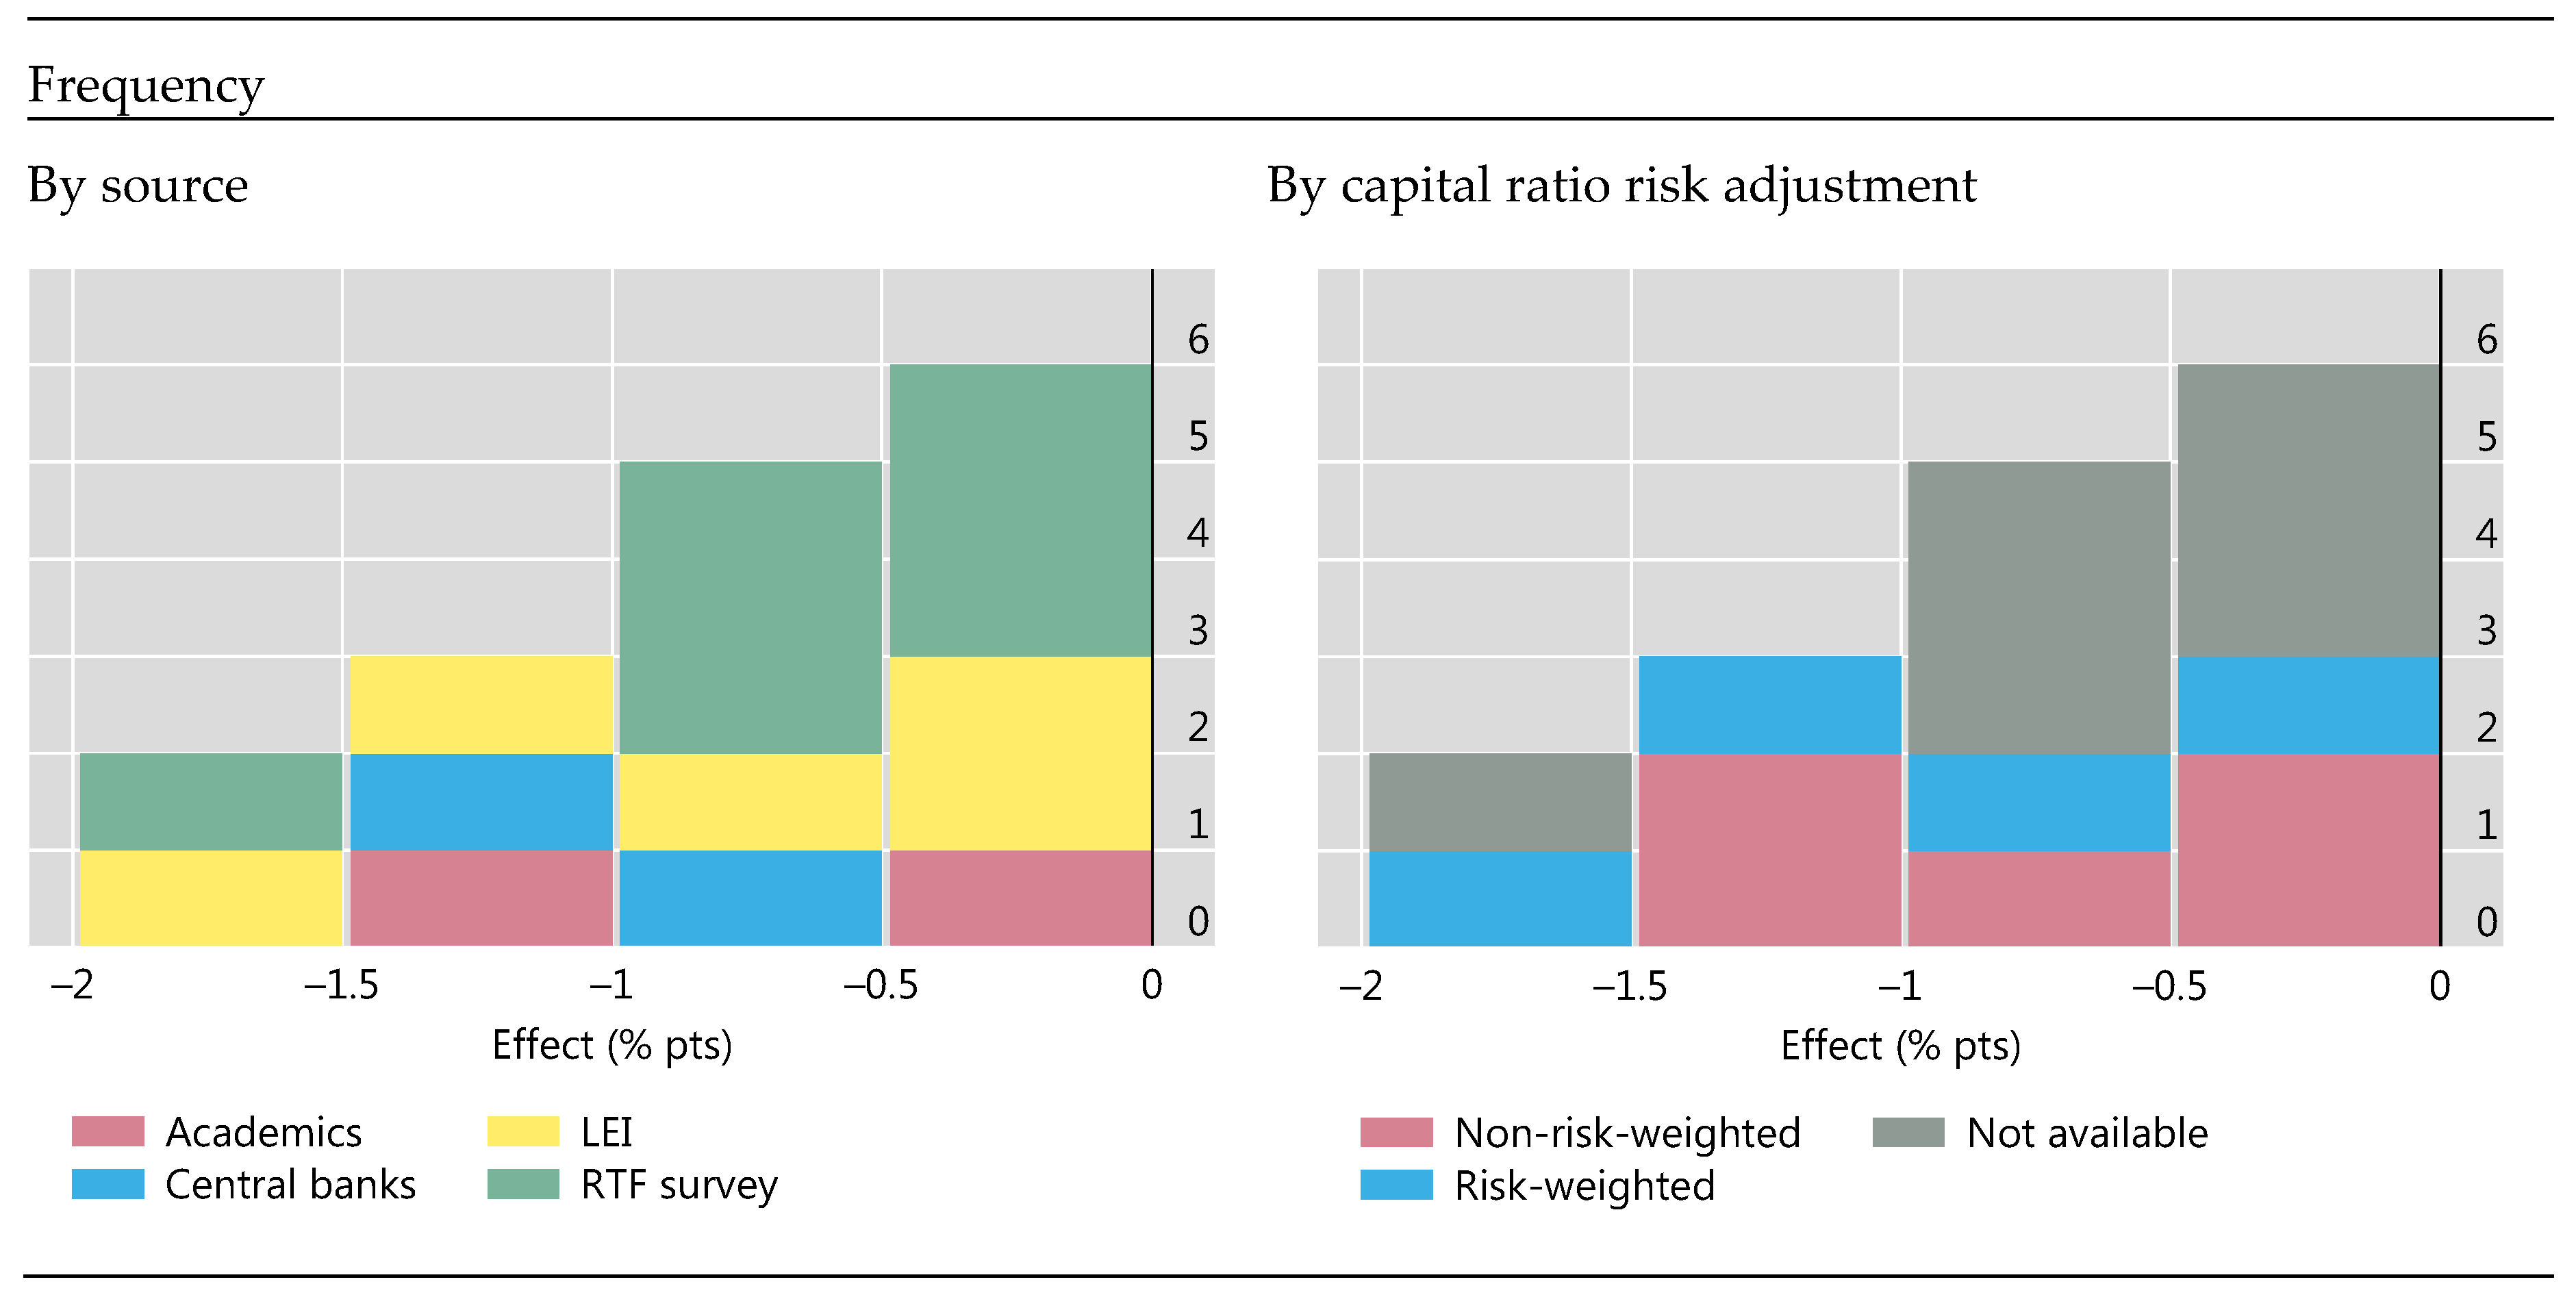
Appendix B.1.1. Lower Probability of a Crisis?

| Explanatory Variables | (1) | (2) | (3) | (4) |
|---|---|---|---|---|
| Leverage ratio | 0.254 (0.577) | 0.218 (0.623) | 0.778 (0.638) | 0.889 (0.448) |
| Loan growth | 1.163 ** (0.035) | 1.245 *** (0.009) | 1.527 ** (0.033) | 1.329 *** (0.006) |
| Δ Leverage ratio | 5.356 (0.262) | 13.586 * (0.099) | 14.557 ** (0.032) | |
| Observations | 421 | 419 | 242 | 257 |
| Controls | No | No | Yes | Yes |
| Country FE | Yes | Yes | Yes | No |
| Year FE | Yes | Yes | Yes | Yes |
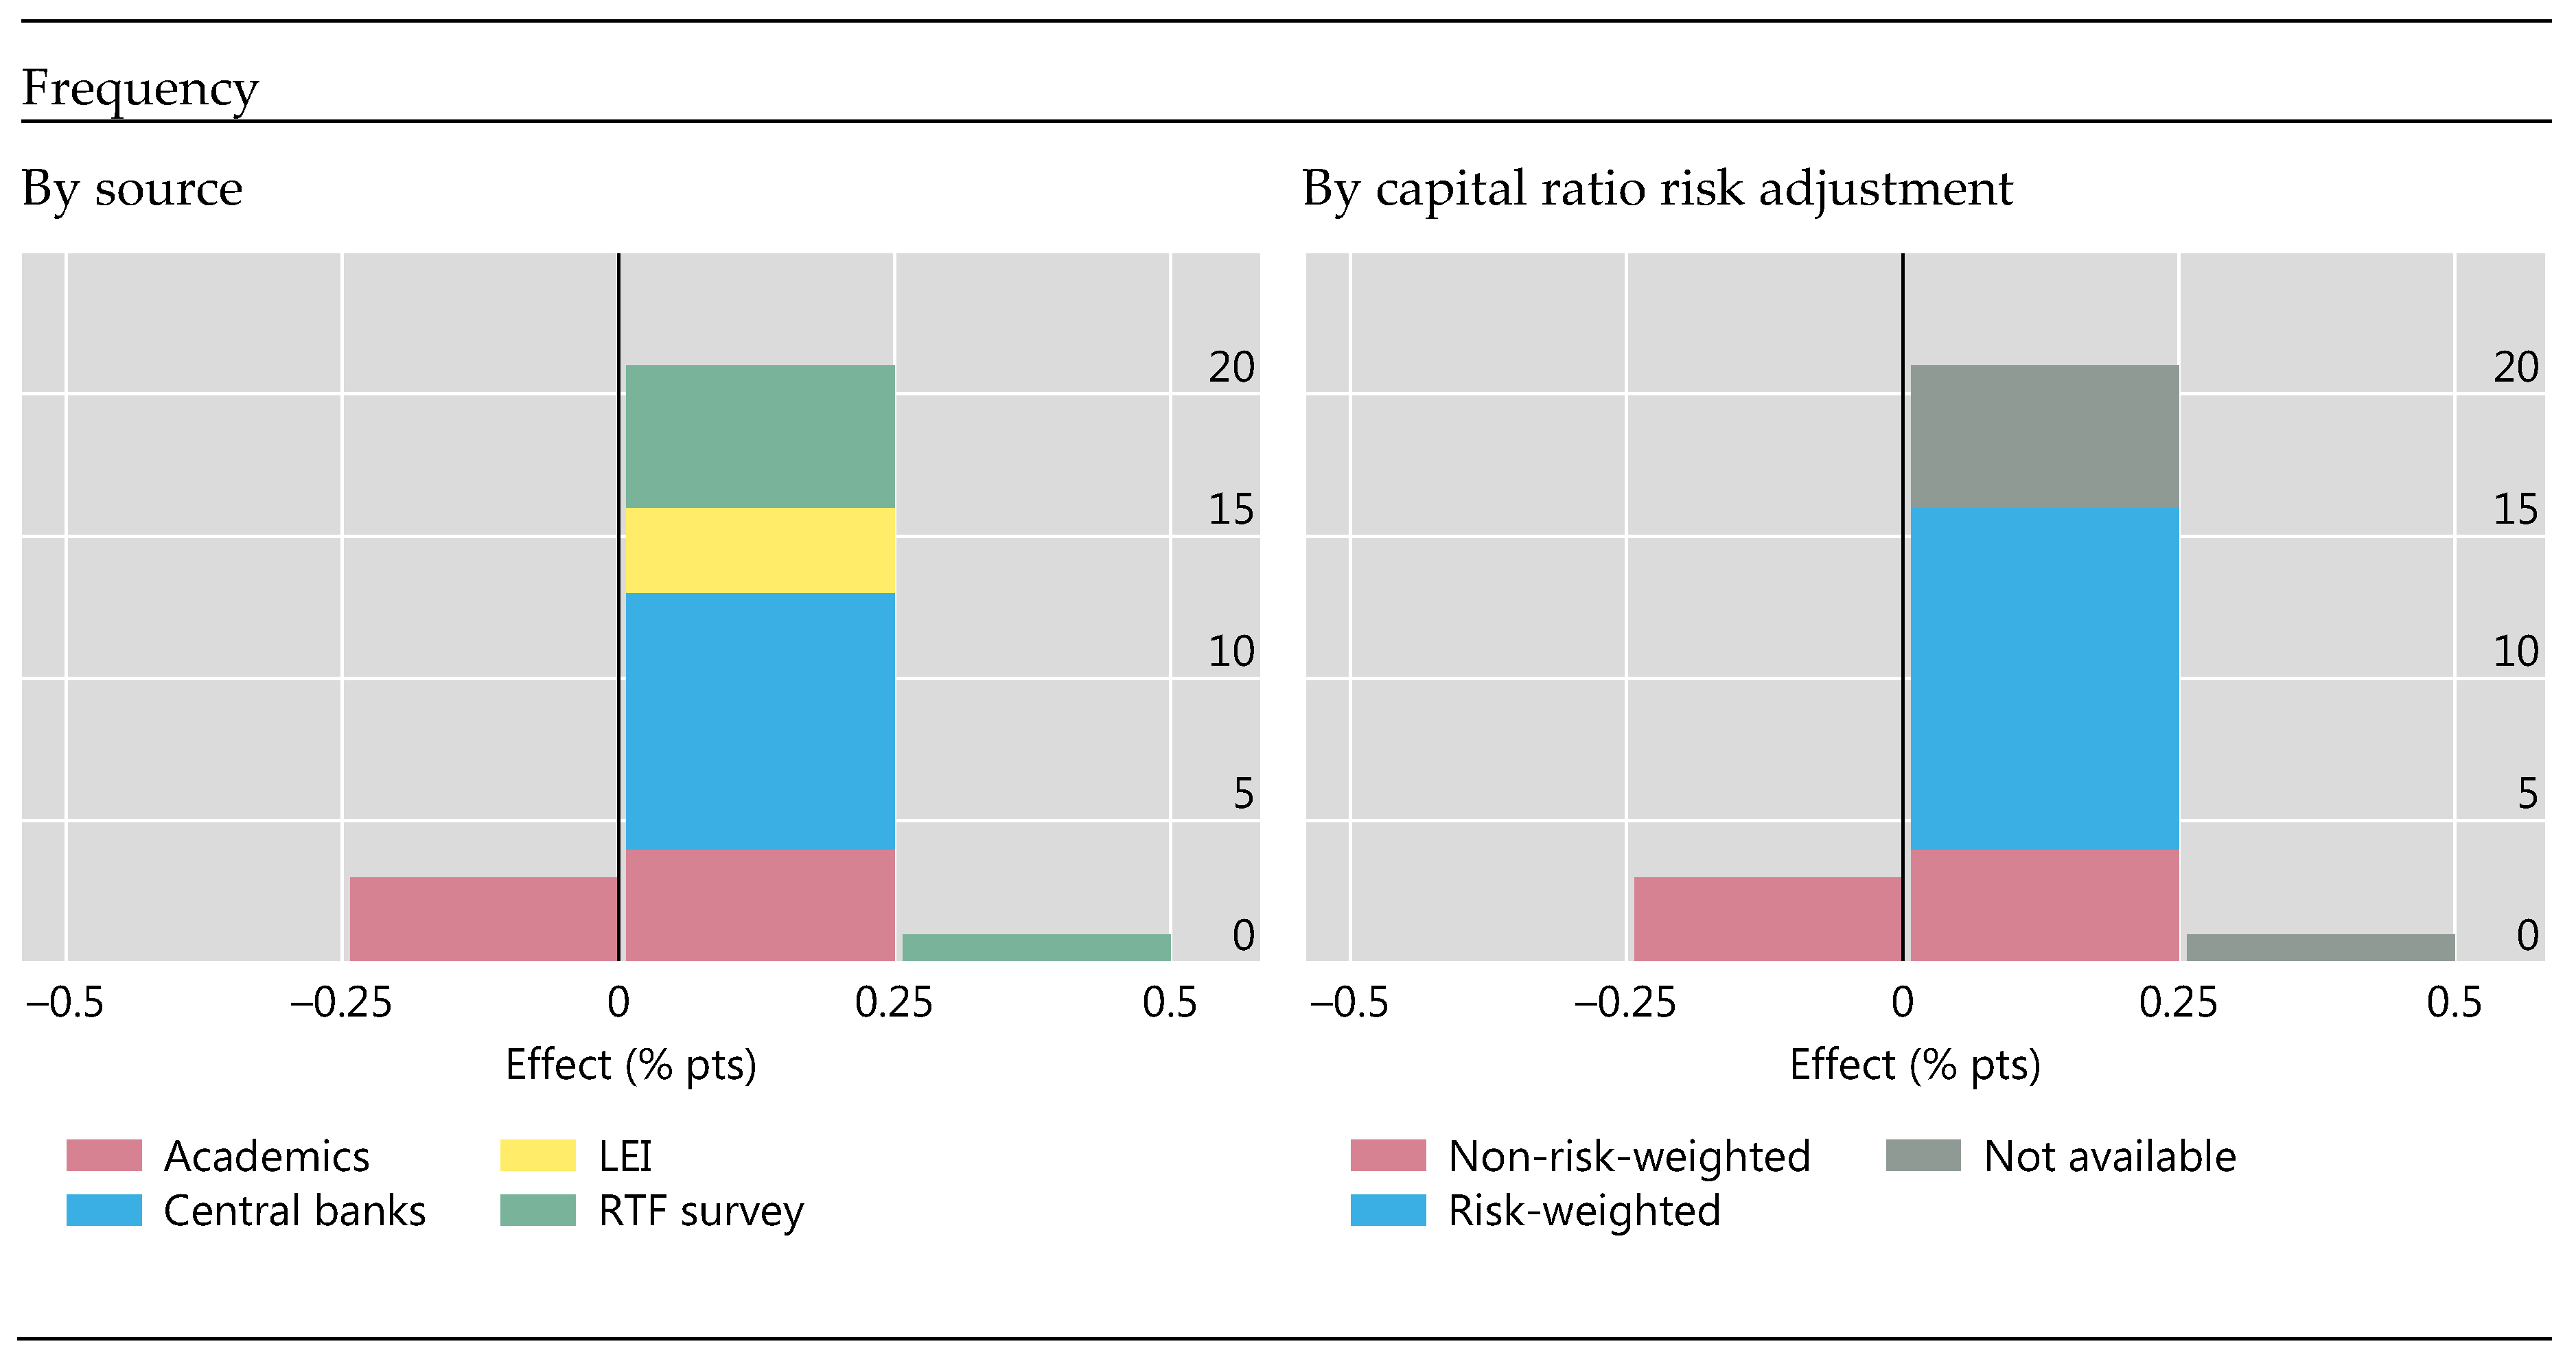
Appendix B.1.2. Lower Crisis Cost?

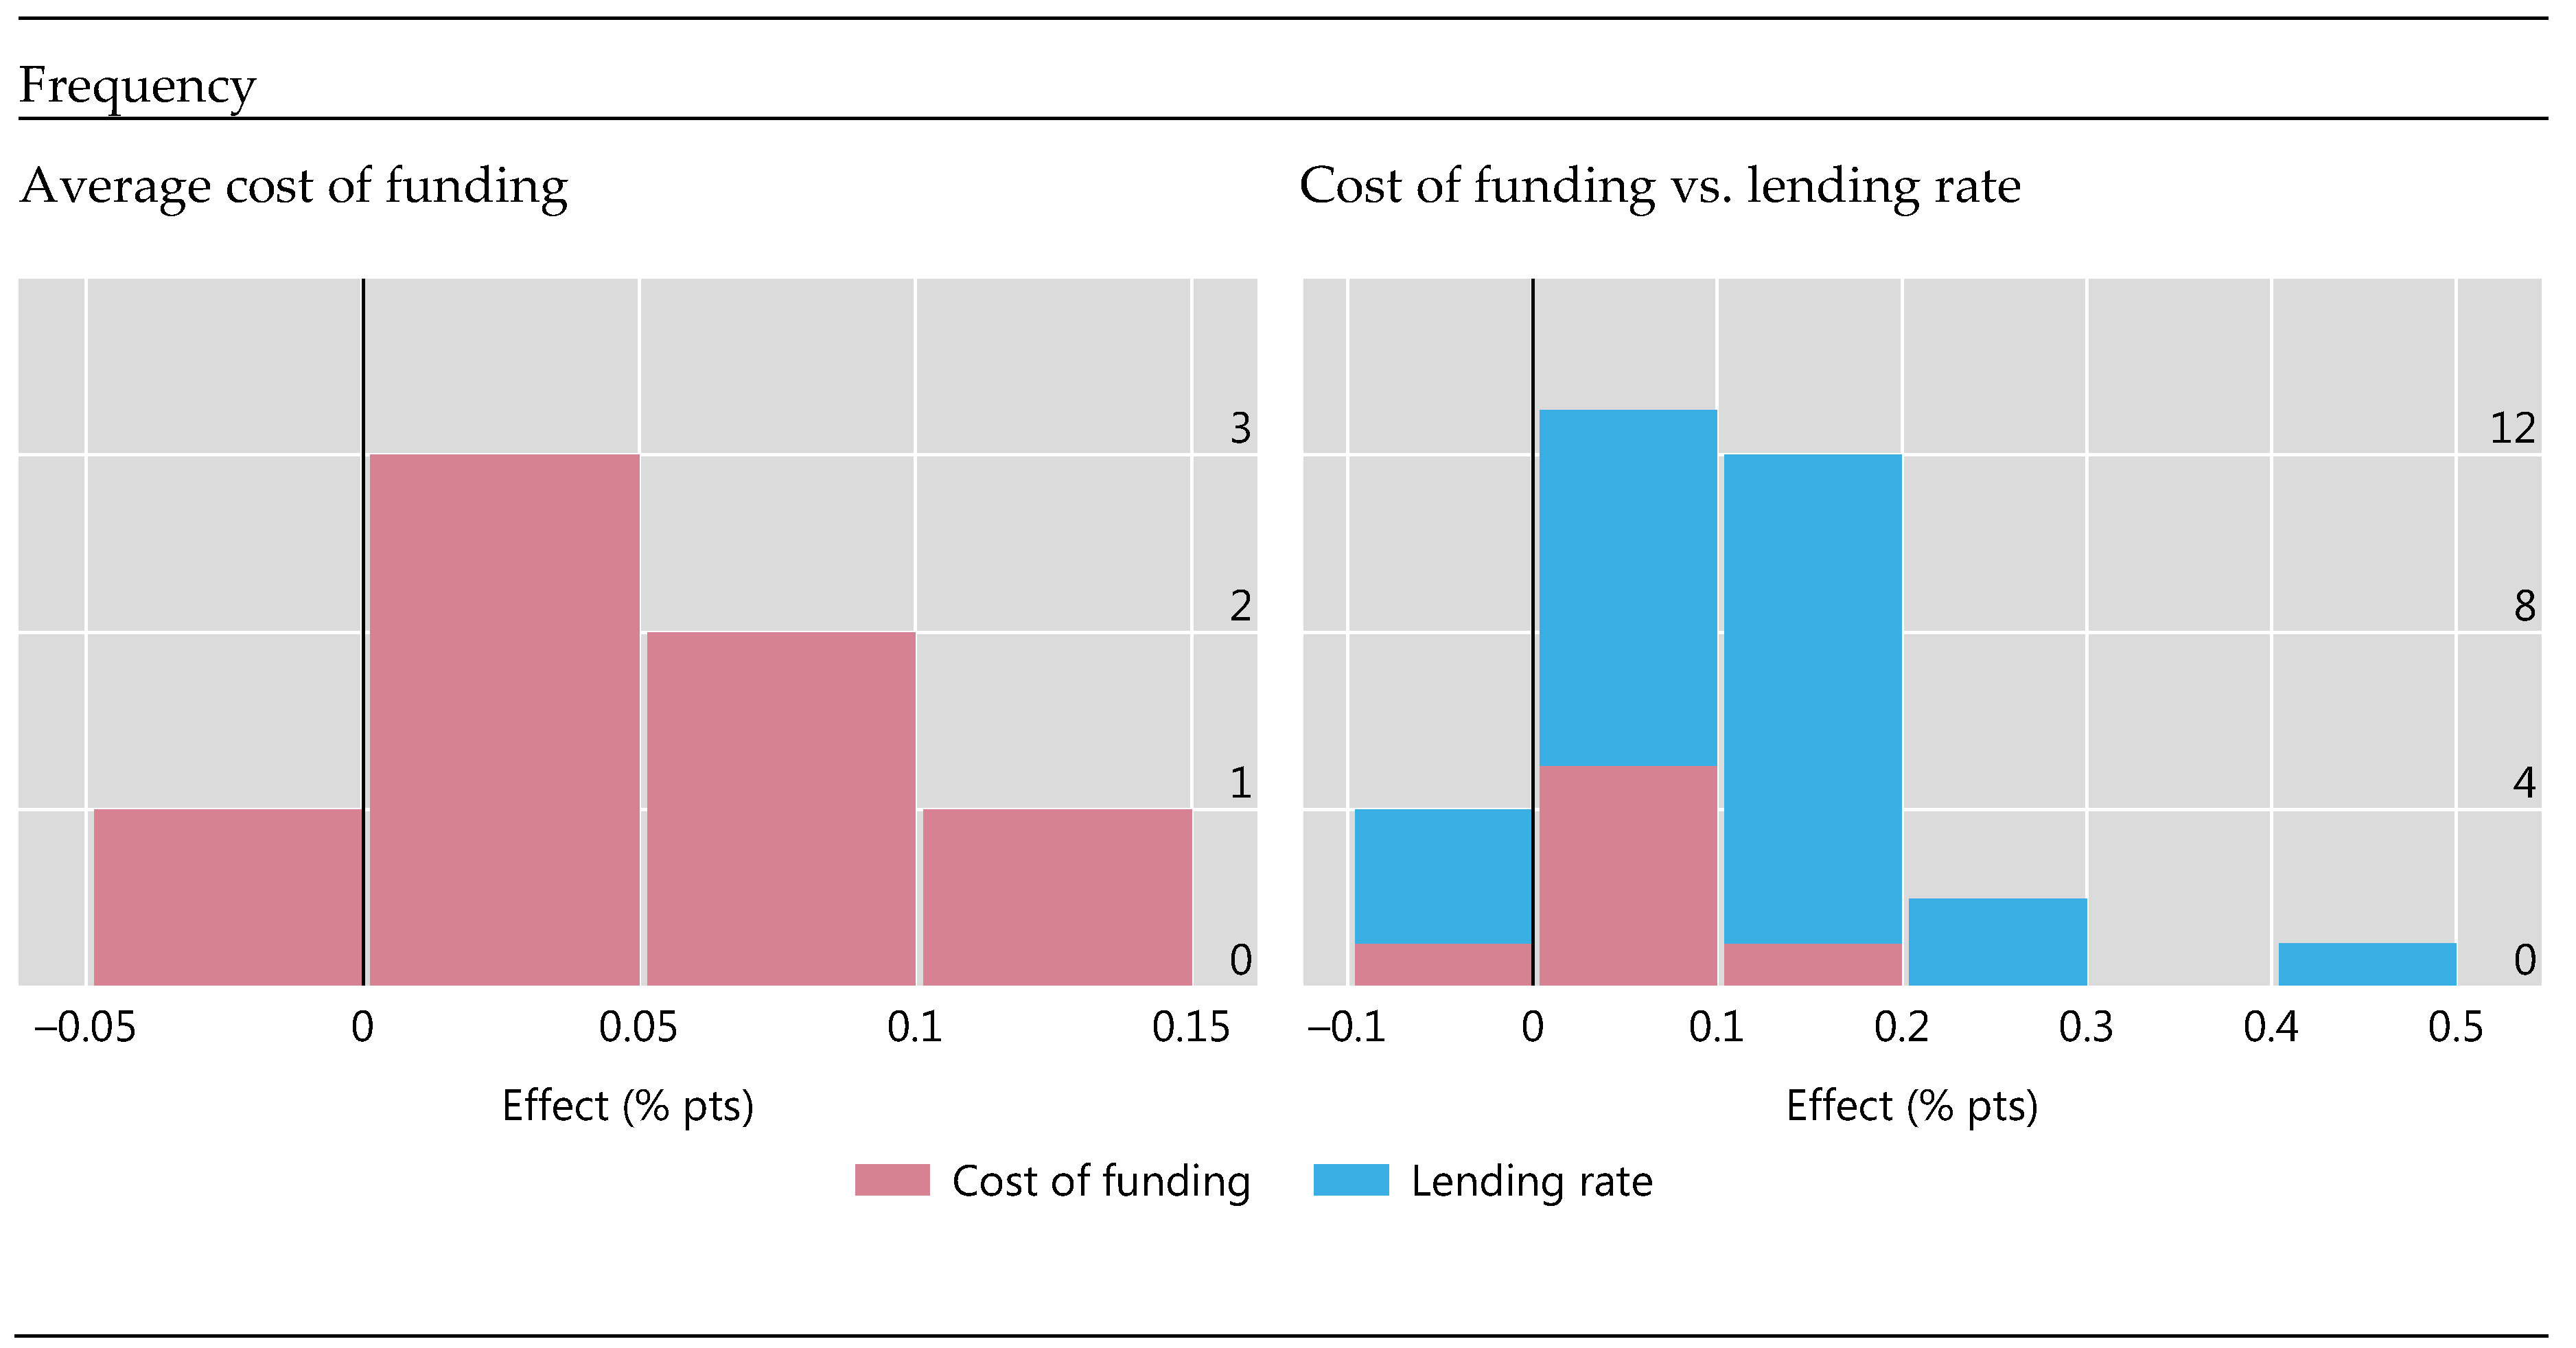
Appendix B.2. Costs of Bank Capital in Normal Times?
Appendix C. Competition and Regulatory Reform Interactions
Appendix D. Relation between Marginal Benefits and Optimal Levels of Capital

References
- Admati, Anat R., Peter M. DeMarzo, Martin Hellwig, and Paul Pfleiderer. 2013. Fallacies, Irrelevant Facts, and Myths in the Discussion of Capital Regulation: Why Bank Equity Is Not Expensive. Working Paper No. 2065. Stanford: Stanford Business School. [Google Scholar]
- Aikman, David, Andrew G. Haldane, Marc Hinterschweiger, and Sujit Kapadia. 2018. Rethinking Financial Stability. Working Paper 712. London: Bank of England. [Google Scholar]
- Aiyar, Shekhar, Charles W. Calomiris, John Hooley, Yevgeniya Korniyenko, and Tomasz Wieladek. 2014a. The International Transmission of Bank Capital Requirements: Evidence from the UK. Journal of Financial Economics 113: 368–82. [Google Scholar] [CrossRef]
- Aiyar, Shekhar, Charles W. Calomiris, and Tomasz Wieladek. 2014b. Does Macro-Prudential Regulation Leak? Evidence from a UK Policy Experiment. Journal of Money, Credit and Banking 46: 181–214. [Google Scholar] [CrossRef]
- Aiyar, Shekhar, Charles W. Calomiris, and Tomasz Wieladek. 2016. How Does Credit Supply Respond to Monetary Policy and Bank Minimum Capital Requirements? European Economic Review 82: 142–65. [Google Scholar] [CrossRef]
- Almenberg, Johan, Markus Andersson, Daniel Buncic, Cristina Cella, Paolo Giordani, Anna Grodecka, Kasper Roszbach, and Gabriel Söderberg. 2017. Appropriate Capital Ratios in Major Swedish Banks—New Perspectives. Stockholm: Sveriges Riksbank, Available online: http://archive.riksbank.se/Documents/Rapporter/Staff%20memo/Staff_memo_170519_eng.pdf (accessed on 1 May 2019).
- Baker, Malcolm P., and Jeffrey Wurgler. 2013. Would Stricter Capital Requirements Raise the Cost of Capital? Bank Capital Regulation and the Low Risk Anomaly. Working Paper. New York: New York University Stern Business School, Available online: http://people.stern.nyu.edu/jwurgler/papers/Bank%20Capital%20Regulation.pdf (accessed on 1 May 2019).
- Barrell, Ray, E. Philip Davis, Tatiana Fic, Dawn Holland, Simon Kirby, and Iana Liadze. 2009. Optimal Regulation of Bank Capital and Liquidity: How to Calibrate New International Standards. London: Bank of England. [Google Scholar]
- Barth, James R., and Stephen Matteo Miller. 2018. Benefits and Costs of a Higher Bank Leverage Ratio. Journal of Financial Stability 38: 37–52. [Google Scholar] [CrossRef]
- Basel Committee on Banking Supervision (BCBS). 2010. An Assessment of the Long-Term Economic Impact of Stronger Capital and Liquidity Requirements. Available online: http://www.bis.org/publ/bcbs173.htm (accessed on 1 May 2019).
- Behn, Markus, Rainer Haselmann, and Paul Wachtel. 2016. Procyclical Capital Regulation and Lending. The Journal of Finance 71: 919–56. [Google Scholar] [CrossRef]
- Benetton, Matteo, Peter Eckley, Nicola Garbarino, Liam Kirwin, and Georgia Latsi. 2017. Specialisation in Mortgage Risk under Basel II. Bank of England Working Paper no 639. Available online: https://papers.ssrn.com/sol3/papers.cfm?abstract_id=2900165 (accessed on 1 May 2019).
- Bernanke, Ben S., Cara S. Lown, and Benjamin M. Friedman. 1991. The Credit Crunch. Brookings Paper on Economic Activity, 205–39. [Google Scholar] [CrossRef] [Green Version]
- Berrospide, Jose M., and Rochelle M. Edge. 2010. The Effects of Bank Capital on Lending: What Do We Know, and What Does It Mean? International Journal of Central Banking 6: 5–54. [Google Scholar]
- Bank for International Settlements (BIS). 2015. Assessing the Economic Costs and Benefits of TLAC Implementation. Available online: http://www.bis.org/publ/othp24.pdf (accessed on 1 May 2019).
- Bordo, Michael, Barry Eichengreen, Daniela Klingebiel, and Maria Soledad Martinez-Peria. 2001. Financial Crisis-Lessons from the Last 120 Years. Economic Policy 16: 51–82. [Google Scholar]
- Bridges, Jonathan, David Gregory, Mette Nielsen, Silvia Pezzini, Amar Radia, and Marco Spaltro. 2014. The Impact of Capital Requirements on Bank Lending. Bank of England Working Paper no 486. Available online: http://papers.ssrn.com/sol3/papers.cfm?abstract_id=2388773 (accessed on 1 May 2019).
- Brooke, Martin, Oliver Bush, Robert Edwards, Jas Ellis, Bill Francis, Rashmi Harimohan, Katharine Neiss, and Caspar Siegert. 2015. Measuring the Macroeconomic Costs and Benefits of Higher UK Bank Capital Requirements. Bank of England Financial Stability Paper no 35. Available online: http://www.bankofengland.co.uk/-/media/boe/files/financial-stability-paper/2015/measuring-the-macroeconomic-costs-and-benefits-of (accessed on 1 May 2019).
- Cline, William R. 2017. The Right Balance for Banks: Theory and Evidence on Optimal Capital Requirements. New York: Columbia University Press. [Google Scholar]
- Cochrane, John. 2017. Capital Cause and Effect. Blog. Available online: http://johnhcochrane.blogspot.com/2017/04/capital-cause-and-effect.html (accessed on 1 May 2019).
- Cosimano, Thomas F., and Dalia Hakura. 2011. Bank Behavior in Response to Basel III: A Cross-Country Analysis. International Monetary Fund Working Paper 11/119. Available online: http://www.imf.org/external/pubs/ft/wp/2011/wp11119.pdf (accessed on 1 May 2019).
- Covas, Francisco, and John C. Driscoll. 2014. Bank Liquidity and Capital Regulation in General Equilibrium. Federal Reserve Board Finance Economics Discussion Series Working Paper No 2014–85. Washington: Federal Reserve Board. [Google Scholar]
- Dagher, Jihad, Giovanni Dell’Arriccia, Luc Laeven, Lev Ratnovski, and Hui Tong. 2016. Benefits and Costs of Bank Capital, International Monetary Fund Staff Discussion Note 16/04. Available online: http://www.imf.org/external/pubs/ft/sdn/2016/sdn1604.pdf (accessed on 1 May 2019).
- de-Ramon, Sebastián, Zanna Iscenko, Matthew Osborne, Michael Straughan, and Peter Andrews. 2012. Measuring the Impact of Prudential Policy on the Macroeconomy: A Practical Application to Basel III and Other Responses to the Financial Crisis. Financial Services Authority Occasional Paper, No 42. London: Financial Services Authority. [Google Scholar]
- Dell’Arriccia, Giovanni, Luc Laeven, and Gustavo A. Suarez. 2017. Bank Leverage and Monetary Policy’s Risk-Taking Channel: Evidence from the United States. The Journal of Finance 72: 613–54. [Google Scholar] [CrossRef]
- Dewatripont, Mathias, Diana Hancock, Emrah Arbak, Janet Mitchell, Josef Schroth, Olivier de Bandt, Claire Labonne, Monika Bucher, Daniel Foos, Roberta Fiori, and et al. 2016. Literature Review on Integration of Regulatory Capital and Liquidity Instruments. Working Papers. Basel: Basel Committee on Banking Supervision. [Google Scholar]
- Federal Reserve Bank of Minneapolis. 2017. The Minneapolis Plan to End Too Big to Fail. Available online: http://www.minneapolisfed.org/~/media/files/publications/studies/endingtbtf/the-minneapolis-plan/the-minneapolis-plan-to-end-too-big-to-fail-final.pdf?la=en (accessed on 1 May 2019).
- Fender, Ingo, and Ulf Lewrick. 2016. Adding It All Up: The Macroeconomic Impact of Basel III and Outstanding Reform Issues. Working Paper no 591. Basel: Bank for International Settlements, Available online: http://www.bis.org/publ/work591.pdf (accessed on 1 May 2019).
- Firestone, Simon, Amy Lorenc, and Benjamin Ranish. 2017. An Empirical Economic Assessment of the Costs and Benefits of Bank Capital in the US. Federal Reserve Board Finance and Economics Discussion Series Working Paper 2017-34. Washington, DC: Federal Reserve Board Finance and Economics. [Google Scholar]
- Furceri, Davide, and Annabelle Mourougane. 2012. The Effect of Financial Crises on Potential Output from OECD Countries. Journal of Macroeconomics 34: 822–32. [Google Scholar] [CrossRef]
- Gambacorta, Leonardo, and Hyun Song Shin. 2018. Why Bank Capital Matters for Monetary Policy. Journal of Financial Intermediation 25: 17–29. [Google Scholar] [CrossRef] [Green Version]
- Glancy, David, and Robert J. Kurtzman. 2018. How do Capital Requirements Affect Loan Rates? Evidence from High Volatility Commercial Real Estate. Board of Governors of the Federal Reserve System. Available online: http://papers.ssrn.com/sol3/papers.cfm?abstract_id=3202509 (accessed on 1 May 2019).
- Homar, Timotej, and Sweder J. G. van Wijnbergen. 2017. Bank Recapitalization and Economic Recovery after Financial Crises. Journal of Financial Intermediation 32: 16–28. [Google Scholar] [CrossRef]
- International Monetary Fund. 2018. The Global Recovery 10 Years after the 2008 Financial Meltdown. In World Economic Outlook. Washington, DC: International Monetary Fund, chp. 2. pp. 71–100. [Google Scholar]
- Iyer, Rajkamal, José-Luis Peydró, Samuel da-Rocha-Lopes, and Antoinette Schoar. 2014. Interbank Liquidity Crunch and the Firm Credit Crunch: Evidence from the 2007–2009 Crisis. The Review of Financial Studies 27: 347–72. [Google Scholar] [CrossRef]
- Jorda, Oscar, Björn Richter, Moritz Schularick, and Alan M. Taylor. 2017. Bank Capital Redux: Solvency, Liquidity, and Crisis. NBER Working Paper No 23287. Cambridge: NBER. [Google Scholar]
- Junge, Georg, and Peter Kugler. 2013. Quantifying the Impact of Higher Capital Requirements on the Swiss Economy. Swiss Journal of Economics and Statistics 149: 313–56. [Google Scholar] [CrossRef] [Green Version]
- Kapan, Tümer, and Camelia Minoiu. 2018. Balance Sheet Strength and Bank Lending: Evidence from the Global Financial Crisis. Journal of Banking and Finance 92: 35–50. [Google Scholar] [CrossRef]
- Kashyap, Anil K., Jeremy C. Stein, and Samuel Hanson. 2010. An Analysis of the Impact of “Substantially Heightened” Capital Requirements on Large Financial Institutions. Available online: http://faculty.chicagobooth.edu/anil.kashyap/research/papers/an_analysis_of_the_impactof_substantially_heightened-Capital-Requirements-on-Financial-Institutions.pdf (accessed on 1 May 2019).
- Kim, Dohan, and Wook Sohn. 2017. The Effect of Bank Capital on Lending: Does Liquidity Matter? Journal of Banking and Finance 77: 95–107. [Google Scholar] [CrossRef]
- Valencia, Fabian, and Mr Luc Laeven. 2008. Systemic Banking Crises: A New Database. Working Paper no. WP/08/224. International Monetary Fund: Available online: http://www.imf.org/external/pubs/ft/wp/2008/wp08224.pdf (accessed on 1 May 2019).
- Laeven, Luc, and Fabian Valencia. 2012. Systemic Banking Crises Database: An Update. International Monetary Fund Working Paper no. WP/12/163. Available online: http://www.imf.org/external/pubs/ft/wp/2012/wp12163.pdf (accessed on 1 May 2019).
- Locarno, Alberto. 2011. The Macroeconomic Impact of Basel III on the Italian Economy. Banca d’Italia Working Papers no 88. Rome: Banca d’Italia. [Google Scholar]
- Martinez-Miera, David, and Rafael Repullo. 2010. Does Competition Reduce the Risk of Bank Failure? Review of Financial Studies 23: 3638–64. [Google Scholar] [CrossRef] [Green Version]
- Mayes, David G., and Hanno Stremmel. 2014. The Effectiveness of Capital Adequacy Measures in Predicting Bank Distress. Vienna: SUERF Studies, no. 2014/1. [Google Scholar]
- Mikkelsen, Jakob Guldbæk, and Jesper Pedersen. 2017. A Cost-Benefit Analysis of Capital Requirements for the Danish Economy. Working Paper no 123. Copenhagen: Danmarks National Bank. [Google Scholar]
- Miles, David, Jing Yang, and Gilberto Marcheggiano. 2013. Optimal Bank Capital. Economic Journal 123: 1–37. [Google Scholar] [CrossRef]
- Reinhart, Carmen M., and Kenneth S. Rogoff. 2008. This Time Is Different: A Panoramic View of Eight Centuries of Financial Crisis. NBER Working Paper 13882. Cambridge: NBER. [Google Scholar]
- Romer, Christina D., and David H. Romer. 2017a. New Evidence on the Impact of Financial Crises in Advanced Countries. American Economic Review 107: 3072–118. [Google Scholar] [CrossRef] [Green Version]
- Romer, Christina D., and David H. Romer. 2017b. Why Some Times are Different: Macroeconomic Policy and the Aftermath of Financial Crises. Economica 85: 1–40. [Google Scholar] [CrossRef]
- Roulet, Caroline. 2018. Basel III: Effects of Capital and Liquidity Regulations on European Bank Lending. Journal of Economics and Business 95: 26–46. [Google Scholar] [CrossRef]
- Santos, Joao A. C., and Andrew Winton. 2013. Bank Capital, Borrower Power, and Loan Rates. Available online: http://papers.ssrn.com/sol3/papers.cfm?abstract_id=1343897 (accessed on 1 May 2019).
- Slovik, Patrick, and Boris Cournède. 2011. Macroeconomic Impact of Basel III. Organisation for Economic Co-Operation and Development Economics Department Working Papers no 884. Available online: http://www.oecd.org/officialdocuments/publicdisplaydocumentpdf/?cote=ECO/WKP (accessed on 1 May 2019).
- Sutorova, Barbora, and Petr Teplý. 2013. The Impact of Basel III on Lending Rates of EU Banks. Czech Journal of Economics and Finance 63: 226–43. [Google Scholar]
- Sveriges Riksbank. 2011. Appropriate Capital Ratios in Major Swedish Banks. Available online: http://archive.riksbank.se/Upload/Rapporter/2011/rap_appropriate_capital_ratio_in_major_swedish_banks_111206_eng.pdf (accessed on 1 May 2019).
- Varian, Hal R. 1992. Microeconomic Analysis. Rockville: W. W. Norton & Company. [Google Scholar]
- Vickers, John. 2016. The Systemic Risk Buffer for UK Banks: A Response to the Bank of England’s Consultation Paper. Journal of Financial Regulation 2: 264–82. [Google Scholar] [CrossRef]
- Zigraiova, Diana, and Tomas Havranek. 2016. Bank Competition and Financial Stability: Much Ado About Nothing? Journal of Economic Surveys 30: 944–81. [Google Scholar] [CrossRef] [Green Version]
| 1 | In the original LEI as well as in later studies the analysis refers to capital held, so that it does not distinguish between the minimum capital requirement and additional capital that banks may hold in excess of the minimum requirement. See Dewatripont et al. (2016) for a discussion of the costs and benefits of bank capital requirements outside of this stabiliser/drag framework. |
| 2 | Miles et al. (2013) and Barth and Miller (2018) are the only papers published thus far in economics journals. Cline (2017) is a book published by the Peterson Institute. A working paper version is available at piie.com/system/files/documents/wp16-6.pdf. Barrell et al. (2009) is a notable precursor to the LEI. See also de Ramon et al. (2012). |
| 3 | To be able to compare BCBS (2010) with a given later study, k*—defined as TCE/Basel II RWA—should be converted to the capital measure used in that later study. The conversion of the BCBS (2010) estimate is specific to the country and time-period of interest. For example, Firestone et al. (2017) provide a conversion estimate of the BCBS optimal capital range—10–15% in TCE/RWA (Basel II)—to 9.3–15.5% in Tier 1/RWA (Basel III) space by using a cross-section of US banks. Brooke et al. (2015) provide a conversion estimate of the BCBS (2010) optimal capital number for the UK—assuming moderate permanent effects of crises, they estimate a range of 16–19% in Tier 1/RWA (Basel III) space using samples of Euro-area banks and UK banks. |
| 4 | The LEI study concludes that the unconditional, annual probability of a banking crisis over the 1985–2009 period for G10 countries is at 4–5%, based on Reinhart and Rogoff (2008) and Laeven and Valencia (2008) crisis dating. Cline (2017, p. 28) notes that over the 1977–2015 period the probability is 2.6%. |
| 5 | Rapid credit growth (high credit/GDP) is invariably a highly significant, positive predictor of crisis in top down models. That is notable, if not surprising, because slower credit growth is considered a cost or drag from higher capital requirements, i.e., credit growth enters both sides of the costs and benefit calculation. |
| 6 | This contrasts with an extensive literature that finds capital ratios are predictive of bank failure. See for example Mayes and Stremmel (2014). |
| 7 | Bordo et al. (2001) estimated that the cumulative costs of a crisis in the post-Bretton Woods era was 7% of GDP, but that assumes no permanent effects. Reinhart and Rogoff (2008) found the average peak-to-trough decline in GDP, which also assumes only temporary effects, following a financial crisis is 9.3%. |
| 8 | The interventions (suspended convertibility, recapitalisation, nationalisation, liquidity support, guarantees, or asset purchases) must also be sufficiently large to qualify as a crisis indicator: liquidity support of at least 5% of deposits and liabilities to non-residents, restructuring costs of at least 3% of GDP, asset purchases of at least 5% of GDP, significant bank nationalisations or bank guarantees. |
| 9 | The narrative approach involves a mix of judgment and rules. For example, a ‘minor crisis’ is identified by three characteristics: (1) OECD perception of significant financial sector problems; (2) a belief that the problems are significantly affecting aggregate credit supply or growth; and (3) a belief the problems are not so severe as to be central to recent macroeconomic events or current expectations. |
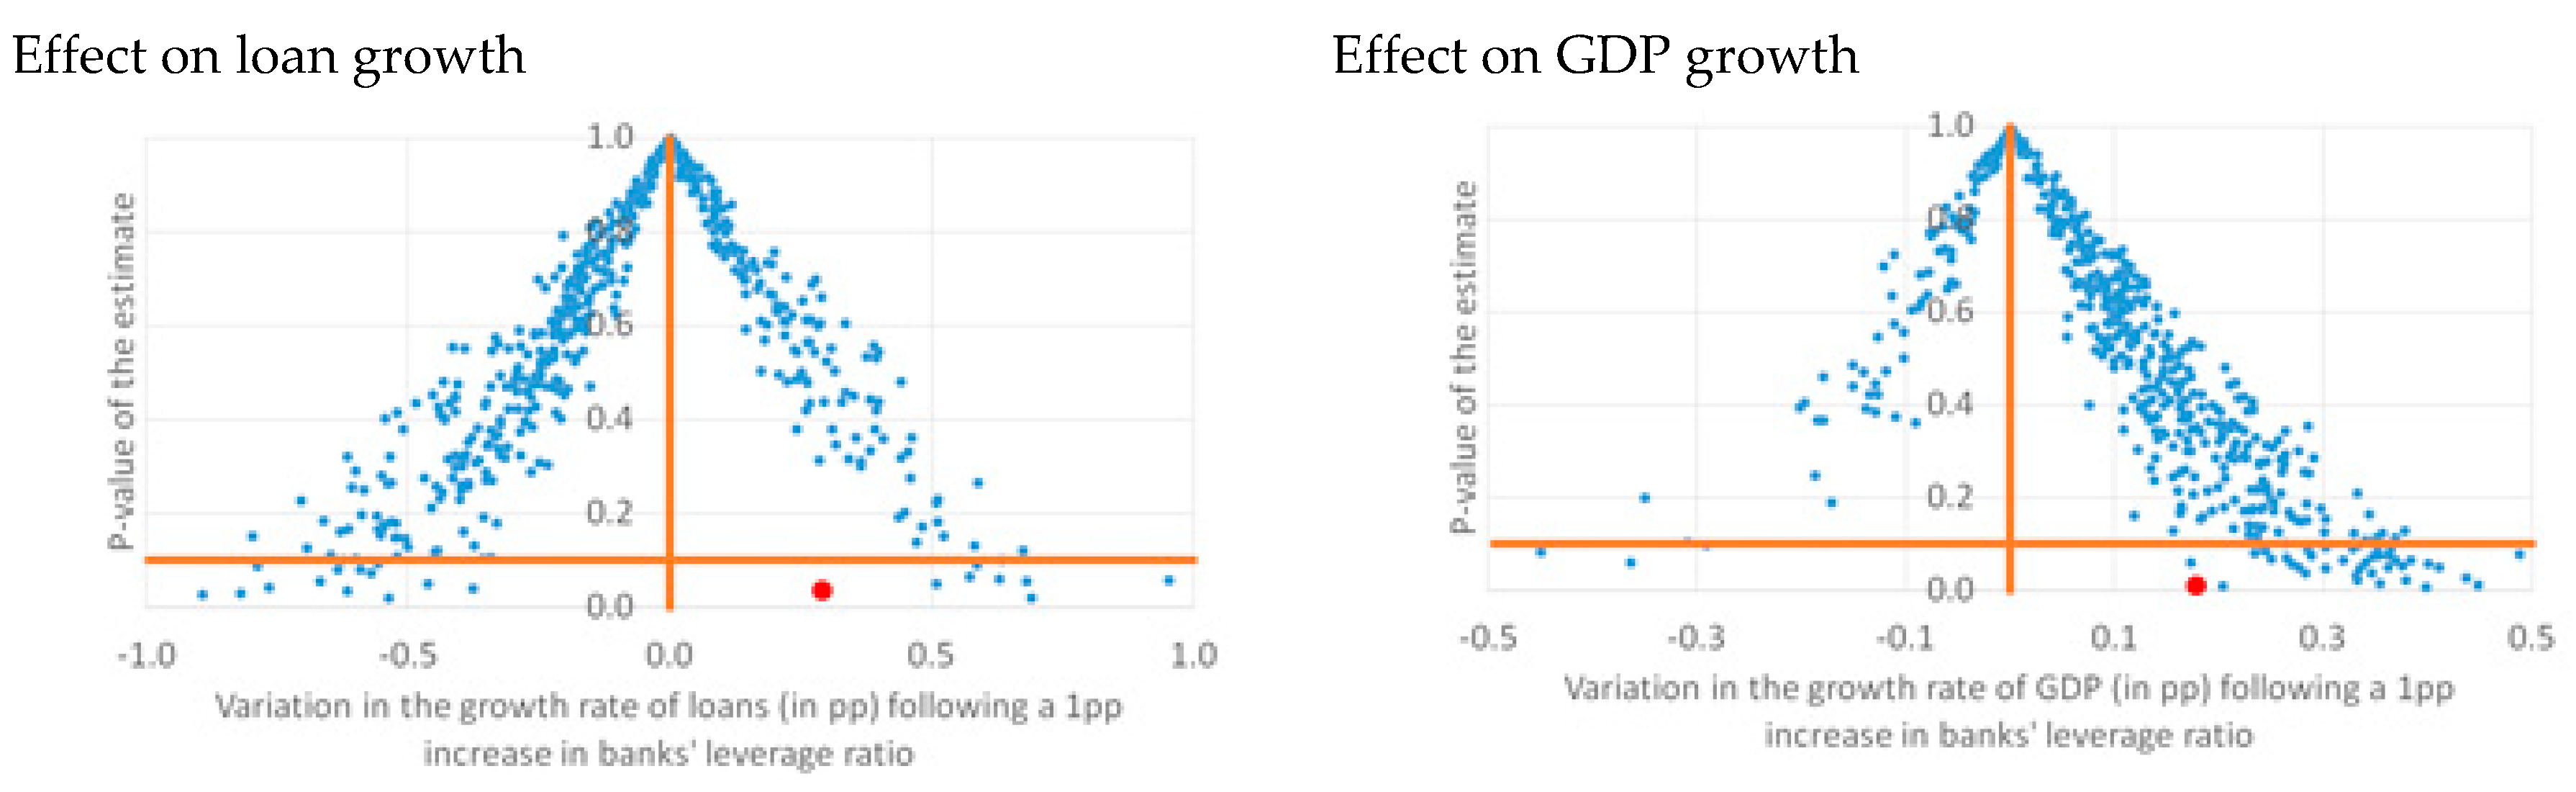
| 10 | The smaller, GLS (generalised least squares) estimate in the right panel may better apply to advanced economies as it down-weights smaller/less stable emerging economies. |
| 11 | Both stages use data from OECD countries from 1960 to 2008. |
| 12 | They assume a 2.7% discount rate. They use the GLS results from Romer and Romer (2017a) as GLS weights the larger, less volatile economies more and is thus more relevant for the United States. |
| 13 | Brooke et al. (2015) also adapt the Romer and Romer method, extending their sample in time and eliminating countries that they judged were less relevant to the UK. They also make adjustments based on the expected effect of TLAC and other structural changes to the banking system. Like Romer and Romer, Brooke et al. (2015) examine the marginal impact of a financial crisis, i.e., the effect over and above the general recession element that would have occurred anyway. Separating the marginal additional cost of a financial crisis leads to a considerably lower estimate of the cost of a crisis and, therefore, a lower estimate for k*. Some studies have simply used the 2010 LEI estimates, relied on previous work, or used relatively simple assumptions to calibrate the cost of a crisis. The Federal Reserve Bank of Minneapolis (2017) used the high end of the BCBS (2010) range. Miles et al. (2013) assume that GDP falls by 10% the first year, 7.5% the next five years, and then 2.5% forever. Cline (2017) uses a parameterisation, distinguished by assumptions about forgone investment in capital and that capital’s depreciation. Barth and Miller (2018) roughly follow Miles et al. (2013). BIS (2015) uses two calibrations as alternatives: Cline (2017) and the original BCBS (2010) median. Almenberg et al. (2017) use an estimate of the cost of prior Swedish crises, acknowledging the great uncertainty around this estimate. |
| 14 | Brooke et al. (2015) and Firestone et al. (2017) both incorporate this study in their analysis. BIS (2015) finds that TLAC and enhanced resolution planning reduce crisis probability and/or costs. |
| 15 | In addition, Brooke et al. (2015) find that crises would be around 25% more likely to happen absent effective resolution regimes, drawing on empirical studies which suggest that banks which expect to be bailed out are not therefore subject to market discipline and take more risk, raising the chance that a major bank will fail by around 30%. |
| 16 | If the higher cost of equity to banks reflects only the tax advantage of debt (and no other frictions), it is arguable whether the drag from higher required capital represents a social cost. |
| 17 | Almenberg et al. (2017) draw on the literature that estimates the effect of higher capital or capital requirements on lending spreads and does not estimate the MM offset directly. Fender and Lewrick (2016) use the same cost of capital and lending spread assumptions as those used in the LEI while acknowledging that they were likely highly conservative based on more recent work and revised the definition of capital. As a consequence, they use the LEI corrected by the conversion factor CET1/RWA = 0.78 TCE/RWA, hence the impact of 9 bps * (1/0.78) = 12 bps on GDP of a 1 percentage point increase in CET1/RWA. |
| 18 | Table 2 in Almenberg et al. (2017) summarises recent estimates in seven studies of MM offset (including four not considered here) showing an estimated range between 41 and 100%. |
| 19 | If the cost of meeting the higher liquidity requirements (from the NSFR) is considered, the estimated median impact implies an additional 0.08% loss in steady state GDP, independently of the level of capital. |
| 20 | All units in this paragraph are per a one percent increase in the leverage ratio, while those in Table 1 are measured with respect to the risk-weighted ratio. Miles et al. (2013) conclude that a Tier 1 increase that would halve leverage would reduce equilibrium output by 0.15%. In their exercise, leverage—computed as assets/Tier 1 capital—falls from 30 to 15, which in Basel III terms would be a leverage ratio increasing from 3.3% to 6.6%. Assuming that leverage ratios increase as capital requirements increase and linearity, each percentage point increase in the leverage ratio would reduce equilibrium GDP by approximately one third (0.045%) of their estimate. |
| 21 | Other, more recent, LEI studies (see Section 2) are less conservative, assuming that the cost of equity is lower for better capitalised banks, and they therefore find a lower effect of bank capitalisation on banks’ overall cost of funding. |
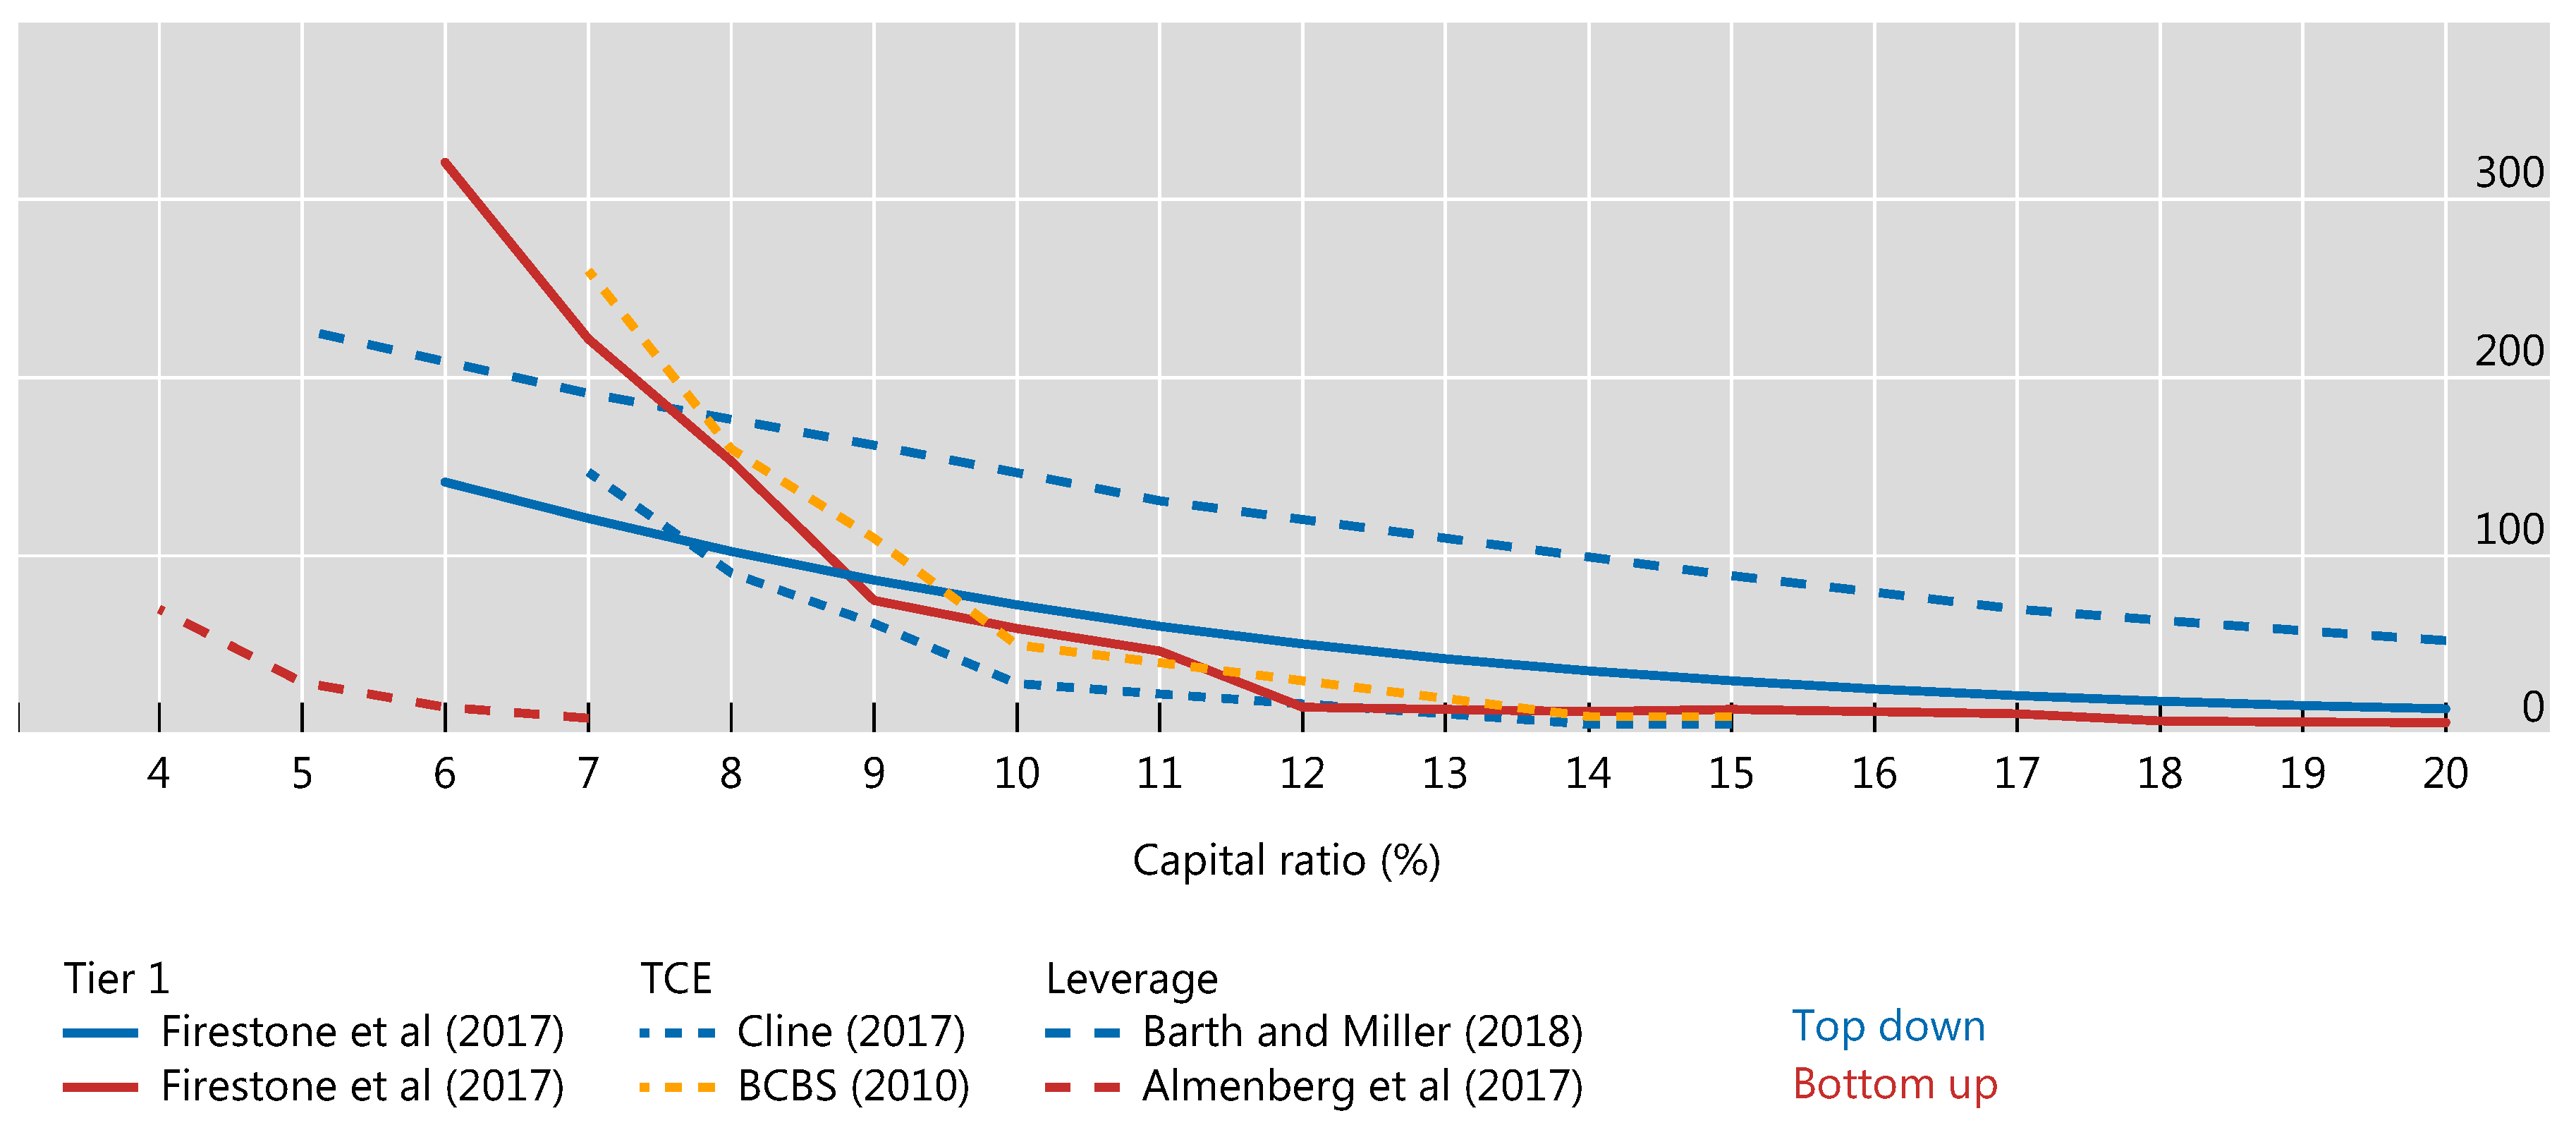
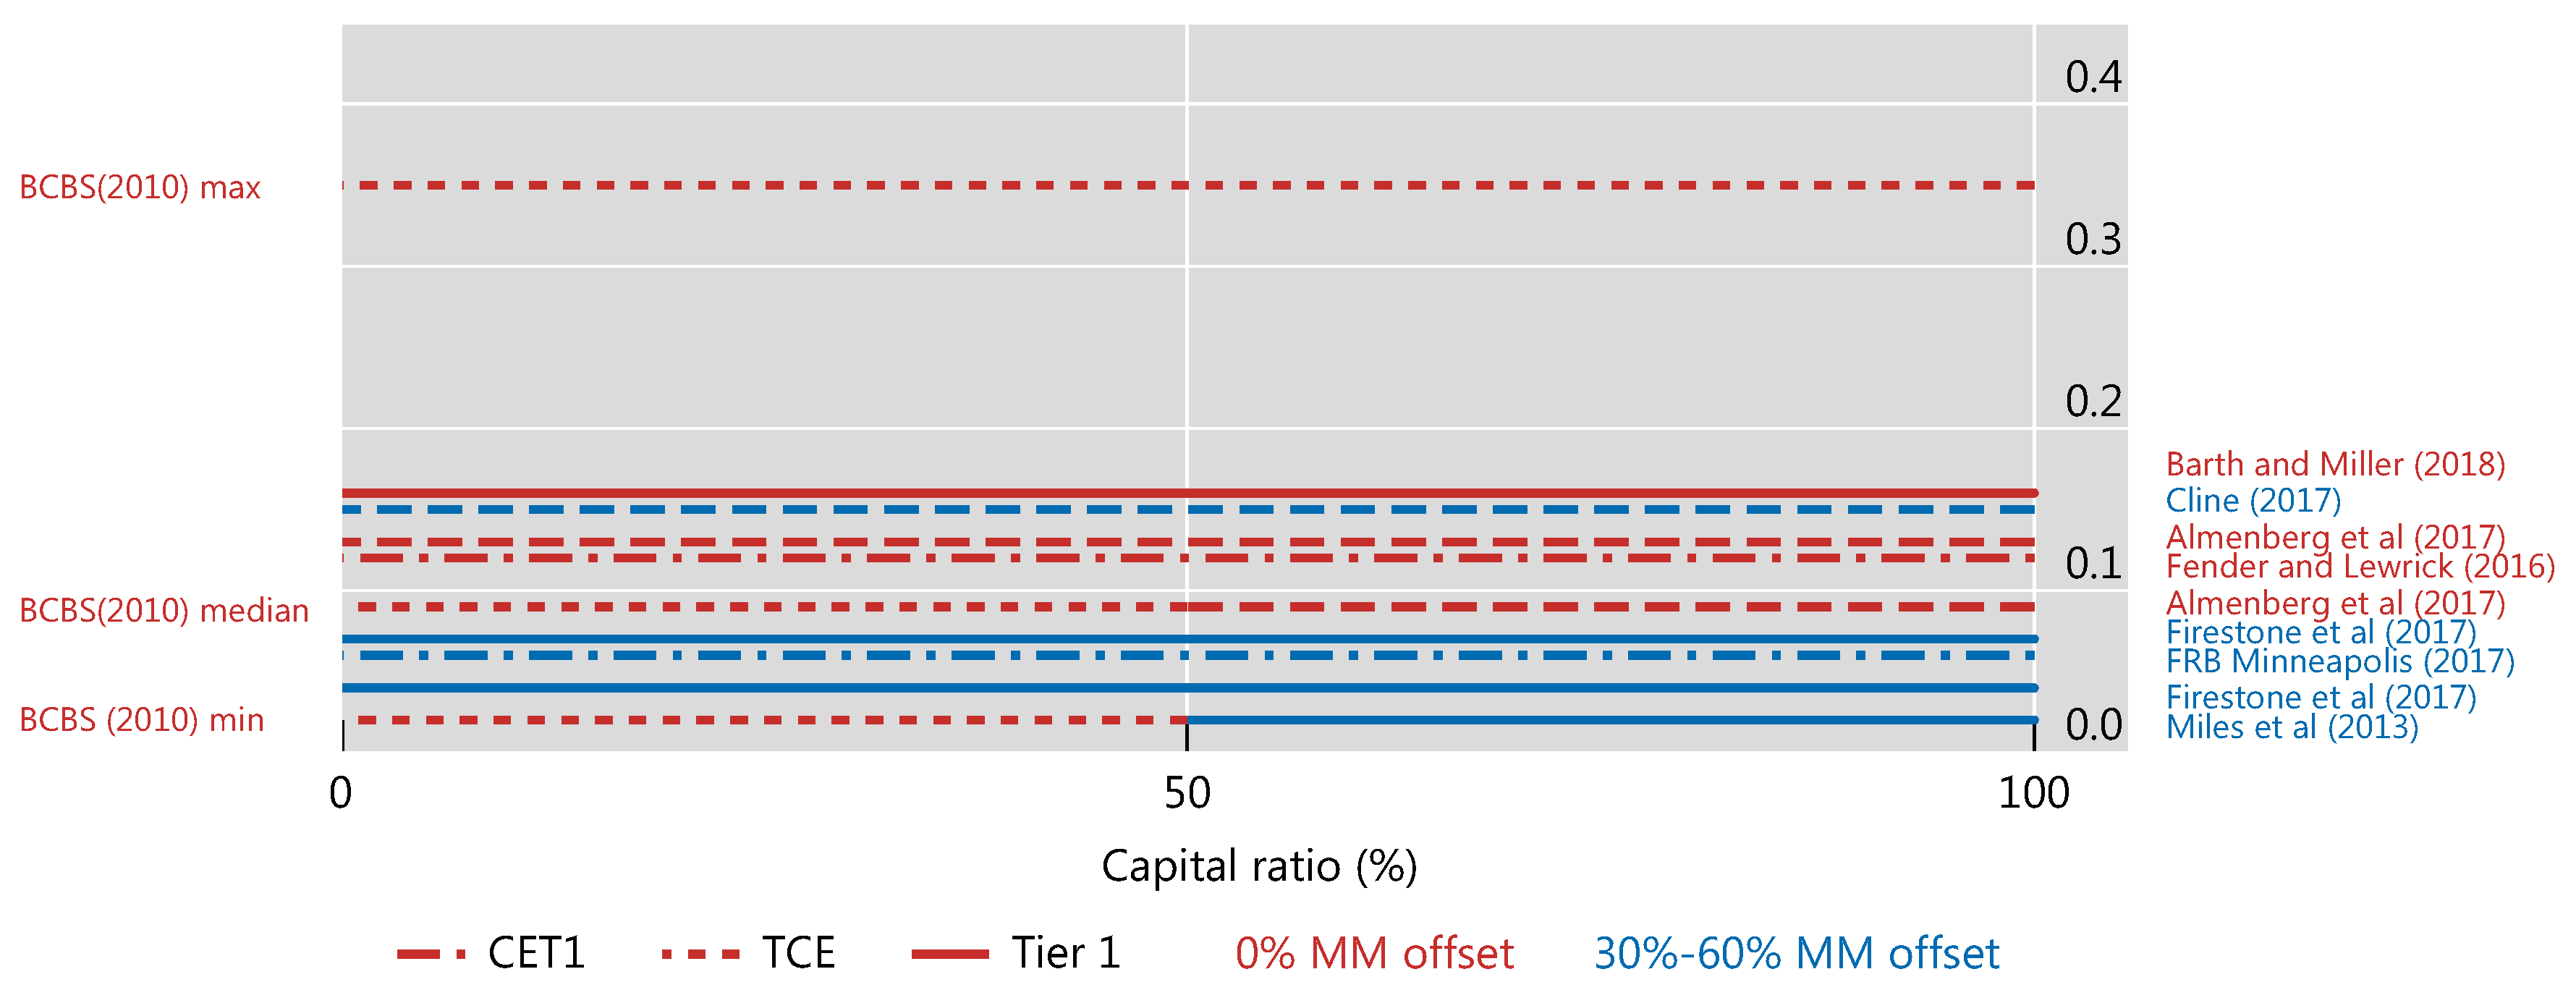
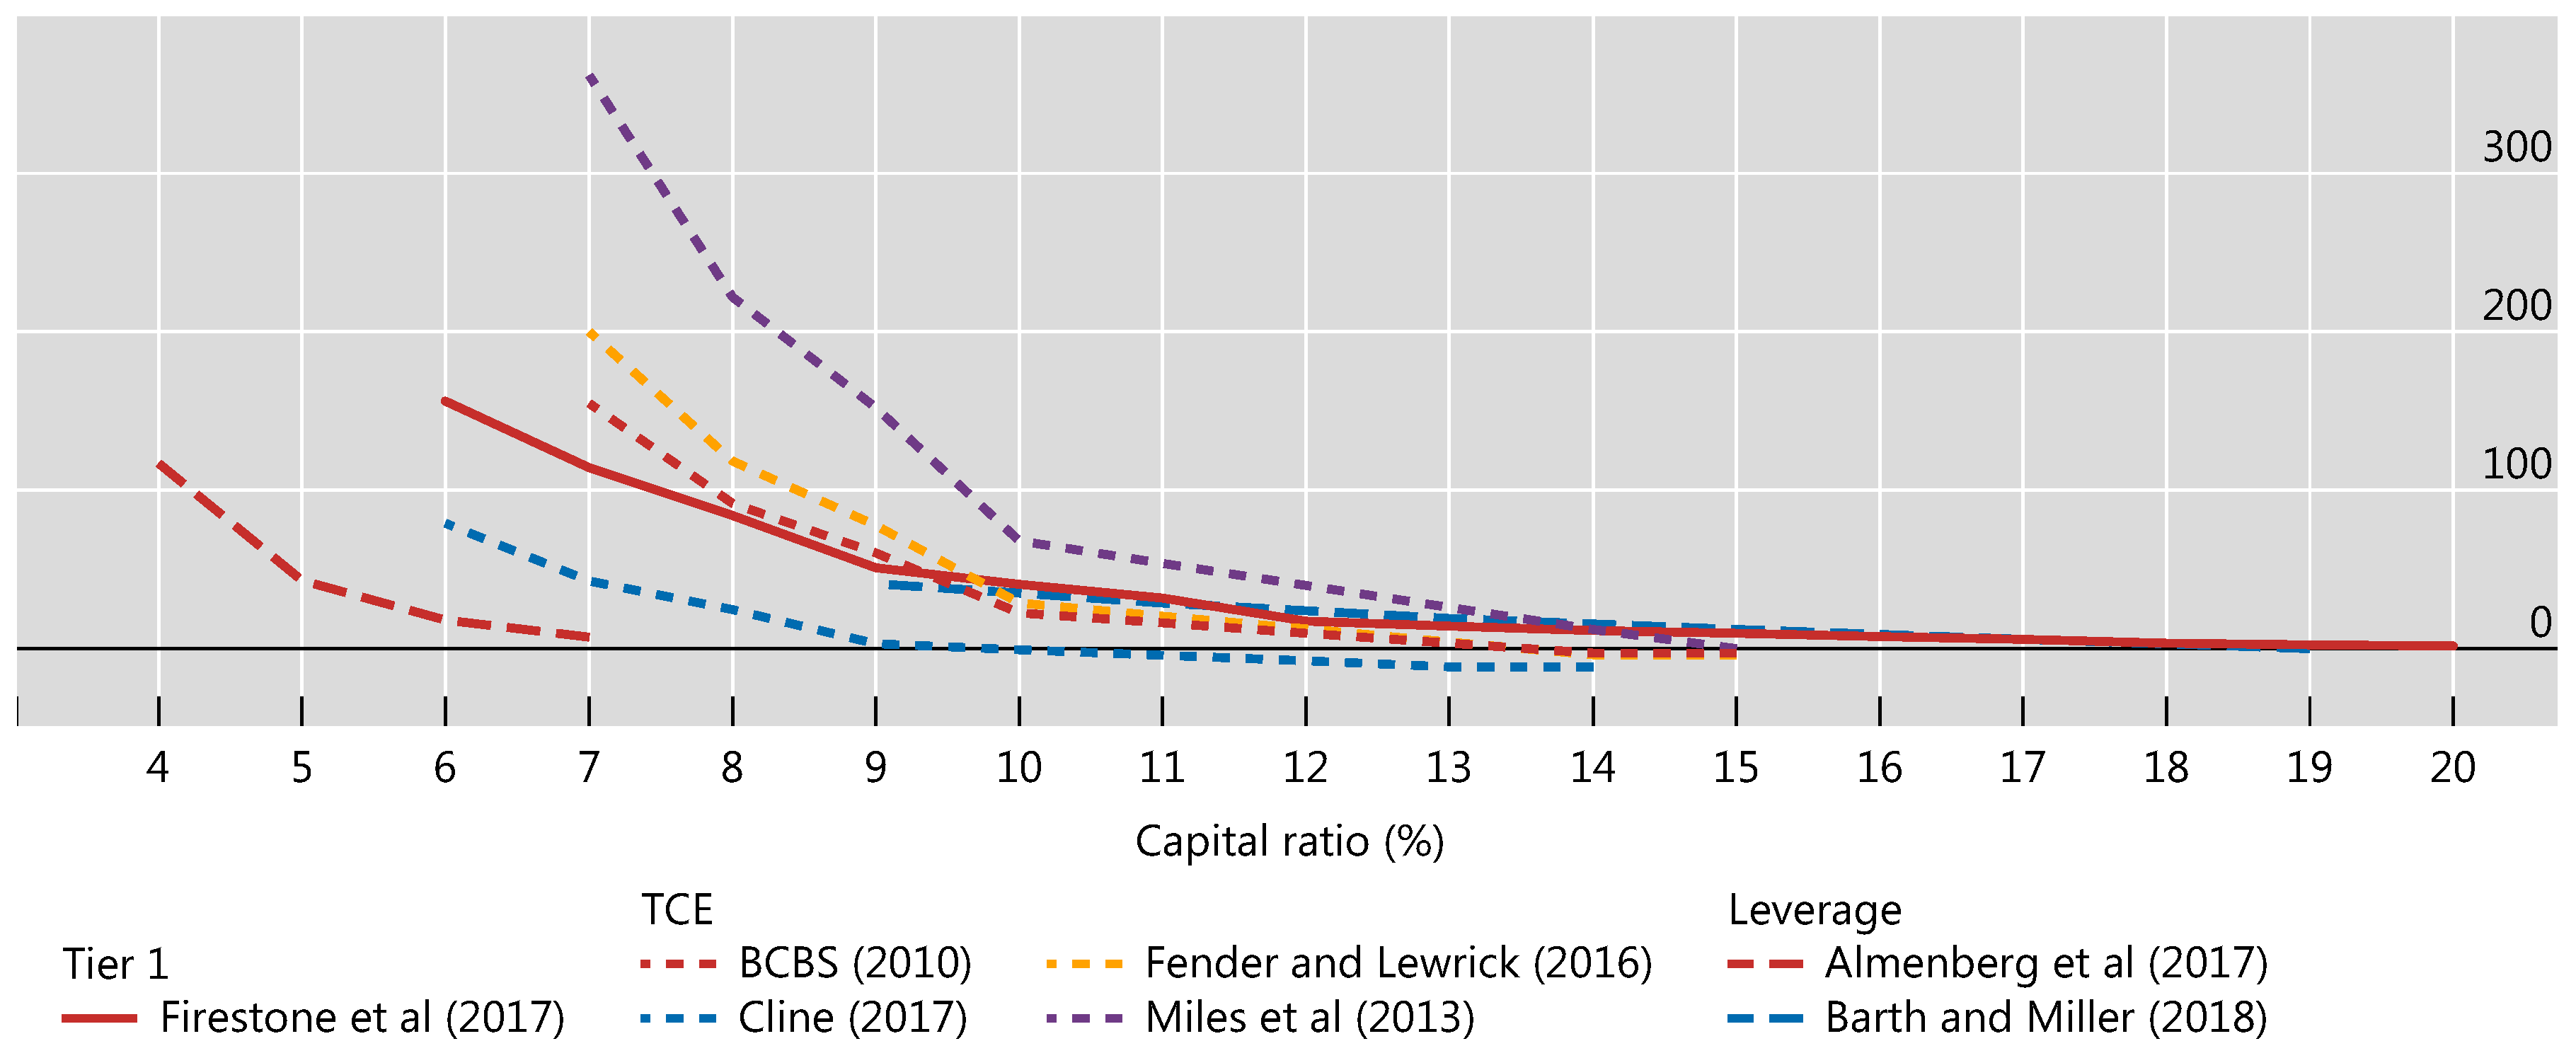
| 22 | In some cases, estimates are approximate because values were derived from figures provided in the study. The full range of studies covered in Section 2 could not be included in these charts due to insufficient data availability in the respective studies. |
| 23 | The marginal cost and marginal benefit estimates derived from Table 1 would be for the respective initial levels of capital in each study. They cannot be used to infer optimal capital levels as discussed in Appendix D. |
| 24 | Increases in loan spreads owing to capital increases used in subsequent LEI studies tended to be lower than the 13 basis points reported in LEI (Table 1). The mean of 12 basis points for this marginal effect in the piecemeal studies confirms the LEI estimate. (This is the average of standardised estimates reported in FRAME for Benetton et al. (2017), Cosimano and Hakura (2011), Dagher et al. (2016), Glancy and Kurtzman (2018), Santos and Winton (2013), Slovik and Cournede (2011), and Sutorova and Teply (2013)). We focus on marginal costs here rather than on its components because some studies use macroeconomic models that do not consider loan spreads. |
| 25 | Piecemeal studies (see FRAME standardised estimates for Covas and Driscoll (2014) and Locarno (2011)) with an average marginal cost of capital equal to 0.10% of GDP are consistent with the median marginal cost of capital used in BCBS (2010). The minimum marginal cost estimate in these piecemeal studies at 0.02% of GDP is in the lower range of those presented in Figure 8. |
| 26 | Recall that net marginal benefits (k) = reduced crisis probability (k) × crisis cost—output drag (loan spreads (k)). Generally, steeper net marginal benefit curves result in lower k* estimates. |
| 27 | |
| 28 | Appendix D shows that using simple means of controlling for different capital ratios, by seeking to measure net benefits for a common capital ratio across studies, can still present difficulties when mapping comparisons of net benefits into conclusions about optimal capital. |
| 29 | For the cumulative net benefit, BCBS (2010) includes additional elements for the case where liquidity requirements are met. First, it has a one-off impact on the probability of a crisis (for an unchanged capital ratio), lowering it from 4.6% to 3.4% for a capital ratio of 7%. Second, it has a one-off cost of 0.08% of output in normal times. Both these elements are counted as part of the net benefit in BCBS (2010, Table 8). |
| 30 | The analysis presented in this appendix is joint work with Moritz Schularick (University of Bonn and New York University). |
| 31 | |
| 32 | If banks raise loan rates, however, non-bank competitors may as well. |
| 33 | Competition may also indirectly influence k* by its effect on financial stability but whether increased competition increases or decreases financial stability is much debated both theoretically and empirically. See Martinez-Miera and Repullo (2010) for example. Zigraiova and Havranek (2016) review empirical studies in this literature and finds little interplay between competition and stability. |


| Study | BCBS (2010) | Miles et al. (2013) (Economic Journal) | Brooke et al. (2015) (BoE) | Fender and Lewrick (2016) (BIS) | Firestone et al. (2017) (FRB) | Cline (2017) (Peterson Institute) | Barth and Miller (2018) (Journal of Financial Stability) | Federal Reserve Bank of Minneapolis (2017) | Almenberg et al. (2017) 1 | |
|---|---|---|---|---|---|---|---|---|---|---|
| Coverage | BCBS members | UK | UK | BCBS members | US | US, Japan, Western EU | US | US | Sweden | |
| Assumptions | MM offset (%) 2 | 0 | 45 | 50 | 0 | 50 | 35–60 | 0 | 50 | 0 |
| Discount rate (%) | 5 | 2.5 | 3.5 | 5 | 2.7 | 1.5 | 5 | 5 | 0 to 3 | |
| Permanent crisis effects? | Range | Mostly (75%) temporary | Yes | Yes | Range | Yes | Mostly (75–90%) temporary | Yes | Yes | |
| Other reforms incorporated | Liquidity | TLAC, resolution | Liquidity, TLAC, resolution, ring-fencing | TLAC, resolution | Liquidity, TLAC, resolution | TLAC, resolution | None | None | TLAC | |
| Approximate marginal benefits and costs of capital 3 | ||||||||||
| Benefits | Reduced crisis probability (annual, %) 4 | 1.6 (0.1–2.6) | – | 0.03–0.1 5 | 1.3 | 0.6–1.7 | 0.9 | 1.7 | 0.8 | 0.7 |
| Cost of crisis (discounted, annual GDP %) | 19–158 (median: 63) | 140 | 43 | 63–100 | 41–99 | 64 | 47 | 158 | 180 | |
| Costs | Increase in loan spreads (bp) 4 | 13 | 2.5 | 5–10 | 13 | 3–7 | – | 2.3 | 6 | 6 |
| Cost of higher spreads (annual GDP bp) 4 | 9 | 2 | 1–5 | 12 | 4–7 | 15 | 16 | 6 | 9–13 | |
| Optimum (T1/RWA % unless indicated) | 10–15 6 (TCE/Basel II RWA) | 16–20 | 10–14 | 10–11 (CET1/RWA) | 13–25 | 12–14 (CET1/RWA) | 25 7 | 23.5 (CET1/RWA) | 10–24 (CET1/RWA) | |
| Study | Period | Countries | Indicator |
|---|---|---|---|
| Bordo et al. (2001) | 1880–2000 | 21 (later 56) | 1 indicates crisis at date, 0 otherwise |
| Reinhart and Rogoff (2008) | 1800–2008 | 66 | 1 indicates crisis at date, 0 otherwise |
| Laeven and Valencia (2012) | 1970–2011 | Global | 1 indicates crisis at date, 0 otherwise |
| Romer and Romer (2017b) | 1967–2012 | 24 (OECD) | Continuous (1 to 15) |
| Jorda et al. (2017) | 1870–2013 | 17 (OECD) | 1 indicates crisis at date, 0 otherwise |
| Study | Other Reforms Considered and Effects |
|---|---|
| BCBS (2010) | NSFR reduces crisis probability 1.2 percentage points to 1.5 percentage points given 10% liquidity, with smaller effects at higher capital levels. |
| Brooke et al. (2015) | TLAC requirements; an enhanced resolution regime (including, implicitly, the effects of the UK ring-fencing structural reform policy); new Bank of England liquidity regime and liquidity regulations. Joint effect reduces k* by 5 percentage points. |
| Firestone et al. (2017) | Higher liquidity reduces crisis probability, but minimal effect for capital over 10%; TLAC reduces crisis length and expected cost by 4% of GDP. Small effect on k*. |
| BIS (2015) | TLAC reduces crisis probability and cost; reduces net benefits of increased capital from 2% to 1% of GDP. |
© 2020 by the authors. Licensee MDPI, Basel, Switzerland. This article is an open access article distributed under the terms and conditions of the Creative Commons Attribution (CC BY) license (http://creativecommons.org/licenses/by/4.0/).
Share and Cite
Birn, M.; de Bandt, O.; Firestone, S.; Gutiérrez Girault, M.; Hancock, D.; Krogh, T.; Mio, H.; Morgan, D.P.; Palvia, A.; Scalone, V.; et al. The Costs and Benefits of Bank Capital—A Review of the Literature. J. Risk Financial Manag. 2020, 13, 74. https://doi.org/10.3390/jrfm13040074
Birn M, de Bandt O, Firestone S, Gutiérrez Girault M, Hancock D, Krogh T, Mio H, Morgan DP, Palvia A, Scalone V, et al. The Costs and Benefits of Bank Capital—A Review of the Literature. Journal of Risk and Financial Management. 2020; 13(4):74. https://doi.org/10.3390/jrfm13040074
Chicago/Turabian StyleBirn, Martin, Olivier de Bandt, Simon Firestone, Matías Gutiérrez Girault, Diana Hancock, Tord Krogh, Hitoshi Mio, Donald P. Morgan, Ajay Palvia, Valerio Scalone, and et al. 2020. "The Costs and Benefits of Bank Capital—A Review of the Literature" Journal of Risk and Financial Management 13, no. 4: 74. https://doi.org/10.3390/jrfm13040074
APA StyleBirn, M., de Bandt, O., Firestone, S., Gutiérrez Girault, M., Hancock, D., Krogh, T., Mio, H., Morgan, D. P., Palvia, A., Scalone, V., Straughan, M., Uluc, A., von Hafften, A. H., & Warusawitharana, M. (2020). The Costs and Benefits of Bank Capital—A Review of the Literature. Journal of Risk and Financial Management, 13(4), 74. https://doi.org/10.3390/jrfm13040074