Article

GARCH Generated Volatility Indices of Bitcoin and CRIX

1
Department of Actuarial Science, University of Pretoria, Private Bag X20, Hatfield 0028, South Africa
2
Department of Finance and Investment Management, University of Johannesburg, P.O. Box 524, Aucklandpark 2006, South Africa
3
Department of Mathematics and Applied Mathematics, University of Pretoria, Private Bag X20, Hatfield 0028, South Africa
*
Authors to whom correspondence should be addressed.
J. Risk Financial Manag. 2020, 13(6), 121; https://doi.org/10.3390/jrfm13060121
Submission received: 21 April 2020 / Revised: 3 June 2020 / Accepted: 4 June 2020 / Published: 11 June 2020

Abstract

:
In this paper, the pricing performance of the generalised autoregressive conditional heteroskedasticity (GARCH) option pricing model is tested when applied to Bitcoin (BTCUSD). In addition, implied volatility indices (30, 60-and 90-days) of BTCUSD and the Cyptocurrency Index (CRIX) are generated by making use of the symmetric GARCH option pricing model. The results indicate that the GARCH option pricing model produces accurate European option prices when compared to market prices and that the BTCUSD and CRIX implied volatility indices are similar when compared, this is consistent with expectations because BTCUSD is highly weighted when calculating the CRIX. Furthermore, the term structure of volatility indices indicate that short-term volatility (30 days) is generally lower when compared to longer maturities. Furthermore, short-term volatility tends to increase to higher levels when compared to 60 and 90 day volatility when large jumps occur in the underlying asset.

1. Introduction

The use of volatility indices (often referred to as fear indices) as a measure of market sentiment has become popular in recent years. According to Fernandes et al. (2014), the Chicago Board Options Exchange (CBOE) has published the Volatility Index (VIX) since 1993. The VIX is calculated using near term (30 calendar days) volatility implied by options on the S&P 500 index. Furthermore, the VIX is based on a model-free estimator of implied volatility and therefore does not rely on a particular option pricing framework.
Cryptocurrencies have recently gained a lot of attention from finance researchers and practitioners. Currently, there is not a cryptocurrency volatility index. Furthermore, cryptocurrencies do not have a well-established derivatives market. In a recent paper, Alexander and Imeraj (2019) addressed this problem by comparing two methods to construct a Bitcoin volatility index. The first is based on the standard geometric formula for the sum of squared log price increments; this is consistent with the CBOE VIX methodology. The second (arithmetic) approach represents a fair value for the average sum of squared log price increments.
According to Bouri et al. (2017), short horizon investment in Bitcoin can serve as a hedge against global equity market uncertainty (form of electronic gold)—hence the need for a Bitcoin volatility index with different time horizons. In this paper, by making use of the generalised autoregressive conditional heteroskedasticity (GARCH) option pricing model, the Bitcoin and Cryptocurrency Index (CRIX) volatility indices are estimated. The CRIX implied volatility index will give a more holistic view of cryptocurrency volatility (30, 60, and 90-day). The estimation of a volatility index for CRIX in the absence of a derivatives market was considered by Kolesnikova (2018), this was based on an exponentially weighted moving average approach. The rest of this paper is structured as follows: Section 2 reviews the recent and relevant literature. Section 3 focuses on the theoretical framework; this section is divided into two parts. The first focuses on the GARCH option pricing framework and the second elaborates on the GARCH volatility index. Thereafter, the statistical properties of Bitcoin and CRIX are illustrated. This is followed by the empirical results. Finally, concluding remarks are considered.

2. Literature Review

This section focuses on recent and relevant literature, and is divided into three subsections. The first subsection focuses on cryptocurrency indices, and the second reviews relevant literature based on GARCH models applied to cryptocurrencies. Finally, studies based on cryptocurrency volatility indices are considered.

2.1. Cryptocurrency Indices

According to Chu et al. (2017), with the exception of Bitcoin, there is not much literature focused on the application of GARCH models to cryptocurrencies. Therefore, the CRIX is also considered in this paper. According to Abboud (2017), there have been several attempts to construct a cryptocurrency index. Most cryptocurrency index attempts make use of empirical models from traditional financial markets with arbitrary parameters fitted to cryptocurrencies. The indices include capitalisation weighted indices like CRIX, Bletchley, TaiFu30, Crypto30, LBI, and Smith + Crown SCI. Furthermore, capped capitalisation indices include: CRYPTO20, CCX30, and BIT20. Finally, the smoothed capitalisation weighted index, such as the CCI30.
According to Kim et al. (2019), the CRIX is comparable to the S&P 500 index (reflection of the current state of the US market) because it gives an indication of the current state of the cryptocurrency market. Furthermore, Kim et al. (2019) explain that the CRIX provides a statistically backed (the number of constituents is determined by the explanatory power of each cryptocurrency has over market movements, this is based on the Akaike information criterion) market measure, which distinguishes it from other cryptocurrency indices. Therefore, the CRIX is used in this study to give an indication of the volatility of the cryptocurrency market as a whole. The CRIX was also used as a proxy for the cryptocurrency market by Elendner et al. (2018); Hafner (2020); Klein et al. (2018).

2.2. GARCH Models Applied to Cryptocurrencies

When it comes to the topic of time-varying volatility, most financial modelling researchers and practitioners will agree that the GARCH model is the most popular. GARCH models applied to cryptocurrencies have gained a lot of attention in recent years (as mentioned previously, most of this work has been based on Bitcoin). In an attempt to forecast Bitcoin risk, Agyarko et al. (2019) made use of univariate symmetric and asymmetric GARCH models. Their empirical results indicate that the symmetric GARCH(1,1) model provides the best fit. This is also consistent with the argument by Hansen and Lunde (2005), that it is difficult to find a model that consistently outperforms the GARCH(1,1) model because it is highly robust and parsimonious. With regard to forecasting risk, Agyarko et al. (2019) explain that no model clearly emerged as superior. Therefore, the study indicates that it is reliable to use the best fitted model when forecasting volatility (symmetric GARCH, in the case of Bitcoin).
Chen et al. (2018) performed an econometric analysis of the CRIX for portfolio investment. The empirical analysis included the application of autoregressive integrated moving average (ARIMA), univariate GARCH, and multivariate GARCH models. Their empirical results illustrate that the GARCH(1,1) model is sufficient to explain the heteroskedasticity of the CRIX. Chen et al. (2018) also consider alternate GARCH specifications. To capture the leverage effect (negative relationship between return shocks and subsequent shocks to volatility), the exponential GARCH (EGARCH) model was estimated. However, McAleer and Hafner (2014) show that leverage is not possible for the EGARCH model. Chen et al. (2018) conclude that the symmetric GARCH(1,1) model with a Student-t error distribution is the best performing univariate model when applied to the CRIX.
In order to determine the effect weather has on the cryptocurrency market, Kathiravan et al. (2019) made use of a GARCH(1,1) model, Johansen cointegration, and a Granger causality test. The Coinbase index was used as a proxy for the cryptocurrency market in this study. The GARCH analysis showed that temperature is the only weather factor that is statistically significant when modelling cryptocurrency volatility.
To give an indication of the best performing volatility model when applied to the cryptocurrencies market (not focused on Bitcoin only), Chu et al. (2017) applied twelve GARCH models (eight different error distributions) to the seven most popular cryptocurrencies. The models were compared based on the goodness of fit, forecasting performance, and acceptability of value-at-risk estimates. Their empirical results indicate that the normal distribution provides the best fitting GARCH model in most cases. Furthermore, the symmetric integrated GARCH(1,1) (IGARCH(1,1)) model with normal innovation was the best fitting model for most cryptocurrencies.
In a recent study, Hafner (2020) made use of GARCH models to test for the existence of speculative bubbles in the cryptocurrency market. The empirical analysis made use of eleven of the largest cryptocurrencies and the CRIX. The estimated parameters of the GARCH models indicate that volatility clustering is important and significant when modelling cryptocurrency volatility and, unlike equities, cryptocurrencies do not have asymmetric news impact curves. More specifically, the asymmetry terms of asymmetric GARCH models are generally statistically insignificant when applied to cryptocurrencies; this is consistent with other findings in the literature (see, e.g., Baur and Dimpfl 2018). According to Hafner (2020), there is general evidence that speculative bubbles exist in cryptocurrency markets.
Gyamerah (2019) made use of the symmetric GARCH(1,1), threshold-GARCH(1,1) (TGARCH(1,1)), and IGARCH(1,1) models to model the volatility of Bitcoin returns. With regard to the error distribution, Gyamerah (2019) considered the Student- t , generalised error, and normal inverse Gaussian distributions. The different models were compared based on the Akaike and Bayesian information criteria. Their empirical results indicate that the asymmetric TGARCH(1,1) model with a normal inverse Gaussian error distribution is the best fitting model when modelling volatility of Bitcoin returns. This implies that incorporating asymmetry in the GARCH model specification, and skewness and kurtosis in the error distribution, can improve the fit of a GARCH model when applied to Bitcoin.
In order to determine the best performing model when forecasting exchange rate and cryptocurrency (Bitcoin, Ethereum, and Dash) volatility, Peng et al. (2018) made use of the following univariate GARCH models: GARCH(1,1), EGARCH(1,1) and the Glosten, Jagannathan and Runkle GARCH(1,1) (GJR-GARCH(1,1)) model. Three different error distributions were considered: normal, Student-t, and skewed Student-t distributions. In addition, a support vector regression (SVR) GARCH(1,1) model was also estimated. Their empirical results show that the SVR-GARCH(1,1) model is superior when compared to the other models considered. Furthermore, when the traditional GARCH models are compared, the GJR-GARCH(1,1) performed slightly better when compared to the symmetric GARCH(1,1) and EGARCH(1,1) models. The different error distributions yielded similar results. This illustrates that different GARCH specifications can offer better results when applied to exchange rate and cryptocurrency volatility.

2.3. Cryptocurrency Volatility Indices

Studies based on cryptocurrency volatility indices are limited; this is because there is not a well established cryptocurrency derivatives market. Volatility indices are used based on implied volatility obtained from the option market (e.g., the CBOE VIX). Alexander and Imeraj (2019) constructed a Bitcoin volatility index by making use of the VIX methodology (geometric variance swap), Bitcoin option data were obtained from the Deribit exchange. In addition, Alexander and Imeraj (2019) note that Bitcoin prices tend to jump, therefore the fair value of geometric variance swaps are underestimated using this method. Hence, the method based on arithmetic variance swaps was also employed. Alexander and Imeraj (2019) recommend the use of the arithmetic index for horizons of one month or more. However, the volatility index based on arithmetic or geometric (VIX methodology) variance swaps is dependent on an established derivatives market, this is not the case for all cryptocurrencies and therefore a different approach is required.
In a recent study, Kim et al. (2019) construct a cryptocurrency volatility index based on the CRIX. The purpose of the index is to offer a forecast for the mean annualised volatility of the next month. Due to the shortcomings of the cryptocurrency derivatives market, Kim et al. (2019) make use of a proxy for implied volatility, therefore rolling volatility is used; this is based on historical volatility of the underlying. To get forward looking estimates (for the next 30 days) of rolling volatility, Kim et al. (2019) made use of GARCH family models, the Heterogeneous Auto-Regressive (HAR) model, and a neural network-based Long short-term memory cell; the performance of the different models was compared based on the mean squared error and the mean absolute error. Their empirical results show that the HAR model is the best performing model when forecasting rolling volatility of the CRIX. However, rolling volatility is based on historical volatility and not risk-neutral volatility. Therefore, the GARCH option pricing model is used in this study in order to estimate the implied volatility index (risk-neutral) in the absence of a well established derivatives market.

3. Theoretical Framework

In this section, the theoretical framework applied in this paper is discussed. This section is divided into two parts; the first deals with the GARCH option pricing framework, while the second focuses on the GARCH volatility index.

Option Pricing Model

Duan (1995) explains that, when using a GARCH process to model the log returns of an asset, the following is assumed,
ln S t S t 1 = r + λ σ t 1 2 σ t 2 + ϵ t ,
and
ϵ t = σ t η t ,
where r is the unique risk-free rate (continuously compounded), and λ is the constant unit risk premium. Furthermore, η t is assumed to be identically and independently distributed with mean zero and variance equal to one under the real world measure P .
Wilmott (2007) explains that the value of an option can be shown to be the expectation of the discounted future payoff under the risk-neutral measure ( P ˜ ). Consider the following definition from Duan (1995):
Definition 1.
A pricing measure P ˜ satisfies the locally risk-neutral valuation relationship (LRNVR) if the measure P ˜ is absolutely continuous with respect to measure P , S t / S t 1 is lognormally distributed, with conditional expectation and variance under the risk-neutral measure
E ˜ S t S t 1 Ω t 1 = exp r ,
and
V a r P ˜ ln S t S t 1 Ω t 1 = V a r P ln S t S t 1 Ω t 1 ,
almost surely with respect to measure P , where Ω t is the information set available at time t .
The above definition allows us to derive the following theorem:
Theorem 1.
Under pricing measure P ˜ , the LRNVR implies
ln S t S t 1 = r 1 2 σ t 2 + ξ t ,
where
ξ t = σ t η ˜ t ,
and η ˜ t is a standard normal random variable under the risk-neutral measure. This implies that
ξ t | Ω t 1 N ( 0 , σ t 2 ) .
Proof. 
Given that S t / S t 1 is log-normal under measure P ˜ , it can be written as
ln S t S t 1 = ν t + ξ t ,
where ν t is the conditional mean, and ξ t is a P ˜ -normal random variable, with conditional mean zero and variance σ t 2 . This follows that
E ˜ S t S t 1 Ω t 1 = E ˜ exp ν t + ξ t Ω t 1 = exp ν t + 1 2 σ t 2
by the LRNVR, σ t 2 = V a r P ˜ ln S t S t 1 Ω t 1 = V a r P ln S t S t 1 Ω t 1 . Furthermore, because Equation (3) holds, it follows that
ν t = r 1 2 σ t 2 .
This completes the proof. □
The assumption regarding the specification of the conditional variance is the symmetric GARCH(1,1) process of Bollerslev (1986). According to Hansen and Lunde (2005), it is difficult to find a volatility model that consistently outperforms the GARCH(1,1) due to its numerical stability and parsimony. The assumption of a GARCH(1,1) model is also appropriate based on previous findings in the literature (see, e.g., Agyarko et al. 2019). Furthermore, the asymmetry terms of asymmetric GARCH models are usually statistically insignificant when applied to cryptocurrencies (see, e.g., Baur and Dimpfl 2018; Hafner 2020); this will lead to an inefficient option pricing model. According to Brooks (2014), the GARCH(1,1) model is specified as follows:
σ t 2 = ω + α ϵ t 1 2 + β σ t 1 2 ,
with coefficient constraints, ω 0 , 0 α , β < 1 , and α + β 1 . The above equation specifies the dynamics of the volatility under the real world measure P . As mentioned previously, the value of an option is the discounted expected payoff under the risk-neutral measure. The risk-neutral dynamics of volatility is given by the following theorem:
Theorem 2.
If σ t 2 takes on a GARCH(1,1) specification, the LRNVR implies
σ t 2 = ω + α ξ t 1 λ σ t 1 2 + β σ t 1 2 .
Proof. 
By making use of Equations (3) and (6), it is clear that
r + λ σ t 1 2 σ t 2 + ϵ t = r 1 2 σ t 2 + ξ t ,
which suggests that
ϵ t = ξ t λ σ t .
if the above is substituted into Equation (7) and (8) is obtained. This completes the proof. □
It is clear from the above that, irrespective of how the conditional variance ( σ t 2 ) is specified, the variable ϵ t is always replaced by ξ t λ σ t . According to Asteriou and Hall (2015), the GARCH(1,1) model usually leads to a good fit and estimation is fairly easy. Furthermore, according to Dyhrberg (2016), the volatility of Bitcoin reacts similarly to positive and negative shocks. Therefore, the use of the symmetric GARCH(1,1) model is appropriate in this case. In addition, the assumption of a normal distribution is appropriate based on the findings by Chu et al. (2017).

4. GARCH Volatility Index

To be consistent with the CBOE VIX, the BTCUSD and CRIX volatility indices are based on implied volatility in the following 30 calendar days (22 trading days). Hao and Zhang (2013) assume that the volatility index is calculated as the expected arithmetic average of the variance in the n subperiods of the following 30, 60, or 90 calendar days:
ϑ t 100 2 = 252 n k 1 n E t P ˜ [ σ t + k 2 ] .
In this study, the dynamics of Bitcoin and CRIX are assumed to be consistent with a square-root stochastic autoregessive volatility (SR-SARV) model, which is defined below (Meddahi and Renault 2004):
Definition 2.
A stationary, square integrable process ϵ t , t Z is called a SR-SARV(p) (of order p) process with respect to filtration F t , if:
1. 
ε t is a martingale difference sequence with respect to F t ( E [ ε t | F t ] = 0 ) .
2. 
The conditional variance process f t of ε t + 1 given F t is a marginalisation of a stationary F t -adapted vector autoregressive process of dimension p:
f t = V a r [ ε t + 1 | F t ] = c F t F t = δ + Γ F t 1 + V t ,
where E [ V t | F t ] = 0 , c R c , δ R c and the eigenvalues of Γ have a modulus smaller than one.
Hao and Zhang (2013) show that, if the underlying asset (Bitcoin or CRIX) follows a SR-SARV(p) process under the risk neutral measure P ˜ , the implied volatility index has the analytical formula:
ϑ t = ζ + ψ σ t 2 ,
where
ζ = Ω 1 Γ ( 1 ψ ) , ψ = 1 Γ n n ( 1 Γ ) .
The implied volatility index of the GARCH(1,1) option pricing model is easily obtained using the general form above. The important studies required for the theory applied in this paper are summarised in Table 1 below:
The preliminary data analysis is considered in the next section.

5. Data Analysis

In this section, the descriptive statistics of Bitcoin (BTCUSD) and CRIX are reported. The BTCUSD data were obtained from the Thomson Reuters Datastream databank. The CRIX historical data were obtained from thecrix.de. Daily data from 1 January 2016 to 3 January 2019 are used in this study. The line graphs of the BTCUSD and CRIX log-returns are plotted in Figure 1 below:
The log-returns of both BTCUSD and CRIX seem to show signs of volatility clustering. This is consistent with the stylised facts of financial time series (Cont 2001). The histograms of BTCUSD and CRIX are plotted in Figure 2 below:
When compared to the normal distribution, both variables show signs of leptokurtosis (fat tails), which is also consistent with the stylised facts of financial time series. The descriptive statistics of BTCUSD and CRIX are reported in Table 2 below:
The descriptive statistics confirm expectations of leptokurtosis. Furthermore, the maximum, minimum, and standard deviation of the log-returns indicate that both return series are highly volatile. The GARCH volatility indices are considered in the next section.

6. Results

In this section, the pricing performance of the GARCH option pricing model when applied to BTCUSD is tested. In addition, the GARCH volatility indices for BTCUSD and CRIX are illustrated. The BTCUSD European option prices were obtained from Madan et al. (2019), the value date of the market prices is 29 June 2018. The GARCH(1,1) parameters when calibrated to BTCUSD log-returns (from 1 January 2016 to 28 June 2018) are reported in Table 3:
The pricing performance of the GARCH option pricing model applied to BTCUSD is illustrated in Figure 3 and Table 4 below. The market price is the mid European put price calculated using the bid and ask prices.
The GARCH prices were obtained by simulating 50,000 realisations of Equation (5). As mentioned previously, the price of an option is the expectation of the discounted payoff under the risk-neutral measure. Small differences are obtained when the GARCH prices are compared to market European put option prices. Hence, the GARCH(1,1) model produces accurate BTCUSD option prices and is therefore appropriate to be used for the calculation of volatility indices.
For the calculation of the volatility indices, the parameters were calibrated to log returns from 1 January 2016 to 3 January 2019. The GARCH(1,1) calibrated parameters are reported in Table 5 below:
By making use of a similar approach to Alexander and Imeraj (2019), the 30-day, 60-day, and 90-day volatility indices are shown. The BTCUSD and CRIX GARCH volatility indices shown are in Figure 4 and Figure 5 below:
It is evident from the above that GARCH volatility indices tend to increase after positive and negative shocks. This is consistent with findings by Conrad et al. (2018); Dyhrberg (2016). To illustrate how the term structure varies over time, the differences in volatility indices (left axis) and underlying assets (right axis) are plotted in Figure 6 and Figure 7 below:
When the term structure of volatility is considered, the 30-day volatility index for both BTCUSD and CRIX seem to be the lowest in most cases. This is consistent with expectations because there is more uncertainty over a longer period of time. However, when large jumps occur in the underlying asset, the short-term volatility index tends to increase to higher levels when compared to the 60-day and 90-day volatility indices (this is due to the fact that the volatility index is calculated as the expected arithmetic average of the variance in the n subperiods of the following 30, 60, or 90 calendar days). The 30-day GARCH volatility indices of BTCUSD and CRIX are compared in Figure 8 below:
Figure 8 indicates that the 30-day GARCH volatility index for BTCUSD is similar when compared to the 30-day CRIX GARCH volatility index.

7. Conclusions

In this paper, the pricing performance of the GARCH option pricing methodology is tested. In addition, the GARCH option pricing model is applied to BTCUSD and CRIX to estimate a GARCH volatility index. Volatility indices are usually estimated using a model-free approach. This approach has previously been applied to BTCUSD (Alexander and Imeraj 2019). In this paper, we rely on the symmetric GARCH volatility index. This is appropriate because previous findings indicate that BTCUSD volatility reacts similarly to positive and negative shocks.
The GARCH option pricing model produces accurate option prices when compared to market prices. As expected, the results indicate that the GARCH volatility indices also react similarly to positive and negative shocks. Furthermore, similar GARCH volatility indices are obtained when BTCUSD and CRIX are compared. This is consistent with expectations due to BTCUSD being highly weighted when calculating CRIX (Trimborn and Härdle 2018). The term structure of volatilities are consistent with expectations, with 30-day volatility being lower when compared to longer maturities. In addition, short-term volatility tends to increase to higher levels when compared to 60-day and 90-day volatility when large jumps occur in the underlying asset.
As per previous studies (Antonopoulos 2014; Böhme et al. 2015; Leong and Sung 2018; Leong et al. 2020), Bitcoin, as a digital currency, has huge potential in applications and advantages, such as lower fees, fraud protection, simpler international payments, etc. The findings of this paper, hopefully, would contribute to the development of future bitcoin research. Areas for future research include the use of different GARCH specifications (e.g., TGARCH(1,1) based on Gyamerah 2019; GJR-GARCH based on Peng et al. 2018) and error distributions (e.g., Student-t distribution based on the findings of Chen et al. 2018; normal inverse Gaussian based on Gyamerah 2019) applied to the modelling of cryptocurrency GARCH volatility indices. In addition, GARCH option pricing models with jump processes should also be considered because BTCUSD prices tend to jump excessively (Alexander and Imeraj 2019). Finally, the calibrated risk neutral GARCH processes can also be used for the pricing of derivatives written on cryptocurrency implied volatility indices.

Author Contributions

Conceptualization, P.J.V. and E.M.; methodology, P.J.V. and E.M.; software, P.J.V.; validation, E.M.; formal analysis, P.J.V.; investigation, P.J.V. and E.M.; data curation, P.J.V.; writing—original draft preparation, P.J.V; writing—review and editing, E.M.; visualization, P.J.V. and E.M.; supervision, E.M.; project administration, E.M. All authors have read and agreed to the published version of the manuscript.

Funding

This research received no external funding.

Acknowledgments

The authors would like to thank the editor and anonymous referees for their insightful comments and suggestions that helped improve the manuscript considerably. We would also like to thank our colleague Alexis Levendis for reviewing and commenting on various updated versions of our manuscript.

Conflicts of Interest

The authors declare no conflict of interest.

References

  1. Abboud, Husam. 2017. H/Rindex: The Hashing Power and Robustness Index, Computational Power-weighted Benchmark for Global Blockchain and Crypto Market. Available online: https://ssrn.com/abstract=3136635 (accessed on 1 June 2020).
  2. Agyarko, Kofi, Albert Buabeng, and Joseph Acquah. 2019. Modelling the Volatility of the Price of Bitcoin. American Journal of Mathematics and Statistics 9: 151–59. [Google Scholar]
  3. Alexander, Carol, and Arben Imeraj. 2019. The Bitcoin VIX its Variance Risk Premium. Available online: https://ssrn.com/abstract=3383734 (accessed on 26 January 2020).
  4. Antonopoulos, Andreas M. 2014. Mastering Bitcoin: Unlocking Digital Cryptocurrencies. Sebastopol: O’Reilly Media, Inc. [Google Scholar]
  5. Asteriou, Dimitrios, and Stephen G. Hall. 2015. Applied Econometrics. New York: Palgrave Macmillan. [Google Scholar]
  6. Baur, Dirk G., and Thomas Dimpfl. 2018. Asymmetric volatility in cryptocurrencies. Economics Letters 173: 148–51. [Google Scholar] [CrossRef]
  7. Böhme, Rainer, Nicolas Christin, Benjamin Edelman, and Tyler Moore. 2015. Bitcoin: Economics, technology, and governance. Journal of Economic Perspectives 29: 213–38. [Google Scholar] [CrossRef] [Green Version]
  8. Bollerslev, Tim. 1986. Generalized autoregressive conditional heteroskedasticity. Journal of Econometrics 31: 307–27. [Google Scholar] [CrossRef] [Green Version]
  9. Bouri, Elie, Rangan Gupta, Aviral Kuma Tiwari, and David Roubaud. 2017. Does Bitcoin hedge global uncertainty? Evidence from wavelet-based quantile-in-quantile regressions. Finance Research Letters 23: 87–95. [Google Scholar] [CrossRef] [Green Version]
  10. Brooks, Chris. 2014. Introductory Econometrics for Finance. New York: Cambridge University Press. [Google Scholar]
  11. Chen, Shi, Cathy Yi-Hsuan Chen, Wolfgang Karl Härdle, Teik Ming Lee, and Bobby Ong. 2018. Econometric analysis of a cryptocurrency index for portfolio investment. In Handbook of Blockchain, Digital Finance, and Inclusion. London: Academic Press, vol. 1, pp. 175–206. [Google Scholar]
  12. Chu, Jeffrey, Stephen Chan, Saralees Nadarajah, and Joerg Osterrieder. 2017. GARCH modelling of cryptocurrencies. Journal of Risk and Financial Management 10: 17. [Google Scholar] [CrossRef]
  13. Conrad, Christian, Anessa Custovi, and Eric Ghysels. 2018. Long-and short-term cryptocurrency volatility components: A GARCH-MIDAS analysis. Journal of Risk and Financial Management 11: 23. [Google Scholar] [CrossRef]
  14. Cont, Rama. 2001. Empirical properties of asset returns: stylized facts and statistical issues. Quantitative Finance 1: 223–36. [Google Scholar] [CrossRef]
  15. Duan, Jin-Chuan. 1995. The GARCH option pricing model. Mathematical Finance 5: 13–32. [Google Scholar] [CrossRef]
  16. Dyhrberg, Anne Haubo. 2016. Bitcoin, gold and the dollar—A GARCH volatility analysis. Finance Research Letters 16: 85–92. [Google Scholar] [CrossRef] [Green Version]
  17. Elendner, Hermann, Simon Trimborn, Bobby Ong, and Teik Ming Lee. 2018. The cross-section of crypto-currencies as financial assets: Investing in crypto-currencies beyond bitcoin. In Handbook of Blockchain, Digital Finance, and Inclusion. London: Academic Press, vol. 1, pp. 145–73. [Google Scholar]
  18. Fernandes, Marcelo, Marcelo C. Medeiros, and Marcel Scharth. 2014. Modeling and predicting the CBOE market volatility index. Journal of Banking & Finance 40: 1–10. [Google Scholar]
  19. Gyamerah, Samuel Asante. 2019. Modelling the volatility of Bitcoin returns using GARCH models. Quantitative Finance and Economics 3: 739. [Google Scholar] [CrossRef]
  20. Hafner, Christian M. 2020. Testing for bubbles in cryptocurrencies with time-varying volatility. Journal of Financial Econometrics 18: 233–49. [Google Scholar]
  21. Hansen, Peter R., and Asger Lunde. 2005. A forecast comparison of volatility models: does anything beat a GARCH(1,1)? Journal of Applied Econometrics 20: 873–89. [Google Scholar] [CrossRef] [Green Version]
  22. Hao, Jinji, and Jin E. Zhang. 2013. GARCH option pricing models, the CBOE VIX, and variance risk premium. Journal of Financial Econometrics 11: 556–80. [Google Scholar] [CrossRef] [Green Version]
  23. Kathiravan, Chinnadurai, Murugesan Selvam, Balasundram Maniam, Sankaran Venkateswar, Jayapal Gayathri, and Amrutha Pavithran. 2019. Effect of Weather on Cryptocurrency Index: Evidences from Coinbase Index. International Journal of Financial Research 10: 108–118. [Google Scholar] [CrossRef]
  24. Kim, Alisa, Simon Trimborn, and Wolfgang Karl Härdle. 2019. VCRIX-A Volatility Index for Crypto-Currencies. Available online: https://ssrn.com/abstract=3480348 (accessed on 1 June 2020).
  25. Klein, Tony, Hien Pham Thu, and Thomas Walther. 2018. Bitcoin is not the New Gold—A comparison of volatility, correlation, and portfolio performance. International Review of Financial Analysis 59: 105–16. [Google Scholar] [CrossRef]
  26. Kolesnikova, Alisa. 2018. CRIX-Volatility Index for Crypto-currencies on the Basis of CRIX. Master’s thesis, Humboldt-Universität, Berlin, Germany. [Google Scholar]
  27. Leong, Kelvin, and Anna Sung. 2018. FinTech (Financial Technology): What is it and how to use technologies to create business value in fintech way? International Journal of Innovation, Management and Technology 9: 74–78. [Google Scholar] [CrossRef]
  28. Leong, Kelvin, Anna Sung, and Cedric Teissier. 2020. Financial Technology for Sustainable Development. In Partnerships for the Goals. Encyclopedia of the UN Sustainable Development Goals. Edited by Walter Leal Filho, Anabela Marisa Azul, Luciana Brandli, Pinar Göckin Özuyar and Tony Wall. Cham: Springer. [Google Scholar]
  29. Madan, Dilip B., Sofie Reyners, and Wim Schoutens. 2019. Advanced model calibration on bitcoin options. Digital Finance 1: 117–37. [Google Scholar] [CrossRef] [Green Version]
  30. McAleer, Michael, and Christian M. Hafner. 2014. A one line derivation of EGARCH. Econometrics 2: 92–97. [Google Scholar] [CrossRef] [Green Version]
  31. Meddahi, Nour, and Eric Renault. 2004. Temporal aggregation of volatility models. Journal of Econometrics 119: 355–79. [Google Scholar] [CrossRef] [Green Version]
  32. Peng, Yaohao, Pedro Henrique Melo Albuquerque, Jader Martins Camboim de Sá, Ana Julia Akaishi Padula, and Mariana Rosa Montenegro. 2018. The best of two worlds: Forecasting high frequency volatility for cryptocurrencies and traditional currencies with Support Vector Regression. Expert Systems with Applications 97: 177–92. [Google Scholar] [CrossRef]
  33. Trimborn, Simon, and Wolfgang Karl Härdle. 2018. CRIX an Index for cryptocurrencies. Journal of Empirical Finance 49: 107–22. [Google Scholar] [CrossRef]
  34. Wilmott, Paul. 2007. Paul Wilmott Introduces Quantitative Finance. Chichester: John Wiley & Sons. [Google Scholar]
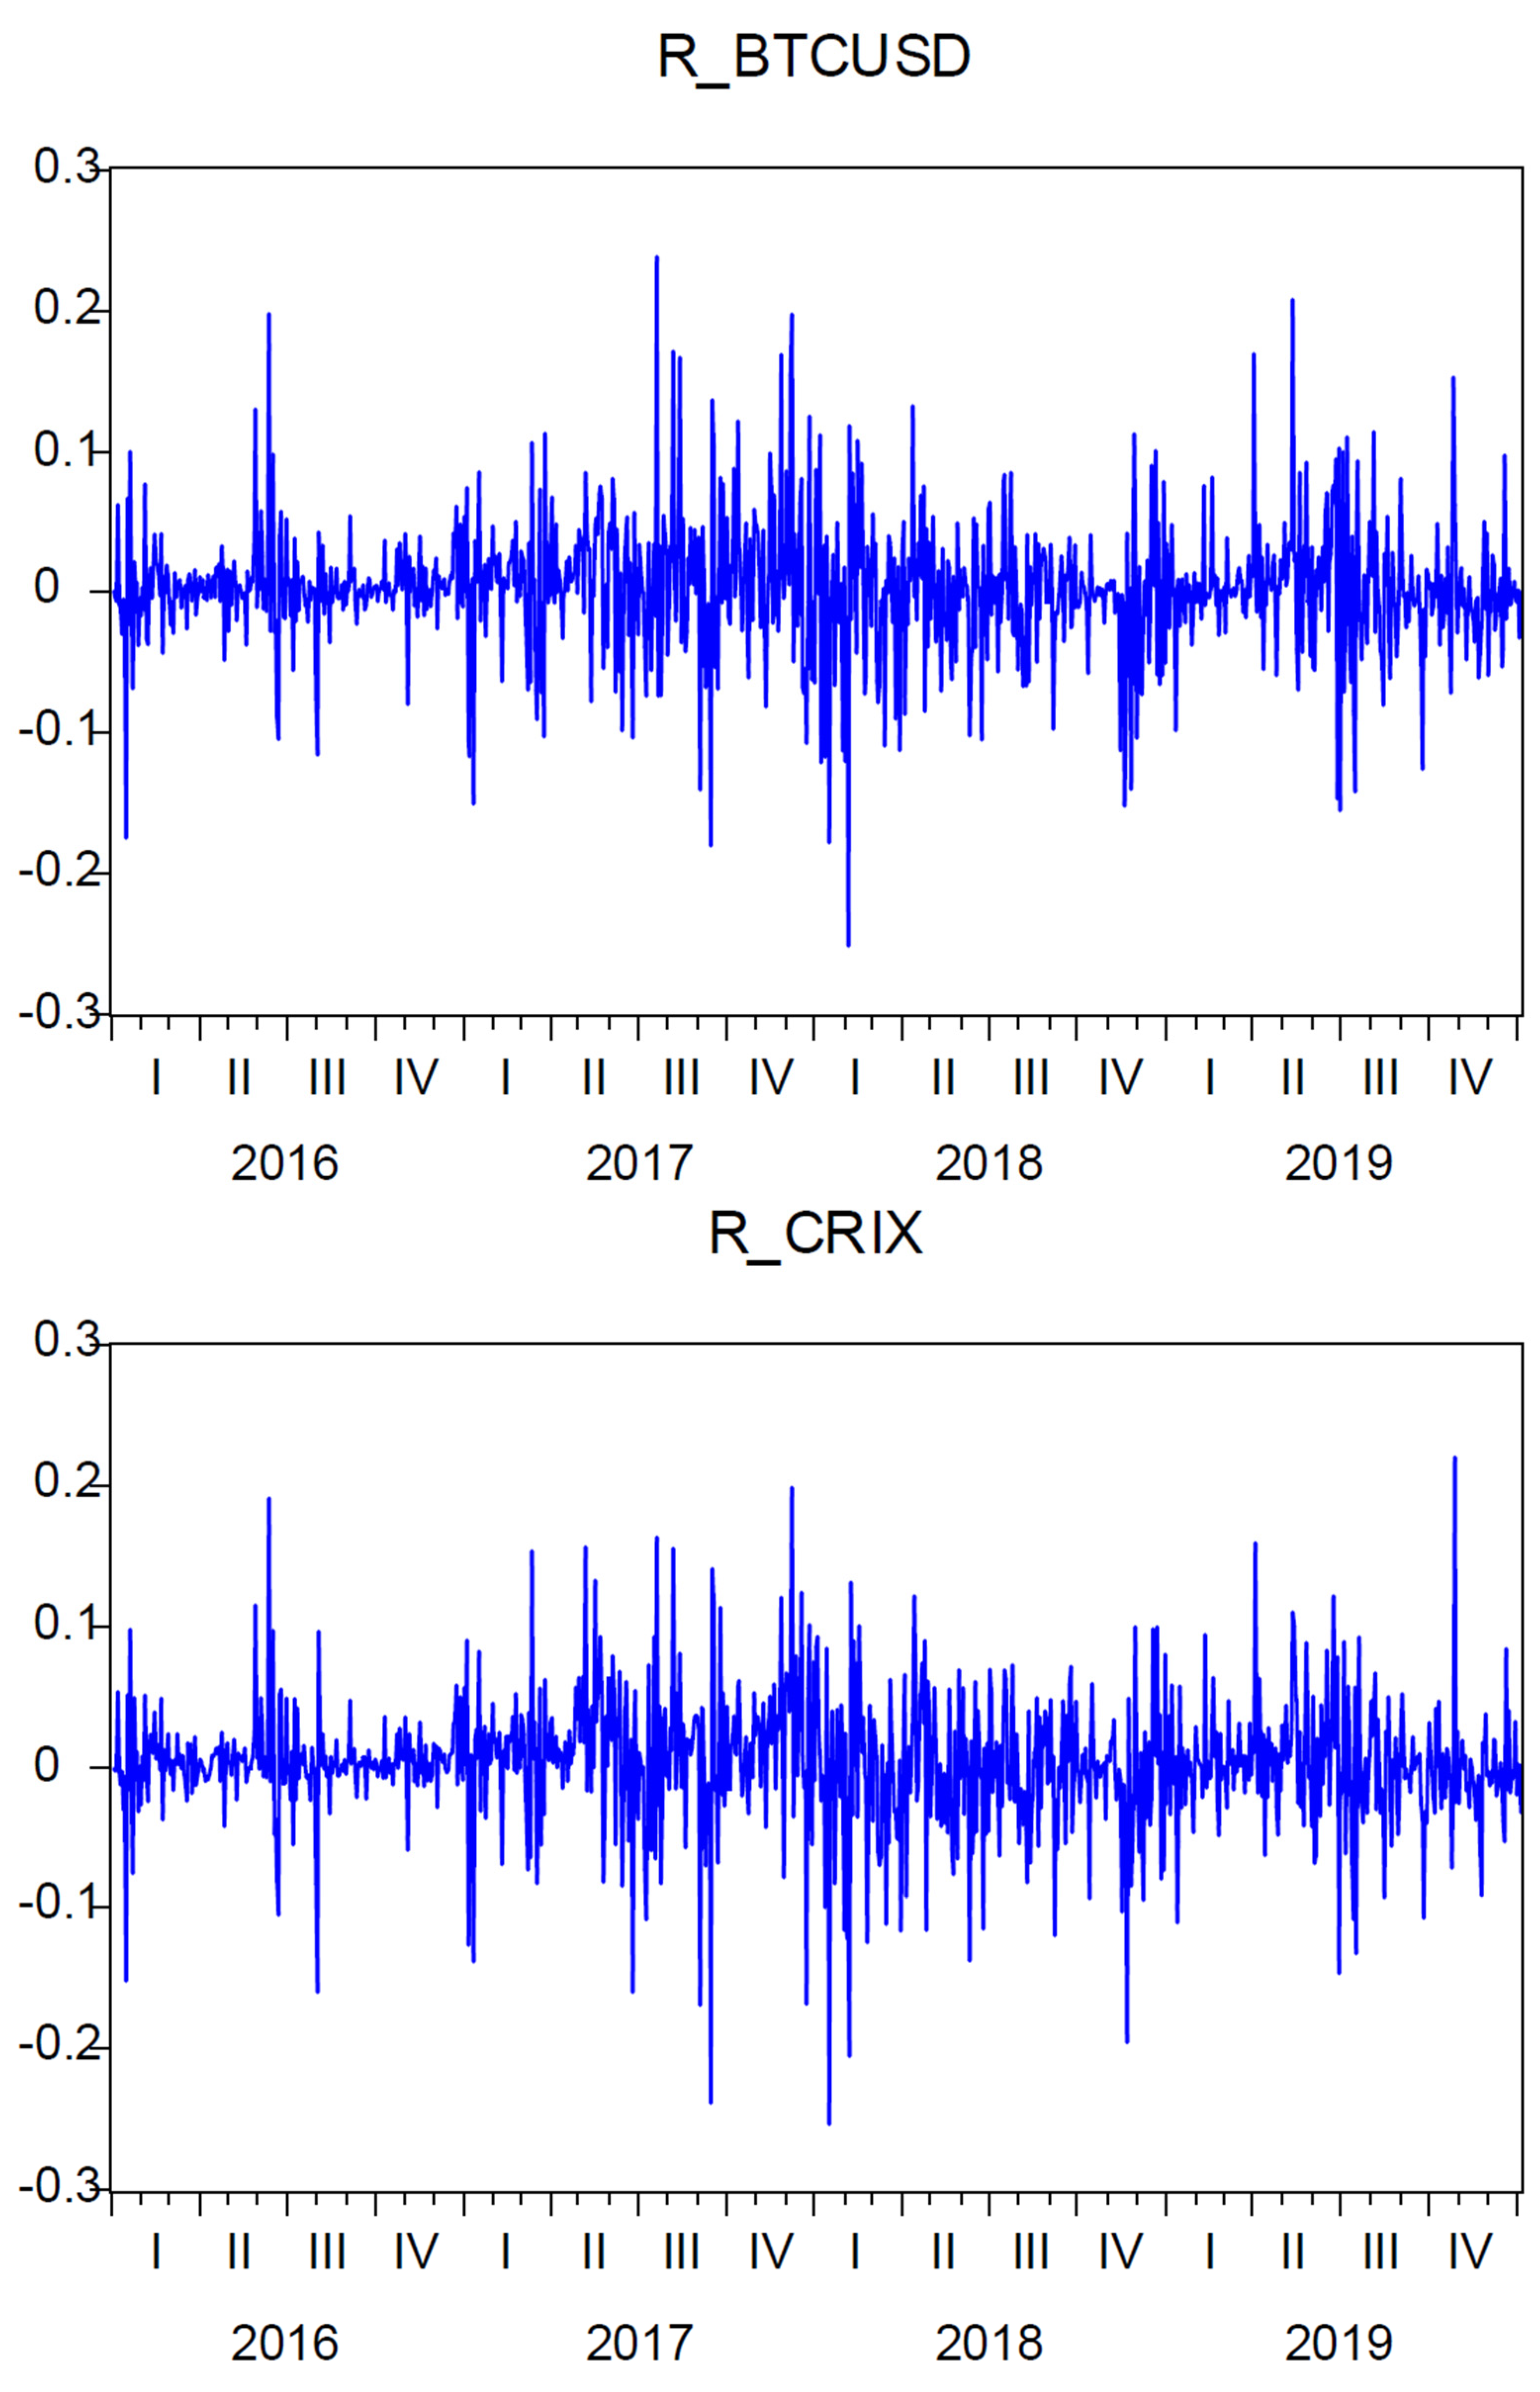
Figure 1. Line-graphs: BTCUSD and CRIX.
Jrfm 13 00121 g001
Figure 2. Histograms: BTCUSD and CRIX.
Jrfm 13 00121 g002
Figure 3. BTCUSD European put option prices.
Jrfm 13 00121 g003
Figure 4. BTCUSD GARCH(1,1) Volatility indices.
Jrfm 13 00121 g004
Figure 5. CRIX GARCH(1,1) Volatility indices.
Jrfm 13 00121 g005
Figure 6. BTCUSD GARCH(1,1) Term structure.
Jrfm 13 00121 g006
Figure 7. CRIX GARCH(1,1) Volatility indices.
Jrfm 13 00121 g007
Figure 8. 30-Day GARCH(1,1) Volatility Indices.
Jrfm 13 00121 g008
Table 1. Summary of important studies.
StudyTopic
Hansen and Lunde (2005)GARCH(1,1) model
Duan (1995)GARCH option pricing
Meddahi and Renault (2004)SR-SARV processes
Hao and Zhang (2013)GARCH implied volatility index
Trimborn and Härdle (2018)The CRIX
Chu et al. (2017)GARCH Modelling of cryptocurrencies
Hafner (2020)GARCH Modelling of cryptocurrencies and CRIX
Table 2. Descriptive statistics (Log-returns).
BTCUSDCRIX
Mean0.00270.0029
Median0.00260.0032
Maximum0.23840.2203
Minimum−0.2514−0.2533
Standard Deviation0.0460.0461
Skewness0.0046−0.3903
Kurtosis7.13367.3798
Jarque–Bera743.2889860.9537
Observations10441044
Table 3. GARCH(1,1) calibrated parameters.
BTCUSD
ω 2.6 × 10 5
α 0.1149
β 0.8837
λ 0.1116
AIC−6.1810
Table 4. BTCUSD European put option prices.
Market PriceGARCH PriceDifference% Difference
583.665589.966.2951.0670%
853.5850.65−2.85−0.3350%
1164.41163.1−1.3−0.1118%
1532.4951519.59−12.905−0.8492%
1925.681911.84−13.84−0.7239%
23732332.64−40.36−1.7302%
2812.992773.88−39.11−1.4099%
3273.5053229.46−44.045−1.3639%
4200.4154170.21−30.205−0.7243%
5185.9855134.92−51.065−0.9945%
6185.6956112.5−73.195−1.1975%
7150.0457096.55−53.495−0.7538%
8141.3158084.57−56.745−0.7019%
9134.059074.67−59.38−0.6543%
14,115.32514,038.73−76.595−0.5456%
19,106.8719,009.72−97.15−0.5111%
24,098.4123,981.97−116.44−0.4855%
29,089.9528,954.7−135.25−0.4671%
34,082.95533,927.67−155.285−0.4577%
Table 5. GARCH(1,1) calibrated parameters.
BTCUSDCRIX
ω 0.00010.0001
α 0.10350.1504
β 0.86500.8203
λ 0.07440.0880
AIC−6.9982−6.9909