Article

The Rich Get Richer and the Poor Get Poorer: Social Media and the Post-IPO Behavior of Investors in Biotechnology Firms: The Relationship with Twitter Volume

Faculty of Business Administration, Haifa Campus Port Gate Building, Ono Academic College, HaNamal 32, Haifa 3303201, Israel
J. Risk Financial Manag. 2021, 14(10), 456; https://doi.org/10.3390/jrfm14100456
Submission received: 19 July 2021 / Revised: 5 September 2021 / Accepted: 16 September 2021 / Published: 23 September 2021
(This article belongs to the Section Financial Markets)

Abstract

:
This paper analyzes stock returns for biotechnology firms after initial public offering (IPO) and explores the effect of social media—specifically, Twitter—on these returns. The results indicate positive yet insignificant cumulative average abnormal returns (CAARs) of 1.97% in the first 25 days post-IPO and a decline of tens of percentage points over the following three years. However, after dividing the sample firms into two subsamples according to size, either under or over USD 500 million in market value, the overall results change dramatically. Firms with a market value lower than USD 500 million yield negative CAARs immediately following the IPO; however, this negative CAAR becomes significant only from day 50 onward. Firms with a market value over USD 500 million yield positive CAARs immediately following the IPO, which become significant from day 50, remaining so throughout the following year. These findings can be attributed to the limited duration of investors’ attention, which increases until the end of quiet period and, with small-sized firms, diminishes during the post-IPO years. An examination of Twitter activity and share returns demonstrates a robust correlation between the two, suggesting that investors’ attention to firms may be reflected in their Twitter usage.
JEL Classification:
D8 (Information, Knowledge, and Uncertainty); G11 (Portfolio Choice, Investment Decisions); G14 (Information and Market Efficiency, Event Studies); G17 (Financial Forecasting and Simulation)

1. Introduction

The pharmaceutical industry develops, produces, and markets drugs to be used as medications. Its revenues and capitalization render it one of the world’s top five industries, with total annual revenues worldwide of USD 1.25 trillion in 2019 and USD 1.27 trillion in 2020 (statista.com accessed on 17 August 2021) (Statista 2021). Most of these revenues are generated by multinational pharmaceutical giants that have dominated the industry for decades. Almost 50% of these revenues are generated in the United States. A “new world” of biotechnology companies started to emerge a decade ago as technology became less expensive, enabling some companies to develop even as few as a single drug. While biotechnology projects’ risk tends to decrease with each stage in the product development cycle, the absolute capital requirements increase over the years of product development. Consequently, obtaining financing is critical.
The Jumpstart Our Business Startups (JOBS) Act, enacted in the United States in April 2012, was designed to help revitalize the IPO market by providing a series of regulatory, accounting, and disclosure concessions for Emerging Growth Companies (EGC). EGCs are characterized by annual gross revenues of less than USD 1 billion over the year prior to the IPO. Dambra et al. (2015) documented a 25% increase in new IPOs annually in the two years following the enactment of the law, compared to the two years preceding its enactment. In addition, offerings of EGC and non-ECG firms increased by 53% and 10%, respectively, following the enactment of the law. Of these, pharmaceutical and biopharmaceutical companies experienced the greatest increase in activity, as they were more likely than other EGCs to take advantage of the act’s risk reduction provisions, which permit firms to file their IPO confidentially while making overtures to qualified institutional buyers. IPOs, in addition to increasing a firm’s equity, significantly increase its exposure to the public as well as to other biotechnology companies, in this case. This exposure was leveraged well in the years 2013–2020, when biotechnology companies raised significant additional financing of over USD 100 million through acquisitions and alliances. One hundred forty-six companies raised USD 85.9 billion in pre-IPO deals, 133 companies raised USD 113.2 billion in post-IPO deals, and 40 companies were acquired for a total amount of USD 83.8 billion (Edwards 2021).
The contribution of this paper is twofold. First, the focus on the biotechnology sector, which, despite enjoying revenues making it one of the world’s leading market sectors, has received relatively scant academic attention. Second, I analyze the relationship between stock returns and investors’ attention as reflected in the volume of discourse on Twitter.
Numerous studies have attempted to explore variables that could potentially influence stock prices following an IPO. Some of these have examined the issue of media coverage, including press releases and other coverage initiated by the firm, as well as publications and material originating outside the firm. However, very few studies have investigated the relationship between social media usage and post-IPO stock returns. To address this gap in the literature, this paper focuses on the relationship between Twitter usage, specifically, and post-IPO returns. It is widely acknowledged that the decision-making process of participants in financial markets is not always rational and can be influenced by factors other than measurable risk and return, such as investors’ often visceral perceptions of a firm’s quality. One of the channels for shaping investors’ perceptions is publishing posts about a firm through social media channels, from online message boards to Facebook and Twitter. I chose to focus on Twitter because of its increasing popularity and because tweets are characterized by spontaneous, unstructured, informal, and very short texts. In a world where the amount of information bombarding people seems almost endless, firms’ competition for investors’ attention has become fiercer than ever. I was therefore interested in exploring how the mere volume of tweets, without any potentially controversial evaluation of their content, influences major capital market variables following an IPO.
This paper focus on the “new world” of biotechnology firms that issued IPOs between 2013 and 2019, following the enactment of the JOBS Act. The first part of the paper examines how the JOBS Act influenced investors’ activity during the three years following IPOs, as reflected in the cumulative average abnormal return (CAAR) for the stock’s price. The second part of this paper investigates the relationship between the volume of text messages posted on Twitter—“tweets”—and stock returns. The rest of the paper is organized as follows. Section 2 reviews the relevant studies. Section 3 analyzes the behavior of CAAR post-IPO. Section 4 analyzes the relationship between stock price behavior and the volume of tweets. Section 5 contains discussion and conclusions.

2. Literature Review

2.1. IPOs and Long-Term Stock Performance

While there have been numerous studies of many diverse issues involving IPOs, the literature most closely related to this study has focused on the performance of stocks issued in the United States for up to three years following IPOs and factors that may potentially affect the performance of these stocks. Jain and Kini (1994) investigated firms that issued an IPO between 1976 and 1988 and found a significant decline in operating performance for up to three years after the offering. They also found a significant positive relationship between post-IPO operating performance and equity retention by the founding entrepreneur. Analyzing companies that went public between 1970 and 1990, Loughran and Ritter (1995) reported that these stocks yielded an average of 8.4% for the three years post-IPO, compared to 35% for comparable non-IPO firms. In a seminal paper, Ritter and Welch (2002) investigated the long-term performance of IPOs issued between 1980 and 2001 and found a negative three-year average market-adjusted return of −23.4%. Gao et al. (2006), looking at firms that had issued an IPO between 1980 and 2000, documented a negative excess return over that of the NASDAQ of −38.48% for the three years following the IPO. Their findings suggest that a wider divergence of opinion in the IPO market leads to greater long-term underperformance.
With respect to countries other than the United States, Goergen et al. (2009) studied the long-term performance in UK IPOs between 1991 and 1995 and found a negative adjusted return of −19.94% for the three years post-IPO, with small firms suffering from worse long-term performance than large ones. The percentage of equity issued and the degree of a firm’s multinationalism are key predictors of its performance after the IPO. Berk and Peterle’s (2015) analysis of IPOs in central and eastern Europe between 2000 and 2009 revealed three years of underperformance of post-IPO stocks of between −14% and −31%, depending on the benchmark used. Like Goergen et al. (2009), they found that smaller IPOs exhibit greater long-term underperformance than do their larger counterparts. Shimizu and Takei (2016) examined IPOs’ stock behavior during 2004 to 2011 at three different stock exchange markets in Japan. For two of the three exchanges, the CAAR was not statistically significant for the three years post-IPO; in the third exchange, CAAR was −30.08% at month 36 post-IPO. The findings of Boubaker et al. (2020), who investigated the underperformance of 402 French firms that went public during the period from 1998 to 2011, suggest that excess control (the difference between control rights and cash flow rights) is negatively associated with long-term performance because it increases the likelihood that controlling shareholders will extract the private benefits of control, to the detriment of minority shareholders. Kumar and Sahoo (2021), analyzing the Indian market IPOs from 2009 to 2014, reported a negative average CAAR of −41.05% in the 36 months post-IPO.
Evidence regarding the importance of innovations in the pharmaceutical industry was examined by Chen and Xu (2015), who found that firms with a higher level of pre-IPO innovation have a higher buy-and-hold abnormal return for the 24 and 36 months after the IPO. Guo and Zhou (2016), studying the post-IPO performance of 151 biotechnology IPO firms from 1991 to 2012, found that innovation capability is critical to contemporaneous stock performance and long-term firm survival. Biotechnology IPO firms are more likely to succeed in the long term if they can expand the scale of their research undertakings and make progress in these research activities.
Komenkul and Kiranand (2017) investigated 76 healthcare and biopharmaceutical IPOs in ASEAN (Association of Southeast Asian Nations) countries between 1986 and 2014 and found positive and significant CAAR of 5.57% for the 36 months after the IPO. Malaysia and Singapore present the highest and lowest CAARs of 57.25% and −39.4%, respectively. Thakor et al. (2017) tracked pharma firms from 1930 to 2015, finding that from 1930 to 2015, the pharma industry outperformed the market with 3% per year. However, the biotechnology sector, which emerged in the 1980s, underperformed the market by 5% per year in the years 1980–2015. Indeed, Thakor et al. (2017) confirm that almost all biotechnology companies are loss-making enterprises.

2.2. Media and (Post-IPO) Stock Performance

According to Merton (1987), the most common way to boost investors’ awareness is to promote the visibility of the firm through the media. Shiller (2015), who found that abundant media coverage draws investors’ attention to these stocks, observed:
“The role of the news media in the stock market is not, as commonly believed, simply as a convenient tool for investors who are reacting directly to the economically significant news itself. The media actively shape public attention and categories of thought, and they create the environment within which the stock market events we see are played out”.
This leads to a positive feedback effect, in which big returns are followed by more big returns as a result of increased media coverage. By contrast, Fang and Peress (2009), found that a portfolio of stocks not covered by the media outperformed a portfolio of stocks with high media coverage by 3% per year following the portfolio’s formation. In their view, the “no media premium” may stem from limitations on trading or may serve as compensation for little or lack of information. Bhattacharya et al. (2009) explored the role of the media in the internet IPO bubble between 1996 and 2000, finding that media coverage was much more intense for internet IPOs. There were more total news items, both positive and negative, for internet IPOs than for a matching sample of non-internet IPOs. The effect on daily abnormal returns, which was lower for internet IPOs, especially during the bubble period, indicates that the market largely discounted the media hype. Siev (2014) documented that firms publishing a low number of press releases (PRs) enjoy higher returns than those publishing a high number of PRs. Firms that enjoy a high level of public attention due to a much higher volume of annual PRs get noticed more, which leads to overpricing, which can ultimately yield lower returns.
In addition to the information generated by the firms and the press, as discussed in the previous section, firm-related information is also disseminated using online social media. One of the earliest studies focusing on internet stock message boards was conducted by Wysocki (1998), who found that firms whose stocks received the highest volume of posted messages were characterized by extreme returns, high market value, and high trading volume. An increase in overnight message postings led to a positive abnormal return on the following day. Studies on the online social networks effect, such as that of Antweiler and Frank (2004), determined that when many messages were posted on a given day, there was a negative return on the next day. Das and Chen (2007) found a negative correlation between changes in the number of messages and changes in contemporaneous stock prices. Gilbert and Karahalios (2010), using over 20 million posts from the LiveJournal website, created an index of the national mood in the United States. When this index rose sharply, the S&P 500 Index ended that same day marginally lower than had been expected. According to Chen et al. (2014), the views expressed in articles and commentaries posted on a popular social media outlet predicted future stock returns for a period of three months after their publication.
The few studies that have investigated the relationship between Twitter tweets and stock returns have dealt mainly with investor sentiment and not with the volume of tweets per se. Zhang et al. (2011) analyzed a sample of tweets for six months to measure collective fear and hope. Examining whether these collective emotions correlated with major stock indices in the U.S. market, the authors found that “emotional tweet percentage significantly negatively correlated with Dow Jones, NASDAQ and S&P 500, but displayed significant positive correlation to VIX.”1 Forbergskog and Blom (2014) demonstrated that the positive and negative sentiment extracted from tweets could predict both positive and negative S&P 500 returns the following day. Similarly, Sul et al. (2014) showed that sentiment polarities extracted from tweets positively correlated with intraday returns of the S&P 500, and Twitter users with more followers had greater influence on the returns.
Even fewer studies have analyzed the relationship between tweets and IPOs. Liew and Wang (2016) documented a contemporaneous positive correlation between IPOs’ tweet sentiment and stock returns on an IPO’s first trading day. In addition, they found that tweet sentiment in the days preceding the IPO could predict the IPO’s first day stock returns, from opening price to closing price. Gregori et al. (2020) analyzed tweets in the three months prior to each IPO of a sample of 412 U.S. firms issuing IPOs between 2010 and 2016. The results showed that the more favorable the sentiment, the closer the offer price was set to the maximum achievable, to the benefit of the issuer. In contrast, negative sentiments seemed to have no effect on the pricing, supporting the proposition that investors are net buyers of attention-grabbing news. The number of tweets also appeared to have no effect on pricing. Kwan (2015) found that higher Twitter volume on the first trading day of an IPO is correlated with higher first day returns, but he did not find a significant predictive relationship between the volume of tweets and IPO performance.

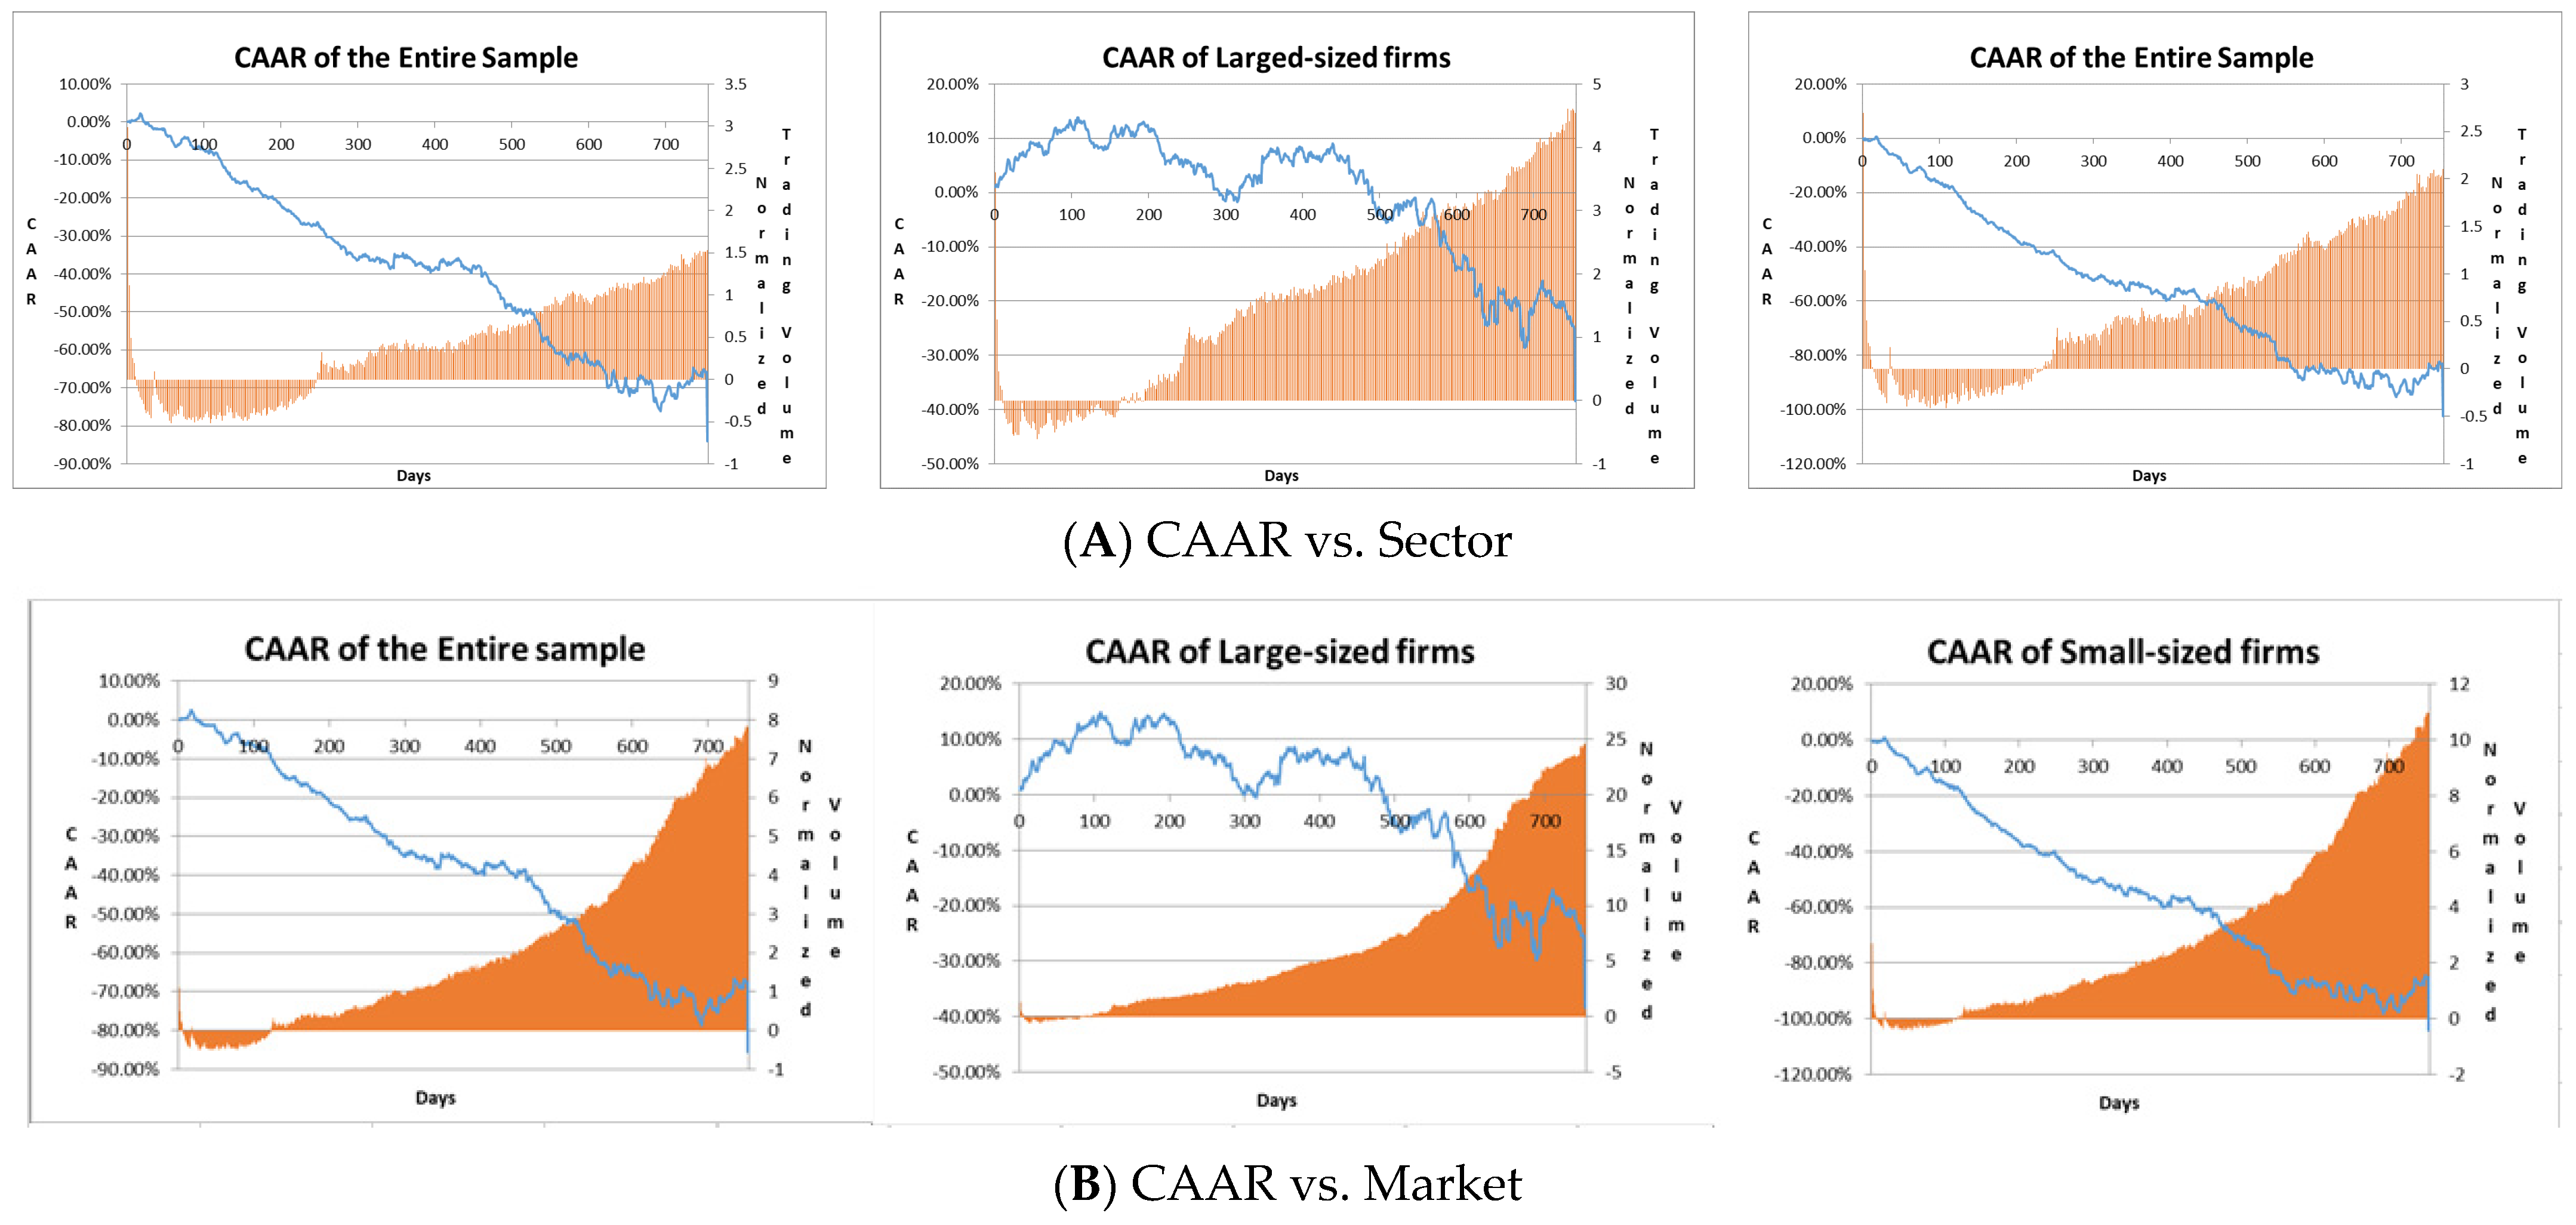
3. Stock Behavior Post-IPO

3.1. Research Goals and Hypotheses

In the first 25 days after an IPO is priced and opens for trading, underwriters and their affiliated analysts are not allowed to publish any research about the company. Consequently, the stock trades as an “uncovered” stock for this period. The end of this quiet period is important because the simultaneous launching of coverage by several underwriters after the 25th day can have a significant impact on the stock price. The duration of this period has changed over the years, and the SEC recently shortened it to 10 days following the IPO. However, most investment banks still observe the 25-day rule, so outside coverage generally commences 25 days after the first day of the IPO pricing. My goal was to investigate CAAR behavior from the IPO date to the end of the quiet period and thereafter. I expected to see an upward trend in CAAR during the quiet period and a downward trend after it ended. An increase in CAAR was expected due to the natural excitement immediately following the IPO. The later downward trend can be explained, in part, by the publishing of numerous reports about the company and future forecasts by affiliated analysts.
Biotechnology drug development is a long and expensive process. Hundreds of millions of dollars are needed to develop a biotechnological drug, and the chances that a product developed in the laboratory will successfully complete animal and human experiments and ultimately reach the market are one in ten thousand. Naturally, large-sized firms are likely to have more experience, greater available resources, and a larger, more diverse product portfolio. These factors are likely to enhance a large firm’s potential for future success, as well as attract greater attention from investors. Accordingly, I posit that larger firms will perform better than smaller ones. (See also Goergen et al. (2009) and Berk and Peterle (2015)). I therefore divided the sample into two subsamples according to firm size, expecting to observe better performance among large-sized firms. I formulated the following hypotheses to reflect these expectations.
Hypothesis 1 (H1).
Quiet Period: Stock returns through the end of the quiet period.
The natural excitement from the new IPO will yield a positive CAAR from the IPO date until the end of the quiet period.
Hypothesis 2 (H2).
Quiet Period: Stock returns after the end of the quiet period.
As coverage by underwriters and their affiliated analysts commences at the end of the quiet period, and as the initial excitement diminishes, the stock will yield a negative CAAR.
Hypothesis 3 (H3).
Stock returns and market capitalization.
Large-sized firms are likely to perform better than small-sized firms due to their higher potential for future success and their greater share of investor attention.

3.2. Data and Method

The initial database consisted of all biotechnology companies that issued IPOs in the period from January 2013 to December 2019. The data were extracted from the EvaluatePharma database and NASDAQ website and included 434 companies.2 I focused on companies traded in the United States, thus excluding firms traded on non-U.S. stock exchanges. Firms that became private or were merged into or acquired by others during the time from the IPO until three years following the IPO were also excluded. The final database consisted of 367 firms. Table 1 displays the number of IPOs per year in the final database.3
A prominent feature of the firms in the sample is their relatively low market capitalization,4 as displayed in Table 2. The average market value is USD 556 million, and the median market value is USD 297 million. The years 2018 and 2019 are characterized by higher average market values than 2013–2017: USD 708 million and USD 461 million, respectively, due to two extreme values.5 It appears that biotechnology companies have taken good advantage of the JOBS Act, which enables ECG companies to issue shares to the public. Overall, the average size of biotechnology firms in this sample is very small in terms of the average issue size, measuring about 27% of the average size of all firms that issued IPOs in those years. According to Ritter (2020), the average size of firms issuing IPOs during the years from 2013 to 2019 was USD 2024 million, and the median was USD 1202 million, compared to USD 556 million and USD 297 million, respectively, in this sample (Table 2).
The event study approach (Binder 1998) was employed to examine market reaction to IPO events. The actual date of the IPO was marked as t = 0, and the daily stock prices extracted from the NASDAQ website and Yahoo Finance were applied for the period t = 0 … 755 (three years after the IPO) to calculate daily logarithmic returns. I chose a logarithmic simple gross return calculation because of the continuous accumulation feature of Ln, where the cumulative return is the sum of the periodic returns. Two return benchmarks were utilized: the IXJ Healthcare Index and the S&P 500 Market Index. The abnormal return (AR) was calculated for each stock by subtracting the benchmark returns from the stock return. The cumulative average return (CAR) was calculated for each stock by totaling the ARs from day 0 to day t, and the CAAR was calculated by taking the average of CAR each day relative to the IPO date. As no stock prices exist prior to the IPO, conditional return using the market model was not calculated. I calculated the CAAR for the entire sample, and, in addition, I divided the database into two subsamples of small and large firms and calculated the CAAR for each of the subsamples. The average rounded market value of USD 500 million was chosen as a threshold to differentiate between small-sized and large-sized firms. Given that the MV series is not normally distributed, it could be argued that using the median as a separation value between small and large firms is meaningful as using the average. I chose a number close to the average, assuming that a market value of USD 500 million was more valid as a natural separator between small-sized and large-sized firms. Normalized trading volumes were computed as a proxy for market attention. For each firm in the sample, I recorded the natural logarithm of the daily trading volume throughout the period t = 0 … 755 and normalized each observation by subtracting the mean and dividing by the standard deviation calculated over the period. I then calculated the average across all firms for each day relative to the IPO date.

3.3. Results

The CAAR results for selected time periods during the three years post-IPO are presented in Table 3. The CAAR results are shown using two return benchmarks, and they were calculated for the entire sample and the subsamples of small-sized firms and large-sized firms with market capitalization of up to USD 500 million (68% of the sample) and higher than USD 500 million (32% of the sample), respectively. Figure 1 graphically illustrates the results of Table 3 and the normalized trading volumes over the three-year post-IPO period. As the CAAR results relative to the two benchmarks are similar, reference will be made only to the sector index benchmark.
As shown in Table 3, the CAAR for the first 17 trading days post-IPO (equivalent to 25 calendar days) for the entire sample reaches a positive peak of 2.35% (t = 0.47). While these results are consistent with the substance of Hypothesis 1, due to their insignificance, I reject Hypothesis 1. After 17 trading days, performance begins to decrease, with CAAR = 0.06% (t = 0.01) for the 23rd trading day, fifty trading days post-IPO, CAAR = −2.70% (t = −0.52). One hundred trading days post-IPO, CAAR = −7.10% (t = −1.54); 250 trading days post-IPO, CAAR = −26.74% (t = −5.71); two years (550 trading days) post-IPO, CAAR = −58.61% (t = −11.92); and three years (755 trading days) post-IPO, CAAR = −84.08% (t = −19.00). The results demonstrate a CAAR decline that is consistent from the end of the quiet period, trading day 17, onward. These results are consistent with the previous literature and support Hypothesis 2.
With respect to small-sized firms, the CAAR exhibits declines from the very beginning, and these declines become significant from day 50 onward with CAAR = −8.22% (t = −1.65); 100 trading days post IPO, CAAR was −16.51%, (t = −3.64); one-year post-IPO, CAAR = −40.56% (t = −8.46) and −83.62% (t = −16.24) 550 trading days post -IPO. However, the results for large-sized firms reveal a completely different pattern. CAAR is positive from the very beginning of the post-IPO period yet gains significance from day 46 onward, with CAAR = 9.08%, (t = 1.84); after 100 trading days, CAAR = 12.91% (t = 3.14). One year after the IPO, CAAR = 6.00% (t = 1.58) and three years post-IPO, CAAR = −38.45% (t = −11.55). The CAAR reaches its peak of 13.83% (t = 3.47) 108 days after the IPO and begins to decline from that point until it reaches zero, 485 days post IPO. Therefore, it can be concluded that investors’ post-IPO activity differs significantly depending on the firm’s size. Small-sized firms exhibited a negative CAAR in the first year after the IPO, while large firms exhibited a positive CAAR in the first year after the IPO. These findings support hypothesis H3 and are consistent with Goergen et al. (2009) and Berk and Peterle (2015).
To validate the firm value of USD 500 million as the separator between small-sized firms (“poor”) and large-sized firms (“rich”), I repeated the CAAR calculation for a large-sized firm subsample using USD 100 million, 200 million, 300 million, and 400 million as separator values. The results presented in Appendix A support the choice of USD 500 million as the separator value, indicating that for values smaller than USD 500 million, the positive CAAR is either not significant or does not last beyond the first 100 days after the IPO. In terms of trading volumes, the day of the IPO was characterized by the highest trading volume during the entire three-year post-IPO period. On the second trading day, trading volumes decreased substantially and, from that point on, trading volumes showed an increasing growth trend over time for both small and large firms (Figure 1).
I will turn now to examine the level of activity on the Twitter social media platform before and after the IPO and its relationship to stock returns. In addition, based on the results above, I will consider the relationship between firm size and the volume of tweets, analyzing, inter alia, whether firms use social media as a tool to promote a successful IPO.

4. Tweets and IPO Returns

In considering the volume of tweets as a reflection of the level of attention a firm has attracted, the volume of tweets has been weighted relative to the tweet volumes of other firms. As a result, even a low tweet volume can be noticeable in an environment where comparable firms have a lower volume of tweets or no tweets at all, thereby creating an impact, perhaps even similar to that of a firm with very high tweet volumes in an environment of high tweet volumes. Therefore, the mere number of tweets itself is often meaningless; the number becomes more meaningful only when compared with other firms in the same sector. For that reason, firms with tweet volumes above and below the median for each year relative to the IPO have been grouped as High Twitter Volume (HTV) and Low Twitter Volume (LTV), respectively.

4.1. Research Goals and Hypotheses

My goal was to analyze the correlation and possible causality between the annual volume of tweets about a firm and that firm’s main capital market variables. The expectation was that a positive relationship would be found, so that large-sized firms, high trading volumes, and high returns would increase investor interest, which would be reflected in a higher volume of tweets, and, conversely, that higher volumes of tweets would draw investors’ attention, which would be reflected in higher market activity.6 In addition, I expected to find causality between the annual volume of tweets about a firm and that firm’s stock returns, so that a high volume of tweets in a given period would have a positive impact on returns in the ensuing period.
I formulated the following hypotheses to reflect these expectations:
Hypothesis 4 (H4).
Correlation: There is a positive correlation between Twitter volume and capital market variables: risk, returns, trading volume, and market capitalization.
Hypothesis 5 (H5).
Causality: a: There is positive causality between the annual volume of tweets about a firm and its annual stock returns. b: There is positive causality between the volume of tweets a firm receives in periods of less than one year, one week, two weeks, and one month prior to the IPO and returns in corresponding periods post-IPO.

4.2. Data and Method

For each firm in the sample, I downloaded related tweets using Python programing,7 starting from one calendar year preceding the IPO day and up to three calendar years after the IPO. I extracted all tweets containing: full company name, $ + ticker, and the company’s twitter username if there was one, such as @chimerix for Chimerix. Next, I excluded all unrelated tweets in which the company name appeared in a non-company context, such as “Adam Kadmon” for Kadmon. The Twitter database consisted of daily tweets for each company and contained over 1.5 million tweets. Table 4 displays descriptive statistics regarding the annual volume of tweets. The actual date of the IPO was marked as t = 0. I designated the pre-IPO days −250 to −1 as IPO year − 1, post-IPO days 0 to 250 as IPO year, post-IPO days 251 to 501 as IPO year + 1, and post-IPO days 502 to 755 as IPO year + 2.
Two main findings emerged, as presented in Table 4. First, the average annual volume of tweets increased over the years, from 359 during the year preceding the IPO through 2237 tweets during the IPO year, and up to 3558 tweets two years after the IPO. The second notable observation is the huge variance in the annual volume of tweets among the firms. For example, in Adverum Biotechnologies’ IPO year, it had zero tweets, while Juno Therapeutics had over 26,000 related tweets in its IPO year. The growing number of annual tweets reflects both the growth in Twitter’s popularity and the increased interest in the firms over time.
To explore the relationship between the volume of tweets and capital market variables, I employed both univariate and multivariate analyses. In the univariate analysis, I calculated several capital market variables for each firm in the database and compared the average of these variables between the LTV and HTV groups. The compared variables were Return (t), the rate of return on a firm’s stock at period t; Trading volume (t), a firm’s daily average trading volume at period t; Std. Dev. (t), the standard deviation of daily returns calculated over the period and used as a proxy for total risk; and beta, as a proxy for systematic risk coefficients. For the IPO year, beta was estimated using market model regression on both indexes based on the first 50 trading days after the IPO. For IPO year + 1 and IPO year + 2, beta was estimated using daily returns in a 255 trading days’ time window ending ten trading days before the beginning of that year. Market value (t) was calculated as the number of shares outstanding as of December 31 of that year multiplied by the stock price of that day.
While there are many variables that can be used to explain stock returns, my goal was to shed light on the relationship between returns and contemporaneous tweet volumes. This goal guided the choice of the explanatory variables in the multivariate section. The multivariate analysis employs two sets of ordinary least squares (OLS) linear regressions to analyze the contemporaneous relation between the annual volume of tweets and the annual returns and abnormal returns. The regression equations were:
R e t u r n ( I P O y e a r + t ) = β 0 + β 1 R m ( I P O y e a r + t ) + β 2 H T V ( I P O y e a r + t ) + β 3 Y 2013 + + β 6 Y 2016 + β 7 N M V ( I P O y e a r + t )
A b n o r m a l   R e t u r n ( I P O y e a r + t ) = β 0 + β 1 B e t a + β 2 H T V ( I P O y e a r + t ) + β 3 Y 2013 + + β 6 Y 2016 + β 7 N M V ( I P O y e a r + t )
  0 t 2
Explained variables were returns and abnormal returns. The abnormal return was calculated relative to two benchmarks: The S&P 500 Index and the IXJ index. Explanatory variables are Rm market return for the S&P 500 and IXJ index; Beta as described above; HTV as a dummy variable that receives 1 for companies with a high volume of tweets and 0 otherwise. The dummy variables for IPO years 2013 to 2016 are Y2013 to Y2016, which are aimed at capturing potential influence during a given year. Normalized Market Value (NMV) was calculated for each firm for each year relative to the IPO date by subtracting the firm’s average market value from a firm’s value and dividing by standard deviations of the firm’s market value.8 Additional multivariate analyses employing causality tests will be detailed later.

4.3. Results

4.3.1. Univariate Analysis

Table 5 presents descriptive statistics for some capital market variables for the years following the IPO. Panel A presents the IPO year, Panel B presents IPO year + 1, Panel C presents IPO year + 2, and Panel D presents the absolute volume of tweets for small-sized and large-sized firms.
The univariate analysis indicates that firms enjoying a high volume of tweets (HTV) are larger, with higher trading volumes, volatility, and stock returns. For example, differences in returns reached: 7% (p-value = 0.08) in the IPO year, 51% (p-value = 0.001) in the following year, and 29% (p-value = 0.04) in the IPO year + 2. Trading volumes for the HTV firms were 2.7 to 2.8 times higher than for the LTV firms, and the average market value was 1.7 to 2.0 times higher for the HTV firms. As presented in Panel D, large-sized firms were also characterized by a higher volume of tweets in the year before the IPO and in the IPO year. These results support hypothesis H4.

4.3.2. Multivariate Analysis

Considering the positive correlation found between annual tweet volumes and stocks return in the univariate analysis, regressions were conducted as set forth in Equations (1) and (2). The regression results are displayed in Table 6. Panel (A) (B) displays the results for the return (Abnormal Return) as the dependent variable. Due to the high correlation coefficient of 0.27 between tweet volumes and the control variable normalized market value, I repeated the regressions without NMV as an explanatory variable (model 2).9 The regression results are presented relative to the sector index due to similarities between results using the two selected benchmarks.
The contemporaneous correlation between tweet volumes and returns found in the univariate analysis was also apparent in the multivariate analysis, indicating that the difference in returns between HTV and LTV firms is tens of percentage points every year in favor of HTV firms. The HTV coefficient is 0.3 (p = 0.04) for the IPO year (Panel A, model 2), 0.47 (t = 0.00) for the year IPO + 1, and 0.47 (p = 0.01) for the year IPO + 2. Regarding AR (Panel B model 2), the results are similar; HTV firms have a higher AR of 0.18 (p = 0.07) in the IPO year, 0.27 (t = 0.03) in the IPO year + 1, and 0.50 (p = 0.01) in the IPO year + 2. Normalized market value is positively correlated with returns and abnormal returns in the first two years. For example: 0.22 (p = 0.00) in the IPO year (Panel A, model 1), 0.26 (p = 0.00) in the IPO year + 1, and 0.03 (p = 0.74) in the IPO + 2 year. The Rm variable proves to be significant in the first two years but loses its significance in the third one.
I now turn to an examination of the causality between tweet volumes and returns. Three sets of regressions were conducted. First, I examined whether tweet volumes in a certain year affected stock returns in the following year. Specifically, the following regressions were conducted:
R e t u r n ( I P O y e a r + t )   o r   A b n o r m a l   R e t u r n ( I P O y e a r + t ) = β 0 + β 1 R m + β 2 H T V ( I P O y e a r + t 1 ) + β 3 Y 2013 + + β 6 Y 2016 + β 7 N M V ( I P O y e a r + t )
A b n o r m a l   R e t u r n ( I P O y e a r + t ) = β 0 + β 1 B e t a + β 2 H T V ( I P O y e a r + t 1 ) + β 3 Y 2013 + + β 6 Y 2016 + β 7 N M V ( I P O y e a r + t )
0 t 2
Despite the expectation of finding a causality link between tweet volumes and returns, no such link was uncovered in the various regressions conducted. Considering these results, a third set of regressions was employed to analyze whether high or low tweet volumes one week, two weeks, or one month before the IPO affected returns one week, two weeks, or one-month after the IPO. Here, too, no causality was found. I suggest that the absence of causality may stem from the relatively long periods of time under examination. It may be that the effect of tweets is myopic or fleeting in nature and affects time periods of hours or days only, as was shown by Forbergskog and Blom (2014), Sul et al. (2014), Zhang et al. (2011), and Kwan (2015).

5. Discussion and Conclusions

During the last few decades, the psychological aspects of decision-making have been successfully integrated into economic modeling, augmenting the descriptive power of the traditional normative approach based on rational expectations. As part of this trend, countless study results have documented individuals’ cognitive limitations.
This paper contributes to this line of work in several aspects. First, it focuses on the post-IPO period of “new world” biotechnology firms. Most of these are small-sized firms developing as few as a single drug. Therefore, investors’ attention has an enormous influence on these companies’ share prices. The tendency of share prices to collapse after IPOs has been widely recognized for years (see Loughran and Ritter (1995) and Ritter and Welch (2002)). However, only a small portion of the studies have focused on the biotechnology sector, despite this sector being ranked as one of the world’s leading in terms of revenues. Second, small-sized firms’ behavior was investigated after the change in regulations associated with the passage of the JOBS Act in 2012, which has dramatically altered investors’ approach to these kinds of small-sized firms, resulting in these firms receiving more attention from capital markets. Third, it was found that USD 500 million is the necessary minimal market value for firms seeking to perform a successful IPO. I suggest that firms with smaller market values are perceived as having a less likelihood of survival, which leads to share underperformance in the years following the IPO. Fourth, this study sheds light on the behavior of market participants for whom a prominent presence on social media, as reflected in high tweet volumes, contributes to the firm’s perceived quality. This perception of higher quality leads to image bias and boosts financial trading activity and stock pricing, which in turn affect the stock rates of return in the contemporaneous year.
This study documents the behavior of stock price CAARs following IPOS by innovative biotechnology firms. The overall picture of stock performance after IPOs indicates that firms receive short-term attention immediately after the IPO, with a positive yet insignificant CAAR, which peaks close to the end of the quiet period 25 days after the IPO. This increase in CAAR is followed by a consistent and long-term decline of tens of percentage points in the following three years. These results reflect a market inefficiency in its weak form, providing yet another example of individuals’ cognitive limitations. These findings also indicate that the changes engendered by the 2012 JOBS Act have not actually changed long-term negative post-IPO CAAR, a result found in similar studies (see Loughran and Ritter (1995) and Ritter and Welch (2002)) conducted before the enactment of the Act.
Unexpected results emerged when analyzing investors’ activity according to firm size. In the sample, small-sized firms had negative CAAR, while large-sized firms enjoyed positive CAAR in the post-IPO years. I suggest that this dramatic difference in results experienced by small-sized and large-sized firms can be attributed to the ability of the firms to meet the investor expectations of a desirable growth rate in revenues and profits. Large companies, which are likely to rely on a broad product line, find it easier to meet or exceed market expectations in that regard, as shown by their positive yet volatile CAAR in the years following the IPO (Table 3, Panels A and B). For the perceived value of innovations, see Cao et al. (2015) and Guo and Zhou (2016). It appears that the large-size firms’ return volatility reflects close monitoring of the market investors’ response to the results of trials and companies’ adherence to drug development timelines. Small-sized firms rely on one or a few products. Any delay in development or experimental failure makes it difficult for these small firms to meet investors’ expectations regarding desirable revenue and profit growth rates. Failing to meet these expectations can lead to a negative CAAR. This make-or-break situation for small-sized firms may affect the optimal timing for an IPO. This study shows that examining IPOs in terms of the firms’ maturity is critical to the success of the issue. Consequently, a value of USD 500 million may be viewed as a threshold for biotechnology firms seeking to proceed with an IPO. I observe that small-sized firms are overpriced at the IPO stage, while large-sized firms are underpriced. This finding is of great importance to firms seeking to raise money via capital markets.
Failure to meet market expectations, as explained above, results in limited investor attention. This is also reflected in significantly lower tweet volumes for small-sized firms. These findings are consistent with those of Barber and Odean (2007), who measured indirect investor attention using three observable measures that are likely to be associated with attention-grabbing events: media, unusual trading volume, and extreme returns. These findings are also consistent with the hypotheses that larger and higher yield companies will attract more investor attention, as reflected in the Twitter discourse volume, and that companies attracting more investor attention are larger and enjoy higher yields.
I suggest that the high volume of discourse contributes to investors’ awareness of the company. The ongoing exposure on Twitter increases the brand prominence of the firm, which increases investor confidence in its reliability and prosperity. The higher perceived quality of the firm that results from this leads to a higher volume of share purchases at a higher price. These purchases prove to be justified due to the continued difference in returns in favor of the HTV firms. To conclude, the findings have implications about investors’ limited span of attention regarding small-sized firms, which quickly become “off-the-radar” stocks. The relatively long timeframes examined in this study may constitute a limitation. Further research is needed to examine causation for shorter time periods. I assume an IPO ignites a period of investor attention, which rises until the end of quiet period, and then investors’ attention to small size firms diminishes at the post IPO years as they seek their next speculative opportunity. Despite the enormous under-performance of small firms, issuing an IPO increases their exposure and, therefore, as suggested by Zingales (1995), Mello and Parsons (1998), and Dambra et al. (2015), an IPO can be the first step towards a future sale of the business. This seems particularly relevant to small biotechnology firms whose acquisition by an established, asset-rich firm is likely to be the best option to support the drug development process until its successful completion.

Funding

This research did not receive any specific grant from funding agencies in the public, commercial, or not-for-profit sectors.

Conflicts of Interest

The author declares no conflict of interest.

Appendix A

Table A1. CAAR for “large-sized” firms using different separation market values.
Market Value AboveUSD 100 MillionUSD 200 MillionUSD 300 MillionUSD 400 MillionUSD 500 Million
Days Relative to EventCAARt-Stat.CAARt-Stat.CAARt-Stat.CAARt-Stat.CAARt-Stat.
1 to 101.70%0.313.15%0.583.10%0.562.59%0.472.54%0.46
1 to 204.25%0.886.16%1.375.76%1.285.50%1.185.69%1.21
1 to 503.08%0.626.01%1.229.99%2.079.48%1.949.60%1.88
1 to 1001.16%0.254.87%1.1010.23%2.329.38%2.1113.78%3.25
1 to 150−5.75%−1.30−1.49%−0.355.42%1.274.27%0.9910.20%2.47
1 to 200−9.59%−2.08−3.24%−0.735.33%1.245.29%1.2113.88%3.55
1 to 250−15.43%−3.31−7.14%−1.670.44%0.10−1.61%−0.377.81%2.03
1 to 375−27.48%−5.85−15.69%−3.49−3.00%−0.67−3.03%−0.666.26%1.54
1 to 550−48.65%−9.76−38.58%−7.71−19.47%−3.99−11.8%−2.83−5.62%−1.51
1 to 755−77.80%−17.7−68.63%−14.9−46.55%−13.20−37.4%−11.7−38.46%−11.39
Note: this table present large-sized firm CAAR results, when using USD 100, 200, 300, and 400 million as a separating value between small-sized and large-sized firms.

Notes

1
VIX is a popular measure of the stock market’s expectation of volatility implied by S&P 500 index options. It is calculated and disseminated on a real-time basis by the Chicago Board Options Exchange (CBOE), and is commonly referred to as the fear index or the fear gauge (Wikipedia).
2
EvaluatePharma database is one of the leading global pharma databases: http://www.evaluate.com/ (accessed on 22 September 2017).
3
A detailed list of the companies can be provided upon request.
4
Market capitalization for December of the IPO year was calculated by multiplying the number of shares appearing in the firms’ profit and loss statements by the stock prices on that day. The results were confirmed with the values appearing on the stockraw.com website.
5
The companies’ market capitalization series is not normally distributed, as evidenced by Jarque-Bera Test results.
6
One of the research goals was to explore whether firms that had an active tweeting policy had an advantage over these that did not, with respect to returns. Surprisingly, firms’ activity on Twitter was non-existent or very low. For example, in the IPO year, only 15 out of 182 companies used Twitter and were responsible for less than 0.6% of the total number of tweets. This low participation rate within the total number of tweets rendered this analysis meaningless.
7
Due to the limitations of using Twitter API, I performed this analysis only for the years 2013–2017.
8
Market capitalization is calculated for December 31 of each year relative to the IPO date.
9
Despite the relative simplicity of the regression models offered, they are well specified, as was proven by heteroscedasticity tests.

References

  1. Antweiler, Werner, and Murray Z. Frank. 2004. Is all that talk just noise? The information content of internet stock message boards. The Journal of Finance 59: 1259–94. [Google Scholar] [CrossRef]
  2. Barber, Brad M., and Terrance Odean. 2007. All that glitters: The effect of attention and news on the buying behavior of individual and institutional investors. The Review of Financial Studies 21: 785–818. [Google Scholar] [CrossRef] [Green Version]
  3. Berk, Ales S., and Polona Peterle. 2015. Initial and long-run IPO returns in Central and Eastern Europe. Emerging Markets Finance and Trade 51: S42–S60. [Google Scholar] [CrossRef]
  4. Bhattacharya, Utpal, Neal Galpin, Rina Ray, and Xiaoyun Yu. 2009. The role of the media in the internet IPO bubble. Journal of Financial and Quantitative Analysis 44: 657–82. [Google Scholar] [CrossRef] [Green Version]
  5. Binder, John. 1998. The event study methodology since 1969. Review of Quantitative Finance and Accounting 11: 111–37. [Google Scholar] [CrossRef]
  6. Boubaker, Sabri, Alexis Cellier, Riadh Manita, and Narjess Toumi. 2020. Ownership structure and long-run performance of French IPO firms. Management International 24: 135–52. [Google Scholar] [CrossRef]
  7. Cao, Jerry, Fuwei Jiang, and Jay R. Ritter. 2015. Patents, Innovation, and Performance of Venture Capital-Backed IPOs. Available online: http://dx.doi.org/10.2139/ssrn.2364668 (accessed on 20 August 2021).
  8. Chen, Chao, and Haoping Xu. 2015. The Roles of Innovation Input and Outcome in IPO Pricing—Evidence from the Bio-Pharmaceutical Industry in China. Working Paper. Shanghai: Fudan University. [Google Scholar]
  9. Chen, Hailiang, Prabuddha De, Yu Jeffrey Hu, and Byoung-Hyoun Hwang. 2014. Wisdom of crowds: The value of stock opinions transmitted through social media. The Review of Financial Studies 27: 1367–403. [Google Scholar] [CrossRef]
  10. Dambra, Michael, Laura Casares Field, and Matthew T. Gustafson. 2015. The JOBS Act and IPO volume: Evidence that disclosure costs affect the IPO decision. Journal of Financial Economics 116: 121–43. [Google Scholar] [CrossRef]
  11. Das, Sanjiv R., and Mike Y. Chen. 2007. Yahoo! for Amazon: Sentiment extraction from small talk on the web. Management Science 53: 1375–88. [Google Scholar] [CrossRef] [Green Version]
  12. Edwards, Mark. 2021. The Indomitable Biotech IPO Window—What’s Keeping it Open? Les Nouvelles-Journal of the Licensing Executives Society 56: 54–58. [Google Scholar]
  13. Fang, Lily, and Joel Peress. 2009. Media coverage and the cross-section of stock returns. The Journal of Finance 64: 2023–52. [Google Scholar] [CrossRef]
  14. Forbergskog, Jens-Otto, and Christer Ryland Blom. 2014. Twitter and Stock Returns. Master’s thesis, BI Norwegian Business School Oslo, Oslo, Norway. [Google Scholar]
  15. Gao, Yan, Connie X. Mao, and Rui Zhong. 2006. Divergence of opinion and long-term performance of initial public offerings. Journal of Financial Research 29: 113–29. [Google Scholar] [CrossRef]
  16. Gilbert, Eric, and Karrie Karahalios. 2010. Widespread Worry and the Stock Market. Paper presented at Fourth International AAAI Conference on Weblogs and Social Media, Washington, DC, USA, May 23–26; pp. 59–65. [Google Scholar]
  17. Goergen, Marc, Arif Khurshed, and Luc Renneboog. 2009. Why are the French so different from the Germans? Underpricing of IPOs on the Euro New Markets. International Review of Law and Economics 29: 260–71. [Google Scholar] [CrossRef] [Green Version]
  18. Gregori, Gian Luca, Luca Marinelli, Camilla Mazzoli, and Sabrina Severini. 2020. The social side of IPOs: Twitter sentiment and investors’ attention in the IPO primary market. African Journal of Business Management 14: 529–39. [Google Scholar]
  19. Guo, Re-Jin, and Nan Zhou. 2016. Innovation capability and post-IPO performance. Review of Quantitative Finance and Accounting 46: 335–57. [Google Scholar] [CrossRef]
  20. Jain, Bharat A., and Omesh Kini. 1994. The post-issue operating performance of IPO firms. The Journal of Finance 49: 1699–726. [Google Scholar] [CrossRef]
  21. Komenkul, Kulabutr, and Santi Kiranand. 2017. Aftermarket Performance of Health Care and Biopharmaceutical IPOs: Evidence from ASEAN Countries. INQUIRY: The Journal of Health Care Organization, Provision, and Financing 54: 0046958017727105. [Google Scholar] [CrossRef] [Green Version]
  22. Kumar, Abhishek, and Seshadev Sahoo. 2021. Do anchor investors affect long run performance? Evidence from Indian IPO markets. Pacific Accounting Review 33: 322–46. [Google Scholar] [CrossRef]
  23. Kwan, Tammy. 2015. Twitter Volume and First Day IPO Performance. New York: The Leonard Glucksman Institute for Research in Securities Markets, Stern School of Business. [Google Scholar]
  24. Liew, Jim Kyung-Soo, and Garrett Zhengyuan Wang. 2016. Twitter sentiment and IPO performance: A cross-sectional examination. The Journal of Portfolio Management 42: 129–35. [Google Scholar] [CrossRef]
  25. Loughran, Tim, and Jay R. Ritter. 1995. The new issues puzzle. The Journal of Finance 50: 23–51. [Google Scholar] [CrossRef]
  26. Mello, Antonio S., and John E. Parsons. 1998. Going public and the ownership structure of the firm. Journal of Financial Economics 49: 79–109. [Google Scholar] [CrossRef]
  27. Merton, Robert C. 1987. A simple model of capital market equilibrium with incomplete information. The Journal of Finance 42: 483–510. [Google Scholar] [CrossRef]
  28. Ritter, Jay R. 2020. IPO Statistics for 2020 and Earlier Years. Available online: https://site.warrington.ufl.edu/ritter/ipo-data/ (accessed on 20 August 2021).
  29. Ritter, Jay R., and Ivo Welch. 2002. A review of IPO activity, pricing, and allocations. The Journal of Finance 57: 1795–828. [Google Scholar] [CrossRef] [Green Version]
  30. Shiller, Robert J. 2015. Six. The News Media. In Irrational Exuberance. Princeton: Princeton University Press, pp. 101–22. [Google Scholar]
  31. Shimizu, Yoshiki, and Hideki Takei. 2016. Examining the Existence of Long-run Initial Public Offering (IPO) Underperformance at Three Different Stock Exchange Markets in Japan. Business Management and Strategy 7: 190–206. [Google Scholar] [CrossRef]
  32. Siev, Smadar. 2014. The PR Premium. Journal of Behavioral Finance 15: 43–55. [Google Scholar] [CrossRef]
  33. Statista. 2021. Available online: https://www.statista.com/topics/1764/global-pharmaceutical-industry/ (accessed on 20 August 2021).
  34. Sul, Hongkee, Alan R. Dennis, and Lingyao Ivy Yuan. 2014. Trading on Twitter: The financial information content of emotion in social media. Paper presented at 2014 47th Hawaii International Conference on System Sciences, Waikoloa, HI, USA, January 6–9; pp. 806–15. [Google Scholar]
  35. Thakor, Richard T., Nicholas Anaya, Yuwei Zhang, Christian Vilanilam, Kien Wei Siah, Chi Heem Wong, and Andrew W. Lo. 2017. Just how good an investment is the biopharmaceutical sector? Nature Biotechnology 35: 1149–57. [Google Scholar] [CrossRef] [PubMed]
  36. Wysocki, Peter D. 1998. Cheap Talk on the Web: The Determinants of Postings on Stock Message Boards; University of Michigan Business School. Available online: http://dx.doi.org/10.2139/ssrn.160170 (accessed on 20 August 2021).
  37. Zhang, Xue, Hauke Fuehres, and Peter A. Gloor. 2011. Predicting stock market indicators through twitter “I hope it is not as bad as I fear”. Procedia-Social and Behavioral Sciences 26: 55–62. [Google Scholar] [CrossRef] [Green Version]
  38. Zingales, Luigi. 1995. Insider ownership and the decision to go public. The Review of Economic Studies 62: 425–48. [Google Scholar] [CrossRef]
Figure 1. Post-IPO CAARs, +1 to +755 days. Note: These figures present the daily CAAR from day 1 to day 755 after the IPO. Panel (A) presents the CAAR calculated versus the sector index. Panel (B) displays the CAAR calculated versus the S&P500.
Jrfm 14 00456 g001
Table 1. Number of IPOs per year.
YearTotalBiotech.Biotech. (%)Sample Size
20132485217%30
20143128524%70
20152006427%49
20161283325%29
20172105124%50
20182588232%82
20192666926%57
Total1622403 367
Note: This table presents the number IPOs in the United States during the years of the study, 2013–2019, the number of biotechnology IPOs in these years, and the number of IPOs included in the sample.
Table 2. Descriptive statistics for Market Value (USD millions) as of the end of the IPO year.
20132014201520162017201820192013–2019
Average487405489425499766650556
Median374229287299368337301297
Min.451119191281
Max.2308216523471843268511,528716611,528
Std. Dev.45645257644452116001129964
Count30704929508257367
Note: This table presents descriptive statistics for the market capitalizations of the firms studied.
Table 3. Post-IPO CAARs, +1 to +755 days.
Sector IndexMarket Index
DaysAll SampleLarge FirmsSmall FirmsAll SampleLarge FirmsSmall Firms
CAARt-Stat.CAARt-Stat.CAARt-Stat.CAARt-Stat.CAARt-Stat.CAARt-Stat.
1 to 100.26%0.052.71%0.50−0.66%−0.120.41%0.072.86%0.52−0.80%−0.14
1 to 172.35%0.476.13%1.220.60%0.122.58%0.526.20%1.220.91%0.18
1 to 50−2.70%−0.529.25%1.81−8.22%−1.65−2.20%−0.439.60%1.88−8.54%−1.71
1 to 100−7.10%−1.5412.91%3.14−16.51%−3.64−6.31%−1.3613.78%3.25−16.38%−3.62
1 to 150−16.04%−3.559.07%2.26−26.80%−5.99−15.08%−3.2910.20%2.47−27.70%−6.28
1 to 200−21.46%−4.6212.47%3.28−36.35%−7.77−20.53%−4.3213.88%3.55−37.06%−8.09
1 to 250−26.74%−5.716.00%1.58−40.56%−8.46−25.21%−5.337.81%2.03−41.89%−8.84
1 to 375−36.80%−8.035.96%1.49−55.31%−12.01−36.72%−7.846.26%1.54−55.30%−12.32
1 to 550−58.61%−11.92−4.09%−1.11−83.62%−16.24−60.40%−12.07−5.62%−1.51−81.71%−16.23
1 to 755−84.08%−19.00−38.45%−11.55−104.17%−22.45−85.40%−19.19−38.46%−11.39−102.3%−22.10
Obs.367116251367116251
Note: This table displays the CAAR for the entire sample and the two subsamples of firms with market valuations below USD 500 million (small firms) and above USD 500 million (large firms) as of December of the IPO year. The CAAR is presented for selected time periods relative to the IPO date.
Table 4. Annual Volume of Tweets: Descriptive Statistics.
IPO Year − 1IPO YearIPO Year + 1 IPO Year + 2
Average359223730833558
Median246152423772326
Std. Dev.377269029783976
Min.0019715
Max.203526,12620,02227,579
Tweet Volumes65,349407,067548,815542,232
Observations182182178147
Note: This table presents tweet volumes descriptive statistics for one year before the IPO up to two years after the IPO. Tweets were extracted only for firms that issued IPOs between 2013 and 2017.
Table 5. Capital Market Variables: Descriptive Statistics for HTV and LTV Firms.
Panel A: IPO Year
LTVHTVDiff.p-Value
Market Value (USD million)322.74585.66262.910
Return0.050.120.070.08
Trading Volume94,321267,332173,0110
Return’s Volatility0.050.120.070.14
Beta0.6810.310.03
Observations9191
Panel B: IPO Year + 1
LTVHTVDiff.p-Value
Market Value (USD Million)418.17844.56426.380.001
Return−0.150.360.510.001
Trading Volume162,046441,602279,5560
Return’s Volatility0.0440.0570.0130.001
Beta0.650.870.220.07
Observations8989
Panel C: IPO Year + 2
LTVHTVDiff.p-Value
Market Value (USD million)493.44841.79348.350.017
Return00.290.290.043
Trading Volume244,890660,862415,9730
Return’s Volatility0.040.060.010
Beta0.831.260.430
Observations7572
Panel D: Absolute Tweet Volumes per Firm Size
Absolute Tweet VolumeSmallLargep-Value
IPO Year − 13104740.01
IPO Year206826360.07
IPO Year + 1306331350.43
IPO Year + 2340440010.20
Note: Panels A to C present descriptive statistics of market variables for the sample firms, divided into LTV and HTV firms. The beta shown in this table is estimated using the sector index. Panel D presents absolute annual tweet volumes from one year before the IPO through three years after the IPO.
Table 6. The Effects of Tweet Volumes on Returns and Abnormal Returns (AR): Regression Results.
Panel A: Explaining Returns
IPO YearIPO Year + 1IPO Year + 2
Model 1Model 2Model 1Model 2Model 1Model 2
Intercept1.09 (0.07)1.21 (0.05)−0.14 (0.44)−0.21 (0.26)−0.05 (0.80)−0.05 (0.79)
Year 2013−1.06 (0.05)−1.23 (0.03)0.00 (0.98)0.00 (0.99)−0.55 (0.08)−0.54 (0.08)
Year 2014−1.03 (0.05)−1.23 (0.03)−0.12 (0.61)−0.08 (0.75)−0.03 (0.88)−0.04 (0.85)
Year 2015−1.45 (0.02)−1.61 (0.01)0.03 (0.88)−0.07 (0.71)
Year 2016−1.28 (0.02)−1.49 (0.01)
Rm1.60 (0.20)1.64 (0.20)2.13 (0.05)2.69 (0.02)1.2 (0.37)1.2 (0.36)
NMV0.22 (0.00) 0.26 (0.00) 0.03 (0.74)
HTV0.18 (0.21)0.30 (0.04)0.36 (0.01)0.47 (0.00)0.46 (0.01)0.47 (0.01)
Adjusted R20.190.150.230.160.060.07
F stat (p-val.)7.08 (0.00)6.18 (0.00)9.86 (0.00)7.68 (0.00)2.96 (0.01)3.69 (0.00)
Obs.182182178178147147
Panel B: Explaining AR to Sector
IPO YearIPO Year + 1IPO Year + 2
Model 1Model 2Model 1Model 2Model 1Model 2
Intercept0.20 (0.59)0.31 (0.42)−0.13 (0.38)−0.22 (0.16)0.07 (0.74)0.06 (0.77)
Year 2013−0.18 (0.64)−0.32 (0.42)−0.05 (0.80)−0.05 (0.80)−0.58 (0.02)−0.58 (0.02)
Year 2014−0.08 (0.84)−0.24 (0.53)−0.34 (0.03)−0.37 (0.02)−0.02 (0.91)−0.03 (0.87)
Year 2015−0.69 (0.07)−0.84 (0.03)−0.04 (0.82)−0.16 (0.34)
Year 2016−0.36 (0.35)−0.54 (0.18)
Beta−0.19 (0.00)−0.19 (0.00)−0.03 (0.78)0.07 (0.49)−0.08 (0.52)−0.08 (0.54)
NMV0.18 (0.00) 0.25 (0.00) 0.03 (0.69)
HTV0.08 (0.4)0.18 (0.07)0.19 (0.09)0.27 (0.03)0.49 (0.01)0.50 (0.01)
Adjusted R20.220.170.160.060.040.05
F stat (p-val.)8.43 (0.00)7.06 (0.00)6.55 (0.00)3.14 (0.01)2.25 (0.05)2.79 (0.03)
Obs.182182178178147147
Note: This table displays the results of OLS regressions in which the dependent variables were Return and Abnormal Return. p-values are displayed in parentheses. The Tweet data end on 1 December 2018. Therefore, the observations of firms for which the IPO took place after 1 December 2017 were excluded from the IPO year + 1 and IPO year + 2 analysis, and firms for which the IPO took place after 1 December 2016 were excluded from the IPO year + 2 analysis.
Publisher’s Note: MDPI stays neutral with regard to jurisdictional claims in published maps and institutional affiliations.

