1. Introduction
This long transition period, without a consistent strategy and plan through which the world economy has passed (
Staš et al. 2015), has affected all areas of activity, and the vehicle industry is no exception. According to statistical research (
Tigist and Nicolescu 2018), the number of cars has increased from year to year and the need for vehicle maintenance and repair services has increased in line with this phenomenon.
For several years now, in the vehicle after-sale sector, a decrease in the overall performance has been observed at the national level. The problems and challenges faced by these companies indirectly and implicitly affect customers and employees. These companies are aware that quality repair services led customers to loyalty and redemption, but they nevertheless cannot achieve success if they do not take into account the needs of all stakeholders in the design and delivery of services (
Ling et al. 2016).
In these conditions, in order to determine the elements that lead to the unsatisfactory overall performance of companies within the vehicle after-sale services sector, the purpose of this research is to assess the current state of the implementation of the strategies related to performance management and to identify the main challenges that these organizations are facing. Process management aims to monitor and control the processes defined in an organization (
ISO 9001:2015 2005). Quality management practices, effectively supported by top management, lead to process efficiency (
Nguyen et al. 2018). Performance management may include essential elements and management practices to achieve the set objectives (
Molina-Azorín et al. 2009;
To et al. 2018). Understanding and managing the correlated processes within a management system supports an increase in an organization’s efficiency, effectiveness and resources economy, the final aim being to obtain the desired results (
ISO 9001:2015 2005).
Determining the elements that lead to unsatisfactory overall performance, as well as the main challenges faced by these vehicle after-sale services organizations, is a fundamental strategy, bringing important benefits to the organizations studied in terms of time optimization, cost reduction (
Malevskaia-Malevich et al. 2018) and improvements in general activity (
Medne and Lapina 2019).
The current study carries out the performance evaluation of vehicle after-sale services using data from the six main car brand companies in Romania. More precisely, for each car brand company presented in this study, we consider all their after-sales service divisions in the Bucharest area.
We use a comparative methodology in the research, because this approach is an effective tool for analysis that serves as a starting point for the detailed examination of the similarities and differences between the comparative assessment group and the specific group (
Proksch et al. 2019).
In the first step, the literature and the market are reviewed and a model of the strategies related to performance management is developed. In the second step, after analyzing the products, services and business, the organizations are selected and grouped based on their competence and the conditions in the foreign market. In the third step, based on the types of organizations previously identified, the working hypotheses are set and the questionnaire is prepared and distributed. In the fourth step, the comparative analysis is performed based on the data collected. The fifth step represents discussions of the results and conclusions on the research. The results of the research will serve to formulate recommendations and strategic directions for improving vehicle repair services.
This research has not only theoretical significance but also positive practical significance that will provide vehicle repair services organizations with a good framework to identify the causes underlying business dysfunctions.
The remainder of the paper is organized as follows: presents the literature review, describes the research methodology, presents the data analysis, explains the results and provide comments on the results and conclusions.
2. Literature Review
In recent years, the business performance and sustainability interdisciplinary research has been increasingly expanded (
Mitchell and Jolley 2001). However, the automotive industry and the vehicle after-sale services sector has not been systematically explored yet.
In today’s economy, the business environment is becoming increasingly aware of the need for sustainability management that aims at the simultaneous achievement of social, environmental and economic performance (
EFQM 2020). Performance evaluation is essential for any organization in the automotive industry in managing operations as it provides a way to improve operations for business sustainability.
The outputs of analysis can be used for internal (between activities and processes) or external (between other organizations) benchmarking to show the trends over time (
ISO 9004:2018 2005).
Our research aimed to determine the factors that influence the performance of organizations (
Okolnishkova et al. 2018) and to evaluate the strategies related to performance management used by these organizations by proposing a framework. The study was conducted on a sample of six brands in the automotive industry. The analyzed industry is important both economically and socially and plays an important role in the daily life of the company, employees and customers.
3. Research Methodology
This paper is part of a larger study and is based on the current situation of the vehicle after-sale services sector in the automotive industry, which has reported that its overall performance is below target. These results are reflected in the low level of financial performance and customer and employee satisfaction.
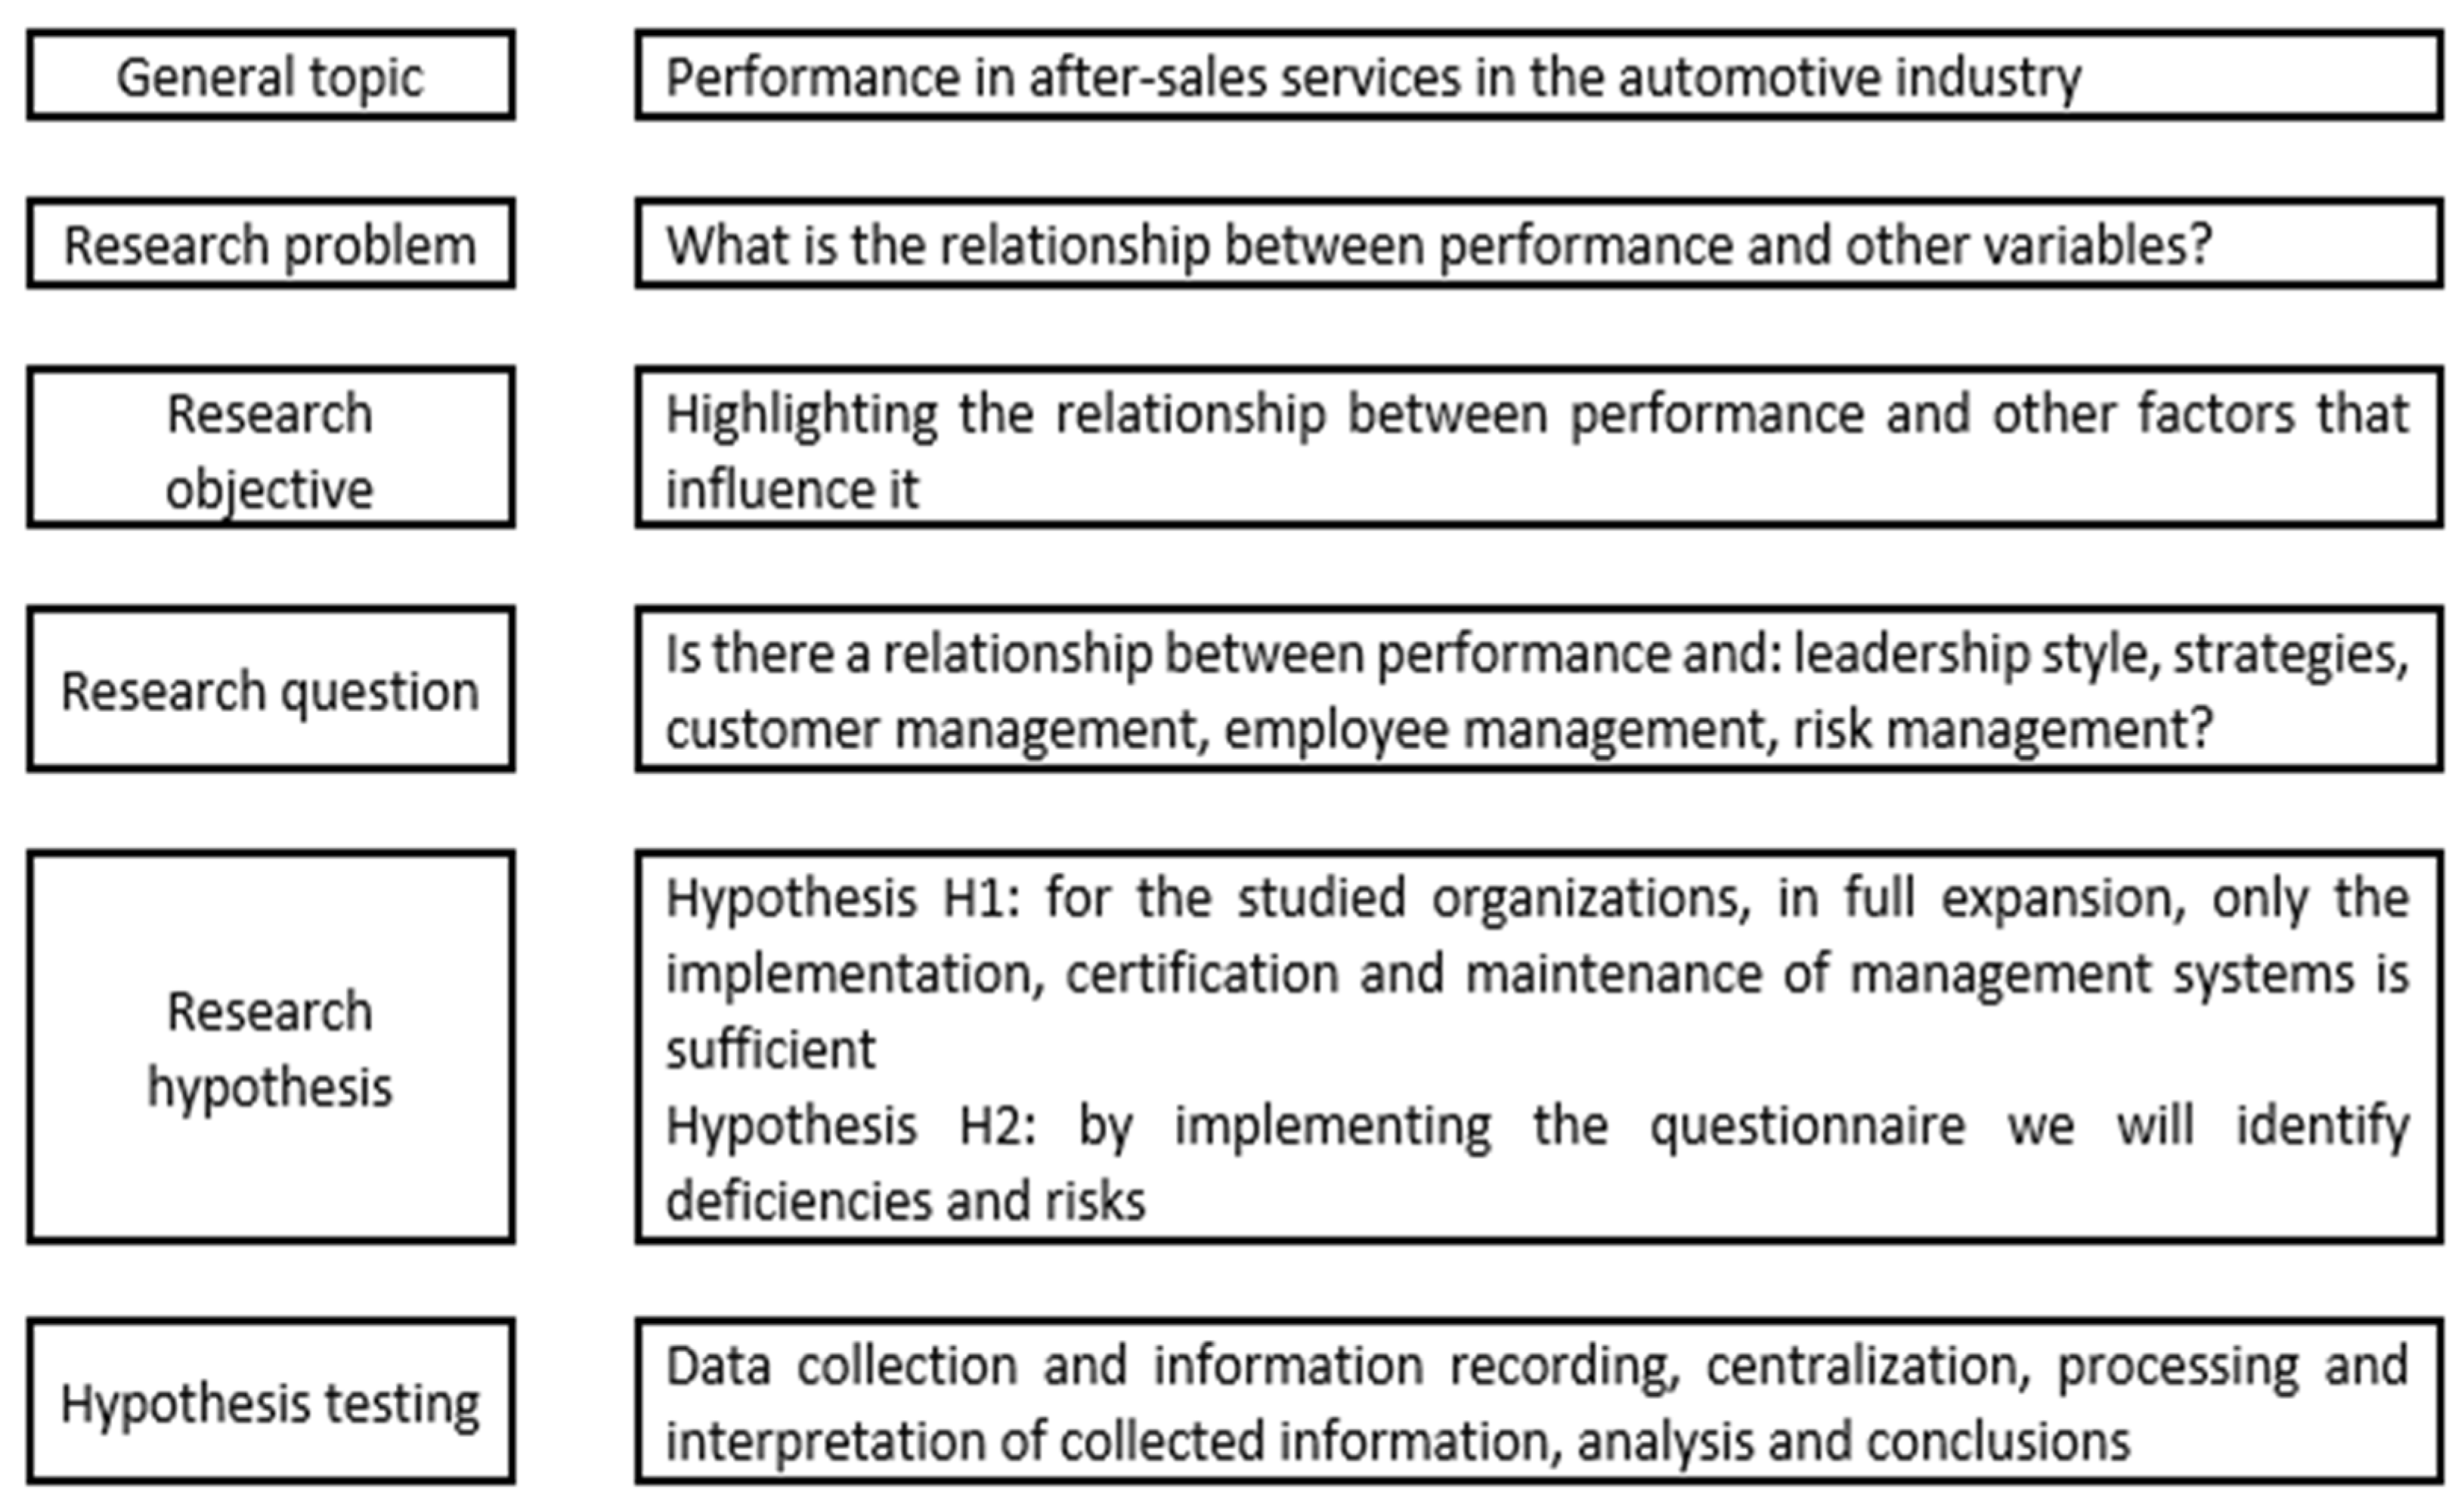
In order to achieve the proposed goal, i.e., the identification of critical factors that affect business performance, several steps were completed (
Jiang and Prabhu 2008;
Mitreva et al. 2019). The specific steps were as follows: establishing the general topic, defining the research problem, setting the research objective, elaborating the question to be answered by the study, formulating the research hypotheses and testing the hypotheses, as shown in
Figure 1.
Documentary research: The analysis of social documents is a method of observation that allows the interrogation of a variety of sources of information. The studied social documents were written (official records) and unwritten (news, information, newspapers, magazines).
Survey: The social survey is a statistical method and involves the collection of information related to stakeholders in order to identify relationships and the statistical distribution of elements of interest. The tool used in this method is the questionnaire.
Given the current stage of the research, the basic tool used was the questionnaire. The reason behind the decision to apply the questionnaires was based on the idea that the information obtained is quantitative and qualitative and that stakeholders can express themselves directly. Moreover, by applying the questionnaires, it was possible to deepen aspects that could not be accessed through other sources.
From a sociological point of view,
Chelcea (
2004) offers a broader definition of the questionnaire as “a technique and, accordingly, an investigative tool consisting of a set of written questions and possibly graphic, orderly and psychological images, which, by being administered by the survey operators or by self-administration, determine the following answers from the respondents to be recorded in writing”.
The questionnaire has advantages over the interview because it is cheap, contains standardized answers and requires little effort from the subjects. According to
Catoiu (
2002), the questionnaire represents “a formalized set of questions, designed to generate the data needed to achieve the objectives of a marketing research”.
The objectives of the questionnaires applied to the vehicle repair service organizations were as follows:
- -
Identifying basic information related to the studied subject;
- -
Highlighting the relationship between performance and other variables;
- -
Verification of the authenticity of the information collected from the studied social documents: financial performance, results, management and organization, other problems faced by the organization.
3.1. Methodology
To achieve the research objectives, this study proposes a framework based on a questionnaire (
Munn and Drever 2004), to help small and medium-sized companies with vehicle after-sale services to grow in order to survive in the competitive environment. The primary analysis of the applied questionnaires was characterized by the following elements:
- -
Information related to the studied problem—identification of the factors that influence the performance of organizations in the automotive sector;
- -
Sampling framework—at the headquarters of the car service organizations in Bucharest;
- -
Target group—managers;
- -
Sample—selection by statistical method based on reasoning—10 organizations, 10 managers;
- -
Time required for designing and testing the questionnaires—January–March 2018.
The questionnaire applied in the organization was prepared on the principle of sectioning and included two sections. The first section contained 36 questions subdivided into 7 sections (S1 to S7), which were further subdivided into 5 criteria (Q1 to Q5) covering the entire field of activity. This first part of the questionnaire contained questions regarding the strategies related to performance management. The second section contained an open-ended question, to which the respondent was allowed to formulate his answer, and focused on the declared problems of the organization.
The second stage in the design of the questionnaire is summarized in
Figure 2.
The questionnaire was structured according to strategies related to performance management, and the links between the analyzed criteria are presented in
Figure 3.
Performance management strategies were as follows: Leadership (S1), Strategies (S2), Management Systems (S3), Customer Management (S4), Human Resources Management (S5), Risk Management (S6) and Results (S7).
Information on the evaluation rules for each section/criterion of questionnaire, as well as related to the awarding of the final score, can be found in
Table 1,
Table 2 and
Table 3.
Based on the study of these factors specific to each brand, the quality policy statements, as well as the data presented above, we could conclude that these organizations had certain general features in common:
Companies were constantly expanding;
They had a local presence and were some of the top brands in the automotive industry;
They had policies regarding the implementation and maintenance of the integrated quality–security–environment management system;
They had a vision, mission and objectives related to the performance, which were well-defined and oriented towards quality, security and the environment; continuous improvement; customers; employees; performance; risk; safety; social responsibility.
3.2. Hypotheses
The established hypotheses represent the core of research and are a powerful tool that guides the entire research. Summing up some definitions given by other authors, the hypothesis represents “a verbal sentence, derived from observations, theories or the results of other research on the relationship between variables” (
Schwab 2005), “which is expressed in the form of a prediction regarding the relationship between the variables investigated” (
Spector 2012;
Wagner 2021) and which “can be tested empirically” (
Liu et al. 2017).
Based on the statements of the cited authors, we can conclude that the hypotheses have the role of presenting concretely what we expect to be achieved in our research.
To validate the structural research model proposed in
Figure 3, as well as to provide answers to the objectives of this research, the following research hypotheses were established:
Hypothesis 1 (H1). For the studied organizations, in full expansion, only the implementation, certification and maintenance of management systems is sufficient.
This hypothesis is related to the first section of the questionnaire, and this contained closed-ended questions, which required information on management and organization.
Hypothesis 2 (H2). By implementing the questionnaire, we will identify deficiencies and risks.
This hypothesis is related to the second section of the questionnaire, which contained an open-ended question: the respondent was asked to describe three issues faced in the service unit. Problems were presented in the order of processing the questionnaires, and, in the case of similar types of problems, a more comprehensive reformulation of the entire set of problems was chosen.
4. Data Analysis
As the present study aimed to determine the factors that influence the performance of vehicle after-sale service organizations, the questionnaires were distributed to selected organizations.
The response rate for the three questionnaires was calculated using the formula:
As can be seen in
Table 4, managers answered in a proportion of 70%. If we look at the total number of potential respondents and the response rate, it can be concluded that the interest expressed by the respondents was high, which shows that the research method of applying face-to-face questionnaires was the most appropriate. This analysis is interpreted graphically in
Figure 4.
The six main car brands that completed the questionnaire are listed in
Table 5. Both competitors and performance management strategies declared by them are listed in
Table 6.
Table 7 presents the analysis of the answers received following the application of the questionnaires. The answers collected regarding the questions related to this hypothesis are lower.
The comparison between the strategies related to performance management and the fulfillment percentages for each strategy are presented in
Table 8.
The answers collected regarding the questions related to this hypothesis are centralized in
Table 9.
5. Results
The results obtained in this research were previously centralized. This section contains the graphical representation of the results and their interpretation.
Figure 5 shows the global scores obtained by each enterprise.
From
Figure 5a, it can be seen that the lowest score was obtained by Competitor 1 and the highest score was obtained by Competitor 5. The fulfillment percentages for the questionnaire related to each competitor were as follows: Competitor 1—64.1%, Competitor 2—84.1%, Competitor 3—78.9%, Competitor 4—82.4%, Competitor 5—95.4% and Competitor 6—81.4%. The global percentage of achievement was 81%.
From
Figure 5b, it can be seen that the lowest score was obtained for the seventh criterion and the highest score was obtained for the third criterion. The fulfillment percentages for each criterion were as follows: Section 1 (Management)—86.7%, Section 2 (Strategies)—81.3%, Section 3 (Management systems)—80%, Section 4 (Customer management)—89.3%, Section 5 (Employee management)—71.3%, Section 6 (Risk management)—89.3% and Section 7 (Performances and results obtained)—69.3%.
Starting from
Figure 5, an in-depth analysis was performed for each competitor in terms of the sections and criteria.
Figure 6 shows the total scores obtained on each section by the enterprises. Comparing the results with the maximum scores that could be obtained (presented in
Table 3), we can see, for each competitor, in which section they obtained the lowest and the highest score.
The lowest scores (weaknesses) obtained were as follows: Competitor 1—S3 (Management Systems), Competitor 2—S5 (Employee management), Competitor 3—S7 (Performances and results obtained), Competitor 4—S2 (Strategies) and S7 (Performances and results obtained), Competitor 5—S7 (Performances and results obtained), Competitor 6—S7 (Performances and results obtained).
The highest scores (strengths) obtained were as follows: Competitor 1—S6 (Risk management), Competitor 2—S6 (Risk management), Competitor 3—S4 (Customer management), Competitor 4—S1 (Management), Competitor 5—S1 (Management), S2 (Strategies), S3 (Management Systems) and S4 (Customer management), Competitor 6—S6 (Risk management).
Figure 7 shows the scores obtained by all competitors.
Figure 7a shows the scores obtained by Competitor 1 in each section. We can see that the lowest score was obtained on S3 (Management Systems) and the highest score was obtained on S6 (Risk management). The fulfillment percentages for the questionnaire related to Competitor 1 were as follows: Section 1 (Management)—76%, Section 2 (Strategies)—72%, Section 3 (Management systems)—28.6%, Section 4 (Customer management)—84%, Section 5 (Employee management)—44%, Section 6 (Risk management)—92% and Section 7 (Performances and results obtained)—52%.
Figure 7b shows the scores obtained by Competitor 2 in each section. We can see that the lowest score was obtained on S5 (Employee management) and the highest score was obtained on S6 (Risk management). The fulfillment percentages for the questionnaire related to Competitor 2 were as follows: Section 1 (Management)—80%, Section 2 (Strategies)—84%, Section 3 (Management systems)—88.6%, Section 4 (Customer management)—84%, Section 5 (Employee management)—76%, Section 6 (Risk management)—92% and Section 7 (Performances and results obtained)—84%.
Figure 7c shows the scores obtained by Competitor 3 in each section. We can see that the lowest score was obtained on S7 (Performances and results obtained) and the highest score was obtained on S4 (Customer management). The fulfillment percentages for the questionnaire related to Competitor 3 were as follows: Section 1 (Management)—84%, Section 2 (Strategies)—80%, Section 3 (Management systems)—88.6%, Section 4 (Customer management)—100%, Section 5 (Employee management)—56%, Section 6 (Risk management)—92% and Section 7 (Performances and results obtained)—52%.
Figure 7d shows the scores obtained by Competitor 4 on each section. We can see that the lowest scores were obtained on S2 (Strategies) and S7 (Performances and results obtained) and the highest score was obtained on S1 (Management). The fulfillment percentages for the questionnaire related to Competitor 4 were as follows: Section 1 (Management)—100%, Section 2 (Strategies)—72%, Section 3 (Management systems)—88.6%, Section 4 (Customer management)—84%, Section 5 (Employee management)—84%, Section 6 (Risk management)—76% and Section 7 (Performances and results obtained)—72%.
Figure 7e shows the scores obtained by Competitor 5 in each section. We can see that the lowest score was obtained on S7 (Performances and results obtained) and the highest score was obtained on S1 (Management). The fulfillment percentages for the questionnaire related to Competitor 5 were as follows: Section 1 (Management)—100%, Section 2 (Strategies)—100%, Section 3 (Management systems)—100%, Section 4 (Customer management)—100%, Section 5 (Employee management)—92%, Section 6 (Risk management)—92% and Section 7 (Performances and results obtained)—84%.
Figure 7f shows the scores obtained by Competitor 6 in each section. We can see that the lowest score was obtained on S7 (Performances and results obtained) and the highest score was obtained on S6 (Risk management). The fulfillment percentages for the questionnaire related to Competitor 6 were as follows: Section 1 (Management)—80%, Section 2 (Strategies)—80%, Section 3 (Management systems)—85.7%, Section 4 (Customer management)—84%, Section 5 (Employee management)—76%, Section 6 (Risk management)—92% and Section 7 (Performances and results obtained)—72%.
Based on the data summarized in
Table 9, the frequency of the main categories of problems faced by the enterprises could be represented. In
Figure 8, they are grouped according to the frequency of occurrence.
6. Comments on the Results: Hypothesis Testing
6.1. Verification of Hypothesis H1
Based on the results reflected above, we find that Hypothesis H1 is not fully verified. More precisely, it is not enough to only implement one or more management systems to achieve excellence.
Additionally, if we consider the extent to which the criteria and sub-criteria of the questionnaire are met, an imbalance is found and there is a decrease in the percentages of fulfillment for several criteria, which will be analyzed in the following. For the quick and correct identification of the questions, they were coded. The coding of the questions contained information related to the question number and the questionnaire to which it belonged, being designed as follows:
*QnMQ—the coding of the questions contains information related to the number of the question and the questionnaire name, where “n” represents the number of the question in the questionnaire addressed to managers (MQ)
The management criteria results are presented in
Figure 9. The percentage of fulfillment was 76.7%. The answers to the Q2MQ and Q3MQ questions are highlighted, where the management supports and motivates its employees and promotes an open dialogue at a percentage of 66.7%, while the answers to the Q4MQ* question show that only 50% of the organizations are known and appreciated for social involvement.
The strategy criteria results are shown in
Figure 10. The fulfillment percentage was 73.3%. The answers to questions Q8MQ and Q9MQ were noted, where a percentage of 33% of managers stated that the policy and strategy were not reviewed periodically and the strategy was not communicated to the organization’s departments. Less than 25% stated that they partially implemented the Q8MQ and Q9MQ criteria.
The category of management systems criteria results is presented in
Figure 11. The fulfillment percentage of the category was 55.6%. The answers to questions Q14MQ and Q15MQ were noted, where 16.7% of managers stated that there was no integrated approach to the improvement of the mechanisms in place, nor did they provide assurances that the integrity of the SMI would be maintained in the event of change. A percentage higher than 27.8% stated that they partially implemented the Q13MQ, Q14MQ and Q15MQ criteria.
The customer management criteria results are presented in
Figure 12. The fulfillment percentage was 76.7%. The answers to the Q16MQ question were noted, where 3.3% of managers claimed that the organization did not develop and maintain long-term partnerships with customers, while a further 20% of managers stated that they partially implemented the Q19MQ and Q20MQ criteria.
The employee management criteria results are presented in
Figure 13. A very important aspect in the analysis of employees’ responses shows a percentage of fulfillment of the category of only 43.3%. Most of the managers, namely 46.7%, stated that they partially implemented the following criteria: setting and evaluating the individual objectives for each employee (Q22MQ); identifying, analyzing and establishing the needs for improving the professional training of employees in order to perform their duties (Q23MQ); carrying out professional development programs (Q24MQ) and establishing indicators for measuring customer satisfaction (Q25MQ).
The risk management criteria results are presented in
Figure 14. The fulfillment percentage of the category among the studied organizations was 87.5%. A further 12.5% of managers claimed that the relevance of the indicators associated with the objectives was partially re-evaluated. A very important aspect in the analysis of the answers was that, in only 16.7% of the organizations, the specific objectives were re-evaluated periodically.
The performance and results obtained are shown in
Figure 15. The fulfillment percentage was 53.3%. Less than 26.6% stated that they partially implemented the following criteria: integration and acceptance of ethnic minorities and disadvantaged people (Q32MQ); development of risk/accident prevention programs for the health of customers/employees (Q33MQ); improving the reputation and image among citizens (Q34MQ) and obtaining results correlated with the set objectives (Q35MQ). A very important aspect for this category was the fact that 20% of organizations did not implement the criteria included in this category.
6.2. Verification of Hypothesis H2
In order to substantiate the answer to this problem, we analyze the results presented in
Table 9.
From the analysis sorted by problem categories, as shown in
Figure 8, it can be seen that a high frequency of occurrence refers to high staff turnover based on their dissatisfaction and negative feedback from customers. With a slightly lower frequency of occurrence, we found insufficient employee involvement, a lack of indicators for employee satisfaction and a lack of synchronization of expenses with receipts. These types of problems were covered by the questionnaire.
Lastly, with a lower percentage of generality, we found a lack of integrated information systems, limited tools to motivate employees, long delays in solving service interventions, a lack of a program for the integration of ethnic minorities and a lack of a program to attract young high school/college graduates. These types of problems were not covered by the questionnaire.
7. Conclusions
The main contribution of this study is the elaboration of the framework for evaluating the strategies related to performance management and identifying the risks and deficiencies that affect the performance of companies that provide vehicle maintenance and repair services.
To determine the factors that influence the performance of vehicle after-sale service organizations, the first step was to identify the research objectives and set working hypotheses. This step was followed by the establishment of the research methods and tools. The research of the subject was carried out through direct observation, as well as documentary research. The questionnaire used as a research tool for data collection was created respecting the guidelines in the literature and allowed the monitoring and direction of the collection process, as well as determining the current level of major concerns related to the development of automotive services. The research conducted allowed us to determine the current level of the major concerns regarding the development of the automotive service activity. Following the examination of the answers received from the respondents, the need for change was outlined.
On one hand, the 81% score of achievement for the questionnaire shows that the vehicle repair services units implement and maintain a quality management system. In order to remain in a stable situation, vehicle repair service units should monitor both internal indicators and indicators in terms of direct competition and should be inspired by competition to solve problems. It is not enough for organizations to implement and certify one, two or more management systems, but it is mandatory that the principles of total quality be assimilated and applied in the organizational culture, an approach on which sustainable excellence is based.
On the other hand, based on the analyzed data in the second part of the questionnaire, it could be identified that there are deficiencies and risks in terms of the organization, operation and management of service units.
The analysis presented in
Figure 8 shows the main categories of problems faced by organizations: high staff turnover based on their dissatisfaction and negative feedback from customers. With a slightly lower frequency, we identified the insufficient involvement of employees, the lack of indicators of employee satisfaction and the lack of synchronization of expenses with receipts.
The application of the questionnaire as a research tool gave managers the opportunity to identify areas in imbalance and where to intervene through changes to increase the quality and performance of their car services.
Based on this analysis, we may conclude that this hypothesis is verified. More precisely, based on the evaluation of the current state of the six car brands, certain deficiencies and risks can be identified regarding the activity of the vehicle services.
Through the questionnaire, two hypotheses were tested, and the results obtained showed that, although there was a high level of fulfillment of the questionnaire, the service units must progress in order to fully assimilate the principles of total quality management. Moreover, based on the analyzed results, it was found that, in order to achieve excellence in vehicle services, it is not enough to only implement two or more management systems.
Finally, our research can provide a guide for managing organizations operating in the vehicle maintenance and repair service sector and can provide a basis for developing a model of the factors that influence the performance of these organizations. The results of this model can be used in order to improve the processes and management and implicitly to increase stakeholder satisfaction. Moreover, another possible future study could provide specified practical guidelines to facilitate the implementation of business performance and sustainability practices to support industry organizations in establishing strategies effectively.
Despite the contributions of this study, there are some limitations that suggest a path for future research. A limitation of the research may be the small sample of companies, with insufficient data to guarantee reliable results. In our future research, we will address these shortcomings. Additional data should be collected to assess the practices used in a more reliable way. As more data are collected, it will be possible to extend the approach to other industries.
Based on the results obtained in this research, we can develop cost recommendations that could be useful for the vehicle maintenance and repair service sector:
- -
For the evaluation of the external condition, the organization should apply at least two evaluation methods and compare the results with those of the competitors;
- -
Comparison with competitors should be a comparison based on several criteria (not only one), with the assignment of a reference value for each indicator;
- -
The indicators should be selected by involving the managers at the level of each department.
The practical approach of collecting data from managers appeared difficult to conduct, but the results revealed, at a certain level, a degree of insufficient rigor in current performance evaluation procedures in service and repair units, a sector with a specific culture in the framework of the automotive industry, dominated by the national context.


 ,
, 


