Abstract
The objective of this paper is to investigate the role of Investor Relations (IR) in the performance of companies listed on the Bucharest Stock Exchange. The study is motivated by the findings in the literature that investor relations may boost information disclosure, analyst following, institutional investor share, liquidity, and business valuation. The current article contributes to the relevant literature by making use of the recently released unique database of VEKTOR scores on company investor relations for 2019 and 2020. The main finding based on regression methodology shows that IR scores have a strong positive relationship with firm performance. Specifically, a one standard deviation rise in the IR score corresponds to a 2.6% rise in company ROA. Companies may be advised to strengthen their investor relations based on these findings about the beneficial role of investor relations.
1. Introduction
Investor Relations (IR) is a relatively new area of corporate governance that tries to improve the transparency and accountability of companies and strengthen their visibility and attractiveness for investors (Craven and Marston 1997; Marston and Stracker 2001; McCahery et al. 2013; Crifo et al. 2019). According to Bushee and Miller (2012), “institutional investors and security analysts tend to neglect firms that lack visibility-enhancing characteristics, such as large size, high liquidity, and prominent exchange listing” (p. 868). Hence, it seems that firms’ size and other leading indicators can be the main factors attracting large investors in stock markets, thereby creating a size premium in the stock markets. The authors note that IR can play an important role in addressing this problem in terms of providing voluntary disclosure of additional information and providing access points for the investors. Bushee and Miller (2012) note that while voluntary disclosure of information can help, there can still be a size premium in the sense that less visible and smaller firms can face challenges in attracting investor attention and funds. It is very important for any publicly traded company to communicate with its investors in an efficient and transparent way, using an investor relations department that is actively involved in the coordination of the meetings and conferences with shareholders and press and ultimately has the responsibility for timely release of financial information or any other information that may be of interest for shareholders or other stakeholders. Then, the benefits of IR and whether these benefits differ across firms stand out as an important research question.
The present study aims to examine the above research questions for the companies listed on the Bucharest Stock Exchange (BVB). Specifically, the study documents different board characteristics of the companies, examines their corporate governance scores, including IR dimensions, and looks at the relationship of both board characteristics and IR scores with the financial performance indicators. In this way, it aims to see if the IR practices can be an important corporate governance strategy for the companies listed on BVB. The relevant literature on IR is relatively new and scarce compared to other dimensions of corporate governance. This is very evident in the case of the companies listed on the Bucharest Stock Exchange. There are only a few studies that examine the IR issues for public companies in Romania, and they try to measure IR using different indicators (Popa et al. 2008; Achim and Borlea 2014; Achim et al. 2016). This lack of a consistent and comprehensive IR indicator becomes a major shortcoming of the existing literature. The present paper overcomes this shortcoming by using a newly generated institutional indicator called VEKTOR. As discussed in the data and methodology section, this indicator documents various dimensions of IR for the companies listed on the BVB in a consistent way. The VEKTOR indicator has been released only since 2019 and the 2019–2020 period is used for research in the present paper. Hence, the current study has an important data advantage over the existing studies. Then, using the dataset, it examines the effects of IR on the financial performance indicators of public companies in Romania and contributes to this literature by expanding the empirical evidence set in the case of the companies listed on the BVB. The findings indicate that higher IR positively affects the performance indicator of return on assets (ROA). Specifically, a one standard deviation rise in the IR score corresponds to a 2.6% rise in company ROA. This finding also has important consequences for policymakers and managers. Namely, it implies that increasing the IR requirements can be part of the best-practice corporate governance measures and executives can use IR measures to improve financial performance and investor attention.
2. Literature Review
Corporate governance is a broad term that includes many dimensions and characteristics like boards, committees, executive pay, shareholder rights, and corporate social responsibility (Becht et al. 2003; Bebchuk et al. 2009; Larker and Tayan 2015; Solomon 2020). There are many studies that provide both theoretical discussions and empirical findings on these dimensions of corporate governance. In this context, a relatively new topic is Investor Relations (IR). In an early study, Brennan and Tamarowski (2000) examine the causal role of IR. The authors argue for the presence of a causal mechanism running from IR activities to the number of analysts following the relevant stock, then from the number of analysts to the liquidity of firm shares, and finally from liquidity to the cost of capital or financial performance of the company. In order to display the relevance of this causal chain, the authors use the existing evidence in the literature and also conduct their empirical analysis. They find supportive evidence for all three chains of the causal mechanism and conclude that “a firm can reduce its cost of capital and increase its stock price through more effective investor relations activities, which reduce the cost of information to the market and to investment analysts in particular” (Brennan and Tamarowski 2000, p. 26). While this study displays possible causal effects of IR, one issue in the relevant literature is the measurement of IR in a comparable way across firms. Agarwal et al. (2008) overcome this issue by using “The Annual Investor Relations Magazine Investor Relations Awards from 2000 to 2002” as a proxy for the quality of IR in companies. The authors show that being nominated by this award is associated with superior abnormal returns, higher analyst following, and higher liquidity in the following periods. In a similar study, Chang et al. (2008) examine the internet activities of companies to determine the quality of their IR practices. After developing relevant metrics, the authors find that firms that provide higher quality information via IR activities are generally larger, they have higher levels of analyst or trader following, and a larger share of institutional investors. Overall, these studies show that IR can be important to improve the visibility, liquidity, and performance of companies in the stock markets. However, these studies also show that larger firms benefit highly from these activities, indicating the presence of a size premium in IR.
Bushee and Miller (2012) focus on the size premium in IR practices. The authors note that for small and less visible firms, it might not be possible to have high benefits from IR even if these firms enhance the quality and transparency of information disclosures. To see this possible effect of firm size on the effects of IR, the authors examine the case of 210 small and mid-cap companies. In terms of the relevant policy change, the authors examine the hiring of IR firms by the stock market companies. The authors find that this specific policy was effective in terms of analyst following, a higher share of institutional investors, and higher valuation. Similar results are obtained in more recent papers as well. For example, Kirk and Vincent (2014) examine the case of publicly traded companies and show that “companies initiating internal professional IR experience increases in disclosure, analyst following, institutional investor ownership, liquidity, and market valuation relative to a matched sample of control firms” (p. 1421). In another recent paper, Chapman et al. (2019) show the beneficial effects of having an in-house IR officer by helping efficient information sharing with market players.
Xiao et al. (2007) is a relevant study that examines the role of IR in the case of Chinese companies. The authors look at the possible associates of the IR index developed academically and find that IR intensity is positively related to the outside ownership share, the separation of the CEO and chairperson positions, and firm size. Rodrigues and Galdi (2017) examine the case of Brazilian companies in terms of whether IR activities reduce information asymmetries between firms and investors. The authors conduct regression analysis using the collected IR information from the annual reports and find that more effective IR is associated with lower bid-ask spreads. Hence, this study displays the importance of IR in terms of addressing market inefficiencies. This point is stated by Laskin (2021) as follows: “Efficient markets require information in order to function properly” (p. 3). Overall, this growing literature shows various benefits of investor relations for publicly traded companies.
In addition to the above studies that mainly focus on developed stock markets, there are also some studies that look at the effects of investor relations in the context of corporate governance in Romania. In a relatively early study, Popa et al. (2008) look at the possible effects of the internet-based IR activities of companies in the BVB. Specifically, the authors examine the internet disclosures for investors and construct an IR score based on these disclosures. They find that out of 87 firms in the stock market, 72 had an active website as of 2007. Among these, 45% use the internet as an alternative publication media, 27% use it for investor communication, and 19% exploit internet features extensively for IR purposes. Based on these numbers, the authors argue that the companies listed on the BVB do not utilize internet-based IR strategies extensively or effectively. Achim and Borlea (2014) is a more recent study in this context. The authors examine the quality of corporate governance in the BVB and include IR as a dimension of this analysis. For the IR dimension, the authors collect information by using a short questionnaire with 10 questions, including the presence of an IR officer/unit or active communication with investors. Then, using the relevant scores, the authors rank the sectors for the companies listed on the BVB in terms of the quality of corporate governance practices. While these two studies provide valuable information on the IR conditions for the companies listed on the BVB, they do not look at the effects of IR strategies on any firm indicators like performance evaluation.
Achim et al. (2016) extend the above studies by looking at the effects of the corporate governance scores, including the IR dimension, on various strategies and outcomes like the “Comply or Explain Statement”, corporate social responsibility, financial performance, turnover growth rate, liquidity, leverage, and investment propensity. Except in the case of effects on corporate social responsibility, the authors look at the impact of the overall corporate governance score, not the specific dimensions like the IR score. Regarding the effects on financial performance, their results indicate positive effects on the return on assets (ROA), but not on the returns on equity (ROE). Hence, this study is very relevant for the present paper; however, it does not focus on the IR dimension separately. In a recent study, Ioniţă (2020) conducts a qualitative analysis of the relationship between IR and the sustainable growth of public companies in Romania. The author argues that IR would positively affect the economic performance and the VEKTOR dataset can be used to measure the IR intensity of companies, whereas the paper does not conduct any quantitative analysis. In another recent paper, Hategan et al. (2020) show that the BVB companies actively used public reports to communicate about the consequences of the recent pandemic on their businesses. Hence, IR can also be used to improve the communication strategy of public companies in response to public health developments.
The present paper contributes to this literature by looking at the general effect of the corporate governance score, as well as the separate effect of the IR score. Overall, these findings on the IR practices of companies listed on the BVB show that companies in Romania were not very active in terms of IR and the relevant strategies were not very effective on the firm performance indicators. Then, these findings stay in contrast to the findings in advanced countries which show significant benefits of IR. Hence, there is a need to examine this research question with more recent data and use more detailed quantitative methods. The present paper fills these research gaps using recent and detailed data on the IR scores, board characteristics, and firm performances of companies at the BVB. Based on these discussions, the main research hypothesis is given as follows:
Hypothesis 1 (H1).
Active IR measures, measured by higher IR scores, are associated with the better financial performance of companies in the BVB.
3. Data and Research Methods
3.1. Sample Selection and Variable Description
In order to examine the research question regarding the relationship between IR, board characteristics, and firm performance, detailed data are collected on these dimensions for the companies listed on the BVB. For the board and firm characteristics, the relevant variables are collected from the year ending annual reports of 70 companies for 2019 and 2020. These variables include the firm-specific variables of firm size (measured as the total revenue), return on equity (ROE), return on assets (ROA), Tobin’s Q (market value as a ratio to total assets), and various board characteristics, including the board size, the shares of non-executive, independent, and women board members, the duality of the CEO and chairperson positions, and whether CEO is a woman. These variables and their short descriptions are presented in Table 1.

Table 1.
Description of Firm and Board-Specific Variables.
The discussions in the literature review showed that the main challenge in the IR studies within corporate governance literature can arise from the difficulty of getting comparable IR measures across firms. Some papers like Popa et al. (2008) and Achim and Borlea (2014) try to overcome this challenge by producing their IR scores. However, the limited comparability of these measures across years and different papers becomes a shortcoming. For the present paper, an important development on this dimension has been the publication of corporate governance and IR scores for the companies at the BVB by the Romanian Investor Relations Association (ARIR 2020). These scores are produced for the first time for 2019 and then repeated for 2020. The relevant dataset is called VEKTOR and includes scores on 15 dimensions of corporate governance and investor relations. The relevant dimensions of VEKTOR overlap closely between 2019 and 2020, while there are some changes in the content and grouping of questions. Then, the availability of the VEKTOR dataset determines the sample period as 2019 and 2020. As this index is repeated in the following years, future research can be conducted with larger datasets as well.
In contrast to the other studies on Romania, the use of the recent VEKTOR scores for the IR relations, which are comparable across firms and cover many dimensions of IR, is a major contribution of the present paper. The details of this indicator are presented in Table 2. Overall, these dimensions can be considered as the best practices regarding investor relations, and having high scores on them would be supportive of the good IR strategies. The Code of Governance adopted by the BVB also makes recommendations on the effective use of investor relations (BVB 2015).
Table 2.
Dimensions of Investor Relations measured by the VECTOR 2019 Dataset.
3.2. Econometric Specification
Regression methods are used commonly to examine the possible causal relationship of different board and firm characteristics on the financial performance of companies. For example, in the case of Romania, the paper by Achim et al. (2016) constructs scores of corporate governance quality, including investor relations, and then examines their effects on the firm performance indicators of ROE, ROA, and Tobin’s Q using multiple regression approach. The present paper also follows a similar strategy and estimates the following regression model:
In the regression model, i refers to the companies and t refers to years 2019 or 2020. In terms of the dependent variable, the return on assets (ROA) is chosen as the relevant firm performance indicator. Achim et al. (2016) use different performance indicators and find that there is a statistically significant effect of the corporate governance score on the ROA measure. Hence, this study also follows a similar approach, while the results for the other performance measures of ROE and Tobin’s Q are also estimated for robustness purposes.
4. Findings
4.1. Summary Statistics and Correlation Analysis
This part presents the results of the summary statistics and the correlation analysis between the board characteristics, IR scores, and firm performance variables. In this context, Table 3 presents the summary statistics of the firm and board-specific factors, while Table 4 presents the summary statistics of the VEKTOR scores on the investor relations. It is seen that the mean ROA is 2.5%, with a standard deviation of 8.6%. In the case of ROE, the mean is estimated as 6.6%, with a standard deviation of 16.2%. The board size in the sample ranges from 1 to 11, with an average size of 5. The share of independent board members is 38%, while the share of non-executive board members is 68%. In addition, the women’s share on the boards is estimated at 20%. As a relevant statistic, Table 3 also shows that 11% of the CEOs in the sample are women. Lastly, 30% of the CEOs also hold the dual position of chairperson.
Table 3.
Summary Statistics of Firm and Board-Specific Variables.
Table 4.
Summary Statistics of VEKTOR Measures on Investor Relations.
Table 4 presents the summary statistics of the VEKTOR measures on investor relations. By construction, the total score can range between 0 and 10, and it is seen that the average score is 3.564 in the sample of 70 companies in 2019, while it is 3.725 in the sample of 69 companies in 2020. Hence, there was a slight improvement in the IR score in the last year. Overall, this score of around 4 out of 10 can be considered relatively low compared to the best practices identified by the ARIR (2020). The scores for specific items also display very different average and standard deviations from each other.
After displaying the summary statistics, this part also presents the cross-correlations of the leading variable in a bivariate way. The relevant pairwise Pearson correlation coefficients are presented in Table 5. It is seen that among the three indicators of firm performance, there are positive and statistically significant correlations between ROA and ROE, as well as between ROE and Tobin’s Q. In addition, both ROA and ROE have positive and statistically significant correlations with the IR score, whereas the correlation between Tobin’s Q and IR is not statistically significant. In addition, the correlation coefficient between ROA and IR is larger than the correlation coefficient between ROE and IR. When other correlations are examined, it is found that IR scores are positively associated with the size variables of firm size and board size. This finding can be considered to be related to the size premium that some studies in the literature obtain (Brennan and Tamarowski 2000; Agarwal et al. 2008).
Table 5.
Pairwise Correlation Coefficients.
In addition to the above descriptive and correlation analyses presented in quantitative nature, providing some graphical analyses can also be informative. In this context, Figure 1 shows the distribution of the scores for investor relations at the BVB in 2019. It is seen that these scores are mostly clustered around low values between 0 and 4, with another small cluster at very high values between 8 and 10. Therefore, the IR practices for the companies listed on the BVB seem to differ greatly from each other.
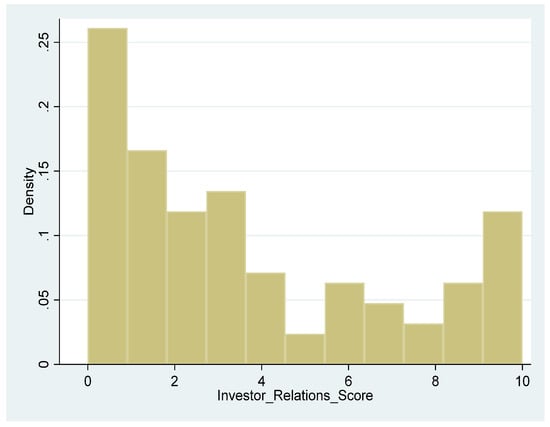
Figure 1.
Scores for Investor Relations.
Figure 2 shows the scatter plot between return on assets (ROA) and the investment relations (IR) scores. It is seen that there is a mild positive association between these variables. Namely, for high values of investor relations scores (i.e., above 6 out of 10), the majority of the ROA observations are on the positive side. In contrast, for the low values of investor relations scores (i.e., less than 4 out of 10), there are many negative values of ROA. Overall, this graph shows the possible positive effects of investor relations on firm performance in the case of the companies listed on BVB.
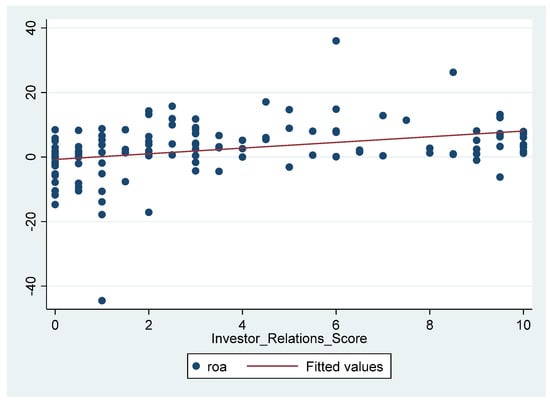
Figure 2.
Scatter Plot between ROA and IR Scores.
4.2. Regression Analysis
This part presents the results of the regression results. Table 6 presents the OLS results with firm and board characteristics. Robust standard errors are estimated in the regressions in order to correct for heteroscedasticity. Given that there are only two years of observations, it is not very feasible to estimate dynamic regressions. However, as more data points accumulate in the coming years, future research can implement more advanced regression methods such as GMM estimations. In the first model given in the upper panel of the table, only two control variables of firm size and board size are included in the regression model.
Table 6.
OLS Regression Results with Firm and Board Characteristics.
It is found from Table 6 that the IR score has a positive and statistically significant relationship with the firm performance indicator of ROA. The coefficient of 0.802 implies that one standard deviation increase in the IR score (which is 3.31) corresponds to a 2.65% points rise in the ROA measure. This is an economically sizeable effect. The lower panel of Table 6 includes additional control variables of the shares of independent, non-executive, and women board members. In this case, a positive and statistically significant effect is found for women board members. In this regression model, the adjusted R2 value increases to 0.222, indicating higher explanatory power of the new regression model. In addition, the size of the regression coefficient for the IR score changes from 0.802 to 0.613 and is still statistically significant at the 1% level. Overall, the regression results in Table 6 support the positive effects of investor relations on the firm performance indicator of ROA.
As a robustness analysis, Table 7 shows the results of the same regression model with the addition of CEO characteristics. In this case, the women share retains its positive and statistically significant regression coefficient, while the share of non-executives has a positive effect and the share of independent board members has a negative effect. The regression coefficient of the scores for investor relations is also statistically significant at the 1% level and estimated at 0.758. Overall, these regression results provide supportive evidence on the positive effects of investor relations on the firm performance for the companies listed on the BVB, measured by ROA. This finding is also consistent with the results of Achim et al. (2016) and Kirk and Vincent (2014). Appendix A (Table A1 and Table A2) presents the regression results for the other performance indicators of ROE and Tobin’s Q. Results in these cases do not show statistically significant effects of IR.
Table 7.
OLS Regression Results with Firm, Board, and CEO Characteristics.
Overall, the relevant regression analyses imply that more active investor relations by public companies in the BVB, such as investor presentations, conference calls, press releases, stock price information, the readability of reports, corporate governance section in reports, and non-financial information reporting would be good corporate governance practices to improve the financial performance of companies. There can be various mechanisms creating this positive relationship such as lower information problems and higher investment interest. Then, these results can be used to improve the corporate governance practices for the companies listed on the BVB as well.
5. Conclusions
This paper has examined the effects of investor relations on firm performance for the companies listed on the BVB. The relevant literature displays that investor relations can improve information disclosure, analyst following, the share and participation of the institutional investors, liquidity and overall, the company performance. There are only a few studies on this topic for the case of the companies listed on the BVB, and the availability of comparable IR scores across firms is a major challenge. The present paper uses the newly generated VEKTOR scores on investor relations for the companies listed on the BVB, for 2019 and 2020. The results indicate that the IR scores have a close positive association with the firm performance indicator of ROA. The regression coefficient implies that one standard deviation increase in the IR score is associated with a 2.6% increase in the ROA. Moreover, it is found that IR scores are positively associated with the size variables of firm size and board size. These findings are generally consistent with the studies in the literature about other countries (Bushee and Miller 2012; Kirk and Vincent 2014) and about Romania (Achim et al. 2016). Hence, the present paper expands the relevant literature by contributing to the IR dimension of corporate governance from the perspective of Romanian public companies. Similar analyses can be conducted in the case of other countries to see if the results of the present paper generalise to the joint-stock companies in other countries.
Based on these findings regarding the positive effects of investor relations it can be recommended for the companies listed on the BVB to intensify their investor relations. Namely, active IR policies can be expected to decrease the intensity of information asymmetries between firms and investors, thereby decreasing the riskiness of the stock markets and improving economic efficiency. These results also imply that policymakers can increase the regulatory requirements for public companies to have more detailed and active investor relations and disclosures. Future research could include more years in the analysis as new IR scores become available. As another extension, one could also create some IR scores using the reports of companies (similar to Achim and Borlea (2014) and Achim et al. (2016)) and compare them to the existing VEKTOR scores, and check the effects of other IR variables on financial performance.
Author Contributions
Conceptualization, B.A.M. and D.D and D.S.; data curation, B.A.M. and C.D.M. and A.L.; Formal analysis, B.A.M. and D.D. and D.S. and C.D.M.; Methodology, C.D.M.and A.L.; Resources, C.D.M. and D.S. and A.L. All authors have read and agreed to the published version of the manuscript.
Funding
This research received no external funding.
Institutional Review Board Statement
Not applicable.
Informed Consent Statement
Not applicable.
Data Availability Statement
Not applicable.
Conflicts of Interest
The authors declare no conflict of interest.
Appendix A
Table A1.
OLS Regressions for the dependent variable of ROE.
Table A1.
OLS Regressions for the dependent variable of ROE.
| ROE | Coef. | St.Err. | t-Value | p-Value | [95% Conf Interval] | Sig | |
|---|---|---|---|---|---|---|---|
| Investor Relations Score | −0.210 | 0.580 | −0.36 | 0.719 | −1.365 | 0.946 | |
| Ln_size | −0.148 | 0.904 | −0.16 | 0.870 | −1.948 | 1.652 | |
| Board_size | 1.199 | 1.313 | 0.91 | 0.364 | −1.415 | 3.813 | |
| Independent_share | 0.115 | 0.084 | 1.38 | 0.172 | −0.051 | 0.281 | |
| Non_exec Share | −0.111 | 0.075 | −1.49 | 0.141 | −0.261 | 0.038 | |
| Women_share | −0.031 | 0.070 | −0.45 | 0.655 | −0.171 | 0.108 | |
| CEO Duality | −2.457 | 2.432 | −1.01 | 0.315 | −7.297 | 2.383 | |
| CEO Women | −3.418 | 3.311 | −1.03 | 0.305 | −10.008 | 3.172 | |
| Constant | 11.292 | 15.843 | 0.71 | 0.478 | −20.244 | 42.827 | |
| Mean dependent var | 8.354 | SD dependent var | 13.340 | ||||
| R-squared | 0.065 | Number of obs | 88.000 | ||||
| F-test | 0.604 | Prob > F | 0.772 | ||||
| Akaike crit. (AIC) | 716.794 | Bayesian crit. (BIC) | 739.091 | ||||
Table A2.
OLS Regressions for the dependent variable of Tobin’s Q.
Table A2.
OLS Regressions for the dependent variable of Tobin’s Q.
| Tobin’s Q | Coef. | St.Err. | t-Value | p-Value | [95% Conf Interval] | Sig | |
|---|---|---|---|---|---|---|---|
| Investor Relations Score | −0.010 | 0.034 | −0.30 | 0.765 | −0.078 | 0.057 | |
| Ln_size | 0.078 | 0.049 | 1.60 | 0.114 | −0.019 | 0.175 | |
| Board_size | 0.011 | 0.050 | 0.22 | 0.824 | −0.088 | 0.110 | |
| Independent_share | 0.004 | 0.004 | 1.05 | 0.299 | −0.004 | 0.013 | |
| Non_exec Share | 0.001 | 0.003 | 0.41 | 0.681 | −0.005 | 0.008 | |
| Women_share | −0.003 | 0.004 | −0.83 | 0.409 | −0.010 | 0.004 | |
| CEO Duality | −0.003 | 0.205 | −0.01 | 0.990 | −0.411 | 0.405 | |
| CEO Women | 0.356 | 0.256 | 1.39 | 0.168 | −0.154 | 0.866 | |
| Constant | −0.926 | 0.750 | −1.24 | 0.221 | −2.422 | 0.570 | |
| Mean dependent var | 0.793 | SD dependent var | 0.749 | ||||
| R-squared | 0.079 | Number of obs | 77.000 | ||||
| F-test | 2.393 | Prob > F | 0.025 | ||||
| Akaike crit. (AIC) | 184.625 | Bayesian crit. (BIC) | 205.719 | ||||
References
- Achim, Monica-Violeta, and Sorin-Nicolae Borlea. 2014. The assessment of corporate governance system quality in Romanian sectors. Analysis of companies listed on the Bucharest stock exchange. Procedia Econimics and Finance 15: 617–25. [Google Scholar] [CrossRef]
- Achim, Monica-Violeta, Sorin-Nicolae Borlea, and Codruta Mare. 2016. Corporate governance and business performance: Evidence for the Romanian economy. Journal of Business Economics and Management 17: 458–74. [Google Scholar] [CrossRef]
- Agarwal, Vineet, Angel Liao, Elly A. Nash, and Richard J. Taffler. 2008. The Impact of Effective Investor Relations on Market Value. Edinburgh: University of Edinburgh. [Google Scholar]
- ARIR. 2020. VEKTOR-Measure of the Communication of Listed Companies with Investors. Available online: https://www.ir-romania.ro/vektor/?lang=en (accessed on 31 May 2021).
- Bebchuk, Lucian, Alma Cohen, and Allen Farrell. 2009. What matters in corporate governance? The Review of Financial Studies 22: 783–827. [Google Scholar] [CrossRef]
- Becht, Marco, Patrick Bolton, and Ailsa Roell. 2003. Corporate governance and control. In Handbook of the Economics of Finance. Amsterdam: Elsevier, vol. 1, pp. 1–109. [Google Scholar]
- Brennan, J. Michael, and Claudia Tamarowski. 2000. Investor relations, liquidity, and stock prices. Journal of Applied Corporate Finance 12: 26–37. [Google Scholar] [CrossRef]
- Bushee, J. Brian, and Gregory S. Miller. 2012. Investor relations, firm visibility, and investor following. The Accounting Review 87: 867–97. [Google Scholar] [CrossRef]
- BVB. 2015. Bucharest Stock Exchange. Code of Corporate Governance. Available online: https://www.bvb.ro/info/Rapoarte/Diverse/ENG_Corporate%20Governance%20Code_WEB_revised.pdf (accessed on 5 March 2021).
- Chang, G. Millicent, Gino D’Anna, Iain Watson, and Marvin Wee. 2008. Does disclosure quality via investor relations affect information asymmetry? Australian Journal of Management 33: 375–90. [Google Scholar] [CrossRef]
- Chapman, Kimball, Gregory S. Miller, and Hai D. White. 2019. Investor relations and information assimilation. The Accounting Review 94: 105–31. [Google Scholar] [CrossRef]
- Craven, Barry M., and Claire Lesley Marston. 1997. Investor Relations and Corporate Governance in Large UK Companies. Corporate Governance: An International Review 5: 137–51. [Google Scholar] [CrossRef]
- Crifo, Patricia, Elena Escrig-Olmedo, and Nicolas Mottis. 2019. Corporate Governance as a Key Driver of Corporate Sustainability in France: The Role of Board Members and Investor Relations. Journal of Business Ethics 159: 1127–46. [Google Scholar] [CrossRef]
- Hategan, Camelia-Daniela, Ruxandra-Ioana Curea-Pitorac, and Vasile-Petru Hategan. 2020. Responsible Communication of Romanian Companies for Ensuring Public Health in a COVID-19 Pandemic Context. International Journal of Environmental Research and Public Health 17: 8526. [Google Scholar] [CrossRef]
- Ioniţă, Catalin Gabriel. 2020. The need for rethinking the model of assessing value in the digital economy context.Bucharest, Sciendo. In Proceedings of the 14 International Conference on Business Excellence. Bucharest: National University of Political Studies and Public Administration, vol. 14, pp. 170–81. [Google Scholar]
- Kirk, Marcus, and James Vincent. 2014. Prefessional investor relations within the firm. The Accounting Review 89: 1421–52. [Google Scholar] [CrossRef]
- Larker, David, and Brian Tayan. 2015. Corporate Governance Matters: A Closer Look at Organizational Choices and Their Consequences. Old Tappan: Pearson education. [Google Scholar]
- Laskin, Alexander V. 2021. Investor Relations and Financial Communication. Oxford: Wiley Blackwell. [Google Scholar]
- Marston, Claire, and Michelle Stracker. 2001. Investor relations: A European survey. Corporate Connunications: An International Journal 6: 82–93. [Google Scholar] [CrossRef]
- McCahery, Joseph A., Erik P. M. Vermeulen, and Masato Hisatake. 2013. The Present and Future of Corporate Governance: Re-Examining the Role of the Board of Directors and Investor Relations in Listed Companies. European Company and Financial Law Review 10: 117–63. [Google Scholar] [CrossRef]
- Popa, Adina, Blidisel Rodica Gabriela, and Andra Pop. 2008. Investor relations on the internet. An empirical study of Romanian listed companies. In Proceedings Papers of Business Science: Symposium for Young Researchers (FIKUSZ). Budapest: RePEc, pp. 187–97. [Google Scholar]
- Rodrigues, Sandrielem da Silva, and Fernando Caio Galdi. 2017. Investor relations and information asymmetry. Revista Contabilidade & Finanças 28: 297–312. [Google Scholar]
- Solomon, Jill. 2020. Corporate Governance and Accountability, 5th ed. Hoboken: Wiley. [Google Scholar]
- Xiao, Binqing, Xindan Li, Yan Gu, and Shuhua Wang. 2007. Investor Relations and Corporate Governance in China: Evidence from the Investor Relations Survey of A Listed Company. Nankai Business Review 3: 51–60. [Google Scholar]


Publisher’s Note: MDPI stays neutral with regard to jurisdictional claims in published maps and institutional affiliations. |
© 2021 by the authors. Licensee MDPI, Basel, Switzerland. This article is an open access article distributed under the terms and conditions of the Creative Commons Attribution (CC BY) license (https://creativecommons.org/licenses/by/4.0/).