
Effects of COVID-19 on Variations of Taxpayers in Tourism-Reliant Regions: The Case of the Mexican Caribbean


Abstract
:1. Introduction
2. Tourism Research on COVID-19 and Tax-Related Issues
2.1. Quantitative Analysis and Measurement in Tourism
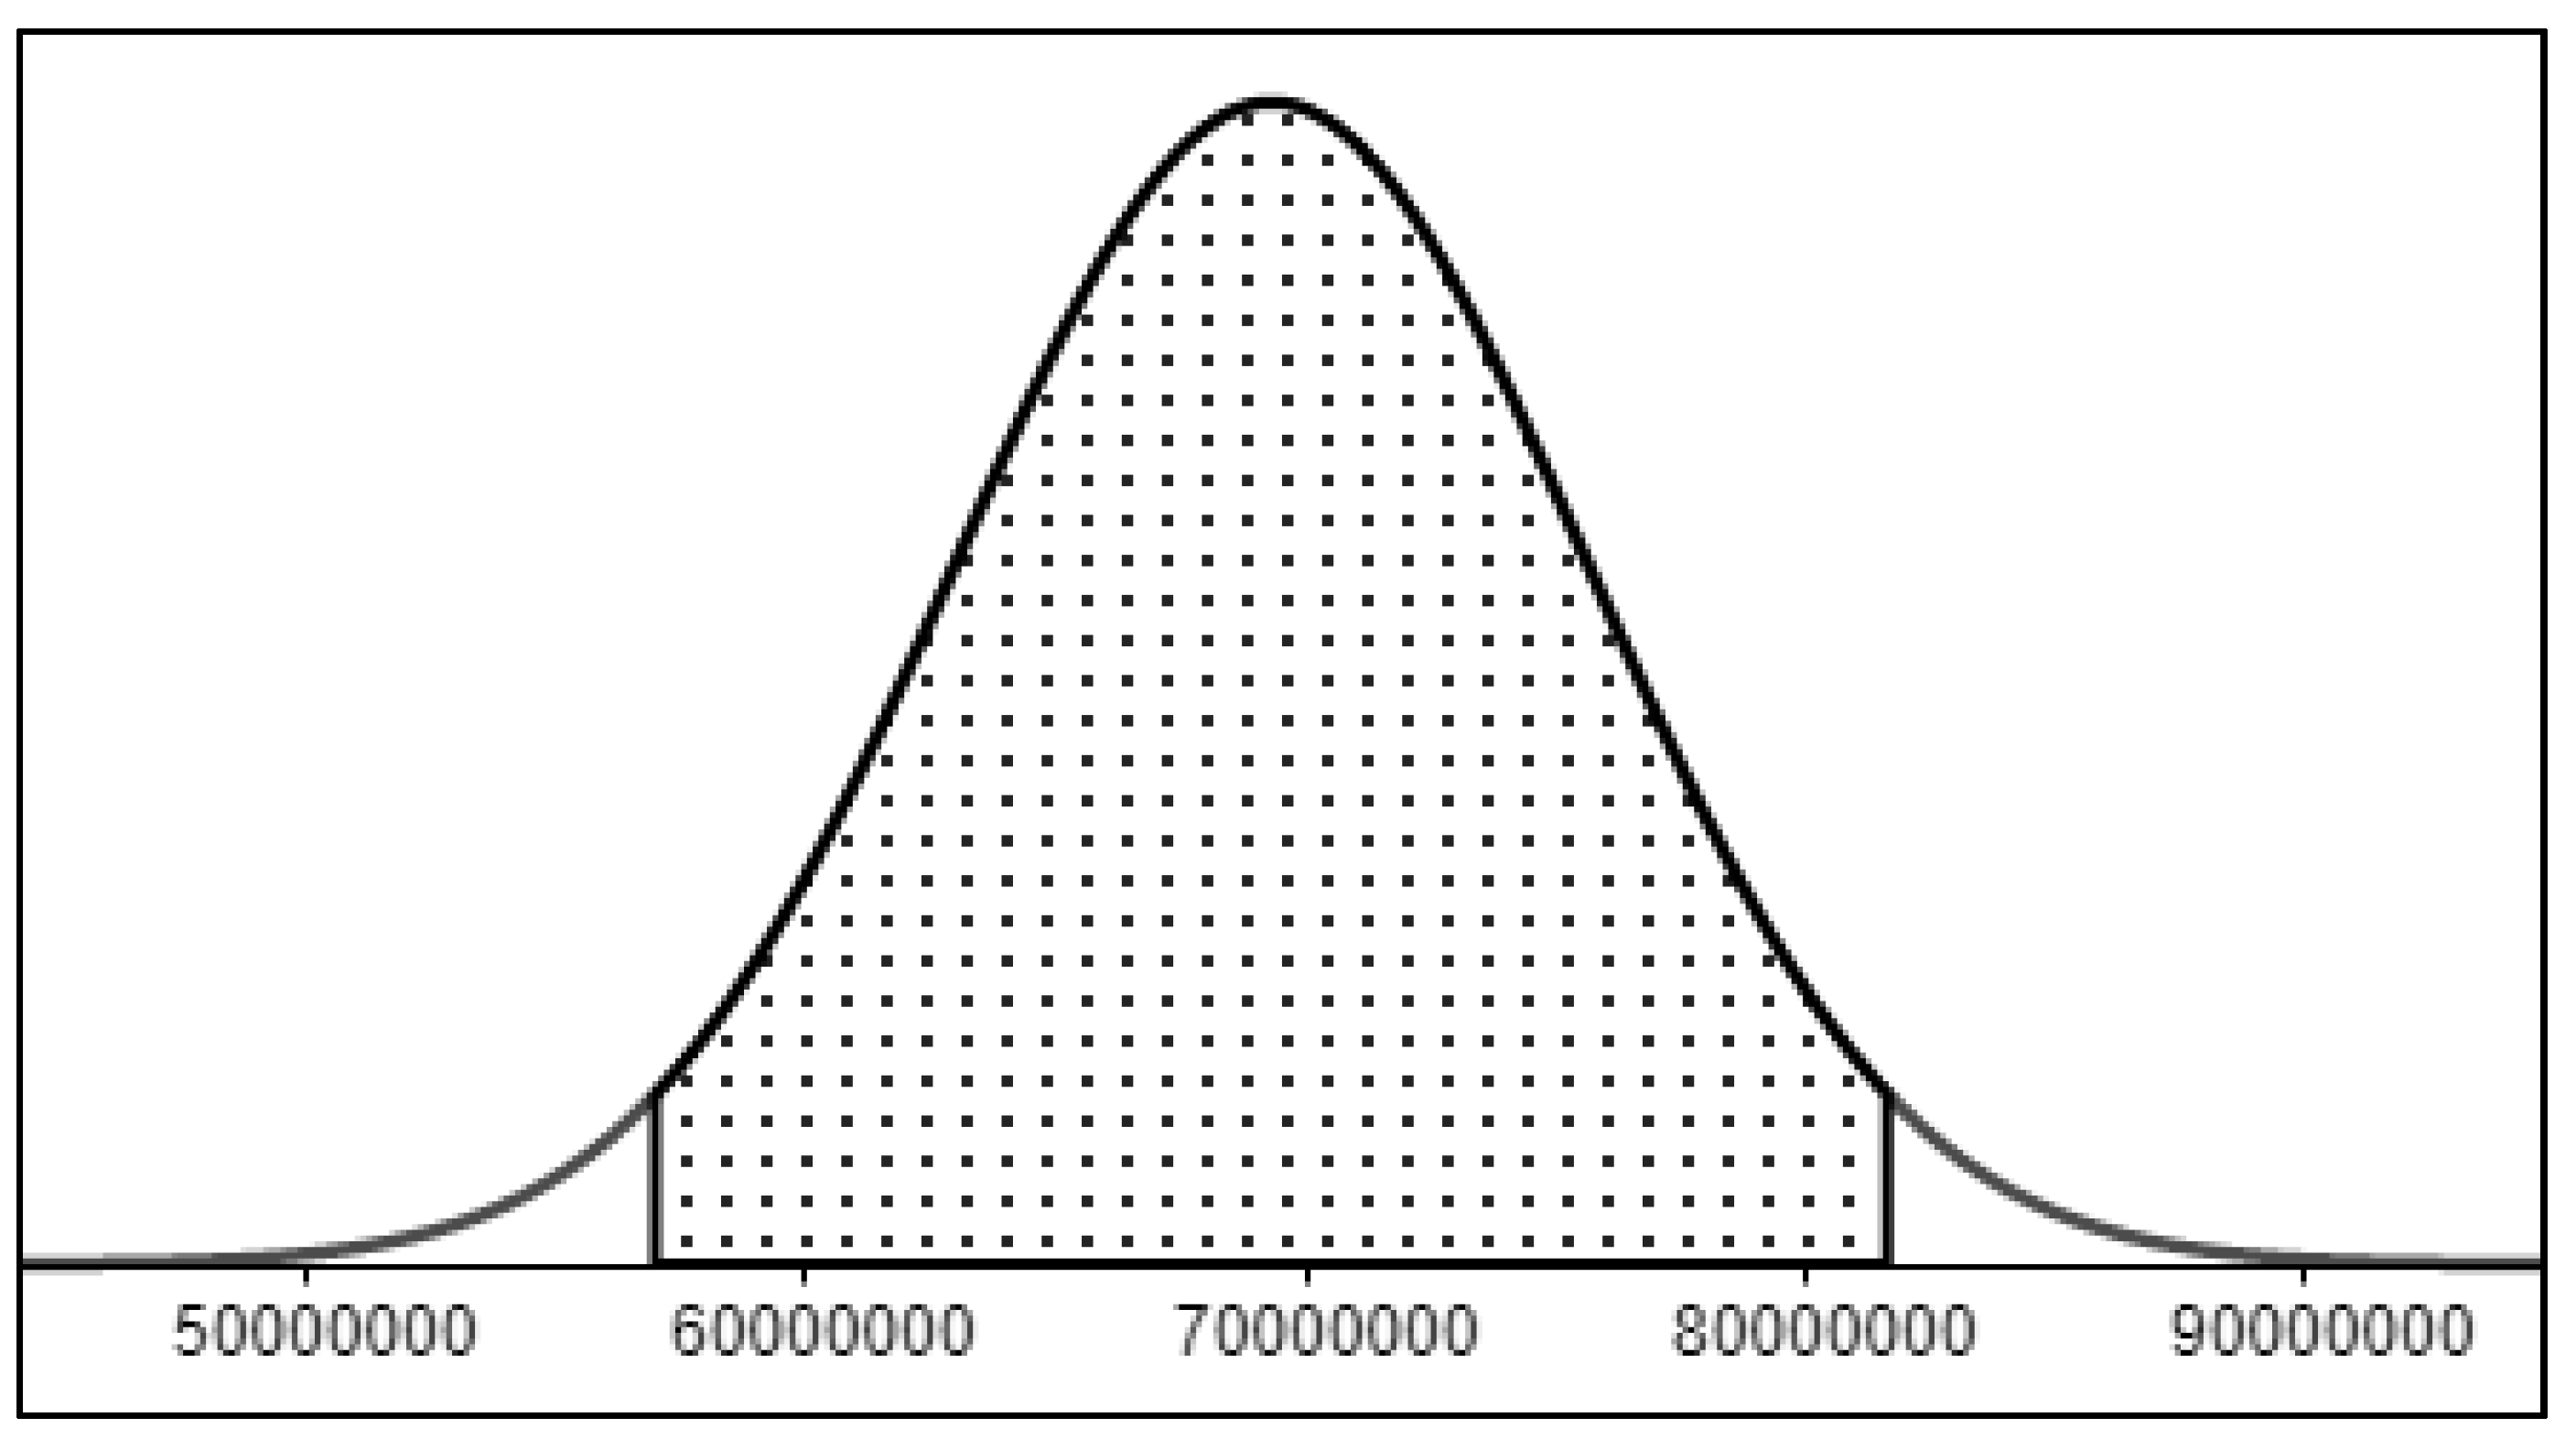
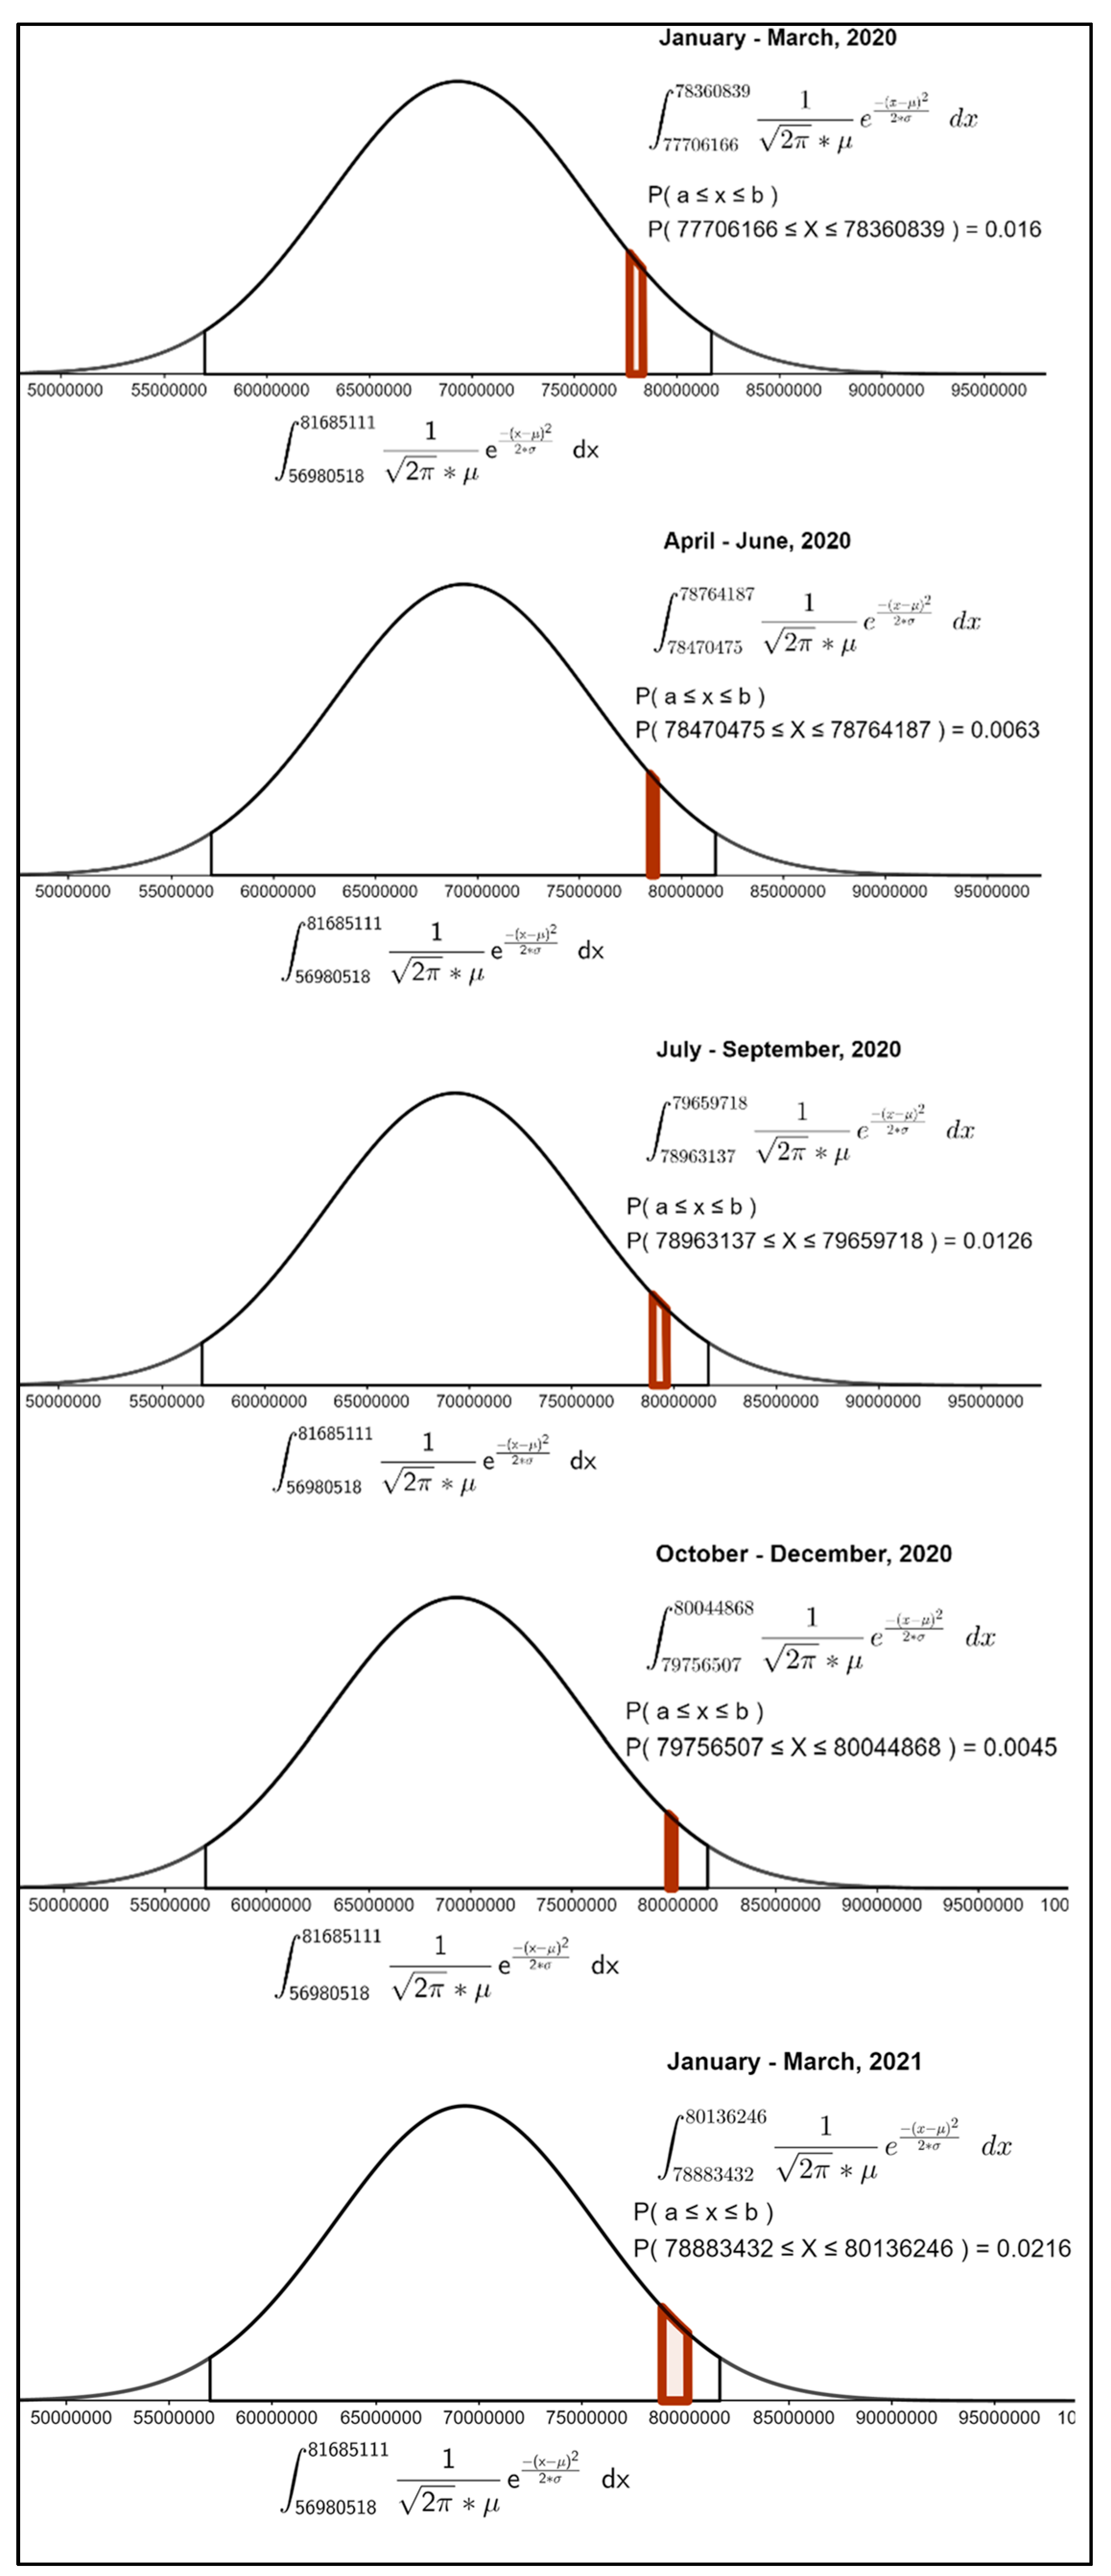
2.2. Probability Distributions and Definite Integrals
3. Methodology and Data Used
4. Results
5. Discussion
5.1. Enduring the Initial Shock
5.2. Rebound and Recovery
5.3. Fiscal Implications
6. Concluding Remarks
Limitations and Future Directions
Author Contributions
Funding
Institutional Review Board Statement
Informed Consent Statement
Data Availability Statement
Conflicts of Interest
References
- Aguinis, Herman, Isabel Villamor, Sergio G. Lazzarini, Roberto S. Vassolo, José Ernesto Amorós, and David G. Allen. 2020. Conducting management research in Latin America: Why and what’s in it for you? Journal of Management 46: 615–36. [Google Scholar] [CrossRef] [Green Version]
- Ambrosie, Linda M. 2013. Tourism: Sacred cow or silver bullet? Unravelling the myths. Paper presented at Administrative Sciences Association of Canada (ASAC), Calgary, AB, Canada, February 16. [Google Scholar]
- Amore, Alberto, Girish Prayag, and C. Michael Hall. 2018. Conceptualizing destination resilience from a multilevel perspective. Tourism Review International 22: 235–50. [Google Scholar] [CrossRef]
- Aprausheva, Nina N., Naser Mollaverdi, and Sergei V. Sorokin. 2015. An algorithm to calculate extrema of probability density of normal distributions’ mixtures. Journal of Mathematical Sciences 205: 12–17. [Google Scholar] [CrossRef]
- Arbulú, Italo, Maria Razumova, Javier Rey-Maquieira, and Francesc Sastre. 2021. Measuring risks and vulnerability of tourism to the COVID-19 crisis in the context of extreme uncertainty: The case of the Balearic Islands. Tourism Management Perspectives 39: 100857. [Google Scholar] [CrossRef] [PubMed]
- Ashta, Arvind. 2021. Towards a new form of undemocratic capitalism: Introducing macro-equity to finance development post COVID-19 crisis. Journal of Risk and Financial Management 14: 116. [Google Scholar] [CrossRef]
- Assaf, Albert, and Raffaele Scuderi. 2020. COVID-19 and the recovery of the tourism industry. Tourism Economics 26: 731–33. [Google Scholar] [CrossRef]
- Baggio, Rodolfo, and Jane Klobas. 2011. Quantitative Methods in Tourism: A Handbook. Bristol: Channel View Publications. [Google Scholar]
- Bagui, Subhash, and K. L. Mehra. 2017. Convergence of known distributions to limiting normal or non-normal distributions: An elementary ratio technique. The American Statistician 71: 265–71. [Google Scholar] [CrossRef]
- Barbera, Carmela, Enrico Guarini, and Ileana Steccolini. 2016. Italian municipalities and the fiscal crisis: Four strategies for muddling through. Financial Accountability & Management 32: 335–61. [Google Scholar]
- Bausch, Thomas, William C. Gartner, and Florian Ortanderl. 2021. How to avoid a COVID-19 research paper tsunami? A tourism system approach. Journal of Travel Research 60: 467–85. [Google Scholar] [CrossRef]
- Bird, Richard M. 1992. Taxing tourism in developing countries. World Development 20: 1145–58. [Google Scholar] [CrossRef]
- Blake, Adam. 2016. Tax. In Encyclopedia of Tourism. Edited by Jafar Jafari and Honggen Xiao. Cham: Springer, pp. 932–33. [Google Scholar]
- Blake, Adam, Ramesh Durbarry, M. Thea Sinclair, and Guntur Sugiyarto. 2000. Modelling Tourism and Travel Using Tourism Satellite Accounts and Tourism Policy and Forecasting Models. Discussion Paper 2001/4. Nottingham: Tourism and Travel Research Institute. [Google Scholar]
- Bolancé, Catalina. 2020. Retos Para el Análisis y la Estimación de la Distribución de Probabilidad en Big-Data. (No. 202007). Barcelona: University of Barcelona, Research Institute of Applied Economics, Volume 7, pp. 1–39. [Google Scholar]
- Bostan, Ionel, Carmen Toderașcu, and Anca Florentina Gavriluţă (Vatamanu). 2018. Challenges and vulnerabilities on public finance sustainability: A Romanian case Study. Journal of Risk and Financial Management 11: 55. [Google Scholar] [CrossRef] [Green Version]
- Bou-Karroum, Lama, Joanne Khabsa, Mathilda Jabbour, Nadeen Hilal, Zeinab Haidar, Pamela Abi Khalil, Rima Abdul Khalek, Jana Assaf, Gladys Honein-AbouHaidar, Clara AbouSamra, and et al. 2021. Public health effects of travel-related policies on the COVID-19 pandemic: A mixed-methods systematic review. Journal of Infection 83: 413–23. [Google Scholar] [CrossRef] [PubMed]
- Bracci, Enrico, Mouhcine Tallaki, Giorgia Gobbo, and Luca Papi. 2021. Risk management in the public sector: A structured literature review. International Journal of Public Sector Management 34: 205–23. [Google Scholar] [CrossRef]
- Brondolo, John. 2009. Collecting Taxes During an Economic Crisis: Challenges and Policy Options. IMF Staff Position Note. Washington, DC: International Monetary Fund. [Google Scholar]
- Bruhn, Miriam. 2013. A tale of two species: Revisiting the effect of registration reform on informal business owners in Mexico. Journal of Development Economics 103: 275–83. [Google Scholar] [CrossRef] [Green Version]
- Buerger, Christian, Riley M. Sandel, Vincent Reitano, Michelle L. Lofton, and Peter Jones. 2021. Extending differences-in-differences frameworks to Granger equations: Evidence from cutback management during three recessions. International Journal of Public Sector Management 34: 688–705. [Google Scholar] [CrossRef]
- Bunn, Daniel, and Elke Asen. 2021. International Tax Competitiveness Index 2021. Washington: Tax Foundation. [Google Scholar]
- Camargo, Blanca A., María L. Chávez, and María del Carmen Ginocchio. 2020. Tourism in Latin America: An overview and new experiences in city tourism. In Routledge Handbook of Tourism Cities. Edited by Alastair M. Morrison and J. Andres Coca-Stefaniak. London: Routledge, pp. 446–61. [Google Scholar]
- Campos-Vazquez, Raymundo M., and Gerardo Esquivel. 2021. Consumption and geographic mobility in pandemic times. Evidence from Mexico. Review of Economics of the Household 19: 353–71. [Google Scholar] [CrossRef] [PubMed]
- Cang, Shuang, and Neelu Seetaram. 2014. Time series analysis. In Handbook of Research Methods in Tourism: Quantitative and Qualitative Approaches. Edited by Larry Dwyer, Alison Gill and Neelu Seetaram. Northampton: Edward Elgar Publishing, pp. 47–70. [Google Scholar]
- Cefis, Elena, Eleonora Bartoloni, and Marco Bonati. 2019. Show me how to live: Firms’ financial conditions and innovation during the crisis. Structural Change and Economic Dynamics 52: 63–81. [Google Scholar] [CrossRef]
- Chaperon, Samantha. 2017. Tourism Policies. In The SAGE International Encyclopedia of Travel & Tourism. Edited by Linda L. Lowry. Thousand Oaks: SAGE Publications, pp. 1258–62. [Google Scholar]
- CICOTUR. 2020. Estimación de las Afectaciones al Turismo Mexicano en 2020 Como Consecuencia de la Pandemia de COVID-19. Centro de Investigación y Competitividad Turística. México: Universidad Anáhuac/Consejo Nacional Empresarial Turístico, Available online: https://www.anahuac.mx/mexico/cicotur/sites/default/files/2020-05/Doc14_Cicotur_Estimacion_afectaciones_turismo__mexicano_Covid19.pdf (accessed on 27 July 2020).
- CICOTUR. 2021. Turismo internacional a México por via aerea Enero-jun 2021. In Infografía 98/21. Centro de Investigación y Competitividad Turística. México: Universidad Anáhuac, Available online: https://www.anahuac.mx/mexico/cicotur/infografias (accessed on 15 September 2021).
- Clarke, George R. G., Robert Cull, and Gregory Kisunko. 2012. External finance and firm survival in the aftermath of the crisis: Evidence from Eastern Europe and Central Asia. Journal of Comparative Economics 40: 372–92. [Google Scholar] [CrossRef] [Green Version]
- Clemens, Jeffrey, and Stan Veuger. 2020. Implications of the COVID-19 pandemic for state government tax revenues. National Tax Journal 73: 619–44. [Google Scholar] [CrossRef]
- Collins, Charles O. 1979. Site and situation strategy in tourism planning: A Mexican case study. Annals of Tourism Research 6: 351–66. [Google Scholar] [CrossRef]
- Corley, Kevin G., and Dennis A. Gioia. 2011. Building theory about theory building: What constitutes a theoretical contribution? Academy of Management Review 36: 12–32. [Google Scholar] [CrossRef] [Green Version]
- COVID19tourism Index. 2021. Global COVID19tourism Index by Temple University. Available online: www.covid19tourism.com (accessed on 28 September 2021).
- CPTQ. 2020. Perfil y Comportamiento del Turista. Informe Trimestral Q1 2020. Playa del Carmen: Consejo de Promoción Turística de Quintana Roo, Available online: https://cptq.mx/inteligencia/perfil-de-turista// (accessed on 12 October 2020).
- CPTQ. 2021. Mexican Caribbean. Playa del Carmen: Consejo de Promoción Turística de Quintana Roo, Available online: https://www.caribemexicano.travel/ (accessed on 15 August 2021).
- Cruz-Milan, Oliver. 2014. La construcción teórica en la administración y mercadotecnia turística en México. In De la Dimensión Teórica al Abordaje Empírico del Turismo en México: Perspectivas Multidisciplinarias. Edited by Juan Carlos Monterrubio-Cordero and Álvaro López-López. México: Instituto de Geografía, UNAM/UAEM, pp. 37–50. [Google Scholar]
- Cruz-Milan, Oliver. 2017. Mexico. In The SAGE International Encyclopedia of Travel & Tourism. Edited by Linda L. Lowry. Thousand Oaks: SAGE Publications, pp. 824–28. [Google Scholar]
- Csikosova, Adriana, Katarina Culkova, Erik Weiss, and Maria Janoskova. 2021. Evaluation of market with accommodation facilities considering risk influence—Case study Slovakia. Journal of Risk and Financial Management 14: 208. [Google Scholar] [CrossRef]
- Dahles, Heidi, and Titi Prabawa Susilowati. 2015. Business resilience in times of growth and crisis. Annals of Tourism Research 51: 34–50. [Google Scholar] [CrossRef]
- Das, Gopal, Shailendra Pratap Jain, Durairaj Maheswaran, Rebecca J. Slotegraaf, and Raji Srinivasan. 2021. Pandemics and marketing: Insights, impacts, and research opportunities. Journal of the Academy of Marketing Science 49: 835–54. [Google Scholar] [CrossRef]
- de la Torre, Marina Inés, and David Navarrete Escobedo. 2018. Turismo y narcotráfico en México. Estudios y Perspectivas en Turismo 27: 867–82. [Google Scholar]
- Ďuriš, Viliam. 2020. Geometric applications of measure as a definite integral in mathematics education. Journal of Interdisciplinary Mathematics 23: 739–53. [Google Scholar] [CrossRef]
- Dwyer, Larry, Peter Forsyth, and Ray Spurr. 2004. Evaluating tourism’s economic effects: New and old approaches. Tourism Management 25: 307–17. [Google Scholar] [CrossRef]
- El Economista. 2020. Reanudarán Negocios Sólo a 30% de su Capacidad en QR. Available online: https://www.eleconomista.com.mx/estados/Reanudaran-negocios-solo-a-30-de-su-capacidad-en-QR-20200513-0162.html (accessed on 10 June 2020).
- Eugenio-Martin, Juan L., M. Thea Sinclair, and Ian Yeoman. 2005. Quantifying the effects of tourism crises: An application to Scotland. Journal of Travel & Tourism Marketing 19: 21–34. [Google Scholar]
- Euromonitor International. 2018. Top 100 City Destinations Ranking. WTM London 2017 Edition. London: Passport-Euromonitor. [Google Scholar]
- Euromonitor International. 2021. Tourism Flows in Mexico. London: Passport-Euromonitor. [Google Scholar]
- Faber, Benjamin, and Cecile Gaubert. 2019. Tourism and economic development: Evidence from Mexico’s coastline. American Economic Review 109: 2245–93. [Google Scholar] [CrossRef] [Green Version]
- Farzanegan, Mohammad Reza, Hassan F. Gholipour, Mehdi Feizi, Robin Nunkoo, and Amir Eslami Andargoli. 2021. International tourism and outbreak of coronavirus (COVID-19): A cross-country analysis. Journal of Travel Research 60: 687–92. [Google Scholar] [CrossRef]
- Ferrer, Ernesto Jesús Veres, and José Manuel Pavía Miralles. 2012. La elasticidad: Una nueva herramienta para caracterizar distribuciones de probabilidad. Rect@: Revista Electrónica de Comunicaciones y Trabajos de ASEPUMA 13: 145–58. [Google Scholar]
- Feuerverger, Andrey. 2016. On goodness of fit for operational risk. International Statistical Review 84: 434–55. [Google Scholar] [CrossRef]
- Fitch Ratings. 2020. Municipios Mexicanos en Categoría BBB(mex), Revisión de Portafolio 2019. Available online: https://www.fitchratings.com/research/es/international-public-finance/bbb-municipalities-in-mexico-24-06-2020 (accessed on 5 December 2020).
- Foo, Lee-Peng, Mui-Yin Chin, Kim-Leng Tan, and Kit-Teng Phuah. forthcoming. The impact of COVID-19 on tourism industry in Malaysia. Current Issues in Tourism, 1–5. [CrossRef]
- Forbes. 2020. Ranked: The 10 Countries Most Dependent on Tourism. Available online: https://www.forbes.com/sites/duncanmadden/2020/04/02/ranked-the-10-countries-most-dependent-on-tourism/#1646f66b5939 (accessed on 15 June 2020).
- Fotiadis, Anestis, Stathis Polyzos, and Tzung-Cheng T. C. Huan. 2021. The good, the bad and the ugly on COVID-19 tourism recovery. Annals of Tourism Research 87: 103117. [Google Scholar] [CrossRef]
- García, Jorge Iván Pérez, Mauricio Lopera Castaño, and Fredy Alonso Vásquez Bedoya. 2017. Estimación de la probabilidad de riesgo de quiebra en las empresas colombianas a partir de un modelo para eventos raros. Cuadernos de Administración 30: 7–38. [Google Scholar] [CrossRef] [Green Version]
- García Molina, Mario. 2016. Probabilidad e incertidumbre, una aproximacion desde la historia del pensamiento. Revista de Economia Institucional 18: 101–22. [Google Scholar] [CrossRef]
- Gavurova, Beata, Andrej Privara, Jana Janikova, and Viliam Kovac. 2021. Quantification of tourism sector parameters related to competitiveness of countries according to macroeconomic indicators. Journal of Competitiveness 13: 56–72. [Google Scholar] [CrossRef]
- Goeldner, Charles R., and J. R. Brent Ritchie. 2012. Tourism: Principles, Practices, Philosophies, 12th ed. Hoboken: Wiley. [Google Scholar]
- Gooroochurn, Nishaal, and Chris Milner. 2008. Assessing indirect tax reform in a tourism-dependent developing country. World Development 33: 1183–200. [Google Scholar] [CrossRef]
- Gössling, Stefan, Daniel Scott, and C. Michael Hall. 2021. Pandemics, tourism and global change: A rapid assessment of COVID-19. Journal of Sustainable Tourism 29: 1–20. [Google Scholar] [CrossRef]
- Arnau Gras, Jaume. 2001. Diseños de Series Temporales: Técnicas de Análisis. Barcelona: Edicions Universitat de Barcelona. [Google Scholar]
- Grépin, Karen Ann, Tsi-Lok Ho, Zhihan Liu, Summer Marion, Julianne Piper, Catherine Z. Worsnop, and Kelley Lee. 2021. Evidence of the effectiveness of travel-related measures during the early phase of the COVID-19 pandemic: A rapid systematic review. BMJ Global Health 6: e004537. [Google Scholar] [CrossRef]
- Grossi, Giuseppe, Alfred T. Ho, and Philip G. Joyce. 2020. Budgetary responses to a global pandemic: International experiences and lessons for a sustainable future. Journal of Public Budgeting, Accounting & Financial Management 32: 737–44. [Google Scholar]
- Grubaugh, Nathan D., Emma B. Hodcroft, Joseph R. Fauver, Alexandra L. Phelan, and Muge Cevik. 2021. Public health actions to control new SARS-CoV-2 variants. Cell 184: 1127–32. [Google Scholar] [CrossRef] [PubMed]
- Güemes-Ricalde, Francisco J., and Norman J. Correa-Ruiz. 2009. Comportamiento del mercado turístico extranjero en el Caribe Mexicano. Turismo y Sociedad 10: 30–52. [Google Scholar]
- Guia, Igor Da Guia, C. Garcia, Marco Antonio, and Marcio Nogueira De Souza. 2013. Investigation of probability density functions in modeling sample distribution of surface electromyographic (sEMG) signals. Archives of Control Sciences 23: 381–93. [Google Scholar] [CrossRef]
- Hao, Xuemiao, and Qihe Tang. 2009. Asymptotic ruin probabilities of the Lévy Insurance Model under periodic taxation. ASTIN Bulletin 39: 479–94. [Google Scholar] [CrossRef] [Green Version]
- Hara, Tadayuki. 2008. Quantitative Tourism Industry Analysis. Introduction to Input-Output, Social Accounting Matrix Modeling, and Tourism Satellite Accounts. Burlington: Butterworth-Heinemann/Elsevier. [Google Scholar]
- Hasumi, Tomohiro, Takuma Akimoto, and Yoji Aizawa. 2009. The Weibull–log Weibull distribution for interoccurrence times of earthquakes. Physica A: Statistical Mechanics and its Applications 388: 491–98. [Google Scholar] [CrossRef] [Green Version]
- Hernández Trillo, Fausto, and Bruno Vargas. 2012. Un modelo para la determinatión del riesgo crediticio municipal en México. Investigación Económica 71: 85–119. [Google Scholar]
- Honey, Martha, and William H. Durham. 2013. The big picture: Overview of global trends in coastal and marine tourism. Paper presented at 2nd Executive Symposium for Innovators in Coastal Tourism Development, Los Cabos, Mexico, May 15–18. [Google Scholar]
- Hotel Management. 2020. Destinations Face Tax Decline Due to Tourism Downturn. Available online: https://www.hotelmanagement.net/operate/destinations-face-tax-decline-due-to-tourism-downturn (accessed on 25 June 2021).
- Hoti, Suhejla, Michael McAleer, and Riaz Shareef. 2005. Modelling country risk and uncertainty in small island tourism economies. Tourism Economics 11: 159–83. [Google Scholar] [CrossRef]
- Huang, Arthur, Christos Makridis, Mark Baker, Marcos Medeiros, and Zhishan Guo. 2020. Understanding the impact of COVID-19 intervention policies on the hospitality labor market. International Journal of Hospitality Management 91: 102660. [Google Scholar] [CrossRef]
- Huesca, Luis, Linda Llamas, H. Xavier Jara, CÃsar O. Vargas TÃllez, and David RodrÃguez. 2021. The impact of the COVID-19 pandemic on poverty and inequality in Mexico. Revista Mexicana de Economía y Finanzas 16: e633. [Google Scholar] [CrossRef]
- INEGI. 2020. Cuenta Satélite del Turismo de México, 2019. Comunicado de Prensa Num. 642/20. México: Instituto Nacional de Estadística y Geografía, Available online: https://www.datatur.sectur.gob.mx/SitePages/ProductoDestacado3.aspx (accessed on 20 November 2021).
- International Labour Organization. 2020. COVID-19 Crisis and the Informal Economy. Immediate Responses and Policy Challenges. ILO Brief, May 2020. Geneva: International Labour Organization. [Google Scholar]
- Jäntschi, Lorentz, and Sorana D. Bolboacă. 2018. Computation of probability associated with Anderson–Darling statistic. Mathematics 66: 88. [Google Scholar] [CrossRef] [Green Version]
- Jiang, Yawei, Brent W. Ritchie, and Pierre Benckendorff. 2019. Bibliometric visualisation: An application in tourism crisis and disaster management research. Current Issues in Tourism 22: 1925–57. [Google Scholar] [CrossRef]
- Jiménez-Caballero, José Luis, and Silvia Polo Molina. 2017. A bibliometric analysis of the presence of finances in high-impact tourism journal. Current Issues in Tourism 20: 225–32. [Google Scholar] [CrossRef]
- John Hopkins University. 2021. Coronovirus Resource Center. Available online: https://coronavirus.jhu.edu/data/mortality (accessed on 12 October 2021).
- Kaczmarek, Tomasz, Katarzyna Perez, Ender Demir, and Adam Zaremba. 2021. How to survive a pandemic: The corporate resiliency of travel and leisure companies to the COVID-19 outbreak. Tourism Management 84: 104281. [Google Scholar] [CrossRef]
- Khalid, Usman, Luke Emeka Okafor, and Katarzyna Burzynska. 2021. Does the size of the tourism sector influence the economic policy response to the COVID-19 pandemic? Current Issues in Tourism 24: 2801–20. [Google Scholar] [CrossRef]
- Khan, Asif, Sughra Bibi, Jiaying Lyu, Abdul Latif, and Ardito Lorenzo. 2021. COVID-19 and sectoral employment trends: Assessing resilience in the US leisure and hospitality industry. Current Issues in Tourism 24: 952–69. [Google Scholar] [CrossRef]
- Kido-Cruz, Antonio, and María Teresa Kido-Cruz. 2021. Initial assessment of the impact of the SARS-CoV-19 on tourism in Mexico. Revista Mexicana de Economía y Finanzas 16: e624. [Google Scholar] [CrossRef]
- Kim, Jungkeun, Jooyoung Park, Seongseop Kim, Daniel Chaein Lee, and Marianna Sigala. forthcoming. COVID-19 restrictions and variety seeking in travel choices and actions: The moderating effects of previous experience and crowding. Journal of Travel Research. [CrossRef]
- Krylov, Vladimir, Gabriele Moser, Sebastiano B. Serpico, and Josiane Zerubia. 2009. Dictionary-based probability density function estimation for high-resolution SAR data. Paper presented at Proceedings Volume 7246, Computational Imaging VII, Computational Imaging, San Jose, CA, USA, January 18–22. [Google Scholar]
- Kumar, Satish, Nitesh Pandey, and Sweta Tomar. 2020. Twenty years of Latin American Business Review: A bibliometric overview. Latin American Business Review 21: 197–222. [Google Scholar] [CrossRef]
- Kundu, Anindita, Partha Guchhait, Barun Das, and Manoranjan Maiti. 2019. A multi-item EPQ model with variable demand in an imperfect production process. In Information Technology and Applied Mathematics. Advances in Intelligent Systems and Computing. Edited by Peeyush Chandra, Debasis Giri, Fagen Li, Samarjit Kar and Dipak Kumar Jana. Singapore: Springer, Volume 699, pp. 217–33. [Google Scholar]
- Ladik, Daniel M., and David W. Stewart. 2008. The contribution continuum. Journal of the Academy of Marketing Science 36: 157–65. [Google Scholar] [CrossRef]
- Laesser, Christian, Jürg Stettler, Pietro Beritelli, and Thomas Bieger. 2021. AIEST Consensus on Tourism and Travel in the SARS-CoV-2 Era and Beyond. St. Gallen: AIEST. [Google Scholar]
- Lagunas Puls, Sergio, and Alejandra Almeida Baeza. 2019. Significance analysis to the Value-Added Tax increments for the border region of: Quintana Roo, 2003–15. EconoQuantum 16: 43–64. [Google Scholar] [CrossRef]
- Lagunas Puls, Sergio, Juan Bautista Boggio Vázquez, and Rodrigo Leonardo Guillén Bretón. 2016. Turismo en Cancún, México: Consideraciones sobre la derrama económica. Estudios y Perspectivas en Turismo 25: 375–93. [Google Scholar]
- Landini, Fabio, Alessandro Arrighetti, and Andrea Lasagni. 2018. Economic crisis and firm exit: Do intangibles matter? Industry and Innovation 27: 445–79. [Google Scholar] [CrossRef]
- Lee, Chien-Chiang, and Chun-Ping Chang. 2008. Tourism development and economic growth: A closer look at panels. Tourism Management 29: 180–92. [Google Scholar] [CrossRef]
- Lee, Chien-Chiang, and Mei-Ping Chen. 2021. Do country risks matter for tourism development? International evidence. Journal of Travel Research 60: 1445–68. [Google Scholar] [CrossRef]
- Lim, Weng Marc, and Wai-Ming To. forthcoming. The economic impact of a global pandemic on the tourism economy: The case of COVID-19 and Macao’s destination-and gambling-dependent economy. Current Issues in Tourism. [CrossRef]
- Litvin, Stephen W., Daniel Guttentag, and Wayne W. Smith. forthcoming. Who should you market to in a crisis? Examining Plog’s model during the COVID-19 pandemic. Journal of Travel Research. [CrossRef]
- Loayza, Norman, and Steven Michael Pennings. 2020. Macroeconomic Policy in the Time of COVID-19: A Primer for Developing Countries. Research and Policy Briefs. Number 28 (March). Washington, DC: World Bank. [Google Scholar]
- Mak, James. 2006. Taxation of travel and tourism. In International Handbook on the Economics of Tourism. Edited by Larry Dwyer and Forsyth. Cheltenham: Edward Elgar, pp. 251–65. [Google Scholar]
- Manente, Mara, and Michele Zanette. 2010. Macroeconomic effects of a VAT reduction in the Italian hotels & restaurants industry. Economic Systems Research 22: 407–25. [Google Scholar]
- Mc Coy Cador, Christine, Mario Gabriel Martínez Casas, and Pillivet Aguiar Alayola. 2019. Cancún, emergent city: A proposal to apply the Balance Scorecard model as a method to evaluate sustainability and quality of life. El Periplo Sustentable 37: 241–77. [Google Scholar] [CrossRef]
- McCartney, Glenn. 2021. The impact of the coronavirus outbreak on Macao: From tourism lockdown to tourism recovery. Current Issues in Tourism 24: 2683–92. [Google Scholar] [CrossRef]
- Moreno, Jorge O., and Cecilia Y. Cuellar. 2021. Informality, gender employment gap, and COVID-19 in Mexico: Identifying persistence and dynamic structural effects. Revista Mexicana de Economía y Finanzas 16: e636. [Google Scholar] [CrossRef]
- Oyewole, Philemon. 2009. Prospects for Latin America and Caribbean region in the global market for international tourism: A projection to the year 2020. Journal of Travel and Tourism Marketing 26: 42–59. [Google Scholar] [CrossRef]
- Parvez, Mahbub. 2006. Time value of money: Application and rationality-An approach using differential equations and definite integrals. Journal of Mathematics and Mathematical Sciences 10: 113–21. [Google Scholar]
- Pennington-Gray, Lori. 2018. Reflections to move forward: Where destination crisis management research needs to go. Tourism Management Perspectives 25: 136–39. [Google Scholar] [CrossRef]
- Pham, Le Diem Quynh, Tim Coles, Brent W. Ritchie, and Jie Wang. 2021a. Building business resilience to external shocks: Conceptualising the role of social networks to small tourism & hospitality businesses. Journal of Hospitality and Tourism Management 48: 210–19. [Google Scholar]
- Pham, Tien Duc, Larry Dwyer, Jen-Je Su, and Tramy Ngo. 2021b. COVID-19 impacts of inbound tourism on Australian economy. Annals of Tourism Research 88: 103179. [Google Scholar] [CrossRef]
- Prebensen, Nina, Kåre Skallerud, and Joseph S. Chen. 2010. Tourist motivation withs sun and sand destinations: Satisfaction and the wom-effect. Journal of Travel and Tourism Marketing 27: 858–73. [Google Scholar] [CrossRef]
- Puls, Sergio Lagunas, and Julio César Ramírez Pacheco. 2016. ¿Pueden considerarse significativas las reformas fiscales de México? Revista de Métodos Cuantitativos para la Economía y la Empresa 22: 78–103. [Google Scholar]
- Quinn, Colm. 2020. The tourism industry is in trouble. These countries will suffer the most. Foreign Policy. Available online: https://foreignpolicy.com/2020/04/01/coronavirus-tourism-industry-worst-hit-countries-infographic/ (accessed on 15 July 2020).
- Raki, Amir, Daud Nayer, Amin Nazifi, Matthew Alexander, and Siamak Seyf. 2021. Tourism recovery strategies during major crises: The role of proactivity. Annals of Tourism Research 90: 103144. [Google Scholar] [CrossRef]
- Ramberg, John S., Pandu R. Tadikamalla, Edward J. Dudewicz, and Edward F. Mykytka. 1979. A probability distribution and its uses in fitting data. Technometrics 21: 201–14. [Google Scholar] [CrossRef]
- Ritchie, Hannah, Edouard Mathieu, Lucas Rodés-Guirao, Cameron Appel, Charlie Giattino, Esteban Ortiz-Ospina, Joe Hasell, Bobbie MacDonald, Diana Beltekian, Saloni Dattani, and et al. 2021. Excess Mortality during the Coronavirus Pandemic (COVID-19). Available online: https://ourworldindata.org/excess-mortality-covid (accessed on 15 October 2021).
- Sabatino, Michele. 2016. Economic crisis and resilience: Resilient capacity and competitiveness of the enterprises. Journal of Business Research 69: 1924–27. [Google Scholar] [CrossRef]
- Secretaría de Hacienda y Crédito Público. 2021. Servicio de Adminsitración Tributaria—Datos Abiertos [Padrón Activo de Contribuyentes]. Available online: http://omawww.sat.gob.mx/cifras_sat/Paginas/inicio.html (accessed on 2 September 2021).
- SECTUR. 2016. Estadística Turística Derivada de los Censos Económicos 2014. México: Secretaría de Turismo, Available online: http://www.datatur.sectur.gob.mx/Comite%20de%20Estadisticas%20del%20Sector%20Turismo/CENSOS_ECONOMICOS_2014.pdf (accessed on 15 July 2020).
- SECTUR. 2020. Resultados de la actividad turística. Febrero, 2020. Datatur. México: Secretaría de Turismo. [Google Scholar]
- SEDETUR. 2019. Divisas 2018. Chetumal: Secretaría de Turismo del Estado de Quintana Roo, Available online: https://qroo.gob.mx/portal/divisas-2018/ (accessed on 28 June 2021).
- SEDETUR. 2020. Quintana Roo ¿Cómo vamos en Tuirismo? Enero—Diciembre 2019 vs. 2018. Chetumal: Secretaría de Turismo del Estado de Quintana Roo. [Google Scholar]
- Seetaram, Neelu, and Festus Fatai Adedoyin. forthcoming. Taxation. In Encyclopedia of Tourism Management and Marketing. Edited by Dimitrios Buhalis. [CrossRef]
- Serrano Bautista, Ramona, and José Antonio Núñez Mora. 2020. Valor en riesgo en el sector petrolero: Un análisis de la eficiencia en la medición del riesgo de la distribución α-estable versus las distribuciones t-Student generalizada asimétrica y normal. Contaduría y Administración 65: 1–19. [Google Scholar] [CrossRef]
- Shareef, Riaz, and Suhejla Hoti. 2005. Small island tourism economies and country risk ratings. Mathematics and Computers in Simulation 68: 553–66. [Google Scholar] [CrossRef]
- Sheng, Li, and Yanming Tsui. 2009. Taxing tourism: Enhancing or reducing welfare? Journal of Sustainable Tourism 17: 627–35. [Google Scholar] [CrossRef]
- Sigala, Marianna. 2020. Tourism and COVID-19: Impacts and implications for advancing and resetting industry and research. Journal of Business Research 117: 312–21. [Google Scholar] [CrossRef]
- Standard and Poor’s. 2020. Estados y Municipios Mexicanos Afrontarán una Difícil Tarea en 2021. Available online: https://www.spglobal.com/_assets/documents/ratings/es/pdf/2020-12-15-faq-estados-y-municipios-mexicanos-afrontaran-una-dificil-tarea-en-2021.pdf (accessed on 13 February 2021).
- Statista. 2020. Latin America & Caribbean: Tourism GDP Losses Due to COVID-19 by Scenario 2020 (April). Travel: Tourism & Hospitality Report, Available online: https://www.statista.com/statistics/1121536/coronavirus-impact-tourism-gdp-latin-america-caribbean/ (accessed on 30 June 2020).
- Tatar, Enver, and Yılmaz Zengin. 2016. Conceptual understanding of definite integral with GeoGebra. Computers in the Schools 33: 120–32. [Google Scholar] [CrossRef]
- The New York Times. 2020. Airlines Feel Deepening Impact as Coronavirus Upends Travel. Available online: https://www.nytimes.com/2020/03/04/business/united-airlines-coronavirus.html (accessed on 20 June 2020).
- Travel and Tourism Transformed. 2021. Journal Articles and Teaching & Education Resources for Travel, Tourism & Hospitality in a COVID-19 World. Available online: https://www.tourismtransformed.com/teaching.html (accessed on 20 August 2021).
- Tsionas, Mike G. forthcoming. COVID-19 and gradual adjustment in the tourism, hospitality, and related industries. Tourism Economics. [CrossRef]
- USNews. 2020. Places You Should Not Visit Right Now. Available online: https://www.usnews.com/news/best-countries/slideshows/places-the-us-government-warns-not-to-travel-right-now (accessed on 15 June 2020).
- Valaskova, Katarina, Pavol Durana, and Peter Adamko. 2021. Changes in consumers’ purchase patterns as a consequence of the COVID-19 pandemic. Mathematics 9: 1788. [Google Scholar] [CrossRef]
- Vanegas, Marisol. 2021. Reconstrucción Turística Ante el COVID y su Impacto en el Turismo: Los Retos de los Prestadores de Servicio. XIX Seminario Anual de Turismo y Sustentabilidad. Cancún: Universidad del Caribe. [Google Scholar]
- Vogt, W. Paul, and R. Burke Johnson. 2016. The SAGE Dictionary of Statistics & Methodology, 5th ed. Thousand Oaks: SAGE Publications. [Google Scholar]
- Walsh, Grace S., and James Cunningham. 2016. Business failure and entrepreneurship: Emergence, evolution and future research. Foundations and Trends in Entrepreneurship 12: 163–285. [Google Scholar] [CrossRef] [Green Version]
- Whetten, David A. 1989. What constitutes a theoretical contribution? Academy of Management Review 14: 490–95. [Google Scholar] [CrossRef]
- Wickramasinghe, Kanchana, and Shyama Ratnasiri. 2021. The role of disaggregated search data in improving tourism forecasts: Evidence from Sri Lanka. Current Issues in Tourism 24: 2740–54. [Google Scholar] [CrossRef]
- World Bank. 2020. Doing Business: Measuring Business Regulations. Available online: https://www.doingbusiness.org/en/rankings (accessed on 5 July 2020).
- World Tourism Organization. 2019. UNWTO Tourism Highlights, 2019th ed. Madrid: UNWTO. [Google Scholar]
- World Tourism Organization. 2020. Impact Assessment of the COVID-19 Outbreak on International Tourism. Madrid: UNWTO, Available online: https://webunwto.s3.eu-west-1.amazonaws.com/s3fs-public/2020-03/UNWTO-Impact-Assessment-COVID19.pdf (accessed on 15 November 2020).
- World Tourism Organization. 2021. The UNWTO/IATA Destination Tracker. Available online: https://www.unwto.org/unwto-iata-destination-tracker (accessed on 16 September 2021).
- World Travel and Tourism Council. 2020a. WTTC Launches World’s First Ever Global Safety Stamp to Recognise ‘Safe Travels’ Protocols around the World. London: WTTC, Available online: https://wttc.org/News-Article/WTTC-launches-worlds-first-ever-global-safety-stamp-to-recognise-safe-travels-protocols-around-the-world (accessed on 7 October 2020).
- World Travel and Tourism Council. 2020b. WTTC/Oxford Economics 2020 Travel & Tourism Economic Impact Research Methodology. London: World Travel & Tourism Council, Available online: https://wttc.org/Portals/0/Documents/Reports/2020/WTTC%20Methodology%20Report%202020.pdf?ver=2021-02-25-183105-660 (accessed on 20 November 2021).
- World Travel and Tourism Council. 2021. Travel & Tourism Economic Impact 2021. London: WTTC, Available online: https://wttc.org/Portals/0/Documents/Reports/2021/Global%20Economic%20Impact%20and%20Trends%202021.pdf?ver=2021-07-01-114957-177 (accessed on 30 September 2021).
- Xiao, Honggen. 2010. Case study research in tourism. In Encyclopedia of Case Study Research. Edited by Albert James Mills, Gabrielle Durepos and Elden Wiebe. Thousand Oaks: SAGE Publications, Inc, pp. 122–25. [Google Scholar]
- Yang, Yang, Benjamin Altschuler, Zhengkang Liang, and Xiang Li. 2021a. Monitoring the global COVID-19 impact on tourism: The COVID19tourism index. Annals of Tourism Research 90: 103120. [Google Scholar] [CrossRef] [PubMed]
- Yang, Yang, Carol X. Zhang, and Jillian M. Rickly. 2021b. A review of early COVID-19 research in tourism: Launching the Annals of Tourism Research’s Curated Collection on coronavirus and tourism. Annals of Tourism Research 91: 103313. [Google Scholar] [CrossRef]
- Yang, Yang, Hongru Zhang, and Xiang Chen. 2020. Coronavirus pandemic and tourism: Dynamic stochastic general equilibrium modeling of infectious disease outbreak. Annals of Tourism Research 83: 102913. [Google Scholar] [CrossRef] [PubMed]
- Zenker, Sebastian, and Florian Kock. 2020. The coronavirus pandemic—A critical discussion of a tourism research agenda. Tourism Management 81: 104164. [Google Scholar] [CrossRef]
- Zhang, Chao-zhi, and Xiao-tao Lin. 2017. Tourism Planning. In The SAGE International Encyclopedia of Travel & Tourism. Edited by Linda L. Lowry. Thousand Oaks: SAGE Publications, pp. 1253–57. [Google Scholar]


| Variable | ||
|---|---|---|
| Registered taxpayer entities in Quintana Roo (state). | 1,016,905 | 93,916 |
| Registered taxpayer entities in Mexico (national). | 69,332,815 | 6,302,380 |
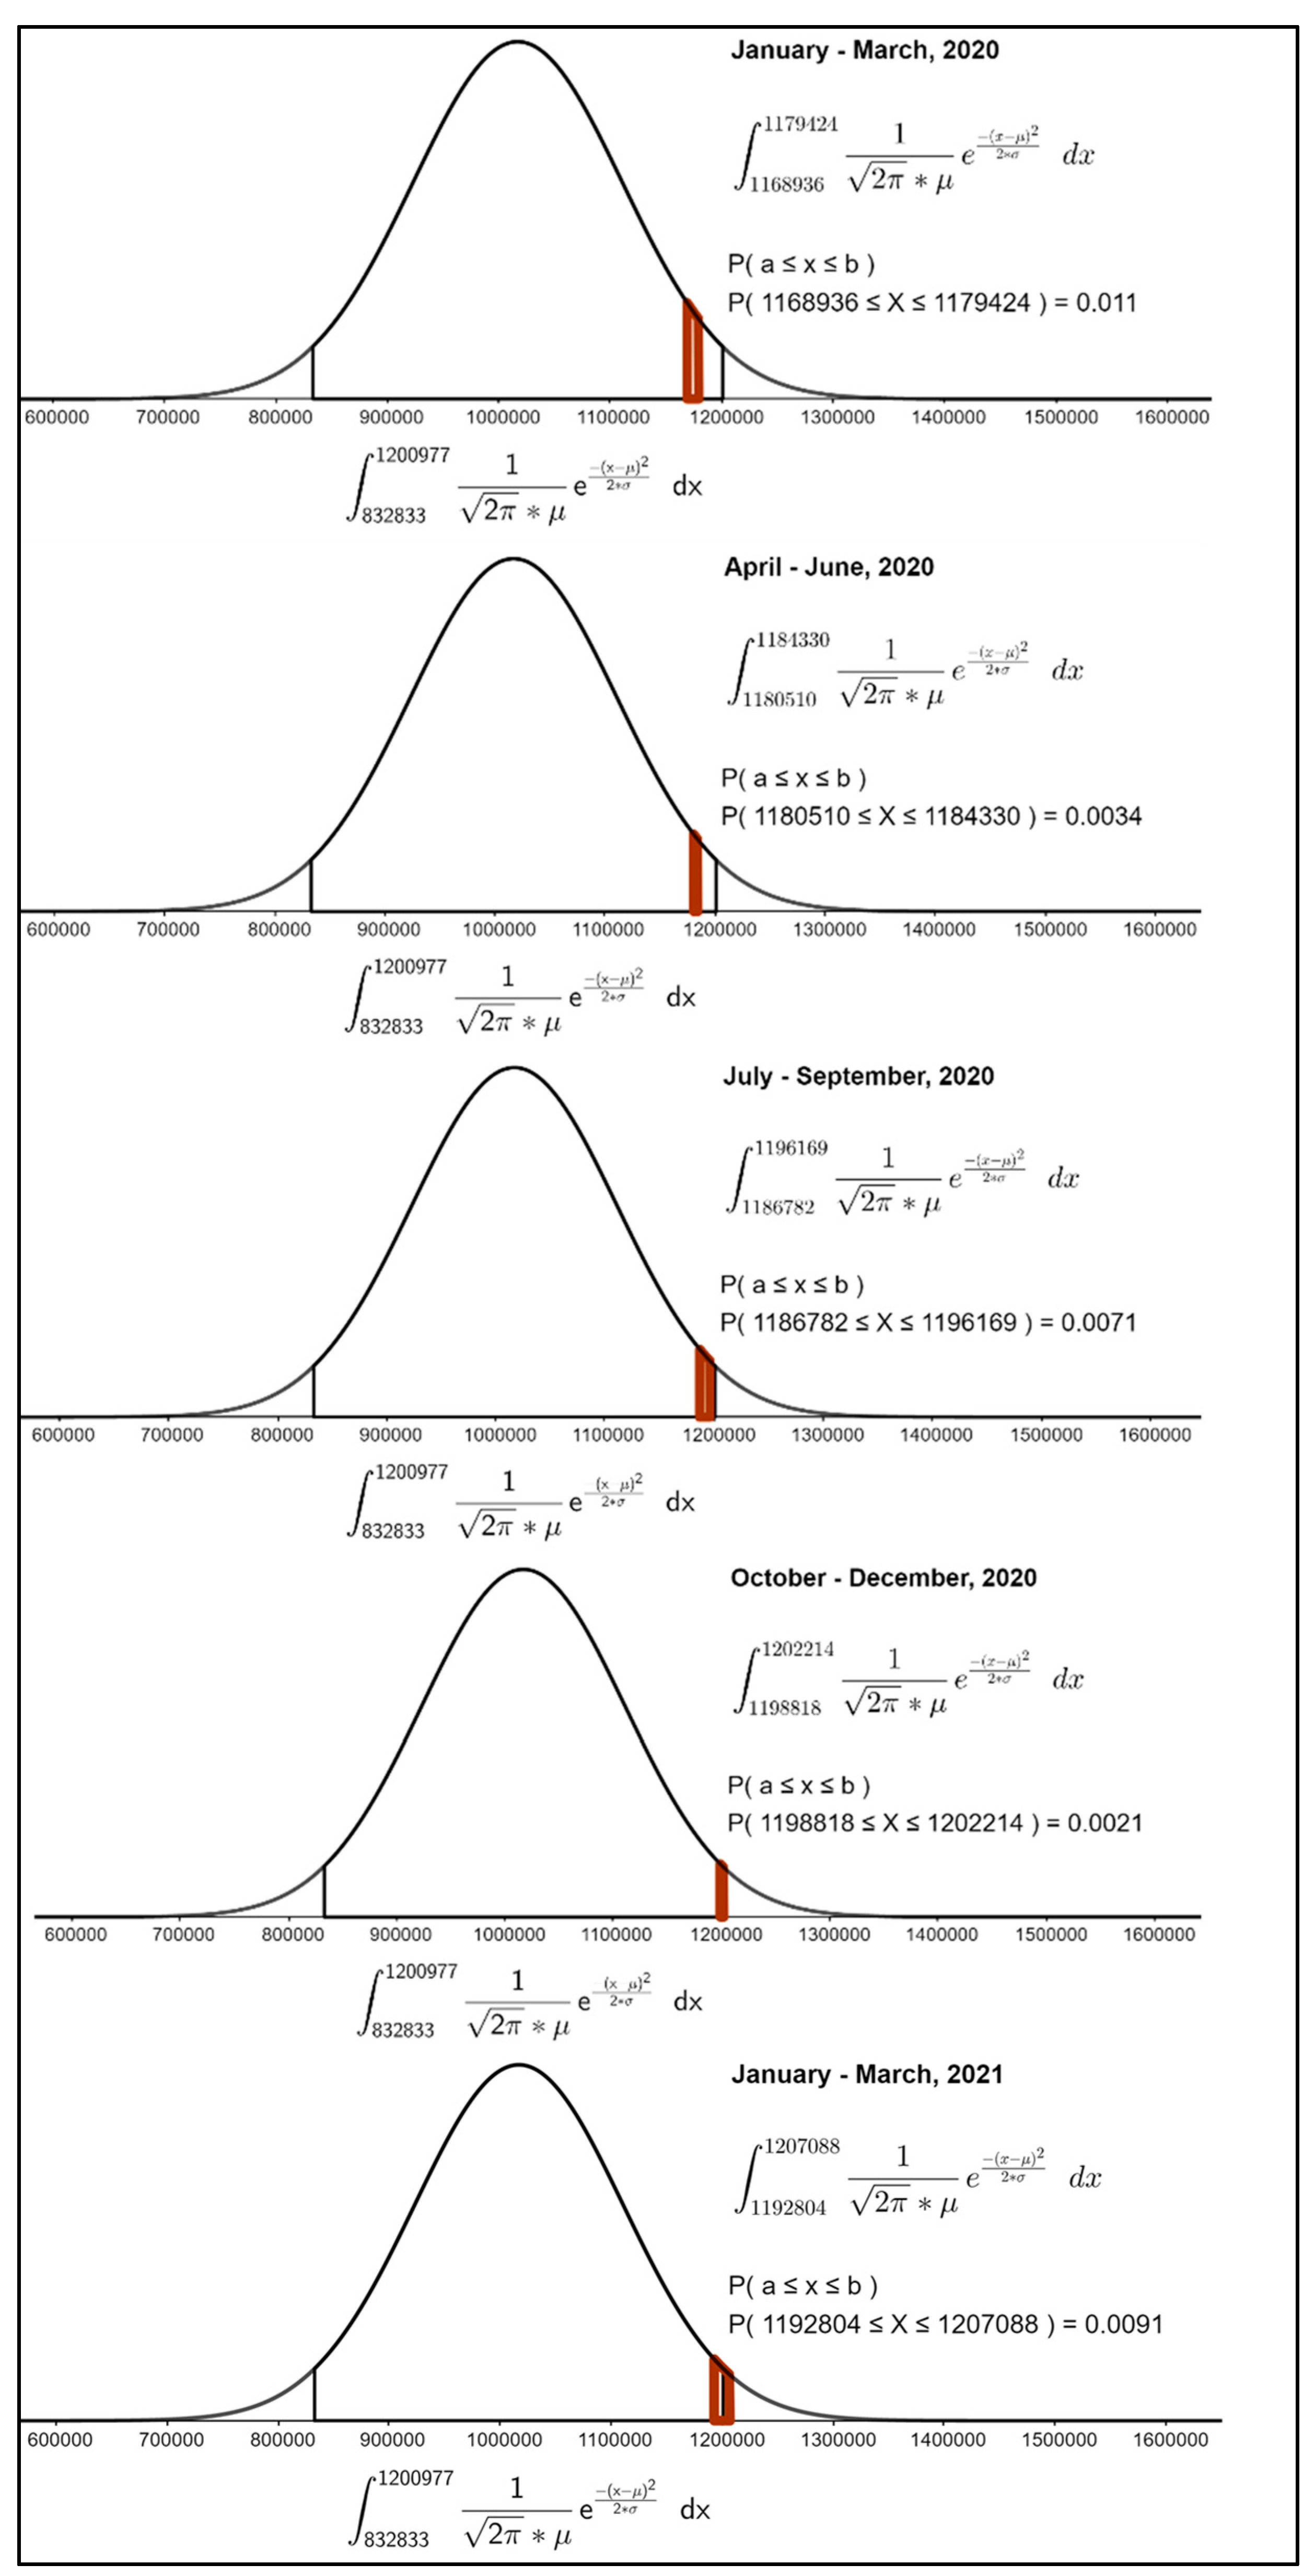
| Quarter 1, 2020 1 | January | 1,168,936 | |
| February | 1,175,238 | ||
| March | 1,179,424 | ||
| Quarter 2, 2020 1 | April | 1,180,510 | |
| May | 1,181,799 | ||
| June | 1,184,330 | ||
| Quarter 3, 2020 1 | July | 1,186,782 | |
| August | 1,189,373 | ||
| September | 1,196,169 | ||
| Quarter 4, 2020 1 | October | 1,198,818 | |
| November | 1,202,214 | ||
| December | 1,200,919 | ||
| Quarter 1, 2021 1 | January | 1,203,422 | |
| February | 1,207,088 | ||
| March | 1,192,804 |
| Quarter 1, 2020 1 | January | 77,706,166 | |
| February | 78,099,153 | ||
| March | 78,360,839 | ||
| Quarter 2, 2020 1 | April | 78,470,475 | |
| May | 78,595,530 | ||
| June | 78,764,187 | ||
| Quarter 3, 2020 1 | July | 78,963,137 | |
| August | 79,163,535 | ||
| September | 79,659,718 | ||
| Quarter 4, 2020 1 | October | 79,855,872 | |
| November | 80,044,868 | ||
| December | 79,756,507 | ||
| Quarter 1, 2021 1 | January | 79,918,870 | |
| February | 80,136,246 | ||
| March | 78,883,432 |
Publisher’s Note: MDPI stays neutral with regard to jurisdictional claims in published maps and institutional affiliations. |
© 2021 by the authors. Licensee MDPI, Basel, Switzerland. This article is an open access article distributed under the terms and conditions of the Creative Commons Attribution (CC BY) license (https://creativecommons.org/licenses/by/4.0/).
Share and Cite
Cruz-Milan, O.; Lagunas-Puls, S. Effects of COVID-19 on Variations of Taxpayers in Tourism-Reliant Regions: The Case of the Mexican Caribbean. J. Risk Financial Manag. 2021, 14, 578. https://doi.org/10.3390/jrfm14120578
Cruz-Milan O, Lagunas-Puls S. Effects of COVID-19 on Variations of Taxpayers in Tourism-Reliant Regions: The Case of the Mexican Caribbean. Journal of Risk and Financial Management. 2021; 14(12):578. https://doi.org/10.3390/jrfm14120578
Chicago/Turabian StyleCruz-Milan, Oliver, and Sergio Lagunas-Puls. 2021. "Effects of COVID-19 on Variations of Taxpayers in Tourism-Reliant Regions: The Case of the Mexican Caribbean" Journal of Risk and Financial Management 14, no. 12: 578. https://doi.org/10.3390/jrfm14120578
APA StyleCruz-Milan, O., & Lagunas-Puls, S. (2021). Effects of COVID-19 on Variations of Taxpayers in Tourism-Reliant Regions: The Case of the Mexican Caribbean. Journal of Risk and Financial Management, 14(12), 578. https://doi.org/10.3390/jrfm14120578