
Time-Varying Risk and the Relation between Idiosyncratic Risk and Stock Return


Abstract
:1. Introduction
2. Data and Methodology
3. Empirical Results
4. Conclusions
Funding
Institutional Review Board Statement
Informed Consent Statement
Data Availability Statement
Conflicts of Interest
Appendix A

| Whole Period | 1960s | 1970s | 1980s | 1990s | 2000s | 2010s | |
|---|---|---|---|---|---|---|---|
| Intercept | 1.480 *** | 1.141 | 1.591 ** | 1.311 ** | 0.565 | 2.095 *** | 2.032 *** |
| (5.52) | (1.56) | (2.13) | (1.77) | (0.98) | (3.61) | (4.39) | |
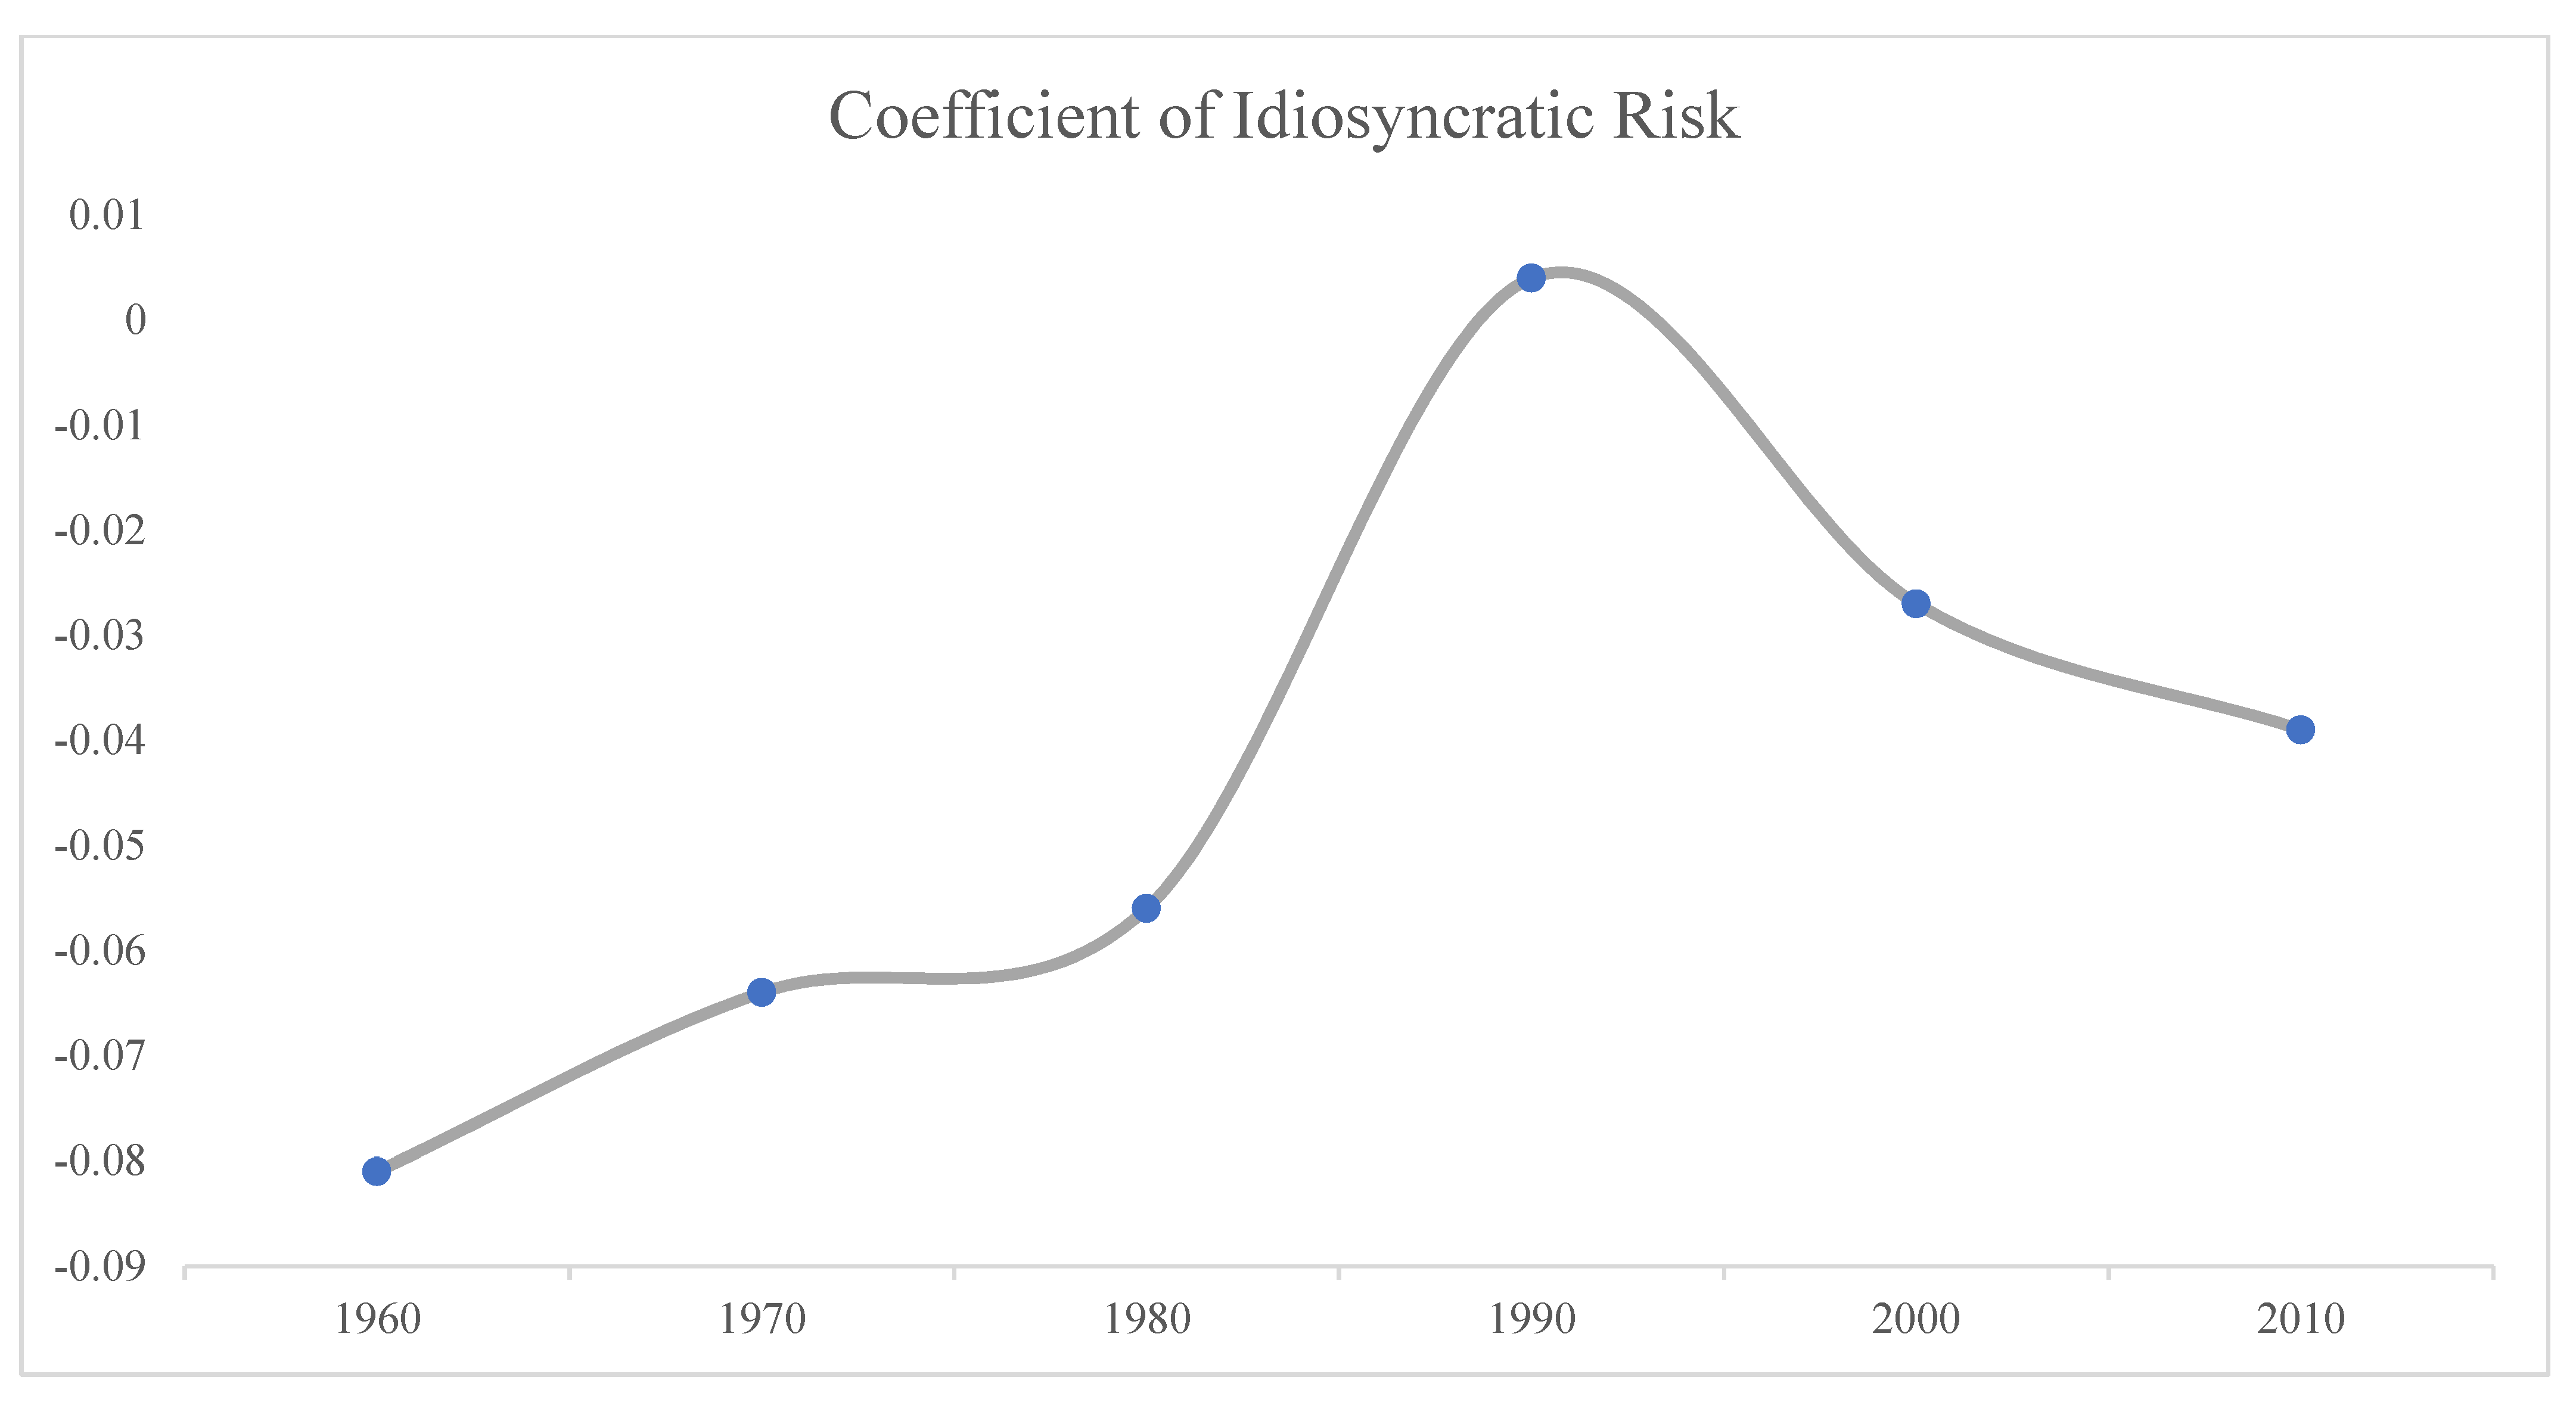
| Idio | −0.040 *** | −0.072 *** | −0.069 *** | −0.048 *** | 0.002 | −0.025 * | −0.037 *** |
| (−6.05) | (−3.11) | (−4.33) | (−4.94) | (0.18) | (−1.78) | (−3.62) | |
| Beta | 0.430 *** | 0.205 | 0.740 * | 0.448 | 0.545 | 0.223 | 0.171 |
| (2.72) | (0.63) | (1.82) | (1.04) | (1.30) | (0.51) | (0.67) | |
| Size | −0.177 *** | −0.312 *** | −0.253 *** | −0.015 | −0.218 *** | −0.177 *** | −0.082 |
| (−5.21) | (−3.54) | (−2.82) | (−0.16) | (−2.65) | (−2.39) | (−1.56) | |
| B/M | 0.170 *** | 0.025 | 0.161 | 0.397 *** | 0.154 | 0.184 | −0.024 |
| (3.67) | (0.52) | (1.17) | (4.40) | (1.20) | (1.55) | (−0.24) | |
| Momentum | 0.773 *** | 1.586 *** | 0.622 | 0.544 ** | 1.290 *** | 0.327 | 0.270 |
| (5.74) | (4.20) | (1.56) | (2.22) | (4.34) | (1.16) | (1.07) | |
| TURN | −0.208 *** | 0.025 | −0.162 | −0.383 *** | −0.212 * | −0.052 | −0.310 *** |
| (−4.41) | (0.16) | (−1.58) | (−4.78) | (−1.78) | (−0.46) | (−3.73) | |
| CVTURN | −0.331 *** | −0.174 | −0.273 *** | −0.092 | −0.805 *** | −0.391 ** | −0.391 *** |
| (−5.81) | (−1.14) | (−2.63) | (−0.80) | (−6.62) | (−2.26) | (−3.15) | |
| 0.077 *** | 0.115 *** | 0.087 *** | 0.061 *** | 0.078 *** | 0.077 *** | 0.058 *** | |
| (18.00) | (8.98) | (8.95) | (8.14) | (7.96) | (7.60) | (8.18) |
| Whole Period | 1960s | 1970s | 1980s | 1990s | 2000s | 2010s | |
|---|---|---|---|---|---|---|---|
| Intercept | 1.449 *** | 1.107 | 1.568 ** | 1.263 * | 0.548 | 2.085 *** | 1.982 *** |
| (5.40) | (1.52) | (2.11) | (1.73) | (0.93) | (3.55) | (4.24) | |
| Idio | −0.041 *** | −0.075 *** | −0.073 *** | −0.050 *** | 0.003 | −0.026 * | −0.038 *** |
| (−5.96) | (−3.31) | (−4.25) | (−4.68) | (0.22) | (−1.77) | (−3.64) | |
| Beta | 0.426 *** | 0.203 | 0.734 * | 0.441 | 0.542 | 0.219 | 0.167 |
| (2.696) | (0.63) | (1.80) | (1.03) | (1.29) | (0.50) | (0.66) | |
| Size | −0.175 *** | −0.311 *** | −0.251 *** | −0.012 | −0.216 *** | −0.176 *** | −0.079 |
| (−5.17) | (−3.53) | (−2.81) | (−0.13) | (−2.64) | (−2.39) | (−1.49) | |
| B/M | 0.171 *** | 0.026 | 0.161 | 0.399 *** | 0.156 | 0.184 | −0.025 |
| (3.68) | (0.54) | (1.17) | (4.42) | (1.22) | (1.56) | (−0.25) | |
| Momentum | 0.780 *** | 1.594 *** | 0.625 | 0.557 ** | 1.292 *** | 0.326 | 0.283 |
| (5.79) | (4.28) | (1.57) | (2.28) | (4.32) | (1.16) | (1.09) | |
| TURN | −0.213 *** | 0.017 | −0.167 | −0.387 *** | −0.213 * | −0.055 | −0.316 *** |
| (−4.49) | (0.11) | (−1.63) | (−4.86) | (−1.78) | (−0.49) | (−3.76) | |
| CVTURN | −0.332 *** | −0.178 | −0.274 ** | −0.091 | −0.808 *** | −0.392 ** | −0.390 *** |
| (−5.81) | (−1.16) | (−2.62) | (−0.80) | (−6.60) | (−2.25) | (−3.17) | |
| 0.077 *** | 0.115 *** | 0.087 *** | 0.061 *** | 0.078 *** | 0.078 *** | 0.057 *** | |
| (18.02) | (8.97) | (8.94) | (8.12) | (7.99) | (7.61) | (8.27) |
| Whole Period | 1960s | 1970s | 1980s | 1990s | 2000s | 2010s | |
|---|---|---|---|---|---|---|---|
| Intercept | 1.341 *** | 0.936 | 1.431 ** | 1.237 ** | 0.413 | 1.871 *** | 2.007 *** |
| (6.17) | (1.21) | (2.17) | (1.99) | (0.70) | (3.00) | (4.21) | |
| Idio | −0.043 *** | −0.078 *** | −0.067 *** | −0.049 *** | 0.004 | −0.025 ** | −0.039 *** |
| (−6.31) | (−3.56) | (−4.87) | (−5.84) | (0.36) | (−2.35) | (−3.70) | |
| Beta | 0.401 ** | 0.231 | 0.786 | 0.387 | 0.631 | 0.081 | 0.161 |
| (2.32) | (0.59) | (1.57) | (0.88) | (1.40) | (0.74) | (0.58) | |
| Size | −0.176 *** | −0.281 *** | −0.235 *** | −0.046 | −0.219 *** | −0.225 *** | −0.074 |
| (−5.78) | (−3.56) | (−3.39) | (−0.62) | (−2.74) | (−3.64) | (−1.33) | |
| B/M | 0.148 *** | 0.052 | 0.237 ** | 0.289 *** | 0.168 | 0.042 | −0.021 |
| (3.51) | (0.97) | (1.83) | (3.21) | (1.41) | (0.31) | (−0.20) | |
| Momentum | 0.712 *** | 1.508 *** | 0.458 | 0.711 *** | 1.288 *** | 0.309 | 0.268 |
| (5.05) | (4.37) | (1.11) | (3.01) | (4.54) | (0.52) | (1.01) | |
| TURN | −0.104 *** | −0.065 | −0.209 ** | −0.357 *** | −0.221 ** | 0.063 | −0.311 *** |
| (−4.54) | (−0.42) | (−2.21) | (−4.76) | (−2.00) | (0.61) | (−3.69) | |
| CVTURN | −0.298 *** | −0.219 | −0.305 *** | −0.068 | −0.816 *** | −0.374 ** | −0.381 *** |
| (−5.20) | (−1.48) | (−3.16) | (−0.59) | (−7.03) | (−2.55) | (−3.08) | |
| 0.091 *** | 0.119 *** | 0.102 *** | 0.072 *** | 0.075 *** | 0.093 *** | 0.058 *** | |
| (18.75) | (9.85) | (9.73) | (10.25) | (8.55) | (7.84) | (8.28) |
| Whole Period | Contraction of GFC | Excluding GFC | Dot-Com Bubble | Excluding Dot-Com Bubble | |
|---|---|---|---|---|---|
| Intercept | 1.388 *** | −0.039 | 1.427 *** | 2.085 | 1.363 *** |
| (5.25) | (−0.02) | (5.38) | (1.63) | (5.09) | |
| Idio | −0.042 *** | −0.040 *** | −0.042 *** | −0.022 | −0.043 *** |
| (−6.95) | (−2.93) | (−6.78) | (−0.49) | (−7.19) | |
| Beta | 0.423 ** | −0.357 | 0.444 ** | −1.470 | 0.492 ** |
| (2.16) | (−0.10) | (2.57) | (−1.53) | (2.46) | |
| Size | −0.186 *** | −0.318 ** | −0.183 *** | −0.297 | −0.182 *** |
| (−6.08) | (−2.16) | (−5.87) | (−1.31) | (−6.00) | |
| B/M | 0.154 *** | −0.515 | 0.172 *** | −0.012 | 0.160 *** |
| (3.46) | (−1.22) | (3.95) | (−0.05) | (3.62) | |
| Momentum | 0.753 *** | 0.102 | 0.771 *** | 0.930 | 0.747 *** |
| (5.28) | (0.05) | (5.72) | (1.05) | (5.22) | |
| TURN | −0.188 *** | 0.403 | −0.204 *** | 0.443 | −0.211 *** |
| (−4.23) | (1.33) | (−4.60) | (1.27) | (−4.80) | |
| CVTURN | −0.327 *** | −0.183 | −0.331 *** | −1.107 *** | −0.299 *** |
| (−6.19) | (−0.34) | (−6.32) | (−2.99) | (−5.77) | |
| 0.087 *** | 0.191 *** | 0.084 *** | 0.158 *** | 0.084 *** | |
| (19.00) | (5.11) | (19.18) | (5.82) | (18.74) |
| 1 | The website is http://mba.tuck.dartmouth.edu/pages/faculty/ken.french/data_library.html (accessed on 1 June 2021). We thank Professor French to make this data available. |
| 2 | See, for example, Han and Lesmond (2011). |
| 3 | The dates are obtained from: https://www.nber.org/research/business-cycle-dating (accessed on 1 June 2021). |
| 4 | See, for example, Ljungqvist and Wilhelm (2003). |
References
- Aabo, Tom, Christos Pantzalis, and Jung Chul Park. 2017. Idiosyncratic volatility: An indicator of noise trading? Journal of Banking and Finance 75: 136–51. [Google Scholar] [CrossRef] [Green Version]
- Adam, Klaus, Albert Marcet, and JuanPablo Nicolini. 2015. Stock Market Volatility and Learning. The Journal of Finance 71: 33–82. [Google Scholar] [CrossRef] [Green Version]
- Andersen, Torben G., Tim Bollerslev, Francis X. Diebold, and Heiko Ebens. 2001. The distribution of realized stock return volatility. Journal of Financial Economics 61: 43–76. [Google Scholar] [CrossRef]
- Ang, Andrew, Robert J. Hodrick, Yuhang Xing, and Xiaoyan Zhang. 2006. The cross-section of volatility and expected returns. The Journal of Finance 61: 259–99. [Google Scholar] [CrossRef] [Green Version]
- Aslanidis, Nektarios, Charlotte Christiansen, and Christos S. Savva. 2021. Quantile Risk–Return Trade-Off. Journal of Risk and Financial Management 14: 249. [Google Scholar] [CrossRef]
- Becchetti, Leonardo, Rocco Ciciretti, and Iftekhar Hasan. 2015. Corporate social responsibility, stakeholder risk, and idiosyncratic volatility. Journal of Corporate Finance 35: 297–309. [Google Scholar] [CrossRef]
- Behrendt, Simon, and Alexander Schmidt. 2018. The Twitter myth revisited: Intraday investor sentiment, Twitter activity and individual-level stock return volatility. Journal of Banking and Finance 96: 355–67. [Google Scholar] [CrossRef]
- Bekaert, Geert, Robert J. Hodrick, and Xiaoyan Zhang. 2012. Aggregate Idiosyncratic Volatility. Journal of Financial and Quantitative Analysis 47: 1155–85. [Google Scholar] [CrossRef]
- Bodie, Zvi. 1995. On the risk of stocks in the long run. Financial Analysts Journal 51: 18–22. [Google Scholar] [CrossRef]
- Campbell, John Y., Martin Lettau, Burton G. Malkiel, and Yexiao Xu. 2001. Have Individual Stocks Become More Volatile? An Empirical Exploration of Idiosyncratic Risk. The Journal of Finance 56: 1–43. [Google Scholar] [CrossRef]
- Cao, Jie, Tarun Chordia, and Xintong Zhan. 2021. The Calendar Effects of the Idiosyncratic Volatility Puzzle: A Tale of Two Days? Management Science. [Google Scholar] [CrossRef]
- Cao, Jie, and Bing Han. 2013. Cross section of option returns and idiosyncratic stock volatility. Journal of Financial Economics 108: 231–49. [Google Scholar] [CrossRef]
- Cao, Charles, Timothy Simin, and Jing Zhao. 2008. Can Growth Options Explain the Trend in Idiosyncratic Risk? The Review of Financial Studies 21: 2599–633. [Google Scholar] [CrossRef] [Green Version]
- Carhart, Mark M. 1997. On Persistence in Mutual Fund Performance. The Journal of Finance 52: 57–82. [Google Scholar] [CrossRef]
- Chen, Zhian, Jinmin Du, Donghui Li, and Rui Ouyang. 2013. Does foreign institutional ownership increase return volatility? Evidence from China. Journal of Banking and Finance 37: 660–69. [Google Scholar] [CrossRef]
- Chiang, Thomas C., and Jiandong Li. 2012. Stock Returns and Risk: Evidence from Quantile. Journal of Risk and Financial Management 5: 20–58. [Google Scholar] [CrossRef]
- Chordia, Tarun, Avanidhar Subrahmanyam, and V. Ravi Anshuman. 2001. Trading activity and expected stock returns. Journal of Financial Economics 59: 3–32. [Google Scholar] [CrossRef]
- Danielsson, Jon, Marcela Valenzuela, and Ilknur Zer. 2018. Learning from history: volatility and financial crises. The Review of Financial Studies 31: 2774–805. [Google Scholar] [CrossRef]
- Fama, Eugene F., and Kenneth R. French. 1992. The cross-section of expected stock returns. The Journal of Finance 47: 427–65. [Google Scholar] [CrossRef]
- Fama, Eugene F., and Kenneth R. French. 2015. A five-factor asset pricing model. Journal of Financial Economics 116: 1–22. [Google Scholar] [CrossRef] [Green Version]
- Fama, Eugene F., and James D. MacBeth. 1973. Risk, Return, and Equilibrium: Empirical Tests. Journal of Political Finance 81: 607–36. [Google Scholar] [CrossRef]
- Ferson, Wayne E., and Campbell R. Harvey. 1999. Conditioning variables and the cross section of stock returns. The Journal of Finance 54: 1325–60. [Google Scholar] [CrossRef]
- Fu, Chengbo. 2018. Alpha Beta Risk and Stock Returns—A Decomposition Analysis of Idiosyncratic Volatility with Conditional Models. Risks 6: 124. [Google Scholar] [CrossRef] [Green Version]
- Fu, Fangjian. 2009. Idiosyncratic risk and the cross-section of expected stock returns. Journal of Financial Economics 91: 24–37. [Google Scholar] [CrossRef]
- Fink, Jason, Kristin E. Fink, Gustavo Grullon, and James P. Weston. 2010. What Drove the Increase in Idiosyncratic Volatility during the Internet Boom? Journal of Financial and Quantitative Analysis 45: 1253–78. [Google Scholar] [CrossRef] [Green Version]
- Han, Yufeng, and David Lesmond. 2011. Liquidity Biases and the Pricing of Cross-sectional Idiosyncratic Volatility. The Review of Financial Studies 24: 1590–629. [Google Scholar] [CrossRef]
- Harjoto, Maretno A., and Hoje Jo. 2015. Legal vs. Normative CSR: Differential Impact on Analyst Dispersion, Stock Return Volatility, Cost of Capital, and Firm Value. Journal of Business Ethics 128: 1–20. [Google Scholar] [CrossRef]
- Herskovic, Bernard, Bryan Kelly, Hanno Lustig, and StijnVan Nieuwerburgh. 2016. The common factor in idiosyncratic volatility: Quantitative asset pricing implications. Journal of Financial Economics 119: 249–83. [Google Scholar] [CrossRef]
- Hou, Kewei, and Roger K. Loh. 2016. Have we solved the idiosyncratic volatility puzzle? Journal of Financial Economics 121: 167–94. [Google Scholar] [CrossRef]
- Huang, Wei, Qianqiu Liu, S. Ghon Rhee, and Liang Zhang. 2010. Return Reversals, Idiosyncratic Risk, and Expected Returns. The Review of Financial Studies 23: 147–68. [Google Scholar] [CrossRef] [Green Version]
- Huang, Teng-Ching, Bing-Huei Lin, and Tung-Hsiao Yang. 2015. Herd behavior and idiosyncratic volatility. Journal of Business Research 68: 763–70. [Google Scholar] [CrossRef]
- Kambouroudis, Dimos S., David G. McMillan, and Katerina Tsakou. 2016. Forecasting Stock Return Volatility: A Comparison of GARCH, Implied Volatility, and Realized Volatility Models. The Journal of Future Markets 36: 1127–63. [Google Scholar] [CrossRef]
- Li, Donghui, Quang N. Nguyen, Peter K. Pham, and Steven X. Wei. 2011. Large Foreign Ownership and Firm-Level Stock Return Volatility in Emerging Markets. Journal of Financial and Quantitative Analysis 46: 1127–55. [Google Scholar] [CrossRef] [Green Version]
- Li, Qi, Jian Yang, Cheng Hsiao, and Young-Jae Chang. 2005. The relationship between stock returns and volatility in international stock markets. Journal of Empirical Finance 12: 650–65. [Google Scholar] [CrossRef]
- Ljungqvist, Alexander, and William J. Wilhelm Jr. 2003. IPO Pricing in the Dot-com Bubble. The Journal of Finance 58: 723–52. [Google Scholar] [CrossRef] [Green Version]
- Lu, Yang K., and Pierre Perron. 2010. Modeling and forecasting stock return volatility using a random level shift model. Journal of Empirical Finance 17: 138–56. [Google Scholar] [CrossRef]
- Markowitz, Harry. 1952. Portfolio Selection. The Journal of Finance 7: 77–91. [Google Scholar]
- Molnar, Peter. 2016. High-low range in GARCH models of stock return volatility. Applied Economics 51: 4977–91. [Google Scholar] [CrossRef]
- Olbrys, Joanna. 2021. The Global Financial Crisis 2007–2009: A Survey. Available online: https://ssrn.com/abstract=3872477 (accessed on 30 August 2021). [CrossRef]
- Pan, Yihui, Tracy Yue Wang, and Michael S. Weisbach. 2015. Learning about CEO Ability and Stock Return Volatility. The Review of Financial Studies 28: 1623–66. [Google Scholar] [CrossRef]
- Schwert, G. 1989. Schwert, G. William 1989. Why dose stock market volatility change over time? The Journal of Finance 44: 1115–53. [Google Scholar] [CrossRef]
- Stambaugh, Robert F., Jianfeng Yu, and Yu Yuan. 2015. Arbitrage Asymmetry and the Idiosyncratic Volatility Puzzle. The Journal of Finance 70: 1903–48. [Google Scholar] [CrossRef] [Green Version]
- Vo, Xuan Vinh, and Craig Ellis. 2018. International financial integration: Stock return linkages and volatility transmission between Vietnam and advanced countries. Emerging Markets Review 36: 19–27. [Google Scholar] [CrossRef]
- Vo, Xuan Vinh, and Dang Bao Anh Phan. 2019. Herd behavior and idiosyncratic volatility in a frontier market. Pacific-Basin Finance Journal 53: 321–30. [Google Scholar] [CrossRef]
- Zumbach, Gilles. 2010. Volatility conditional on price trends. Quantitative Finance 10: 431–42. [Google Scholar] [CrossRef] [Green Version]


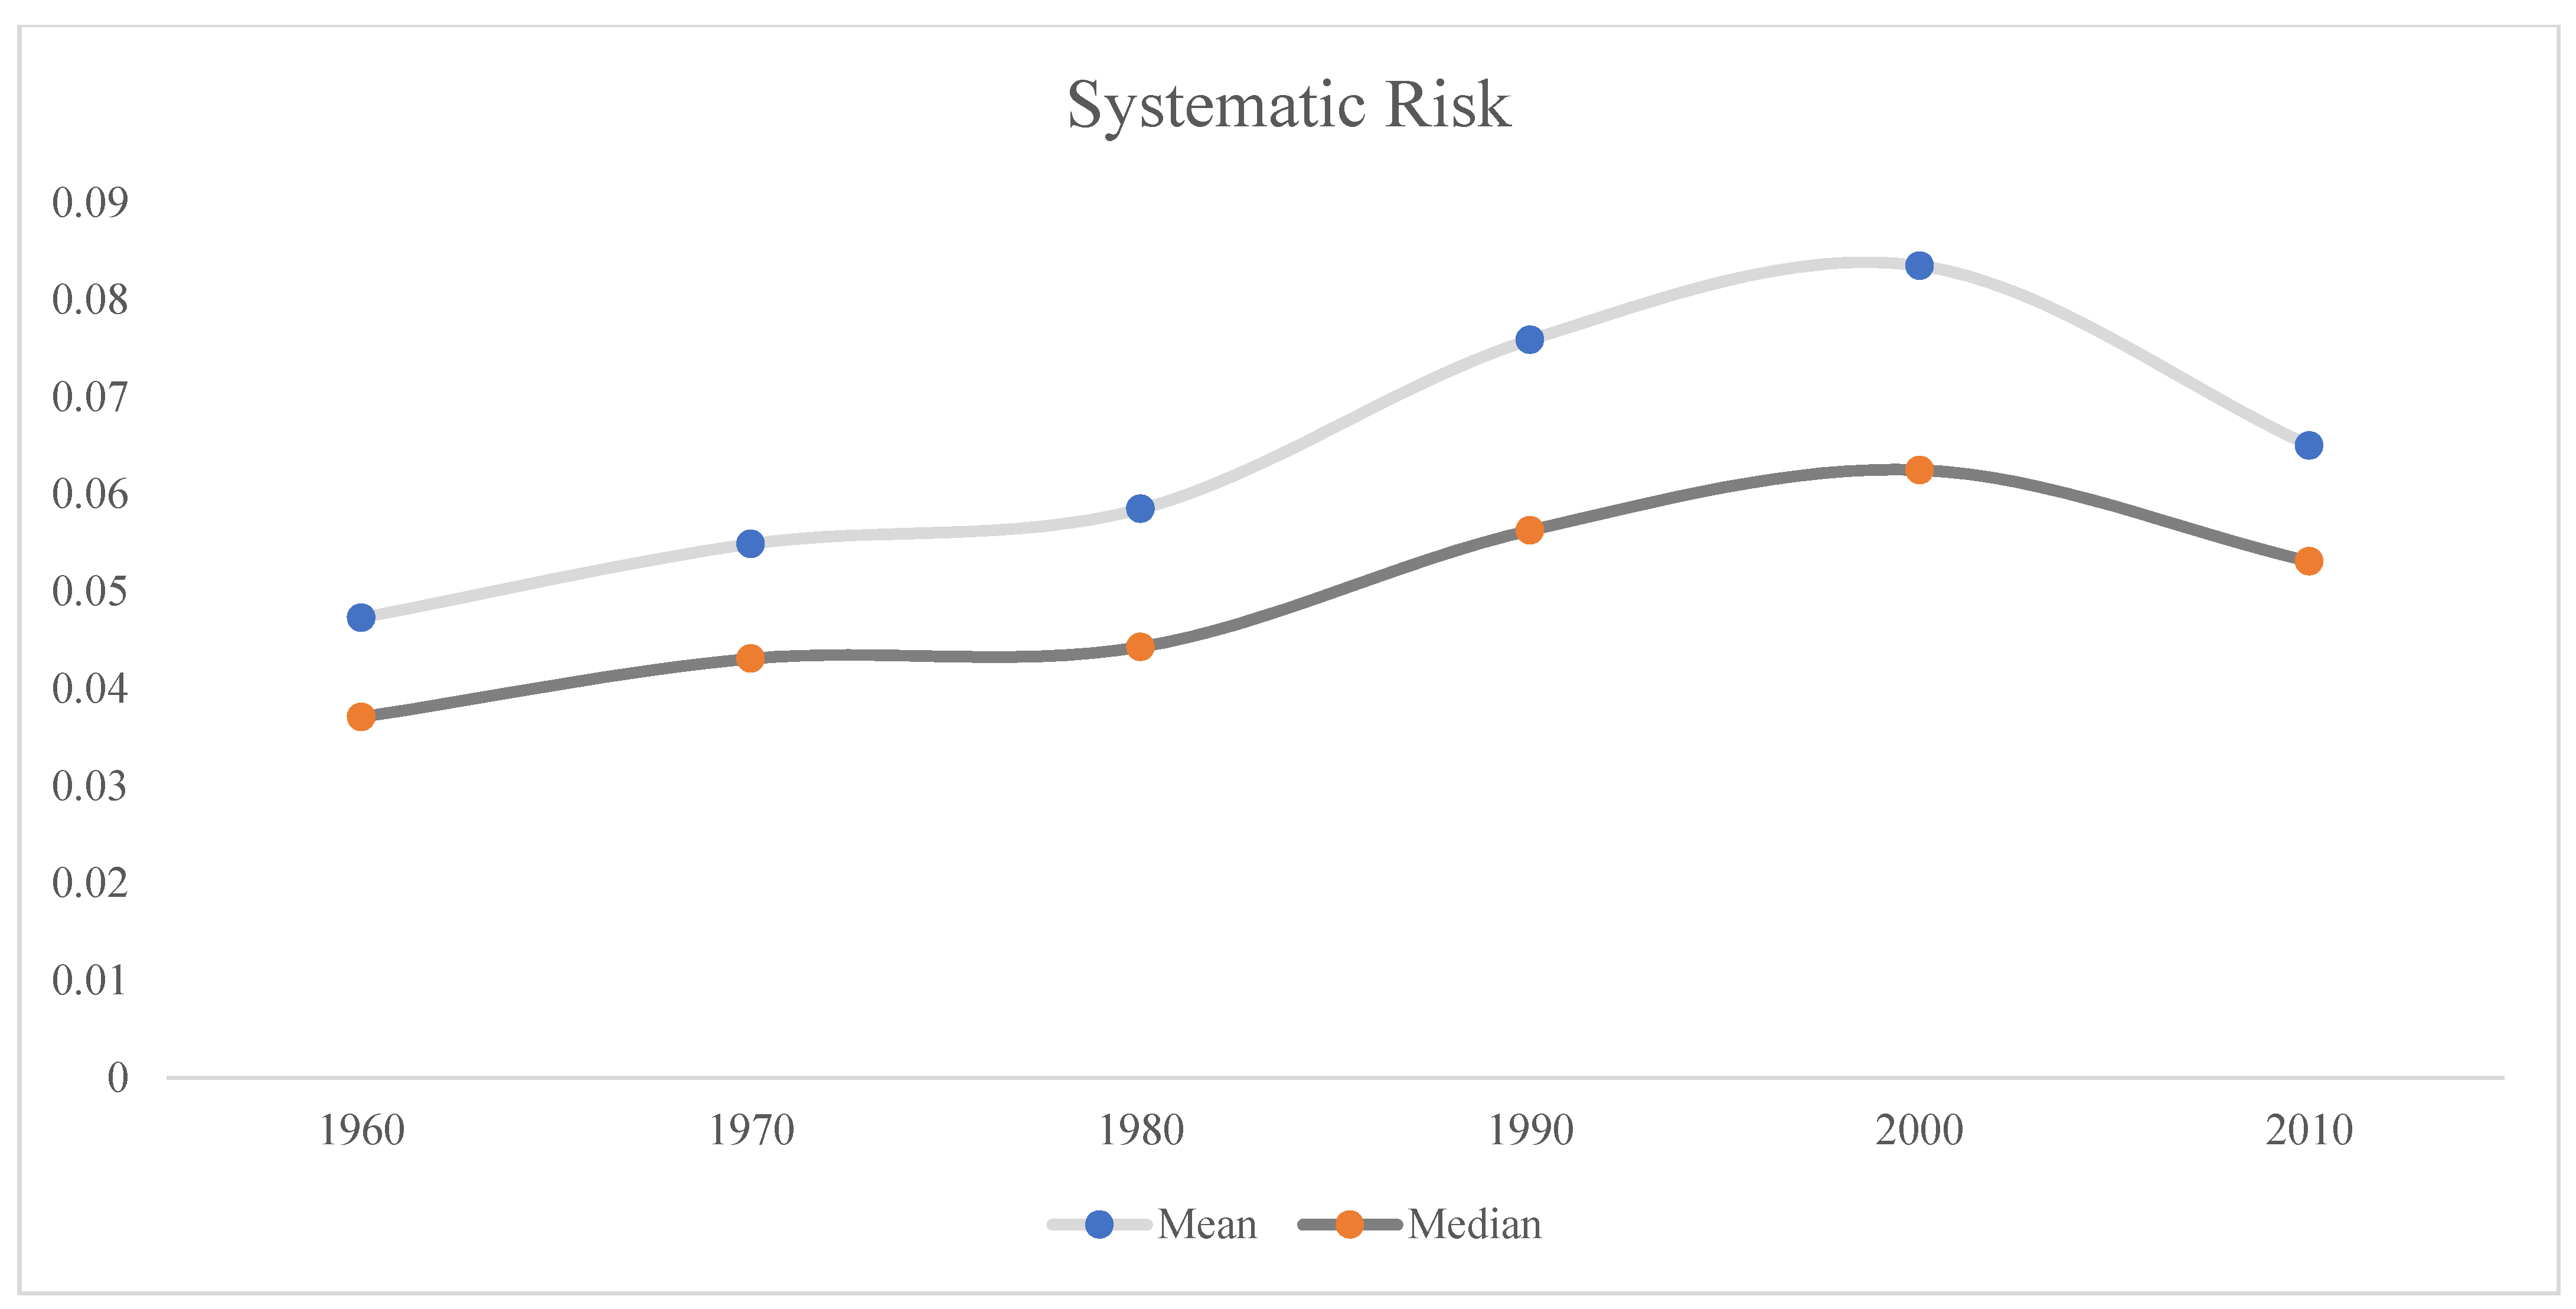
| Systematic Risk | Mean | Std. Deviation | 5% | 25% | Median | 75% | 95% | N |
|---|---|---|---|---|---|---|---|---|
| Whole Period | 0.0661 | 0.0637 | 0.0109 | 0.0289 | 0.0498 | 0.0826 | 0.1732 | 3,135,235 |
| 1960s | 0.0473 | 0.0385 | 0.0099 | 0.0221 | 0.0371 | 0.0607 | 0.1182 | 268,470 |
| 1970s | 0.0549 | 0.047 | 0.0082 | 0.0241 | 0.0431 | 0.0722 | 0.1406 | 479,955 |
| 1980s | 0.0585 | 0.0573 | 0.0075 | 0.0248 | 0.0443 | 0.0743 | 0.1541 | 654,819 |
| 1990s | 0.0759 | 0.0743 | 0.0134 | 0.0327 | 0.0563 | 0.0951 | 0.2008 | 757,460 |
| 2000s | 0.0835 | 0.0773 | 0.0155 | 0.0372 | 0.0625 | 0.1041 | 0.2224 | 593,012 |
| 2010s | 0.065 | 0.0536 | 0.0161 | 0.0345 | 0.0531 | 0.0806 | 0.1517 | 381,519 |
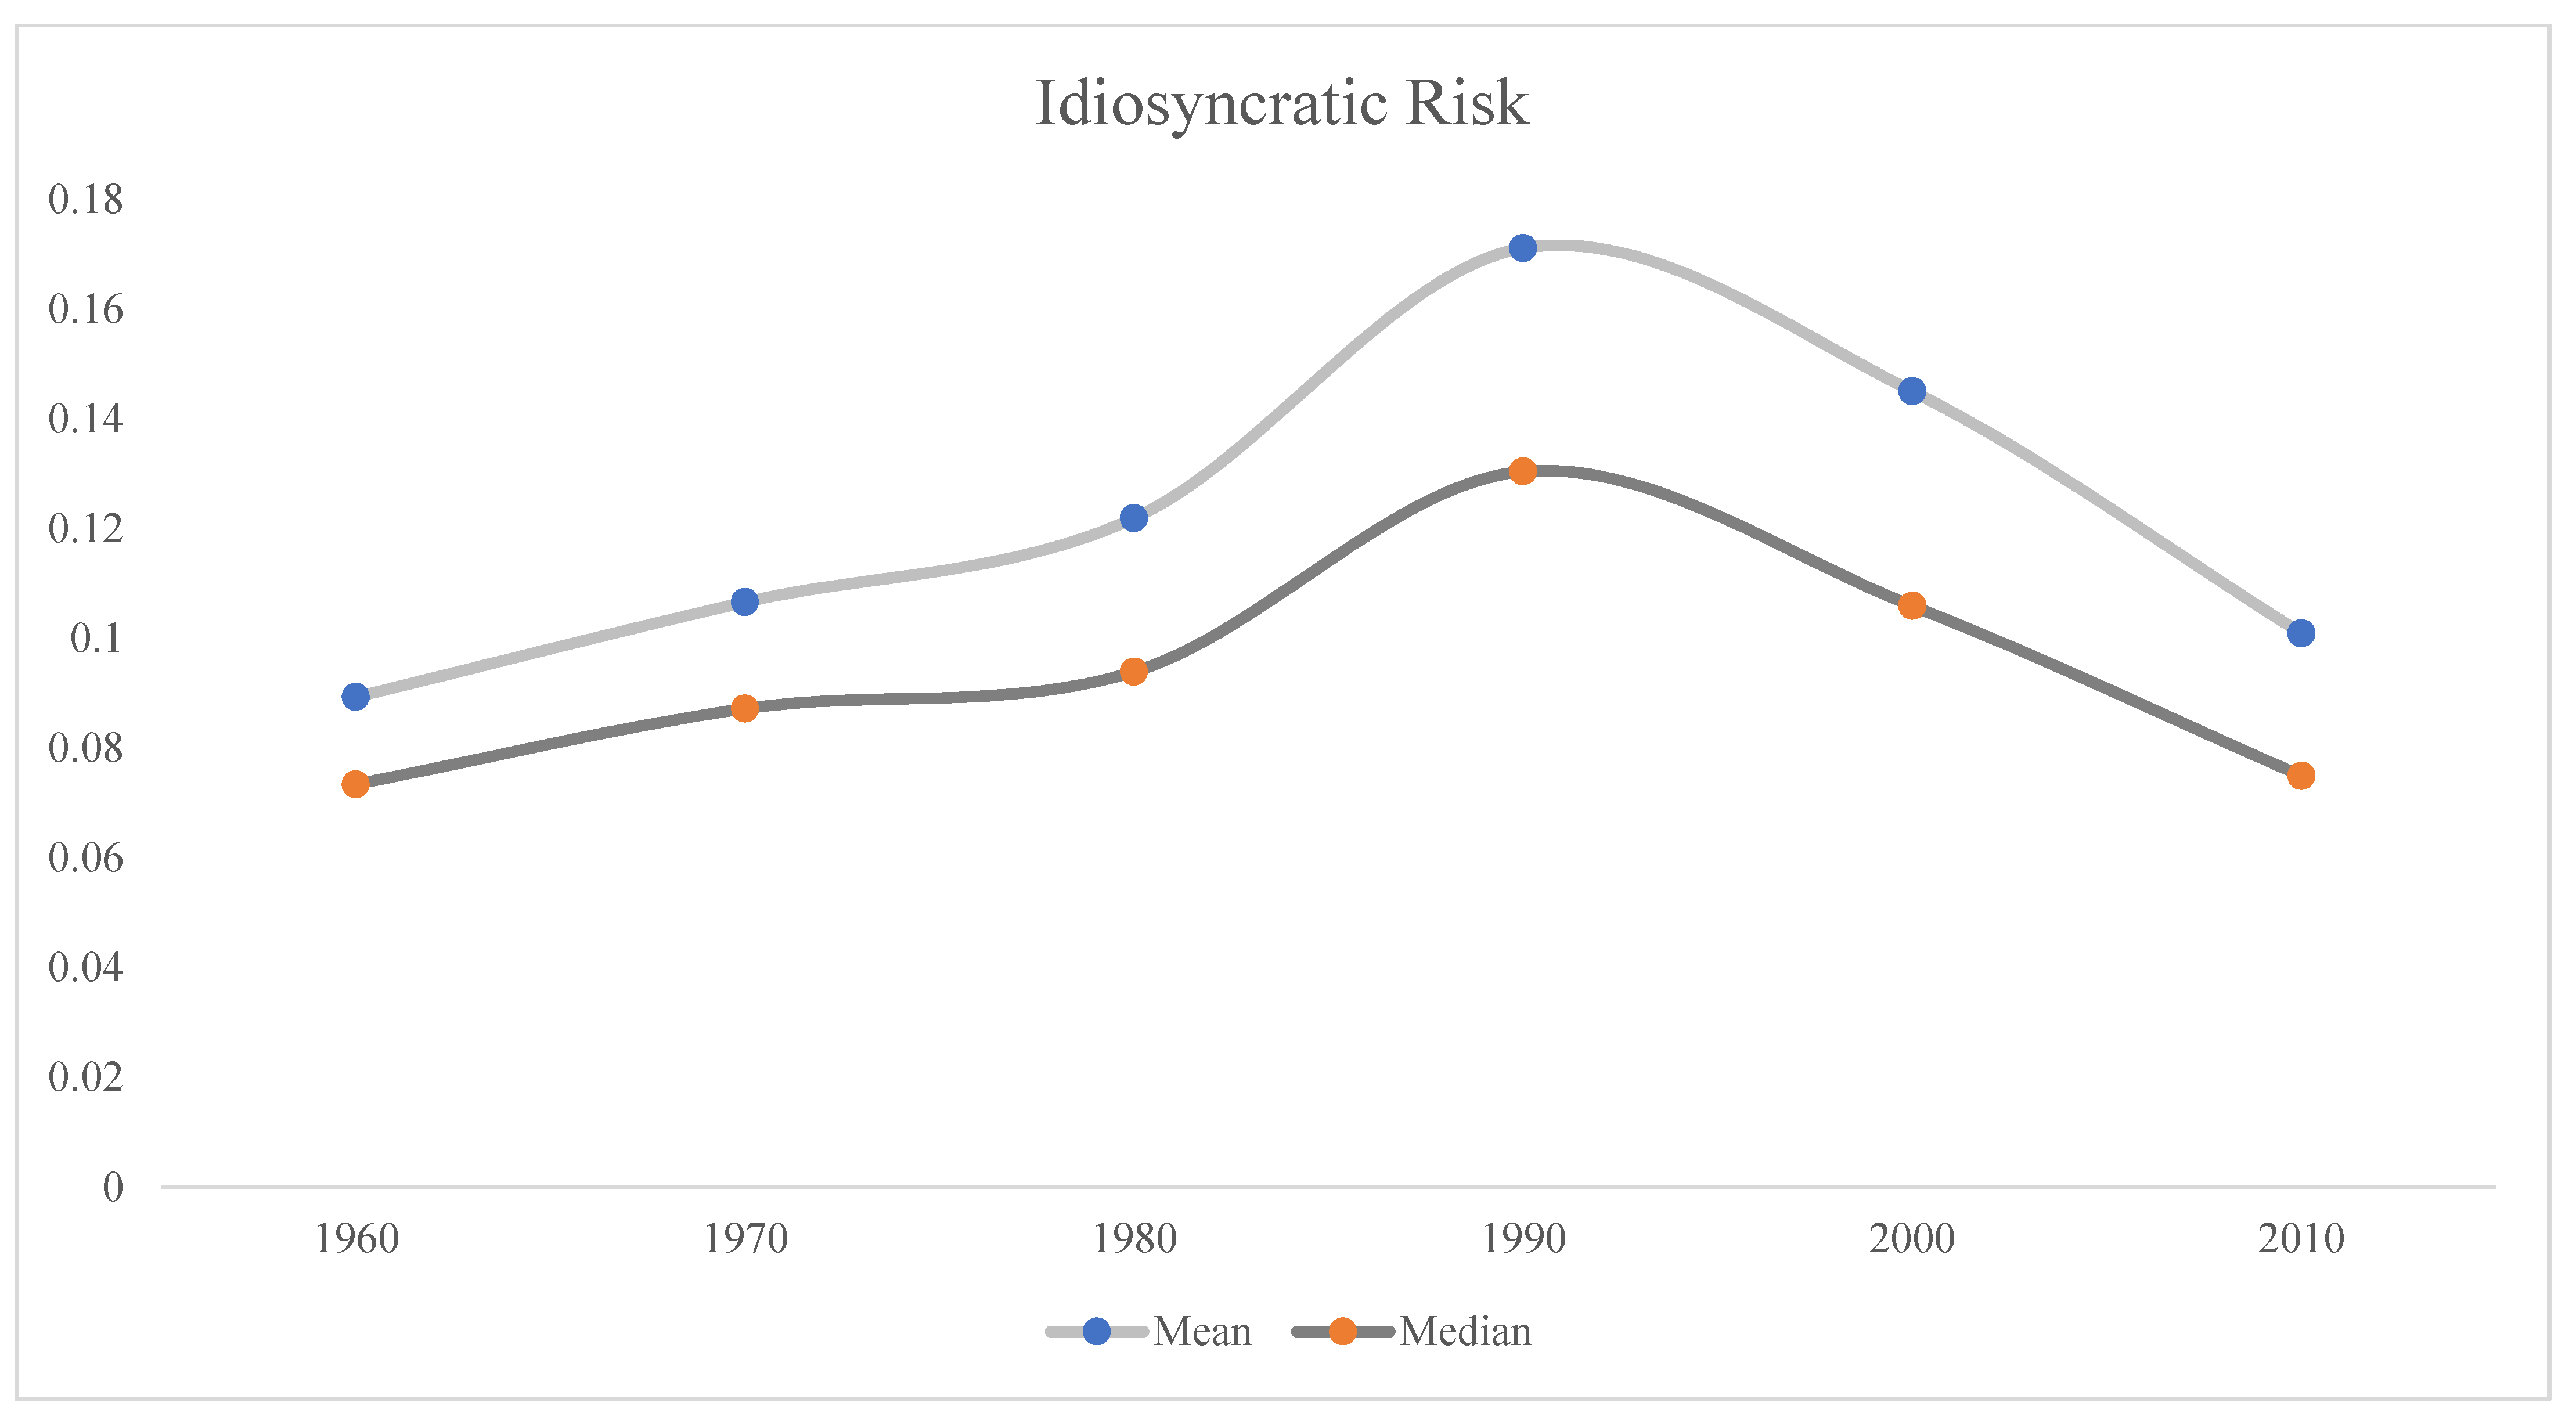
| Systematic Risk | Mean | Std. Deviation | 5% | 25% | Median | 75% | 95% | N |
|---|---|---|---|---|---|---|---|---|
| Whole Period | 0.1298 | 0.1255 | 0.0293 | 0.0595 | 0.0967 | 0.1591 | 0.3359 | 3,135,235 |
| 1960s | 0.0893 | 0.0613 | 0.0312 | 0.0509 | 0.0734 | 0.1095 | 0.1974 | 268,470 |
| 1970s | 0.1066 | 0.0803 | 0.0238 | 0.0551 | 0.0872 | 0.1355 | 0.2541 | 479,955 |
| 1980s | 0.1219 | 0.1119 | 0.0215 | 0.0577 | 0.0939 | 0.1511 | 0.3125 | 654,819 |
| 1990s | 0.1711 | 0.1304 | 0.0392 | 0.0798 | 0.1304 | 0.2113 | 0.4321 | 757,460 |
| 2000s | 0.145 | 0.1378 | 0.0339 | 0.0625 | 0.1059 | 0.1781 | 0.3784 | 593,012 |
| 2010s | 0.1009 | 0.1053 | 0.0271 | 0.0472 | 0.0749 | 0.1223 | 0.2501 | 381,519 |
| FF3 Alphas | 1 Small | 2 | 3 | 4 | 5 Large | |||||
|---|---|---|---|---|---|---|---|---|---|---|
| 1 Low | 0.12 | (1.51) | 0.16 | (2.09) | 0.16 | (2.27) | 0.24 | (3.62) | 0.35 | (5.12) |
| 2 | 0.16 | (2.11) | 0.13 | (1.74) | 0.17 | (2.66) | 0.16 | (2.75) | 0.35 | (5.25) |
| 3 | 0.00 | (0.02) | −0.01 | (−0.21) | 0.09 | (1.38) | 0.12 | (1.95) | 0.38 | (5.01) |
| 4 | −0.49 | (−4.87) | −0.25 | (−2.67) | −0.10 | (−1.27) | 0.06 | (0.78) | 0.24 | (2.74) |
| 5 High | −1.12 | (−7.15) | −0.87 | (−6.04) | −0.61 | (−4.97) | −0.17 | (−1.31) | −0.16 | (−1.06) |
| High-Low | −1.21 *** | (−7.01) | −1.02 *** | (−5.82) | −0.76 *** | (−5.21) | −0.41 ** | (−2.57) | −0.51 *** | (−3.09) |
| 1960s | −0.68 ** | (−2.21) | −0.66 | (−1.62) | −0.78 | (−1.62) | 0.32 | (1.00) | −0.01 | (−0.03) |
| 1970s | −0.49 | (−1.34) | −0.51 * | (−1.72) | −0.84 *** | (−3.57) | −0.44 * | (−1.76) | −0.62 ** | (−2.49) |
| 1980s | −2.11 *** | (−6.90) | −1.75 *** | (−6.02) | −1.21 *** | (−4.53) | −0.96 *** | (−2.97) | −1.27 *** | (−4.06) |
| 1990s | −1.04 ** | (−2.22) | −0.64 | (−1.40) | −0.21 | (−0.57) | 0.19 | (0.48) | 0.02 | (0.05) |
| 2000s | −1.11 *** | (−2.65) | −0.79 * | (−1.86) | −0.46 | (−1.13) | −0.19 | (−0.48) | −0.31 | (−0.69) |
| 2010s | −1.80 *** | (−5.80) | −1.73 *** | (−5.17) | −0.96 *** | (−3.08) | −1.23 *** | (−2.94) | −1.12 ** | (−2.30) |
| Recession | −1.10 * | (−1.73) | −0.82 | (−1.31) | −0.57 | (−1.10) | −0.24 | (−0.50) | −0.27 | (−0.48) |
| Boom | −1.25 *** | (−6.70) | −1.01 *** | (−5.40) | −0.80 *** | (−4.66) | −0.42 ** | (−2.40) | −0.55 *** | (−3.10) |
| Beta | Size | B/M | Momentum | TURN | CVTURN | |
|---|---|---|---|---|---|---|
| Idio | 0.07 | −0.31 | −0.02 | −0.12 | −0.03 | 0.26 |
| Beta | 0.08 | −0.01 | 0.06 | 0.22 | −0.01 | |
| Size | −0.21 | 0.01 | 0.34 | −0.44 | ||
| B/M | 0.08 | −0.11 | 0.15 | |||
| Momentum | 0.01 | 0.04 | ||||
| TURN | −0.19 |
| Whole Period | 1960s | 1970s | 1980s | 1990s | 2000s | 2010s | Recession | Boom | |
|---|---|---|---|---|---|---|---|---|---|
| Intercept | 1.388 *** | 0.985 | 1.455 ** | 1.240 ** | 0.421 | 1.875 *** | 2.018 *** | 0.971 | 1.461 *** |
| (5.25) | (1.45) | (2.08) | (2.05) | (0.72) | (3.03) | (4.33) | (1.12) | (5.46) | |
| Idio | −0.042 *** | −0.081 *** | −0.064 *** | −0.056 *** | 0.004 | −0.027 ** | −0.039 *** | −0.047 *** | −0.041 *** |
| (−6.95) | (−3.70) | (−4.93) | (−6.21) | (0.31) | (−2.49) | (−3.68) | (−3.24) | (−6.01) | |
| Beta | 0.423 ** | 0.257 | 0.793 | 0.399 | 0.628 | 0.063 | 0.168 | 0.398 | 0.427 *** |
| (2.16) | (0.74) | (1.60) | (0.93) | (1.39) | (0.10) | (0.66) | (0.42) | (2.70) | |
| Size | −0.186 *** | −0.275 *** | −0.237 *** | −0.042 | −0.213 *** | −0.230 *** | −0.081 | −0.250 *** | −0.175 *** |
| (−6.08) | (−3.42) | (−3.30) | (−0.57) | (−2.64) | (−3.72) | (−1.54) | (−3.26) | (−5.18) | |
| B/M | 0.154 *** | 0.050 | 0.200 * | 0.296 *** | 0.172 | 0.050 | −0.026 | 0.056 | 0.171 *** |
| (3.46) | (0.93) | (1.71) | (3.34) | (1.44) | (0.43) | (−0.25) | (0.40) | (3.68) | |
| Momentum | 0.753 *** | 1.531 *** | 0.472 | 0.706 *** | 1.297 *** | 0.316 | 0.276 | 0.621 | 0.776 *** |
| (5.28) | (4.44) | (1.28) | (2.93) | (4.57) | (0.80) | (1.07) | (1.08) | (5.77) | |
| TURN | −0.188 *** | −0.067 | −0.206 ** | −0.364 *** | −0.228 ** | 0.066 | −0.313 *** | −0.056 | −0.211 *** |
| (−4.23) | (−0.46) | (−2.16) | (−4.91) | (−2.04) | (0.65) | (−3.73) | (−0.44) | (−4.45) | |
| CVTURN | −0.327 *** | −0.206 | −0.310 *** | −0.072 | −0.817 *** | −0.376 ** | −0.386 *** | −0.311 ** | −0.330 *** |
| (−6.19) | (−1.50) | (−3.22) | (−0.73) | (−7.08) | (−2.57) | (−3.13) | (−2.04) | (−5.79) | |
| 0.087 *** | 0.124 *** | 0.108 *** | 0.069 *** | 0.079 *** | 0.099 *** | 0.058 *** | 0.141 *** | 0.077 *** | |
| (19.00) | (10.23) | (9.95) | (10.19) | (8.61) | (7.96) | (8.24) | (10.33) | (18.01) |
Publisher’s Note: MDPI stays neutral with regard to jurisdictional claims in published maps and institutional affiliations. |
© 2021 by the author. Licensee MDPI, Basel, Switzerland. This article is an open access article distributed under the terms and conditions of the Creative Commons Attribution (CC BY) license (https://creativecommons.org/licenses/by/4.0/).
Share and Cite
Fu, C. Time-Varying Risk and the Relation between Idiosyncratic Risk and Stock Return. J. Risk Financial Manag. 2021, 14, 432. https://doi.org/10.3390/jrfm14090432
Fu C. Time-Varying Risk and the Relation between Idiosyncratic Risk and Stock Return. Journal of Risk and Financial Management. 2021; 14(9):432. https://doi.org/10.3390/jrfm14090432
Chicago/Turabian StyleFu, Chengbo. 2021. "Time-Varying Risk and the Relation between Idiosyncratic Risk and Stock Return" Journal of Risk and Financial Management 14, no. 9: 432. https://doi.org/10.3390/jrfm14090432
APA StyleFu, C. (2021). Time-Varying Risk and the Relation between Idiosyncratic Risk and Stock Return. Journal of Risk and Financial Management, 14(9), 432. https://doi.org/10.3390/jrfm14090432