1. Introduction
Corporate structure under a group of companies has been an ever-increasing phenomenon for many decades. Corporate groups consist of a set of legally independent companies, often described as subsidiaries, which are usually controlled by one single entity, the parent company. The most simplified form of such an organization is known as the pyramid structure, beginning on the top with the parent company, followed by subsidiaries and sub-subsidiaries. The parent company has the power to direct all relevant decisions of its subsidiaries either with direct control, i.e., the parent company has the ownership or else holds the majority of the shares and is actual the ultimate beneficiary owner, or indirect, by having the power to control the voting rights in its favor, i.e., acting again as the UBO.
Often, questions arising from the terms power of control and ownership of a company. In business corporation’s theory, owners of a company’s equity are its stakeholders. A company’s share capital is divided to shares and each shareholder owns a certain proportion of it. However, this ownership is not sufficient to determine who is controlling the company. As often imposed in the Articles of Association, critical decisions within the company need the approval from the majority of the shareholders. Assuming the simplest voting system of one-share-one-vote, depending on the holding shares we can determine each shareholder’s voting power. The one whose voting rights represent the majority of the votes, has the power to control the company and direct its strategy, while the others, represent (as addressed in bibliography and business practices) the non-controlling interest or minority.
Group structure can be very complex and frustrating in terms of shareholders and voting rights. Direct management control is most of the time the most simple and straightforward. If a company has the majority of the voting rights over another company, it can exercise management control on that company. Indirect control on the other hand, can be very tricky and crucial on determining who has the control power. Situations where there are cross-shareholdings between the group’s companies, circular ownership or even an extended and complicated pyramid structure can drive to covert power control. This is the case, where a parent company withholds a small portion of the shares of a company, but through its subsidiaries can maintain the control over other shareholders. That is, starting with a low investment the parent can multiply the controlled capital.
Taking into consideration the above, in a group of companies the parent company holds the majority of the voting rights over the other companies and has the power to decide and direct investment and management policies within the group. Our aim is to examine how parent companies can redirect the share capital of the group, in such a way that will permit them to maintain management control and at the same time to absorb capital gains from this redirection. Management control is determined as direct and indirect voting rights in any general assembly in any subsidiary company. Under this question a shadow dual problem arises: that the minimum of majority interest is equal to maximum minority interest without management control. For simplicity reasons we are not taking into consideration agency problems that can arise between the shareholders of a company, as such we strict our calculations in one-share-one-vote shares.
In our research we conclude that under certain constraints there is always an optimum point at which the parent company manages to maintain control of the group by minimizing its direct and indirect rights in group’s companies. At this point the capital gain from the share redistribution is the maximum possible. Τhe role of the constraints and the importance of each one in the process is being described with available cash for investment having the greatest weight.
The paper is organized as follows: We start with previous research under the concept of control, ownership, and minority/majority interest. Then, we present our theoretical procedure and the structure of the model. Next, we test our model presenting our findings and finally, we conclude the main key points and quote further questions that arise.
2. Literature Review
Group structure and determination of direct and indirect shareholdings within the group has been tested and examined in detail over the last years. Most research has been focused in how to evaluate the complexity of voting rights within the group and therefore to present the actual controlling rights and the wealth creation. Since, as stated above, ownership does not reflect the actual control of firm, a very common argument is the conflict between the shareholders, and more precisely those who have the control power of the group with those who are not part of it–the minority interest.
Although all can agree that in terms of maximize potential earnings all shareholders share the same concerns, disagreements arise in managing aspects such as investment policies or corporate control. This often occurs due to private benefits from a certain production choice. In most of the literature, control, in terms of voting rights, is considered as holding the majority of voting thresholding.
Demarzo (
1993) in his study presented this scenario, arguing that in a corporation with voting rights, the choice of production will be made by the holders of the majority stake. This can be achieved by either one large shareholder holding at least half of the voting rights or with collisions between smaller shareholders in order to achieve it.
Bennedsen and Wolfenzon (
2000) shows that in case of equity dilution among shareholders, coalitions are formed to seize control in a company. Such control provides them with cash flow private benefits that are burned through the non-controlling shareholders. Of course, there are different views supporting that control can be succeeded with a holding percentage less than half. In a study of 27 wealth economies’ large corporations,
La Porta et al. (
1999) show that most of the companies are controlled through pyramids structures, multiple class of shares deriving different voting rights and participation of shareholders in the Board of Directors. Through these methods, a shareholder can leverage his voting rights and maintain control with less cash flow rights than 50%. In accordance with La Porta,
Claessens et al. (
2000) examined the ownership structure in Asia corporations to find that control is achieved mostly through pyramids structures and crossholdings among firms.
Determining who has control power within a group corporation can be a difficult task, especially when control is gained through shareholder coalitions. This issue arises frequently in complex structures where holdings through multiple control chains and loops are met. In such situations determining who is the key shareholder that holds the integrated control needs a thoroughly investigation.
Gambarelli and Owen (
1994) were the first trying to find out the winning coalitions in group structures by applying a game-theoretical approach, following this perspective by
Prati and Denti (
2001). More recent,
Crama and Leruth (
2007,
2013),
Karos and Peters (
2015);
Hu and Shapley (
2003) have used power indexes to measure power of direct and indirect control.
Bertini et al. (
2016) made a deep analysis on the different methods that have been presented and pointed out that most of them used the Shapley–Shubic, the Banzhaf and the Johnston power indexes. Although they find some similarities among the methods, they concluded that each one takes into account different considerations, thus no common conclusions could be made.
Measurement group structure and the power of control through direct and indirect voting rights has been studied extensively in the literature.
Brioschi et al. (
1989) presented a well-known model by which they calculated the integrated control and companies’ value within a pyramid group. Representing participation rates in the form of matrixes and using linear algebra they mathematically described the value of a firm, the majority and minority of the group and the ways a group can raise capital without losing management control. Their model was implemented in the Italian manufacturing for the period 1980–1986 and proved the distinction between ownership and control. In two different studies
Ellerman (
1991) and
Flath (
1992) used the same procedure to calculate the gross income and ultimate ownership in Yugoslavian and Japanese keiretsu system. They found that indirect gains are worthwhile, and their impact should not be overlooked.
Baldone et al. (
1997) used the matrix calculation but eliminated own share effects.
Chapelle and Szafarz (
2002) following voting share, integrated ownership and majority voting rules approach analyzed in deep the pyramid structure and used ratios to reveal the actual control pattern of the largest Belgian holding company.
Chapelle (
2005) following Brioschi et al. model and adding more control considerations in the input-output matrix created a separation ratio to distinguish ownership from control. Her results show common ground in Italy and Belgium but different situation in US and Netherlands.
Almeida et al. (
2008) combined pyramid structures with companies’ position in the group and the degree of financing. Their findings in Korean family business groups showed that pyramid investments are not positive for small shareholders.
Finding who has the actual control in a group can drive us to a lot of conclusions. The most important is if and how the controller uses his power relevant to minority shareholders. Does controlling a company mean wealth maximization for all related parties or is there a portion which actually burns the cost of an investment decision?
Brioschi et al. (
1999) show that under certain circumstances control benefits can raise the minority’s wealth. On the other hand,
Meoli et al. (
2006) research two acquisitions in Italy from a pyramid group structure to find that in both cases the non-controlling interest burned over the 85% of the acquisition and the majority took advantage of large private benefits.
3. Theoretical Approach
3.1. Effective Participation, Direct Plus Indirect Participations
Let n denote the number of companies which belong to the group.
We assume there is a company whose share capital is owned by no other firm, neither an outsider investor, and exercises control over those companies through either the parent or holding company. Additionally, within the group, part of the share capital of companies is owned by other companies of the group and vice versa. This creates intra-group equity linkages that drives complex indirect control from the parent company.
Let φij be the percentage Participation Between Subsidiaries (PBS), then, the n × n matrix represents the direct intra-group shares participations.
Let φij be the percentage Participation Between Subsidiaries (PBS), then, the n × n matrix represents the direct intra-group shares participations.
Let ai be the percentage of Direct Participation of Holding Company (DPHC) in any subsidiary company, then n × 1 matrix represent parent’s direct share participation on group’s companies.
The and are positive matrixes with and , ∈ [0, 1] where 1 represents the 100% participation.
Rows and columns represent the companies of the group and each of the intersection entries represents the intra-group participation rates. Obviously if no participation rate exists the entry number will be zero and same applies for the intersection of same companies i.e., the diagonal of the matrix. Each row shows the participation rate of a group’s company to others within the group and each column shows the participation rates of group’s companies within the company we observe.
Parent company’s integrated management control on a company i results from the shares that the parent holds as investment in its assets (direct participation) and from the percentage of company’s shares held by companies whose equity percentage is held by the parent company (indirect participation).
In order to make it clearer let us assume three companies A, B and C, where A holds a percentage of B and C shares while B holds a percentage of C shares. If αb, αc and bc the participation percentages, company A’s integrated control over company C, let it be G, equals to: G = αc + αb* bc.
In order to find the parent’s Effective Integrated Participation (EIP), we use the Leontief input-output matrix method and derive to:
where
the column vector of EIP to subsidiary I, ;
the integrated matrix;
the PBC and the transpose matrix PBC and generally T denotes transpose matrixes;
the DPHC.
Vector of Management Control
The sum of company’ s shares held from the parent company and/or from other group’s companies results to the accumulated control from the group. In a Group, the holding has Effective Management Control (EMC) through the shares of PBC in any subsidiary.
Thus:
with
Ci the EMC ∈ [0, 1] where 1 represents the 100% participation.
Minority Interest
There are also several external shareholders from other group’s companies, withholding a portion of share capital on the subsidiaries. In order to distinguish these holdings from the group we will refer them from now on as minority or Non-Controlling Interest (NCI) shareholders. We need to mention that what applies for the parent company about control applies here as well. Integrated minority control of subsidiary i, is the sum of their direct holding shares plus any indirect effect from subsidiaries crossholdings.
In order to calculate NCI we introduce the column vector , where ui = 1 .
Using the Equation (1) we can write:
where
mi is the NCI and ∈ [0, 1] and 1 represents the 100% participation.
Vector of Net Assets
In order to keep our approach simple, we assume that the companies’ property has been measured to its fair value, and thus, the value of each company is equal to their net assets.
We denote the net assets of the group as the vector:
where
nα0 net assets of parent company.
Vector of Participations’ Value
Given the net assets (value) of the companies we can calculate the total Participation Value for both the parent company and the subsidiaries.
Thus, we denote the below vector:
Available Cash and Cash Equivalents for Investment
Available Cash and Cash Equivalents (CCE-CE) is a portion of net assets. This element is essential for every company that wants to invest, based on already available funds and without the need to raise more capital. Taking into consideration that net assets of company
i is given by the above NA matrix, we can write cash and cash equivalents as portion of the given net assets matrix:
denoting the scalar percentage portion of C&CE where
the scalar portion of parent company. Thus:
3.2. Maximizing Minority Interest Without Losing Control
In order to start we need to denote the object function. What we need is the parent company to maintain control of the group but at the minimum level. Minimum level is defined as the minimum integrated participation of holding company in its subsidiaries. In order to find this level, the following needs to be minimized: Holding’s direct participations, holdings indirect participations or both.
Objective Function (OF) is Equation (1) which has to be minimized. Thus:
Multiple Variables affect our model in order to solve the above question and several restrictions should be taken under consideration:
Restriction of Management Control:
If we would like a mandatory minimum DPMC to exist for management purposes, then the restriction 2 has no practical view as it is, because any participation has to be equal to a minimum percentage rate in order to belong in a direct participation’s portfolio of parent company and any acquired company ai has to be higher or equal to a minimum x% according to law, accounting, management, or organization requirements.
The reason for the above is that is not easy for the group managing or controlling the group accounting and the multiple voting rights with low or zero direct participation.
Thus 2 and 3 are reconsidered to:
where
x and
y denote the minimum participation rates as per management’s requirements.
Now let us denote and the new matrixes representing the optimal direct intra-group share participations, and the optimal parent’s direct share participation on group’s companies.
Following the same calculations, we derive to the new EIP from the parent company:
What the new EIP represents is an allocation of companies’ assets between investments in other companies’ share capital and liquidity. In fact, there is no change in the share capital (value) of any of the companies. Company A trades company B’s shares resulting to a decrease on investments account and an increase in cash and cash equivalents.
Given the above we can also calculate this allocation with the use of matrixes and find the final cash inflow in parent company’s cash account.
Now given that Δ
G is the difference between the formal and the latter EIP we denote:
where Δ
G represents the effective integrated control share rights (direct and indirect) that the holding company lost or acquired by trying to minimize integrated participation but at the same time maintain the control of the group. These share rights represent the difference resulting from the redistribution of the shares within the group.
The new total cash inflow in the parent company is represented as:
3.3. The Model
We assume a group of companies with given participation rates between the companies and given equity values (net assets). With the above data we can calculate the initial EIP, NCI, PV and CCE as per our theoretical approach. Our target is to show how the parent company of the group can raise capital by minimizing the EIP, i.e., change both direct and indirect participation rates of the group, while holding the EMC to control levels.
In mathematical programming problems and especially in this case where programming is quadratic as we have matrixes multiplication, if we minimize integrated control under some specific constraints, then, mathematically, and deterministically there is only one solution, the optimal one. In case the structure of the group is different or any of the constraints that we have defined have changed, using the same method the optimal solution of the problem will be different and unique.
We start by minimizing the EIP and test three different constraint models. Each model tests different assumptions regarding the participation rates and the CCE available for investments. For every model, using the evolver software we end up with an optimal solution, that is, the optimal structure of the group.
After applying the new structure, we can find the differences between the initial and the optimal EIP. The value of these differences represents the maximum consolidated cash increase of the parent company.
Due to minimizing EIP, we can also calculate the new NCI, and at the end of this research we present some questions that arise.
4. Estimations
4.1. The Static Model
Our group consists of 10 companies. Company M represents the holding or parent company, while the rest are its subsidiaries. Rows represent the participations of each company to others in the group and columns represents the participation analysis of each company’s equity. As we can see from the below table (
Table 1), the parent company has a 50% direct participation to each of the subsidiaries and no crossholdings exist between the subsidiaries. Our group is simple, and the effective management control derives only from the direct participation of the parent (sum of each subsidiary column).
Given the above we present matrix A
n×1 and Φ
n×n as per out theoretical approach (
Table 2):
The effective integrated participation is given by the equation:
which results to
Table 3:
We also assume a given Vector of Net Assets representing the value of each company (
Table 4):
We then apply three models with different assumptions as per the structure of the group and the available cash for investments. Solving our model by minimizing the integrated management control under our assumptions we derive the optimal structure of the group and the maximum capital increase from the parent company for given values.
4.2. Model Applications
4.2.1. Inputs
We start with the structure of our static model. Our model’s goal and assumptions are summarized as per below in
Table 5:
In order to have a clear understanding of the above table we present below a briefly comment of its key elements.
Our goal is to find the minimum acceptable values of effective integrated participation–EIP under certain constraints. Thus, model’s goal is minEIP. Due to the software’s limitation in minimizing matrixes, a practical solution to overpass this problem was to minimize the sum of its elements. Thus, minEIP was formulated to with an original value of 4.5.
The cells we need to change are the ones holding the percentage rates of the group. Thus, through the optimization procedure we need to find the new participations rates between subsidiaries—PBS—and the new direct participations of the holding company—DPHC.
The four bold constraints are those controlling the new participation rates that will be received in the adjustable sets. Actually, by changing these constructions we can instruct the structure of the company to follow certain requirements according to law or management policies. Our models are structured as follows:
Model 1:
The parent company must hold the majority of the equity shares at least to one of its subsidiaries;
The minimum DPHC participation must be 0.05, otherwise value is set to 0;
The minimum value of PBS should be 0.05, otherwise value is set to 0.
Model 2:
The parent company must hold the majority of the equity shares at least to one of its subsidiaries;
All DPHC participations must be equal or greater to 0.05;
The minimum value of PBS should be 0.05, otherwise value is set to 0.
Model 3:
Follows same structure as Model 1.
In order for the group to maintain control over a company, the effective management control—EMC—should be equal or greater than 0.5 with a maximum value of 1;
The sum of a company i’s participations in other companies should be equal or smaller to its available cash for investments. In our case available cash for Models 1 and 2 are 10% of net assets for the subsidiaries and 80% for the holding company while in Model 3 the available cash for the subsidiaries are 20% of the net assets, and stable at 80% for the parent. Thus, the vector of CCE is formed as reflected in
Table 6 and
Table 7, respectively:
4.2.2. Outputs
After running the model, we have the optimal structure of our group for each of our models under the given constraints (
Table 8,
Table 9 and
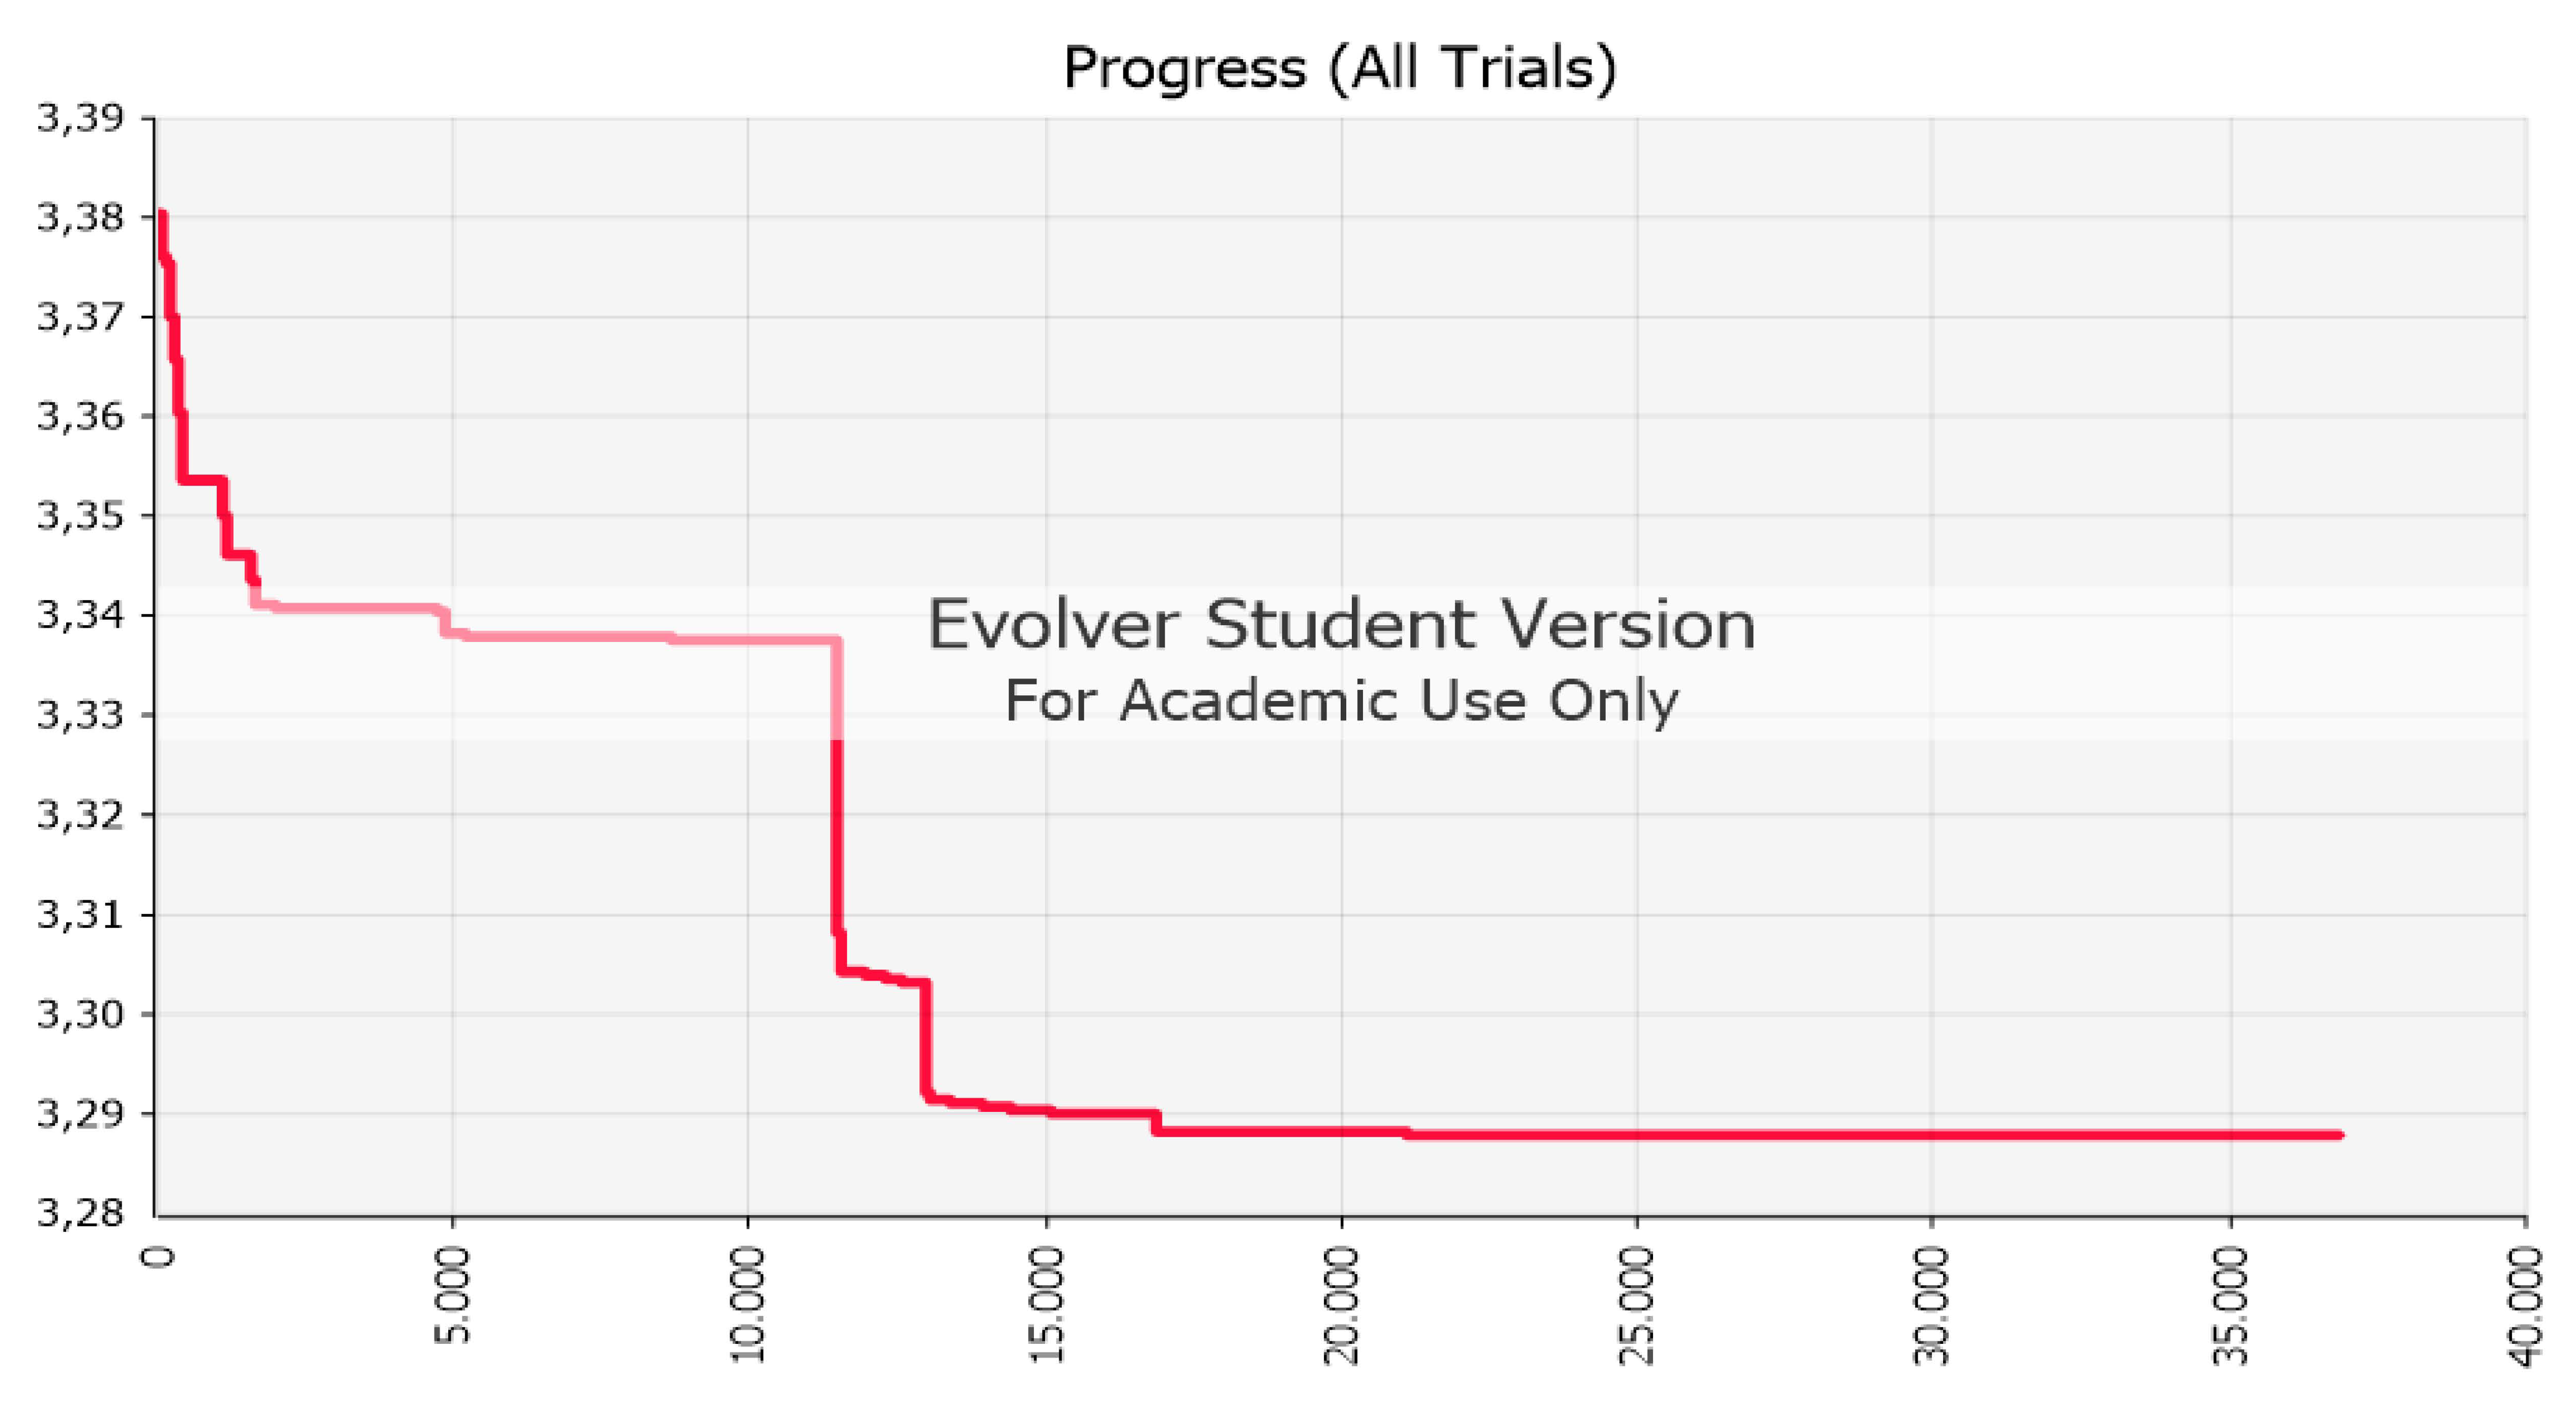
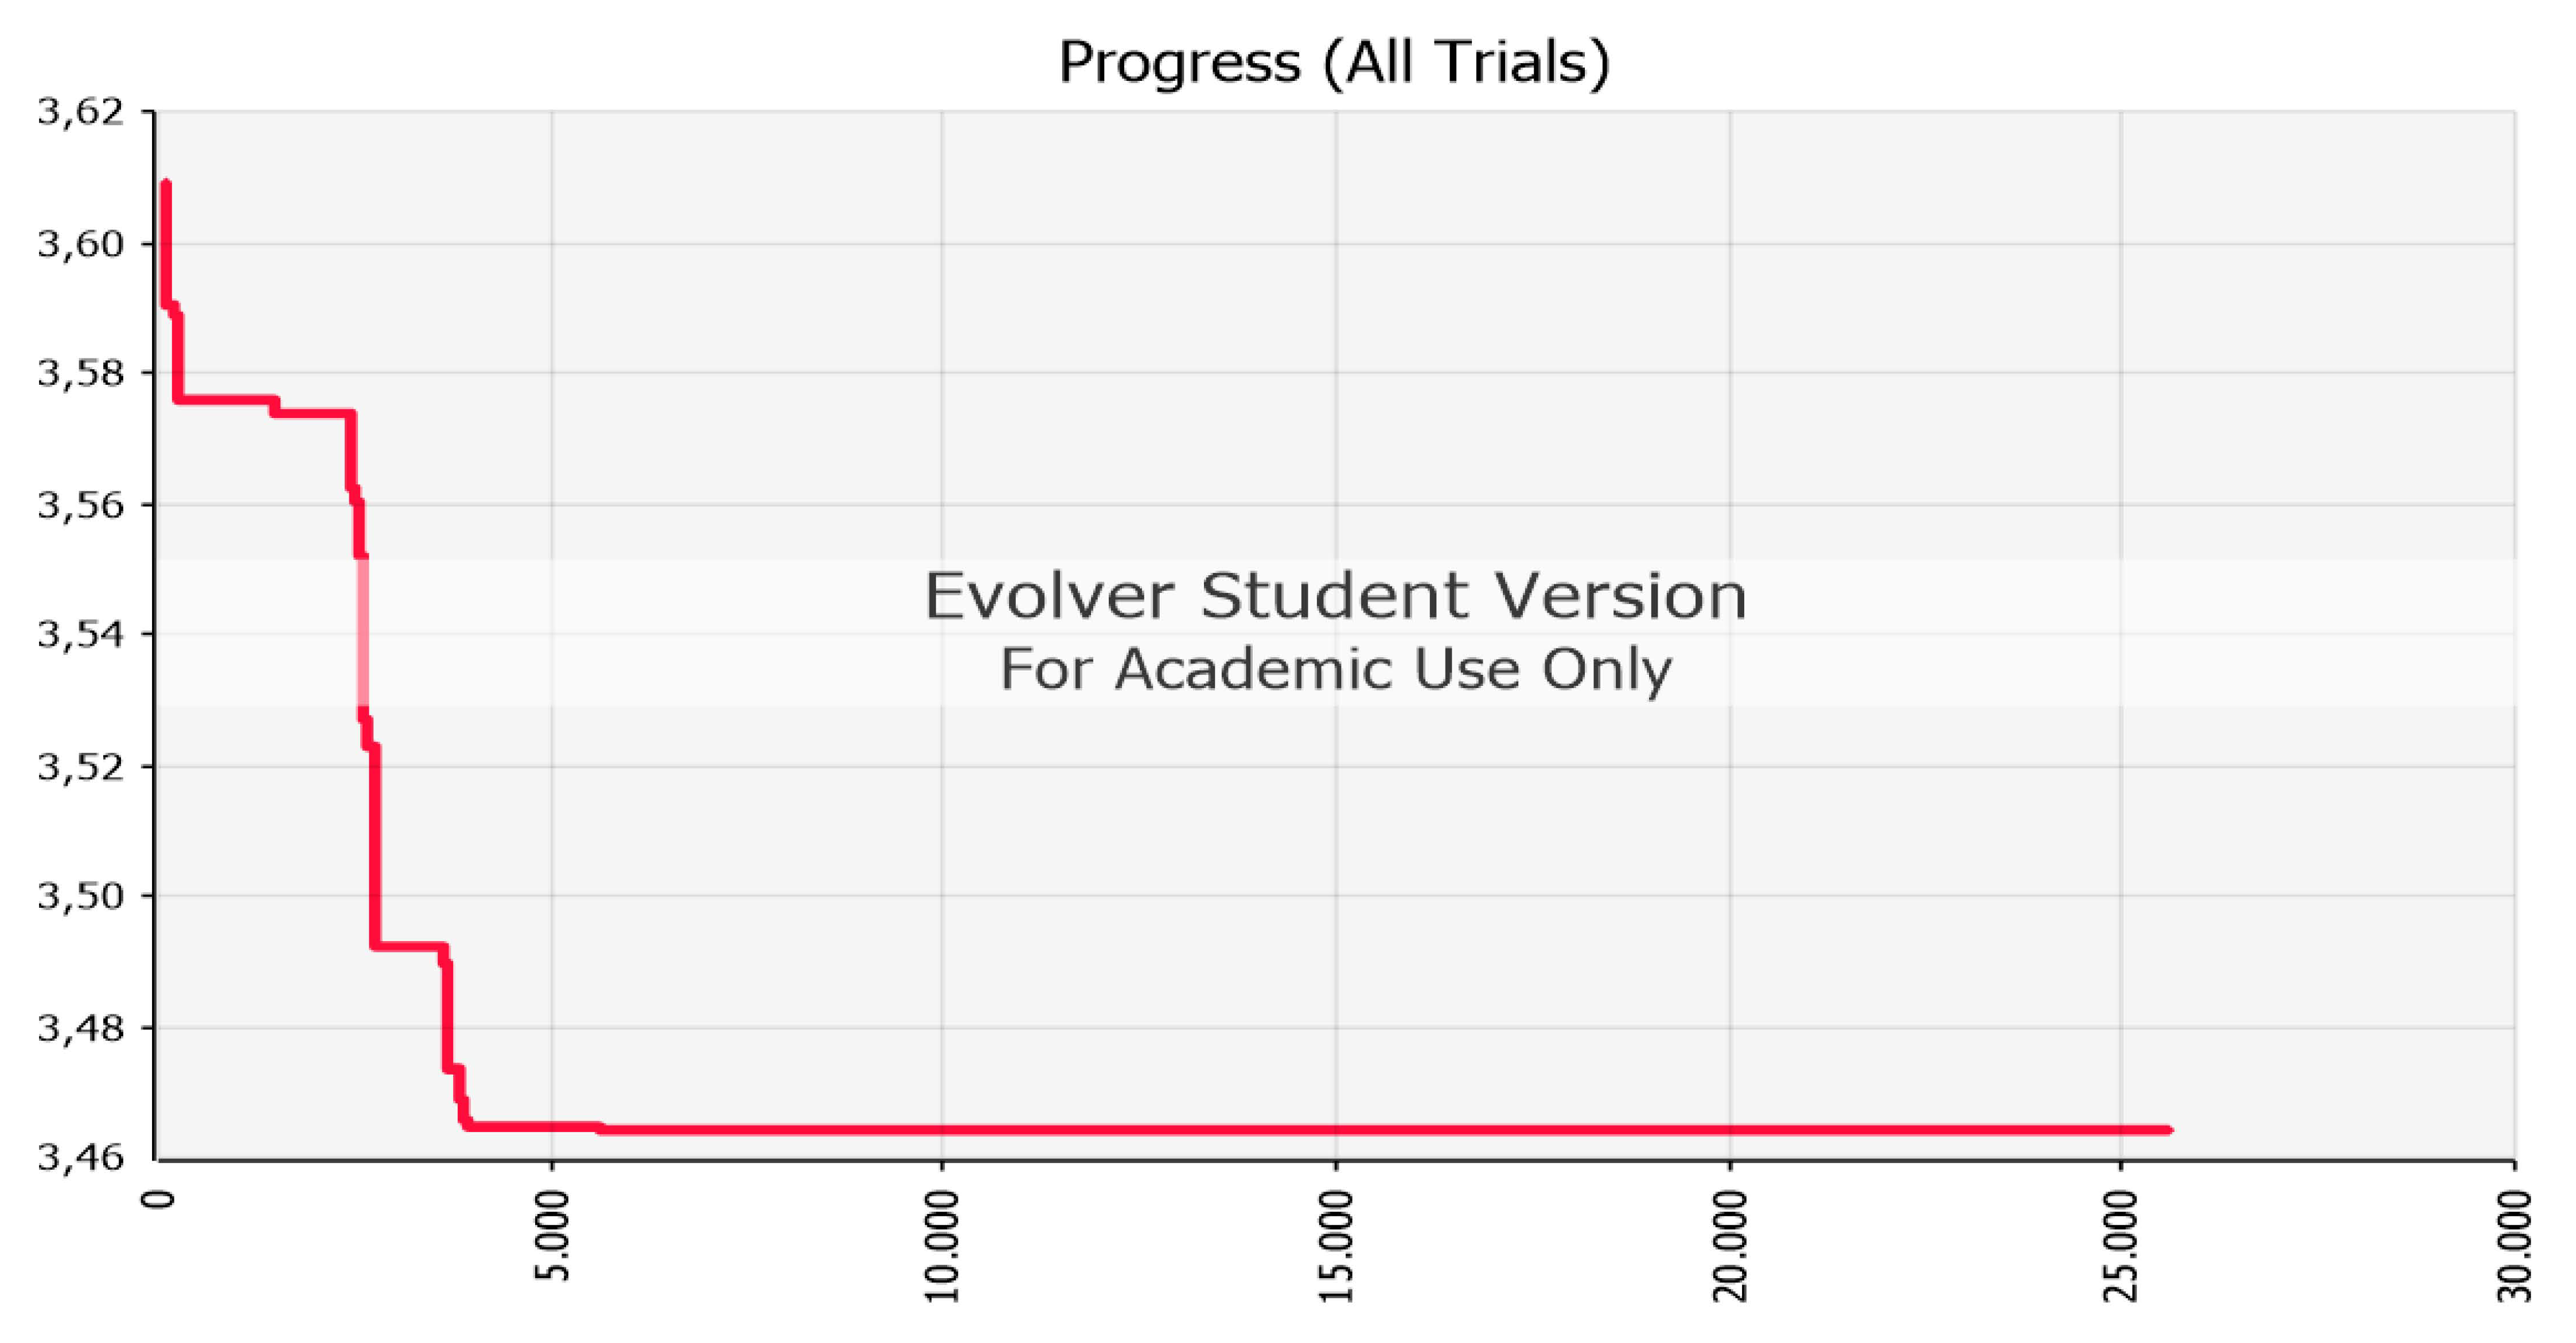
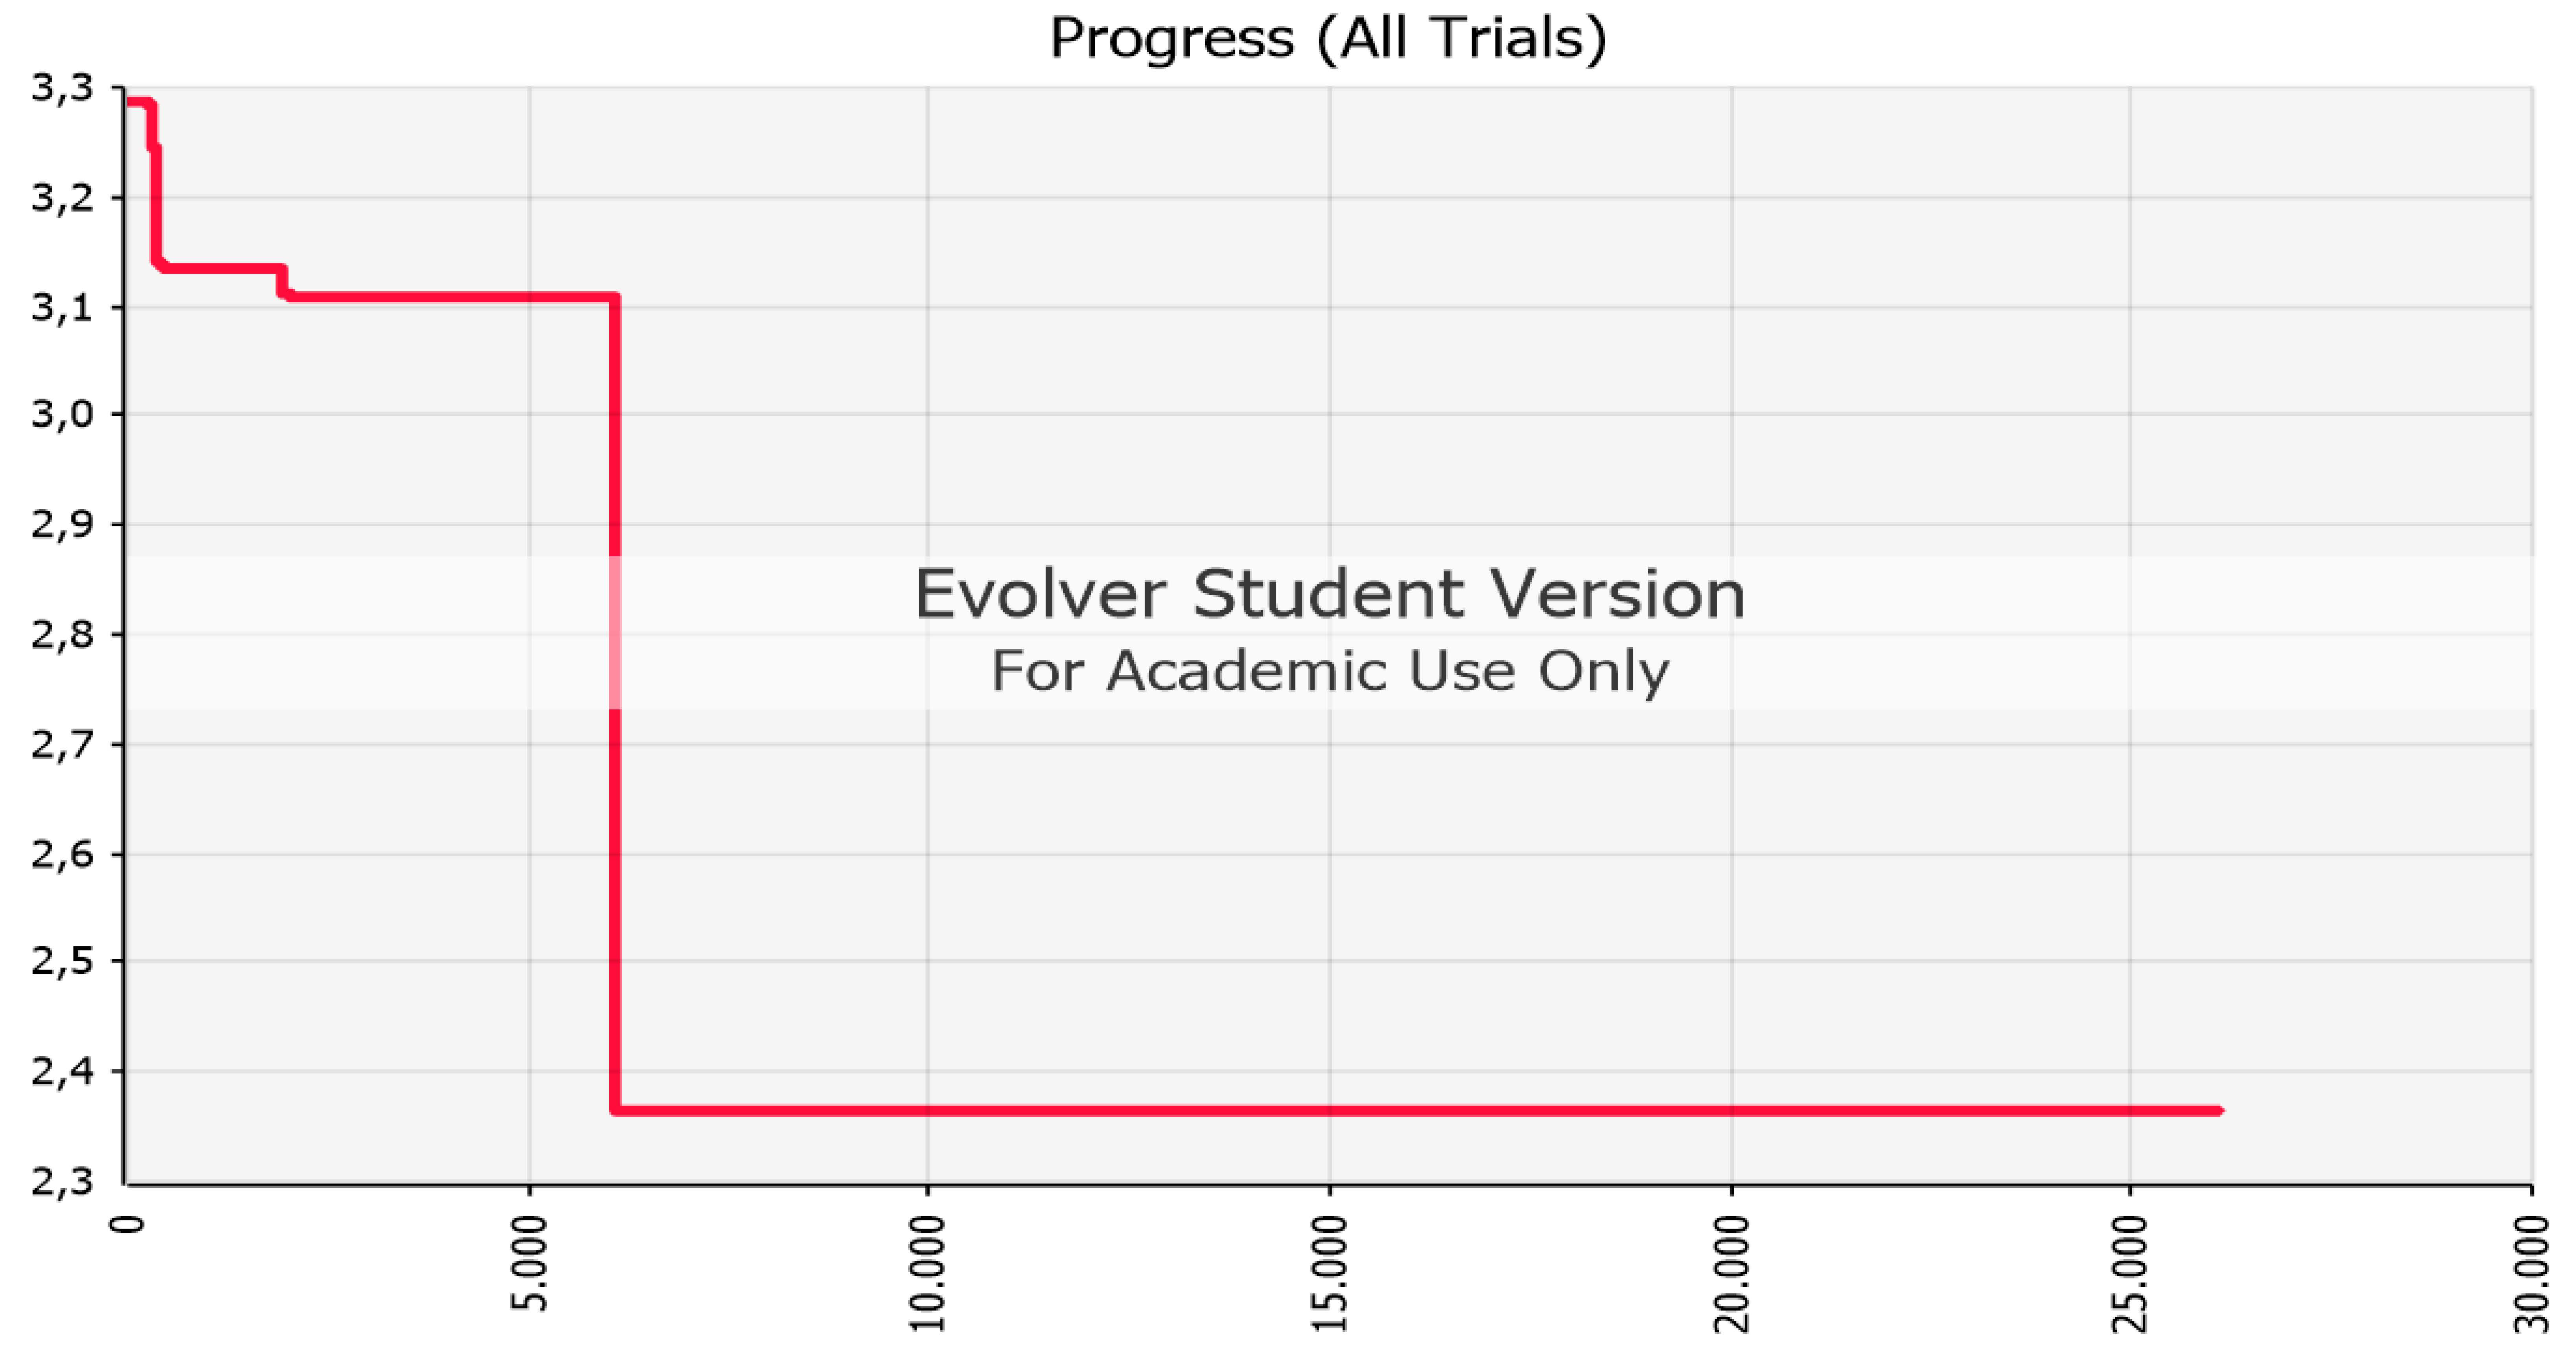
Table 10). We can see from the charts (
Figure 1,
Figure 2 and
Figure 3) how the goal value (sum of EIP elements) is minimized until there is no other optimal solution.
In each restructure a new EIP has been created according to the exchange of the shares from the parent to the group’s companies. In any case the EMC has been retained stable and equal or over 0.50 and thus each company is still being controlled by the group. The new structure of the group drives to different smaller EIP from the parent company and larger NCI as reflected in
Table 11 and
Table 12.
Finally, from the above differences in EIP between the static and each of our models we can calculate parent company’s consolidated cash increase. That is the consolidated value of the shares that have been traded (
Table 13):
Starting with a static group structure we applied three different assumption models regarding the optimal structure of the group. In Models 1 and 2 we applied hard constraints regarding the participation rates while in Model 3 the differentiation was the available cash for investment. Doing this, we wanted to test how the optimal structure will be formed by follow certain rules in accordance to accounting or management standards and how the available cash is affecting the optimal structure.
In Model 1 the EIP was decreased in five of the nine companies. The direct share participations were fully traded in four of the companies. The EMC was stable as at the static model and the cash increase was mainly due to shares exchange of the low value companies. In Model 2 we observe almost the same results although the direct participation rates constraint is stricter. The EIP is also decreased, but with the assumption that the parent should hold a minimum level of direct participation, the direct shares cannot be fully traded. EMC is also stable as in the initial structure with only a slight increase in one company. Lastly, in Model 3 we observe how available CCE
2 increases the ability of the companies to invest and participate in share trades within the group. Whilst in the previous two models the CCE constraint decreased companies’ availability for further investment, we accomplished further share exchange by increasing this amount. In fact, due to low funds in the first two models, not all companies could participate in the trade, compared to Model 3. Moreover, thanks to subsidiaries crossholdings within the group, the redistribution of the shares created an increased EMC to some companies and a high capital increase for the parent company. Summarizing, in each of the three cases the parent company managed to increase its capital and maintain control over the groups’ companies while at the same time the non-controlling interest was increased and the EIP was minimized.
5. Conclusions
What is mentioned in this article is that in a group of companies where there are holdings in a pyramid form or more complicated format, hidden control rights exist. Despite the fact a lot of research has been carried out on shareholding rights within a group, their importance in controlling companies and how control can be measured using specific indicators, what we have considered in this article is straightforward: Which is the optimal level at which a company controlling other companies can benefit from its power and increase its capital, without losing control of the group, by simply reducing its shareholdings. We used existing research which has already analysed, how one can measure control rights within a company and how can be calculated. The goal of this article is to find the minimum and optimal level under a group with given participation rights between the companies, where a parent company can continue to exert control and at the same time increases its capital from the share rights that have been lost.
An optimal group structure in terms of minimum invested share capital and effective control rights, depends on numerous factors such as: Value of Companies, available cash and cash equivalents for investment, desired group strategy and regulation rules.
All these factors are affecting and creating different data for the group’s final form. From the above analysis we tried to present some of them and test how these factors affect the newly created structure. By testing our models, we can say that depending on companies’ values within the group and their available funds for investment, the intra trade will be more complex, with multiple crossholdings and a higher increase in capital gain for the parent company. Nevertheless, we cannot highlight the significance of management decisions regarding the desirable structure and the restrictions they may impose. It is obvious that above model is a complex constraint problem, and the change or additional import of just one factor can lead to a completely different outcome. To extend this approach further a sensitivity analysis of group companies’ values is necessary. We observed that when we have an increase in the available cash amounts for subsidiaries which are invested as intra group participations the effected integration participation rates of parent company are further decreasing. In such cases the loops between the companies are increasing.
Another case for further research is to examine a new acquisition from the group, finding the optimal allocation of financing and how it will affect the optimal structure of the group.
Our primer model must be fulfilled with its own shares between the subsidiaries and from the subsidiaries to parent. Moreover, the initial purchase cost of any acquisition must be taken into account in order to examine the negative or positive goodwill that arise.


 ,
, 
