
An Assessment of the Association between Political Orientation and Financial Risk Tolerance


Abstract
:1. Introduction
2. Study Background and Research Hypotheses
2.1. Political Orientation, Risk Tolerance, and Risk-Taking
2.2. Other Factors Associated with Financial Risk Tolerance
2.3. Research Hypotheses
3. Methods
3.1. Outcome Variable
3.2. Political Orientation
3.3. Covariates
3.4. Data Analysis Methods
4. Results
5. Discussion and Conclusions
Author Contributions
Funding
Institutional Review Board Statement
Informed Consent Statement
Data Availability Statement
Conflicts of Interest
| 1 | Concerning these two characteristics, men are thought to be more risk tolerant (Hallahan et al. 2004; Hartnett et al. 2019), whereas older financial decision makers are assumed to be less risk tolerant (Brooks et al. 2018; Koekemoer 2018). |
| 2 | Personal environmental factors may provide a decision maker with the capacity to deal with negative financial outcomes associated with decision choices. Personal environmental characteristics may also equip decision makers with the financial and cognitive tools needed to organize and reframe choice scenarios and potential and realized outcomes. |
| 3 | Endogeneity issues plague much of the existing biopsychosocial, environmental, risk tolerance, and risk-taking behavior literature. More specifically, causality issues abound in much of the existing literature that attempts to link political orientation and risk tolerance and/or risk-taking. The predominant thinking is that risk tolerance—and its opposite, risk aversion—provides a pathway to risk-taking. The conceptual foundation for this argument is that risk tolerance is akin to a psychological trait, similar to personality (Dhiman and Raheja 2018; Rabbani et al. 2019; Wong and Carducci 2013). Those who make this argument suggest that risk tolerance at the individual level is relatively constant across choice scenarios and over time. Similar to the notion that behavioral intention should precede behavior (Ajzen 1991), risk tolerance is often assumed to pave the way to an engagement in risk-taking behavior (Irwin and Millstein 1986). It is possible, however, that the mere act of engaging in a risky behavior shifts a decision maker’s willingness to take a future risk. Those who view risk tolerance this way argue that outcomes associated with previous actions may inform decision-maker expectations, which then lead decision makers to attempt to avoid subsequent regret and disappointment (Kahneman 2009; Pan and Statman 2012). The key takeaway from this discussion is that while a great deal of research effort has taken place to better understand the relationships between and among biopsychosocial, environmental, and risk-tolerance variables, all that can be said with certainty is that characteristics such as gender, age, income, and education appear to be associated with risk tolerance. There has not been sufficient research focused on exploring the causal relationships between and among these types of variables. This means that while causal associations are often hinted at in the literature, those interested in risk tolerance as a topic of study should move forward cautiously before inferring causation in the domain of financial risk tolerance and risk-taking. This is particularly true in relation to the potential association between risk tolerance and political orientation. |
| 4 | The selection of the political party for the negative scores was accomplished through a coin toss. |
References
- Ajzen, Icek. 1991. The theory of planned behavior. Organizational Behavior and Human Decision Processes 50: 179–211. [Google Scholar] [CrossRef]
- Alesina, Alberto, and George-Marios Angeletos. 2005. Fairness and redistribution. American Economic Review 95: 960–80. [Google Scholar] [CrossRef] [Green Version]
- Anbar, Adem, and Melek Eker. 2010. An empirical investigation for determining of the relation between personal financial risk tolerance and demographic characteristic. Ege Akademik Bakis Dergisi 10: 503–22. [Google Scholar] [CrossRef]
- Brooks, Chris, Ivan Sangiorgi, Carola Hillenbrand, and Kevin Money. 2018. Why are older investors less willing to take financial risk? International Review of Financial Analysis 56: 52–72. [Google Scholar] [CrossRef]
- Chavali, Kavita, and M. Prasanna Mohanraj. 2016. Impact of demographic variables and risk tolerance on investment decisions: An empirical analysis. International Journal of Economics and Financial Issues 6: 169–75. [Google Scholar]
- Chin, M. Kyun, Donald C. Hambrick, and Linda K. Treviño. 2013. Political ideologies of CEOs: The influence of executives’ values on corporate social responsibility. Administrative Science Quarterly 58: 197–232. [Google Scholar] [CrossRef]
- Chin, M. Kyun, Stephen X. Zhang, Asghar A. Jahanshahi, and Sucheta Nadkarni. 2021. Unpacking political ideology: CEO social and economic ideologies, strategic decision-making processes, and corporate entrepreneurship. Academy of Management Journal 64: 1213–35. [Google Scholar] [CrossRef]
- Christensen, M. Dane, Dan S. Dhaliwal, Steven Boivie, and Scott D. Graffin. 2015. Top management conservatism and corporate risk strategies: Evidence from managers’ personal political orientation and corporate tax avoidance. Strategic Management Journal 36: 1918–38. [Google Scholar] [CrossRef] [Green Version]
- Dhiman, Babli, and Saloni Raheja. 2018. Do personality traits and emotional intelligence of investors determine their risk tolerance? Management and Labour Studies 43: 88–99. [Google Scholar] [CrossRef]
- Fang, Ming, Haiyang Li, and Qin Wang. 2021. Risk tolerance and household wealth—Evidence from Chinese households. Economic Modelling 94: 885–95. [Google Scholar] [CrossRef]
- Ferreira, Suné J., and Zandri Dickason. 2018. Gender and behavior: The effect of gender and ethnicity on financial risk tolerance in South Africa. Gender and Behaviour 16: 10851–62. [Google Scholar]
- Fisher, Patti J. 2019. Black-White differences in financial risk tolerance. Journal of Financial Service Professionals 73: 70–82. [Google Scholar] [CrossRef]
- Gibson, Ryan J., David Michayluk, and Gerhard Van de Venter. 2013. Financial risk tolerance: An analysis of unexplored factors. Financial Services Review 22: 23–50. [Google Scholar]
- Grable, John E., and Michael J. Roszkowski. 2007. Self-assessment of risk tolerance by women and men. Psychological Reports 100: 795–802. [Google Scholar] [CrossRef] [PubMed]
- Grable, John E., and Ruth H. Lytton. 1999. Financial risk tolerance revisited: The development of a risk assessment instrument. Financial Services Review 8: 163–81. [Google Scholar] [CrossRef]
- Grable, John E., and So-Hyun Joo. 2004. Environmental and biopsychosocial factors associated with financial risk tolerance. Journal of Financial Counseling and Planning 15: 73–82. [Google Scholar]
- Grable, John E. 2000. Financial risk tolerance and additional factors that affect risk taking in everyday money matters. Journal of Business and Psychology 14: 625–30. [Google Scholar] [CrossRef]
- Gupta, Abhinav, Sucheta Nadkarni, and Misha Mariam. 2018. Dispositional sources of managerial discretion: CEO ideology, CEO personality, and firm strategies. Administrative Science Quarterly 64: 855–93. [Google Scholar] [CrossRef]
- Hallahan, A. Terrence, Robert W. Faff, and Michael D. McKenzie. 2004. An empirical investigation of personal financial risk tolerance. Financial Services Review 13: 57–78. [Google Scholar]
- Hartnett, Neil, Paul Gerrans, and Robert Faff. 2019. Trusting clients’ financial risk tolerance survey scores. Financial Analysts Journal 75: 91–104. [Google Scholar] [CrossRef]
- Heo, Wookjae, Abed G. Rabbani, John E. Grable, and Michael Roszkowski. 2022. The alpha and omega of financial risk-tolerance assessment. Financial Planning Review 5: e1138. [Google Scholar] [CrossRef]
- Irwin, Charles E., and Susan G. Millstein. 1986. Biopsychosocial correlates of risk-taking behaviors during adolescence: Can the physician intervene? Journal of Adolescent Health Care 7: 82–96. [Google Scholar] [CrossRef]
- Jianakoplos, Nancy Ammon, and Alexandra Bernasek. 2006. Financial risk taking by age and birth cohort. Southern Economic Journal 72: 981–1001. [Google Scholar]
- Kahneman, Daniel. 2009. The myth of risk attitudes. Journal of Portfolio Management 36: 1. [Google Scholar] [CrossRef]
- Kaustia, Markku, and Sami Torstila. 2011. Stock market aversion? Political preferences and stock market participation. Journal of Financial Economics 100: 91–112. [Google Scholar] [CrossRef]
- Koekemoer, Zandri. 2018. The influence of demographic factors on risk tolerance for South African investors. Paper presented at the International Academic Conference, London, UK, May 25; p. 6408640. [Google Scholar]
- Kuzniak, Stephen, Abed G. Rabbani, Wookjae Heo, Jorge Ruiz-Menjivar, and John E. Grable. 2015. The Grable and Lytton risk-tolerance scale: A 15-year retrospective. Financial Services Review 24: 177–92. [Google Scholar]
- Larkin, Charles, Brian M. Lucey, and Megan Mulholland. 2013. Risk tolerance and demographic characteristics: Preliminary Irish evidence. Financial Services Review 22: 77–91. [Google Scholar]
- Layman, Geoffrey, Thomas Carsey, and Juliana M. Horowitz. 2006. Party polarization in American politics: Characteristics, causes, and consequences. Annual Review of Political Science 33: 1404–1418. [Google Scholar] [CrossRef]
- Levendusky, Matthew. 2009. The Partisan Sort: How liberals Became Democrats and Conservatives Became Republicans. Chicago: University of Chicago Press. [Google Scholar]
- Long, J. Scott, and Jeremy Freese. 2014. Regression Models for Categorical Dependent Variables Using Stata, 3rd ed. College Station: Stata Press. [Google Scholar]
- Lucarelli, Caterina, Cristina Ottaviani, and Daniela Vandone. 2011. The layout of the empirical analysis. In Risk Tolerance in Financial Decision Making. Edited by Lucarelli Caterina and Gianni Brighetti. London: Palgrave MacMillan, pp. 153–80. [Google Scholar]
- Morris, Michael W, Erica Carranza, and Craig R. Fox. 2008. Mistaken identify: Activating conservative political identities induces “conservative” financial decisions. Psychological Science 19: 1154–60. [Google Scholar] [CrossRef]
- Pan, Carrie H., and Meir Statman. 2012. Questionnaires of risk tolerance, regret, overconfidence, and other investor propensities. The Journal of Investment Consulting 14: 54–63. [Google Scholar] [CrossRef] [Green Version]
- Pasta, David J. 2009. Learning when to be discrete: Continuous vs. categorical predictors. In SAS Global Forum 248: 1–10. Available online: https://support.sas.com/resources/papers/proceedings09/248-2009.pdf (accessed on 8 January 2022).
- Pinjisakikool, Teerapong. 2017. The influence of personality traits on households’ financial risk tolerance and financial behavior. Journal of Interdisciplinary Economics 30: 32–54. [Google Scholar] [CrossRef]
- Rabbani, Abed G., and Liana Holanda N. Nobre. 2022. Financial risk tolerance. In De Gruyter Handbook of Personal Finance. Edited by John E. Grable and Chatterjee Swarn. Berlin: De Gruyter, pp. 137–56. [Google Scholar]
- Rabbani, Abed G., John E. Grable, Wookjae Heo, Liana Nobre, and Stephen Kuzniak. 2017. Stock market volatility and changes in financial risk tolerance during the great recession. Journal of Financial Counseling and Planning 28: 140–54. [Google Scholar] [CrossRef]
- Rabbani, Abed G., Zheying Yao, and Christina Wang. 2019. Does personality predict financial risk tolerance of pre-retiree baby boomers? Journal of Behavioral and Experimental Finance 23: 124–32. [Google Scholar] [CrossRef]
- Ripberger, Joseph T., Geoboo Song, Matthew C. Nowlin, Michael J. Jones, and Hank C. Jenkins-Smith. 2012. Reconsidering the relationship between cultural theory, political ideology, and political knowledge. Social Science Quarterly 93: 713–31. [Google Scholar] [CrossRef]
- Sahm, Cludia R. 2012. How much does risk tolerance change? Quarterly Journal of Finance 2: 1–38. [Google Scholar] [CrossRef] [Green Version]
- Semadeni, Matthenw, M. K. Chin, and Ryan Krause. 2021. Pumping the brakes: Examining the impact of CEO political ideology divergence on firm responses. Academy of Management Journal 64: 1213–1235. [Google Scholar] [CrossRef]
- Swigart, Kristen L., Anuradha Anantharaman, Jason A. Williamson, and Alicia A. Grandey. 2020. Working while liberal/conservative: A review of political ideology in organizations. Journal of Management 46: 1063–91. [Google Scholar] [CrossRef]
- Wang, Alex. 2009. Interplay of investors’ financial knowledge and risk taking. Journal of Behavioral Finance 10: 204–13. [Google Scholar] [CrossRef]
- Wildavsky, Aaron, and Karl Dake. 1990. Theories of risk perception: Who fears what and why? Daedalus 119: 41–60. [Google Scholar]
- Wong, Alan, and Bernardo Carducci. 2013. Does personality affect personal financial risk tolerance behavior? IUP Journal of Applied Finance 19: 5–18. [Google Scholar]
- Wong, Alan. 2011. Financial risk tolerance and selected demographic factors: A comparative study in 3 countries. Global Journal of Finance & Banking Issues 5: 1–12. [Google Scholar]
- Yang, Yali. 2004. Characteristics of risk preferences: Revelations from Grable & Lytton’s 13- item questionnaire. Journal of Personal Finance 3: 20–40. [Google Scholar]
- Yao, Rui, Deanna L. Sharpe, and Feifei Wang. 2011. Decomposing the age effect on risk tolerance. The Journal of Socio-Economics 40: 879–87. [Google Scholar] [CrossRef] [Green Version]

| Democratic Party Orientation | ||||||
|---|---|---|---|---|---|---|
| Not at All | Somewhat | Quite a Bit | Always | Total | ||
| Republican Party Orientation | Not at All | 15% | 7% | 14% | 18% | 55% |
| Somewhat | 7% | 8% | 3% | 1% | 19% | |
| Quite a Bit | 9% | 2% | 1% | 0% | 11% | |
| Always | 14% | 1% | 0% | 0% | 15% | |
| Total | 45% | 17% | 18% | 20% | 100% | |
| Correlations | ||||||
|---|---|---|---|---|---|---|
| Mean | Std. Deviation | 1 | 2 | 3 | ||
| 1 | Political Orientation | −0.27 | 2.00 | 0.199 ** | ||
| 2 | FRT (Wave 1) | 23.91 | 5.24 | 0.09 | 0.734 ** | |
| 3 | FRT (Wave 2) | 24.14 | 5.37 | −0.126 * | −0.328 ** | 0.401 ** |
| Change in FRT | 0.13 | 3.88 | ||||
| Characteristic | Mean/Incidence | SD | High Republican Affiliation | High Democratic Affiliation | t | p |
|---|---|---|---|---|---|---|
| Female (vs. Male) | 52% | 41% | 60% | −2.73 | 0.01 | |
| Subj. Fin Know (1–5) | 3.14 | 1.05 | 3.47 | 2.92 | 3.82 | <0.001 |
| Household Income (1–12) | 7.64 | 3.55 | 8.47 | 7.52 | 1.99 | 0.05 |
| Wealth Status (1–5) | 3.93 | 1.08 | 4.36 | 3.81 | 4.06 | <0.001 |
| Bachelor’s Degree or Higher | 59% | 56% | 63% | −1.00 | 0.32 | |
| Homeowner | 72% | 90% | 65% | 4.50 | <0.001 | |
| Married | 52% | 68% | 43% | 3.55 | <0.001 | |
| White/Caucasian | 69% | 88% | 55% | 5.53 | <0.001 | |
| Black | 13% | 1% | 25% | −5.60 | <0.001 | |
| Hispanic | 9% | 7% | 13% | −1.25 | 0.21 | |
| Asian | 5% | 0% | 3% | −2.03 | 0.05 | |
| Age 18 to 24 | 7% | 1% | 7% | −2.11 | 0.04 | |
| Age 25 to 34 | 12% | 6% | 18% | −2.62 | 0.01 | |
| Age 35 to 44 | 15% | 15% | 20% | −1.02 | 0.31 | |
| Age 45 to 54 | 23% | 25% | 19% | 0.87 | 0.38 | |
| Age 55 to 64 | 18% | 17% | 14% | 0.55 | 0.59 | |
| Age 65 to 74 | 17% | 23% | 19% | 0.62 | 0.54 | |
| Age 75 or Older | 6% | 11% | 3% | 1.74 | 0.09 |
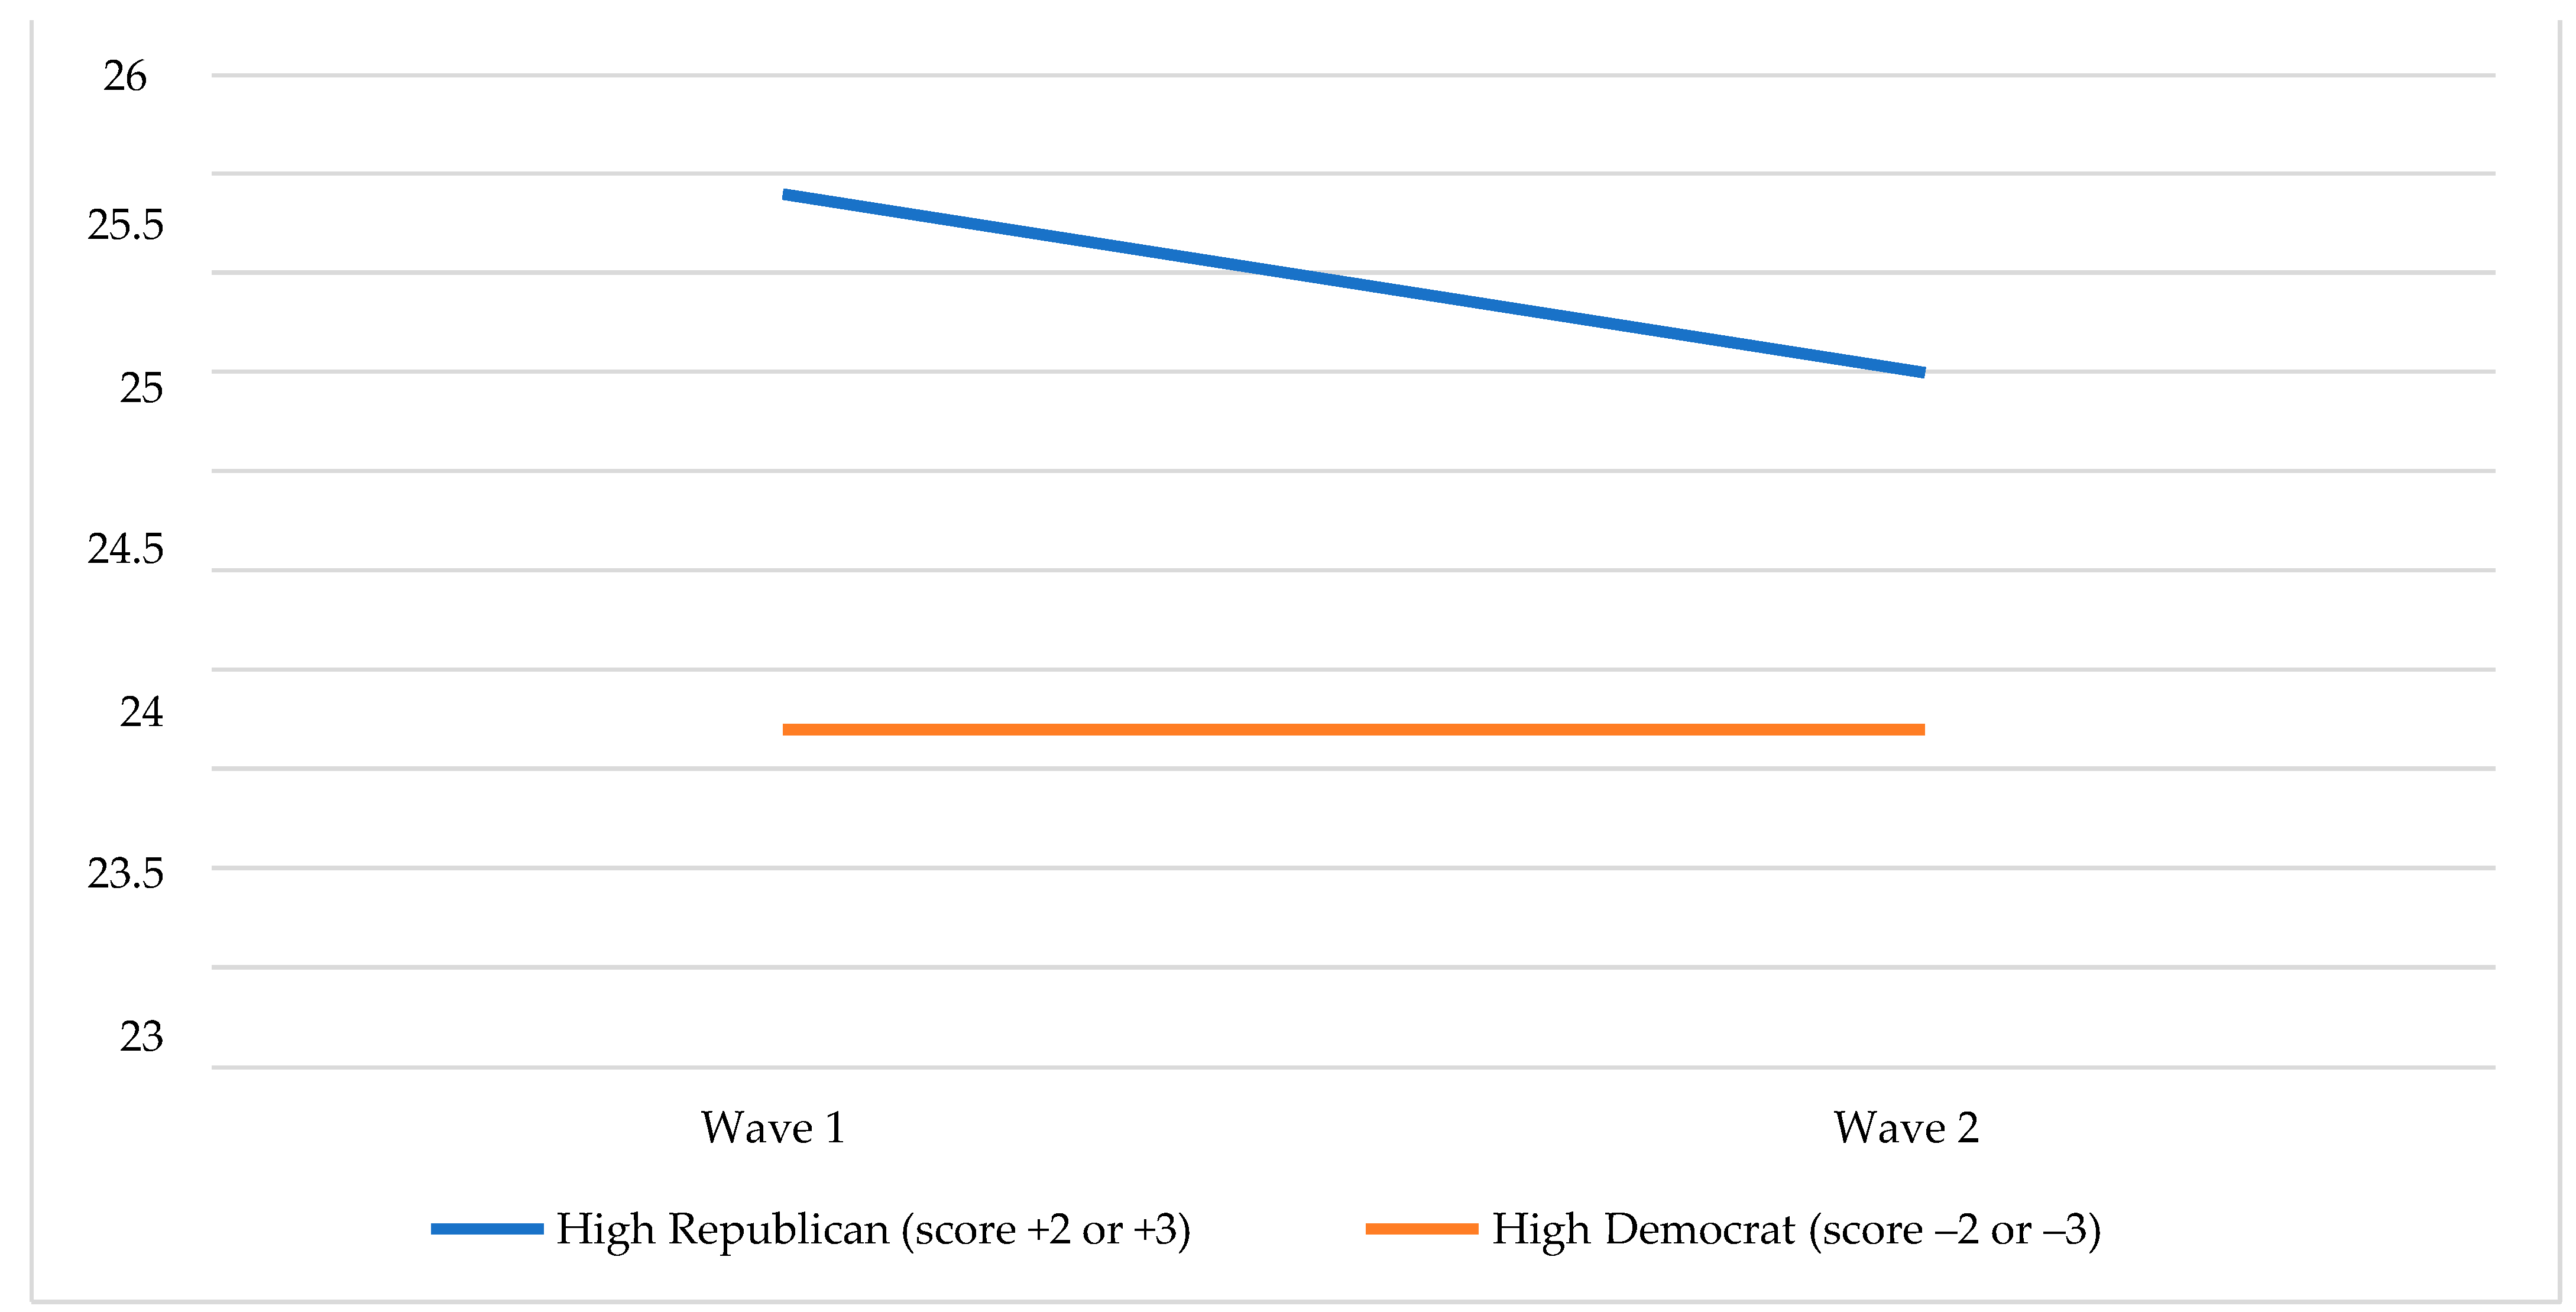
| Survey | High Republican Affiliation | High Democratic Affiliation | t | p |
|---|---|---|---|---|
| Wave 1 Survey FRT | 25.33 | 22.56 | 3.76 | <0.001 |
| Wave 2 Survey FRT | 24.41 | 23.19 | 1.70 | 0.091 |
| Change in FRT from Wave 1 to Wave 2 | −0.94 | 0.42 | −2.26 | 0.025 |
| Wave 1 Survey | Wave 2 Survey | |||||||
|---|---|---|---|---|---|---|---|---|
| Estimate | SE | β | p | Estimate | SE | β | p | |
| (Constant) | 18.13 | 1.35 | <0.001 | 17.41 | 1.42 | <0.001 | ||
| Political Orientation (High = Republican) | 0.37 | 0.14 | 0.14 | 0.01 | 0.11 | 0.15 | 0.04 | 0.44 |
| Female (vs. Male) | −1.53 | 0.55 | −0.15 | 0.01 | −1.29 | 0.58 | −0.12 | 0.03 |
| Subj. Fin Know | 1.25 | 0.27 | 0.25 | <0.001 | 1.31 | 0.28 | 0.25 | <0.001 |
| Married | −0.74 | 0.60 | −0.07 | 0.22 | −0.20 | 0.63 | −0.02 | 0.75 |
| Black | 0.72 | 0.84 | 0.05 | 0.40 | 0.39 | 0.89 | 0.02 | 0.66 |
| Hispanic | −0.02 | 0.90 | 0.00 | 0.98 | −0.43 | 0.96 | −0.02 | 0.65 |
| Asian | −1.40 | 1.67 | −0.06 | 0.40 | 2.50 | 1.74 | 0.11 | 0.15 |
| Other Race | 0.44 | 1.32 | 0.03 | 0.74 | 0.10 | 1.37 | 0.01 | 0.94 |
| Bachelor’s Degree or Higher | 1.23 | 0.61 | 0.12 | 0.04 | 1.63 | 0.64 | 0.15 | 0.01 |
| Homeownership | 0.90 | 0.70 | 0.08 | 0.19 | 1.15 | 0.72 | 0.10 | 0.11 |
| Household Income | 0.12 | 0.10 | 0.08 | 0.20 | 0.16 | 0.10 | 0.11 | 0.10 |
| Self-Reported Net Worth | 0.26 | 0.28 | 0.06 | 0.35 | 0.03 | 0.30 | 0.01 | 0.92 |
| Age 18 to 24 | 1.92 | 1.13 | 0.10 | 0.09 | 1.38 | 1.18 | 0.07 | 0.24 |
| Age 25 to 34 | 0.32 | 0.92 | 0.02 | 0.73 | 1.36 | 0.98 | 0.08 | 0.16 |
| Age 35 to 44 | −0.22 | 0.79 | −0.02 | 0.78 | 0.40 | 0.84 | 0.03 | 0.63 |
| Age 55 to 64 | −0.64 | 0.75 | −0.05 | 0.39 | −0.30 | 0.79 | −0.02 | 0.71 |
| Age 65 to 74 | −0.50 | 0.76 | −0.03 | 0.55 | −0.82 | 0.80 | −0.06 | 0.32 |
| Age 75 or Older | −2.66 | 1.18 | −0.12 | 0.03 | −1.01 | 1.23 | −0.04 | 0.42 |
| R2 | 0.23 | 0.23 | ||||||
| F Statistic | 5.63 | 5.44 | ||||||
| p-Value | <0.001 | <0.001 | ||||||
| Estimate | SE | β | p | |
|---|---|---|---|---|
| (Constant) | −0.71 | 1.10 | 0.52 | |
| Political Orientation (High = Republican) | −0.27 | 0.11 | −0.14 | 0.02 |
| Female (vs. Male) | 0.38 | 0.45 | 0.05 | 0.40 |
| Subj. Fin Know | 0.06 | 0.22 | 0.02 | 0.78 |
| Married | 0.62 | 0.49 | 0.08 | 0.20 |
| Black | −0.38 | 0.69 | −0.03 | 0.57 |
| Hispanic | −0.82 | 0.75 | −0.06 | 0.28 |
| Asian | 3.95 | 1.34 | 0.24 | 0.01 |
| Other Race | −0.33 | 1.06 | −0.03 | 0.76 |
| Bachelor’s Degree or Higher | 0.41 | 0.49 | 0.05 | 0.41 |
| Homeownership | 0.24 | 0.56 | 0.03 | 0.67 |
| Household Income | 0.03 | 0.08 | 0.03 | 0.70 |
| Self-Reported Net Worth | −0.25 | 0.23 | −0.07 | 0.28 |
| Age 18 to 24 | −0.58 | 0.91 | −0.03 | 0.58 |
| Age 25 to 34 | 0.88 | 0.76 | 0.07 | 0.25 |
| Age 35 to 44 | 0.65 | 0.65 | 0.06 | 0.32 |
| Age 55 to 64 | 0.31 | 0.61 | 0.03 | 0.61 |
| Age 65 to 74 | −0.24 | 0.62 | −0.02 | 0.70 |
| Age 75 or Older | 1.70 | 0.96 | 0.10 | 0.08 |
| R2 | 0.11 | |||
| F Statistic | 2.27 | |||
| p-Value | 0.002 |
| Estimate | SE | β | p | |
|---|---|---|---|---|
| (Constant) | −0.59 | 1.08 | 0.59 | |
| Republican Party Affiliation | −0.92 | 0.48 | −0.11 | 0.05 |
| Female (vs. Male) | 0.34 | 0.44 | 0.04 | 0.44 |
| Subj. Fin Know | 0.01 | 0.21 | 0.00 | 0.96 |
| Married | 0.45 | 0.47 | 0.06 | 0.35 |
| Black | −0.08 | 0.66 | −0.01 | 0.90 |
| Hispanic | −0.36 | 0.70 | −0.03 | 0.61 |
| Asian | 3.29 | 1.30 | 0.19 | 0.01 |
| Other Race | 0.21 | 0.99 | 0.02 | 0.84 |
| Bachelor’s Degree or Higher | 0.36 | 0.48 | 0.05 | 0.45 |
| Homeownership | 0.31 | 0.56 | 0.04 | 0.58 |
| Household Income | 0.06 | 0.08 | 0.05 | 0.47 |
| Self-Reported Net Worth | −0.21 | 0.23 | −0.06 | 0.36 |
| Age 18 to 24 | −0.53 | 0.91 | −0.04 | 0.56 |
| Age 25 to 34 | 1.05 | 0.75 | 0.09 | 0.16 |
| Age 35 to 44 | 0.70 | 0.64 | 0.06 | 0.28 |
| Age 55 to 64 | 0.11 | 0.59 | 0.01 | 0.86 |
| Age 65 to 74 | 0.04 | 0.60 | 0.00 | 0.95 |
| Age 75 or Older | 1.67 | 0.93 | 0.10 | 0.07 |
| R2 | 0.10 | |||
| F Statistic | 2.06 | |||
| p-Value | 0.007 |
| Estimate | SE | β | p | |
|---|---|---|---|---|
| (Constant) | −0.95 | 1.07 | 0.38 | |
| Democratic Party Affiliation | 0.81 | 0.44 | 0.10 | 0.07 |
| Female (vs. Male) | 0.34 | 0.44 | 0.04 | 0.43 |
| Subj. Fin Know | −0.02 | 0.21 | −0.01 | 0.92 |
| Married | 0.49 | 0.48 | 0.06 | 0.30 |
| Black | 0.07 | 0.65 | 0.01 | 0.92 |
| Hispanic | −0.77 | 0.72 | −0.06 | 0.29 |
| Asian | 4.02 | 1.34 | 0.24 | <0.001 |
| Other Race | −0.23 | 1.06 | −0.02 | 0.83 |
| Bachelor’s Degree or Higher | 0.58 | 0.48 | 0.07 | 0.23 |
| Homeownership | 0.25 | 0.55 | 0.03 | 0.65 |
| Household Income | 0.05 | 0.08 | 0.04 | 0.56 |
| Self-Reported Net Worth | −0.23 | 0.23 | −0.06 | 0.32 |
| Age 18 to 24 | −0.38 | 0.91 | −0.03 | 0.67 |
| Age 25 to 34 | 0.90 | 0.75 | 0.07 | 0.23 |
| Age 35 to 44 | 0.78 | 0.64 | 0.07 | 0.23 |
| Age 55 to 64 | 0.27 | 0.59 | 0.03 | 0.65 |
| Age 65 to 74 | −0.47 | 0.60 | −0.05 | 0.43 |
| Age 75 or Older | 1.71 | 0.95 | 0.10 | 0.07 |
| R2 | 0.11 | |||
| F Statistic | 2.28 | |||
| p-Value | 0.002 |
Publisher’s Note: MDPI stays neutral with regard to jurisdictional claims in published maps and institutional affiliations. |
© 2022 by the authors. Licensee MDPI, Basel, Switzerland. This article is an open access article distributed under the terms and conditions of the Creative Commons Attribution (CC BY) license (https://creativecommons.org/licenses/by/4.0/).
Share and Cite
Grable, J.; Warmath, D.; Kwak, E.J. An Assessment of the Association between Political Orientation and Financial Risk Tolerance. J. Risk Financial Manag. 2022, 15, 199. https://doi.org/10.3390/jrfm15050199
Grable J, Warmath D, Kwak EJ. An Assessment of the Association between Political Orientation and Financial Risk Tolerance. Journal of Risk and Financial Management. 2022; 15(5):199. https://doi.org/10.3390/jrfm15050199
Chicago/Turabian StyleGrable, John, Dee Warmath, and Eun Jin Kwak. 2022. "An Assessment of the Association between Political Orientation and Financial Risk Tolerance" Journal of Risk and Financial Management 15, no. 5: 199. https://doi.org/10.3390/jrfm15050199
APA StyleGrable, J., Warmath, D., & Kwak, E. J. (2022). An Assessment of the Association between Political Orientation and Financial Risk Tolerance. Journal of Risk and Financial Management, 15(5), 199. https://doi.org/10.3390/jrfm15050199