Abstract
This paper examines the propagation of oil price uncertainty shocks to real equity prices using a large-scale Global Vector Autoregressive (GVAR) model of 26 advanced and emerging stock markets. The GVAR framework allows us to capture the transmission of local and global shocks, while simultaneously accounting for individual-country peculiarities. Utilising a recently developed model-free, robust estimate of oil price uncertainty, we document a statistically significant and negative effect of uncertainty shocks emanating from oil prices on the large majority of global stock markets, with the adverse effect of oil price uncertainty shocks found to be stronger for emerging economies as well as net oil-exporting nations. Interestingly, however, global stock markets exhibit a great deal of heterogeneity in their recovery following oil uncertainty shocks as some experience rapid corrections in stock valuations while others suffer from extended slumps. While the results are sensitive to the oil uncertainty measure utilised, they suggest that country diversification in the face of rising oil market uncertainty can still be beneficial for global investors as global stock markets exhibit a rather heterogeneous pattern in their recovery rates against oil market shocks.
Keywords:
oil price uncertainty shocks; international equity markets; global vector autoregressive model JEL Codes:
C32; G15
1. Introduction
Building on the pioneering works by Bernanke (1983) and Pindyck (1991), the oil-stock market literature argues that uncertainty and the real options effect associated with investment decisions driven by high oil price uncertainty create cyclical fluctuations in investments by lowering firms’ incentives for immediate investment activities. This, in turn, affects the cash flows generated by firms as well as the discount rates used in firm valuations, thus, opening a channel in which oil market uncertainty impacts stock prices and/or returns (Swaray and Salisu 2018; Chen and Demirer 2022). Given the importance of oil as a major input factor for business operations that drive the real economy, its volatility may influence both investment and policy decisions. Thus, uncertainty regarding business profitability, valuations, and investment decisions are all impacted by oil price volatility, which is a source of uncertainty that affects the cost of this essential input (Henriques and Sadorsky 2011).
Shocks emanating from the oil market could have serious implications for the real economy as oil-price-induced uncertainty could force firms to postpone ‘irreversible’ investment decisions (Elder and Serletis 2009). In other words, uncertainty about the return to investment at the level of the firm may cause cyclical fluctuations in aggregate investments (Bernanke 1983). The foregoing suggests that even when an oil price shock is favourable, the uncertainty about its nature (whether permanent or transitory) may discourage positive investment decisions. Indeed, in related works, Maghyereh and Abdoh (2020) show that oil market uncertainty has a negative and asymmetric effect on corporate investment, while Yin and Lu (2022) argue that oil uncertainty increases firms’ risk-taking through the channel of real options related to firms’ growth opportunities. Such a negative effect on investment activities could also be driven by the impact of oil price shocks on the cost of financing firm operations as evidenced by Prodromou and Demirer (2022). Finally, since stock prices can be modelled as the sum of discounted cash flows including dividends, oil price uncertainty can adversely affect stock prices by decreasing the overall profit that a firm generally uses to pay dividends, as firms need to bear additional costs to avoid the risks associated with oil price uncertainty (Demirer et al. 2015).
Accordingly, the literature offers various studies that examine the validity of theoretical arguments that associate oil price uncertainty with stock prices and or/returns via the investment and dividend channels for both the developed (see, Sadorsky (1999); Masih et al. (2011); Alsalman (2016); Diaz et al. (2016); Rahman (2021)) and emerging economies (see, Jiranyakul (2014); Aye (2015); Bass (2017); Benavides et al. (2019)).1 However, as Chen and Demirer (2022) note, the literature offers mixed evidence at best regarding the effect of oil price fluctuations on stock market dynamics with the majority of the studies documenting a negative oil price effect on stock market returns (e.g., Chen 2009; Basher et al. 2012), while others find insignificant (Demirer et al. 2015; Hatemi et al. 2017) and, in some cases, positive (e.g., Zhu et al. 2011; Silvapulle et al. 2017) oil price effects. Against this background, in contrast with the country-specific/firm-level analyses that are popular in the literature, we contribute to the extant literature by examining the propagation of oil price uncertainty shocks to real equity prices using a large-scale Global Vector Autoregressive (GVAR) model of 26 advanced and emerging stock markets. Among the attractions of the GVAR framework is its ability to accommodate the transmission of local, regional, and global shocks to individual countries, while simultaneously accounting for individual-country peculiarities, thus providing a more comprehensive assessment of the effect of oil market uncertainty on stock market dynamics.
One must realise, however, that uncertainty is a latent variable, and needs to be measured. Given this, the large majority of the above-mentioned studies rely on univariate or bivariate Generalised Autoregressive Conditional Heteroskedasticity (GARCH) models applied to oil price series to derive metrics of oil price uncertainty. In other words, GARCH-based oil price uncertainty is fully determined by changes in the level of oil price, and as a result, it is not possible to disentangle uncertainty about the oil price and changes in the oil price level (Jo 2014). Given this, Rahman (2021) proposes a new measure of oil price uncertainty by utilising Stochastic Volatility (SV) in a Structural Vector Autoregressive (SVAR) model (involving oil and stock prices, and a monetary policy instrument). In this model, oil price uncertainty is the conditional variance of the oil price change forecast error, which evolves independently of any change in the oil price level. Using this framework, Rahman (2021) provides evidence that increased oil price uncertainty has a negative effect on (real) stock returns of the United States.
Despite the innovativeness of the approach adopted by Rahman (2021) over GARCH-based models in measuring oil price uncertainty, the metric is not free from the structure of any specific theoretical model. Given these empirical issues in constructing an appropriate metric of oil price uncertainty, Nguyen et al. (2021) have proposed a novel construction of the oil price uncertainty index that is unconditional on a model. The authors develop a measure of oil price uncertainty as the one-period-ahead forecast error variance of a forecasting regression with SV in the residual terms. The novelty of this approach lies in its flexibility in including a large number of additional information that is important in explaining fluctuations in oil prices namely, exchange rate, oil production, global economic conditions, and co-movement in the fuel market. In this sense, the index is able to capture uncertainty in oil price rather than volatility as measured by both GARCH and SV models. Thus, this feature of the uncertainty metric informs our preference for oil price uncertainty.
Using this more robust metric of oil price uncertainty and building on the mixed evidence in the literature regarding the effect of oil price fluctuations on financial markets, we aim to extend the literature on the nexus between oil price uncertainty and stock markets by analysing the impact of oil price uncertainty shocks from a global perspective covering 26 developed and developing economies that account for 90% of the global aggregate Gross Domestic Product (GDP). In our empirical application, we rely on the Global Vector Autoregressive (GVAR) framework, originally proposed by Pesaran et al. (2004), which can account for international transmission of shocks (in our case, oil price uncertainty) based on a large panel of country-level macroeconomic data (i.e., output, inflation, short- and long-term interest rates, real exchange rate, over and above the real equity prices) and global exogenous variables (e.g., commodity prices). This framework allows us to analyse the impact of oil price uncertainty on a wide range of global stock markets in a multivariate, simultaneous setting by controlling for a wide array of domestic and global macroeconomic and financial variables, which are known to serve as drivers of international stock market dynamics (Jordan et al. 2016, 2017; Sousa et al. 2016; Aye et al. 2017). In the process, our study provides a more accurate assessment regarding the size of the impact of oil price uncertainty on global equity markets by mitigating the omitted variable bias.
2. Data and Summary Statistics
Given the approach adopted in this study, we consider nine variables in total, out of which six (real gross domestic product, inflation rate, real equity prices, real exchange rate, nominal short- and long-term interest rate) are peculiar to 26 countries covering both developed and emerging economies2, while the remaining three (oil price, raw material price, and metal price) represent global/common variables. We use quarterly frequency covering 1979Q1 through 2019Q4, based on the availability of data.3 We present the results of the summary statistics for the domestic (see Table 1) and global variables (see Table 2), while for want of space, only the mean, standard deviation (s.d), and coefficient of variation (cv) statistics are reported.

Table 1.
Descriptive statistics of domestic variables.
Table 2.
Descriptive statistics of global variables.
In terms of real output, India, Singapore, Malaysia, Korea, Chile, Thailand, and the Philippines are found to be the most volatile economies compared to the other countries, judging by the coefficient of variation. On the rate of change in price levels, all economies experience on average, an inflation rate of less than 3 percent with the exception of Argentina, which recorded 14 percent on average during the sample period. For equity prices, South Africa, the United Kingdom, Italy, Sweden, and France recorded the highest equity prices along with Argentina, Finland, Spain, and Korea compared to the rest of the countries. In the commodity market representing all the global variables, oil is found to be the most volatile during the period under study relative to the other commodities.
3. Methodology
We specify the nexus between oil uncertainty and real stock prices within the GVAR framework of Chudik and Pesaran (2016) that accommodates the transmission of global shocks, such as those associated with oil price uncertainty, to domestic variables, while also accounting for the characteristics of individual economies comprising of both the developed and emerging countries. Thus, the GVAR framework enables us to capture the interconnectedness among the various markets while tracing the propagation of global shocks, which is the main attraction of this modelling framework compared to other multivariate models. The GVAR dataset utilised in our analysis includes quarterly macroeconomic variables for the 26 developed and emerging economies. The sample period is governed by data availability in the updated GVAR dataset maintained by Mohaddes and Raissi (2020) covering 1979Q2 to 2019Q4.4
In setting up the GVAR model for the 26 countries, we consider six domestic (endogenous) variables namely, log real GDP, the rate of inflation, short-term interest rate, long-term interest rate, the log real exchange rate, and log real equity prices, and three external (common) factors involving the base metals prices, agricultural commodity prices, and oil price uncertainty.5 We, however, focus on the results that highlight the impact of the oil price uncertainty shock on real stock prices by constructing the GVAR model as:
where is a vector of variables specific to cross-section unit () in period (); is the corresponding vector of foreign variables constructed as where and ; is a matrix of unknown parameters for domestic variables where for , is a matrix of unknown parameters for foreign variables; is a matrix of unknown parameters for external common factors for all the cross-sections as , and is a vector of error terms. Finally, both the foreign and global factors are treated as weakly exogenous. The GVAR approach to estimating the transmission of shocks involves two steps. First is the estimation of country models as formulated in Equation (1), thereafter, the estimated country models are stacked together to form a large GVAR model from which the impact of oil uncertainty on real stock prices is measured.
4. Empirical Results
4.1. Main Findings
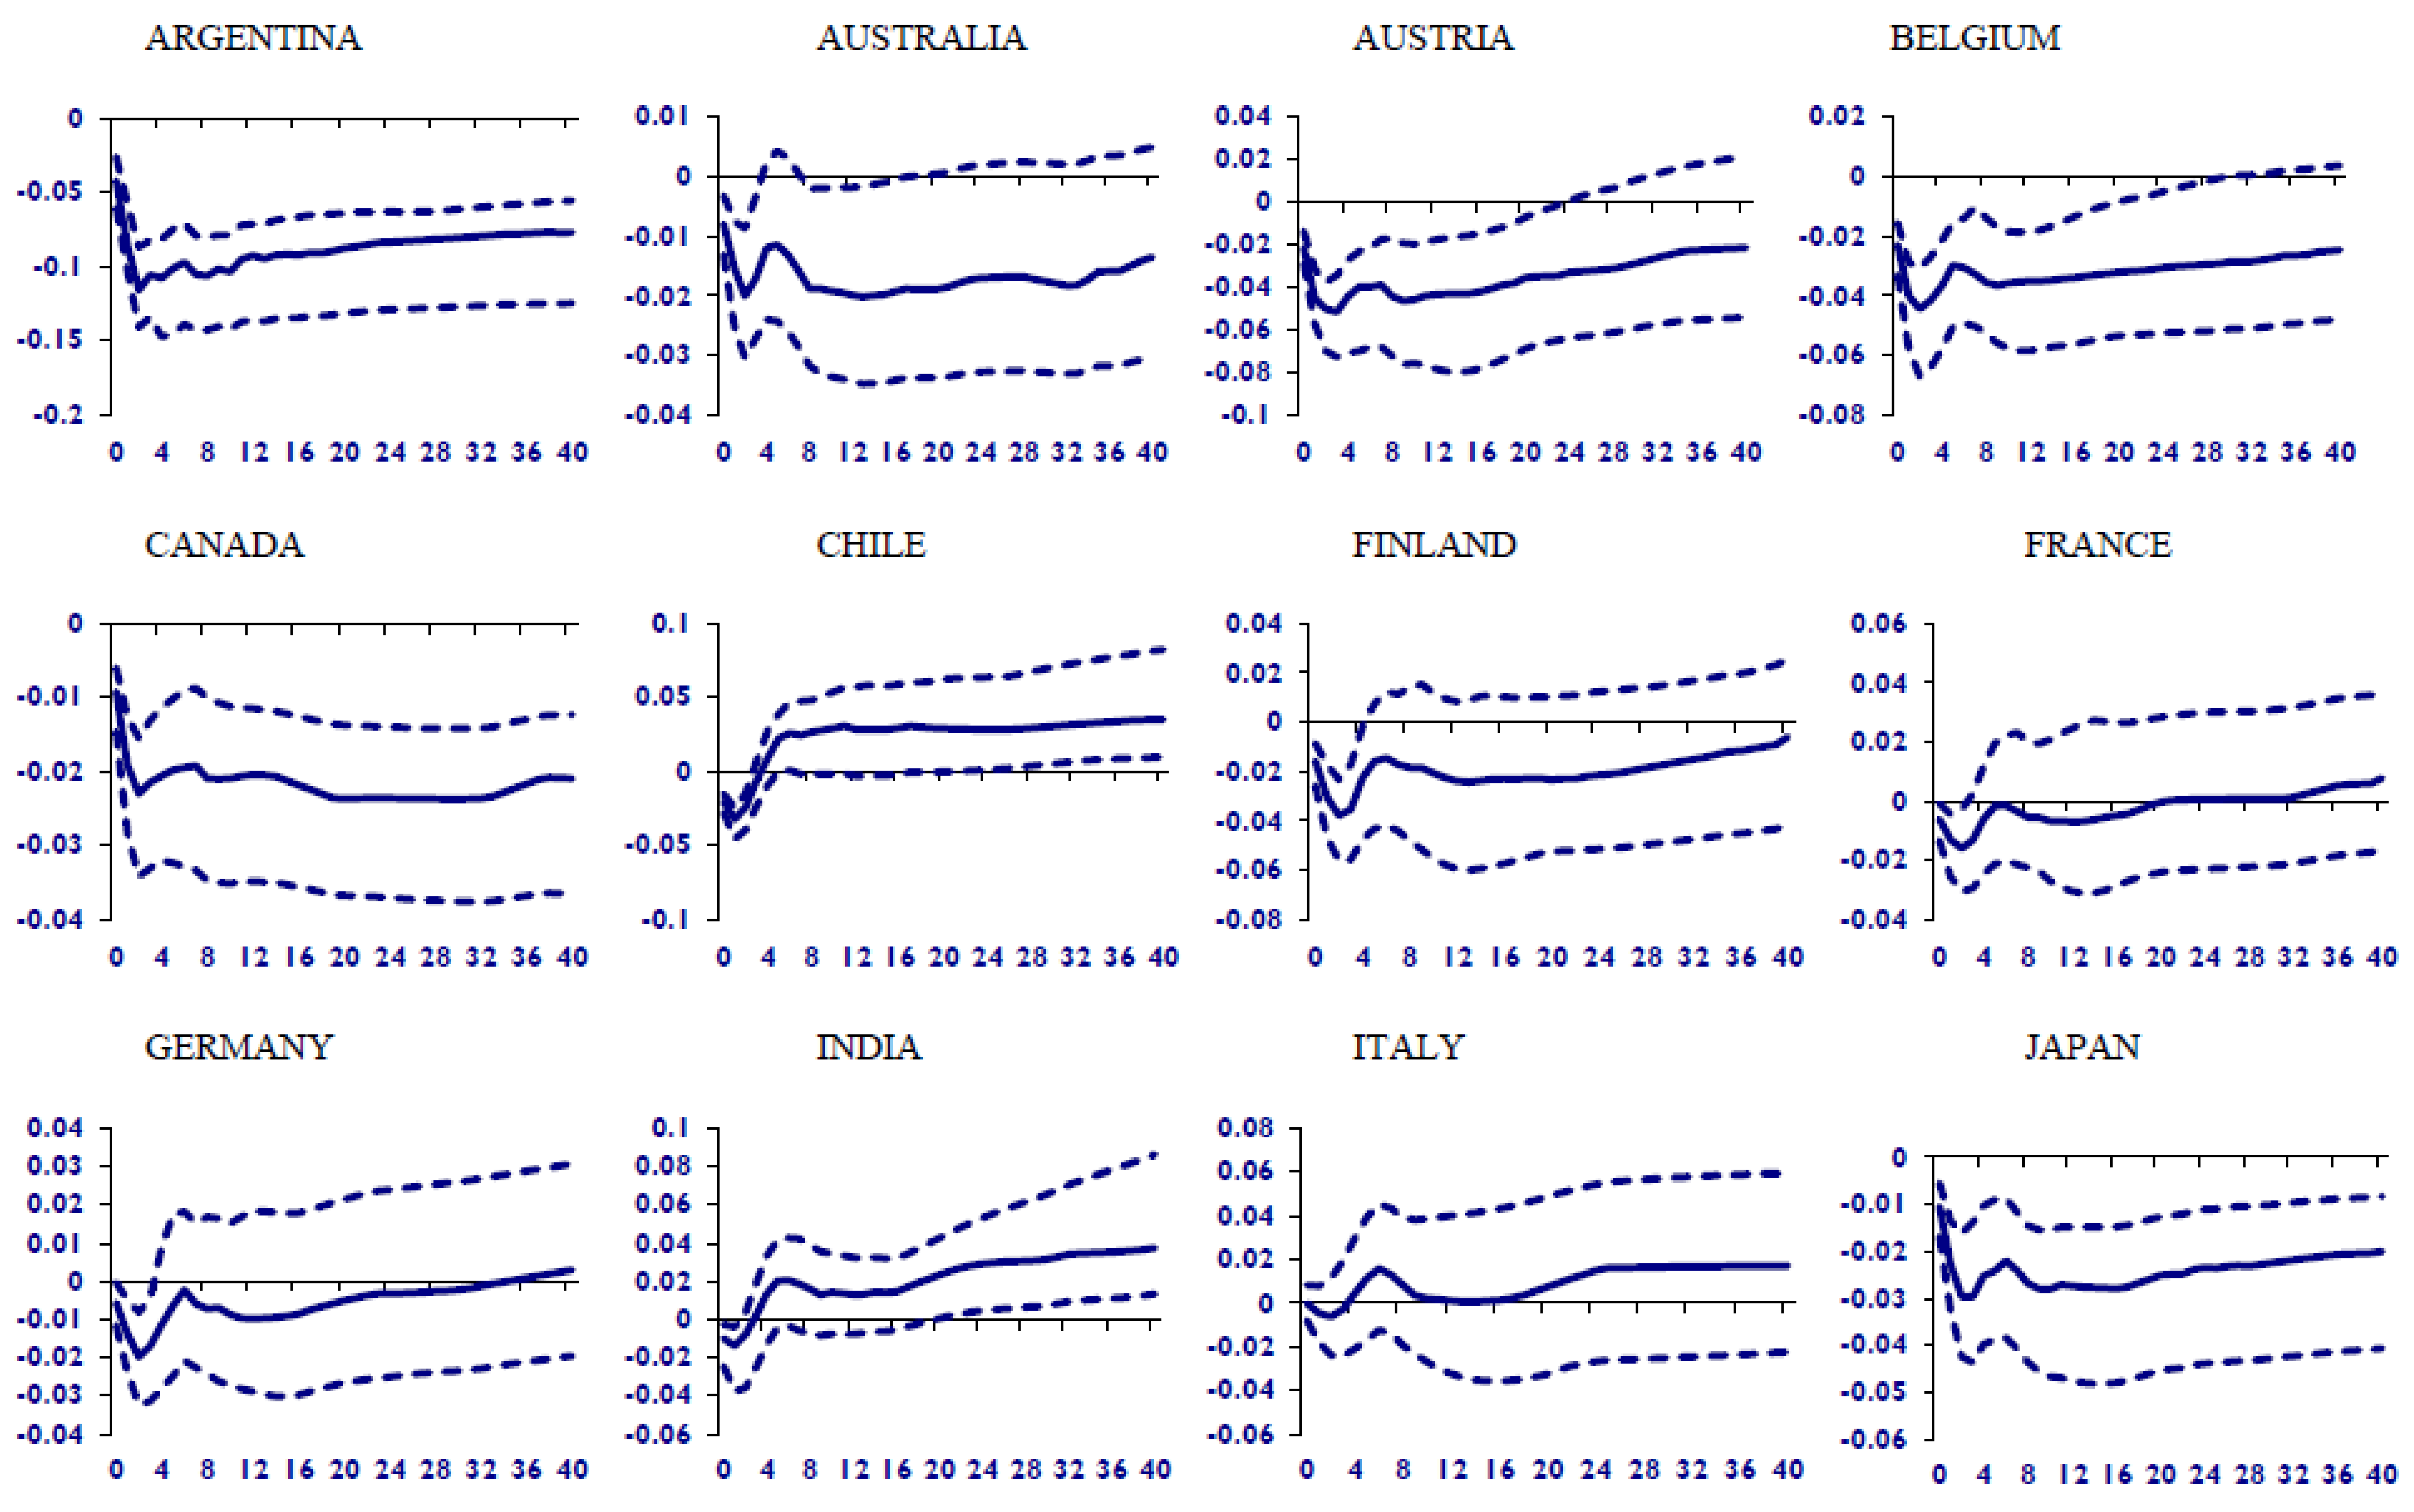
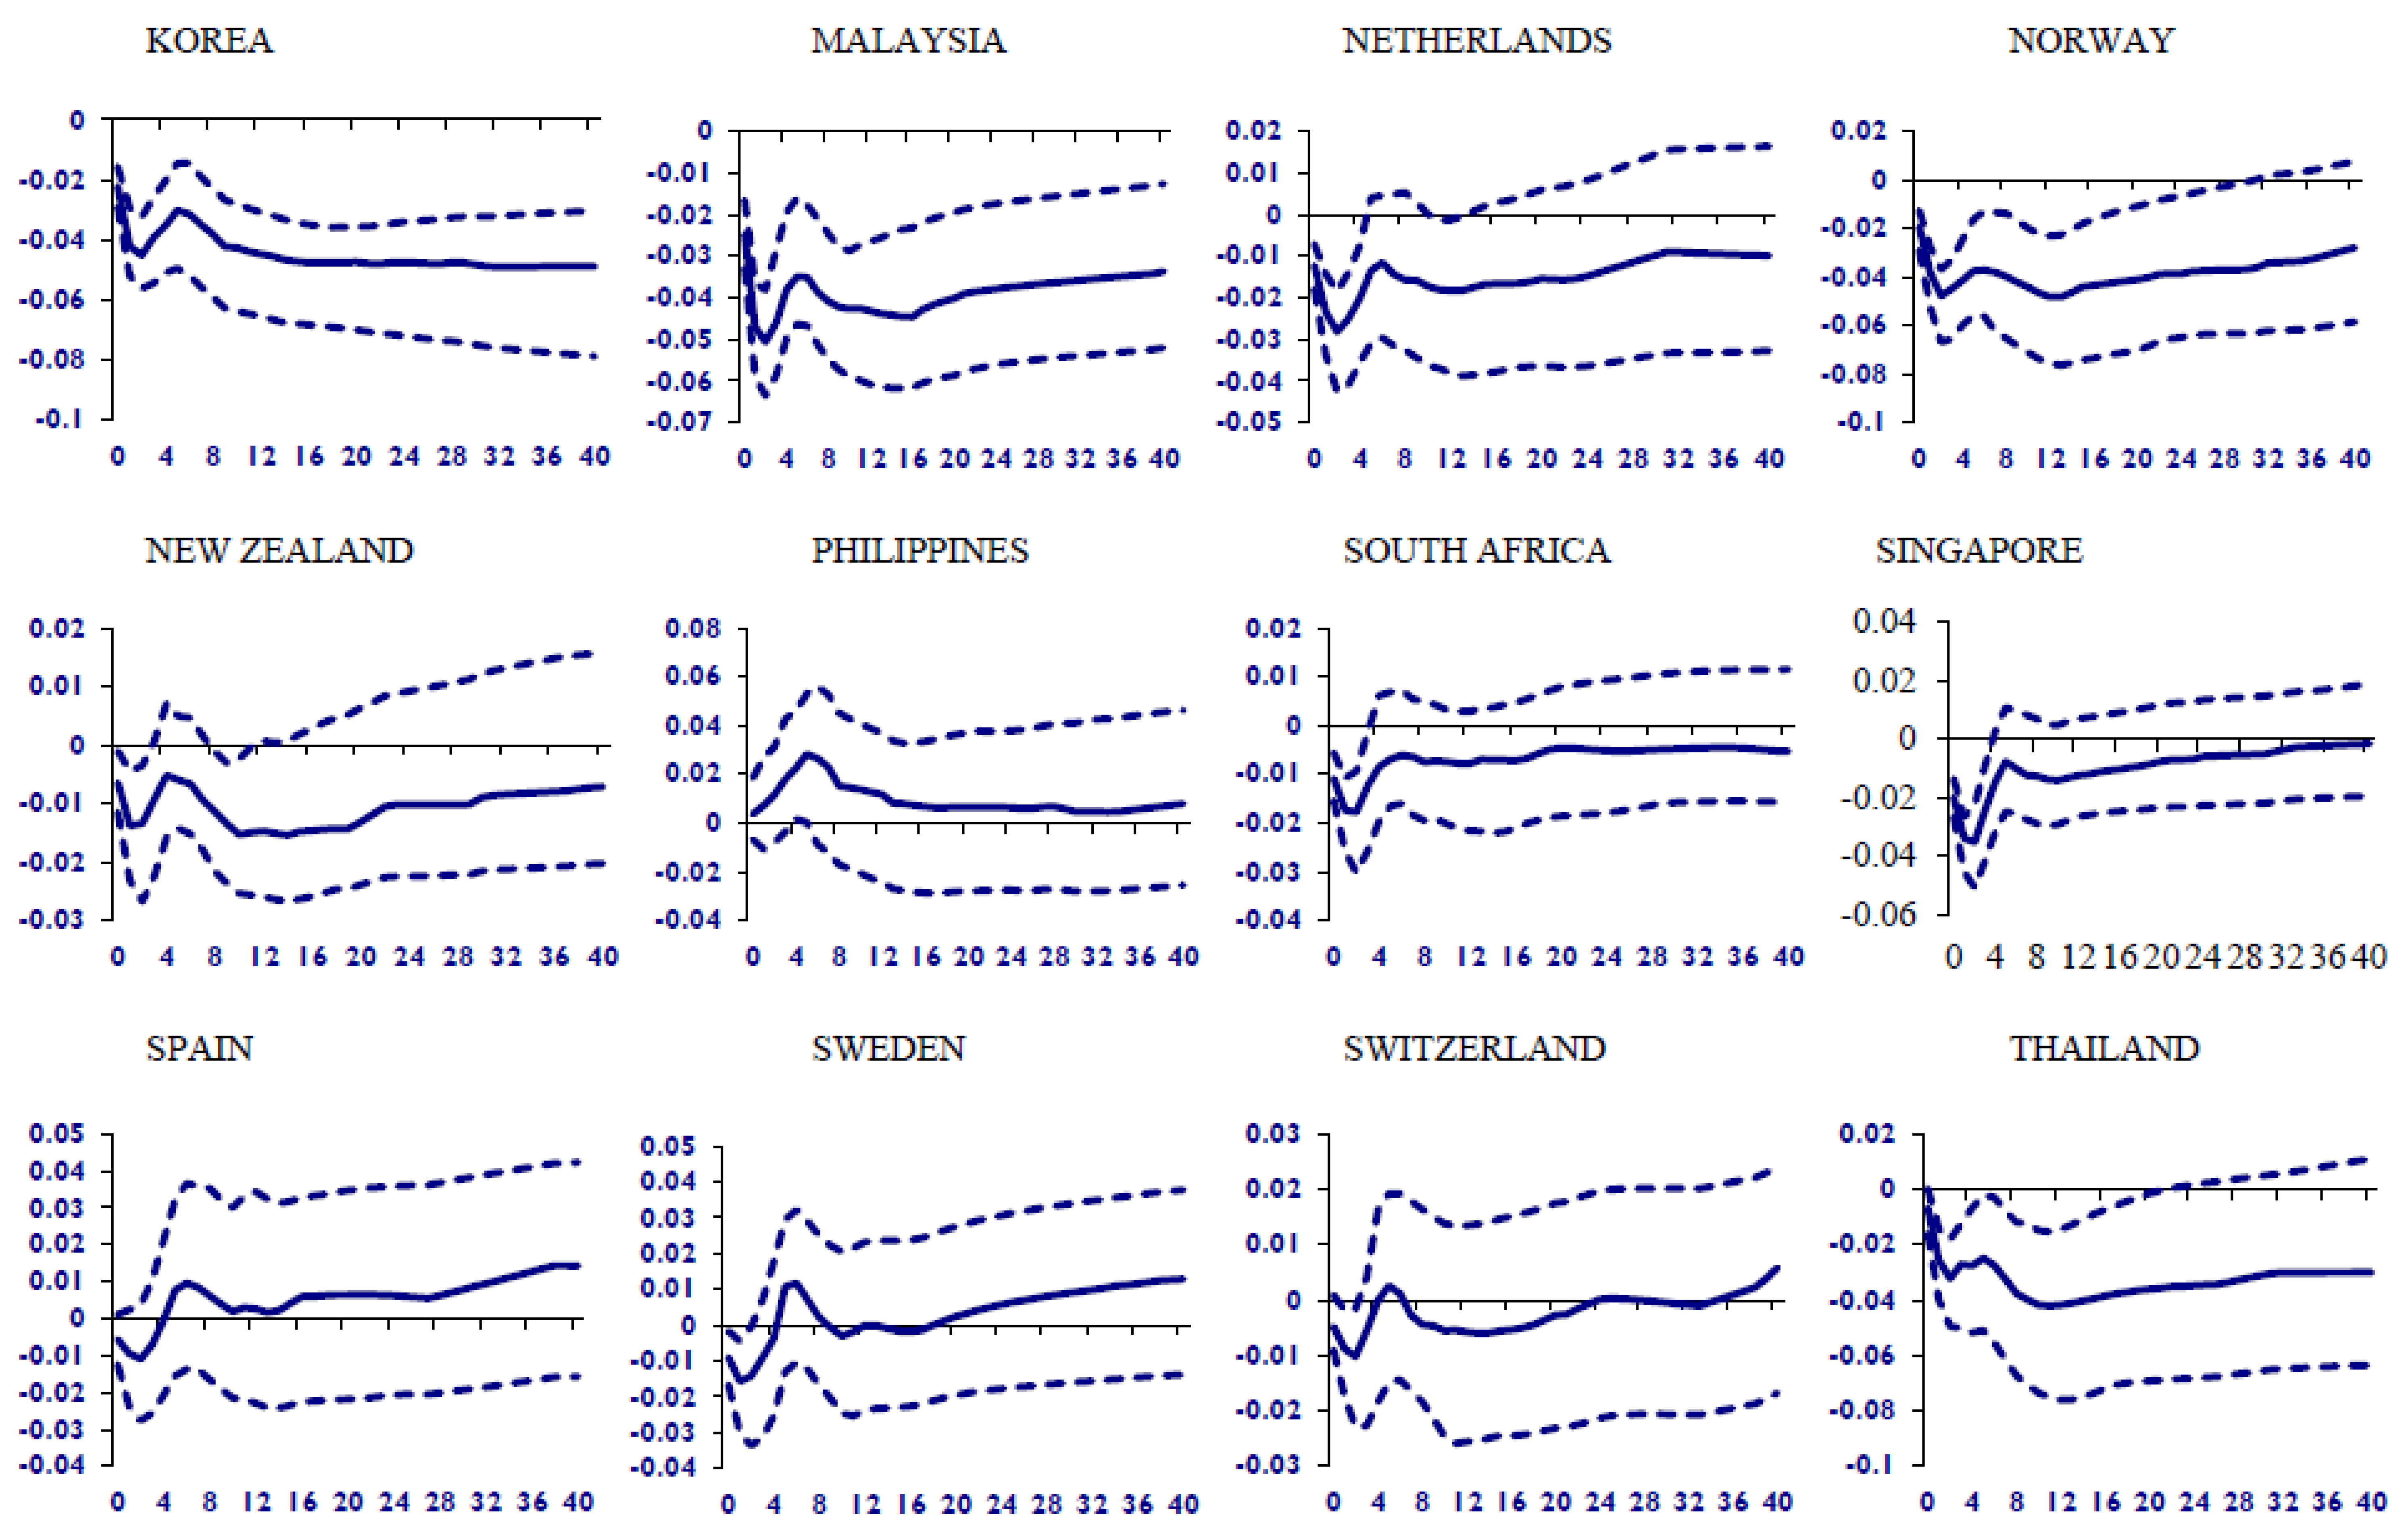
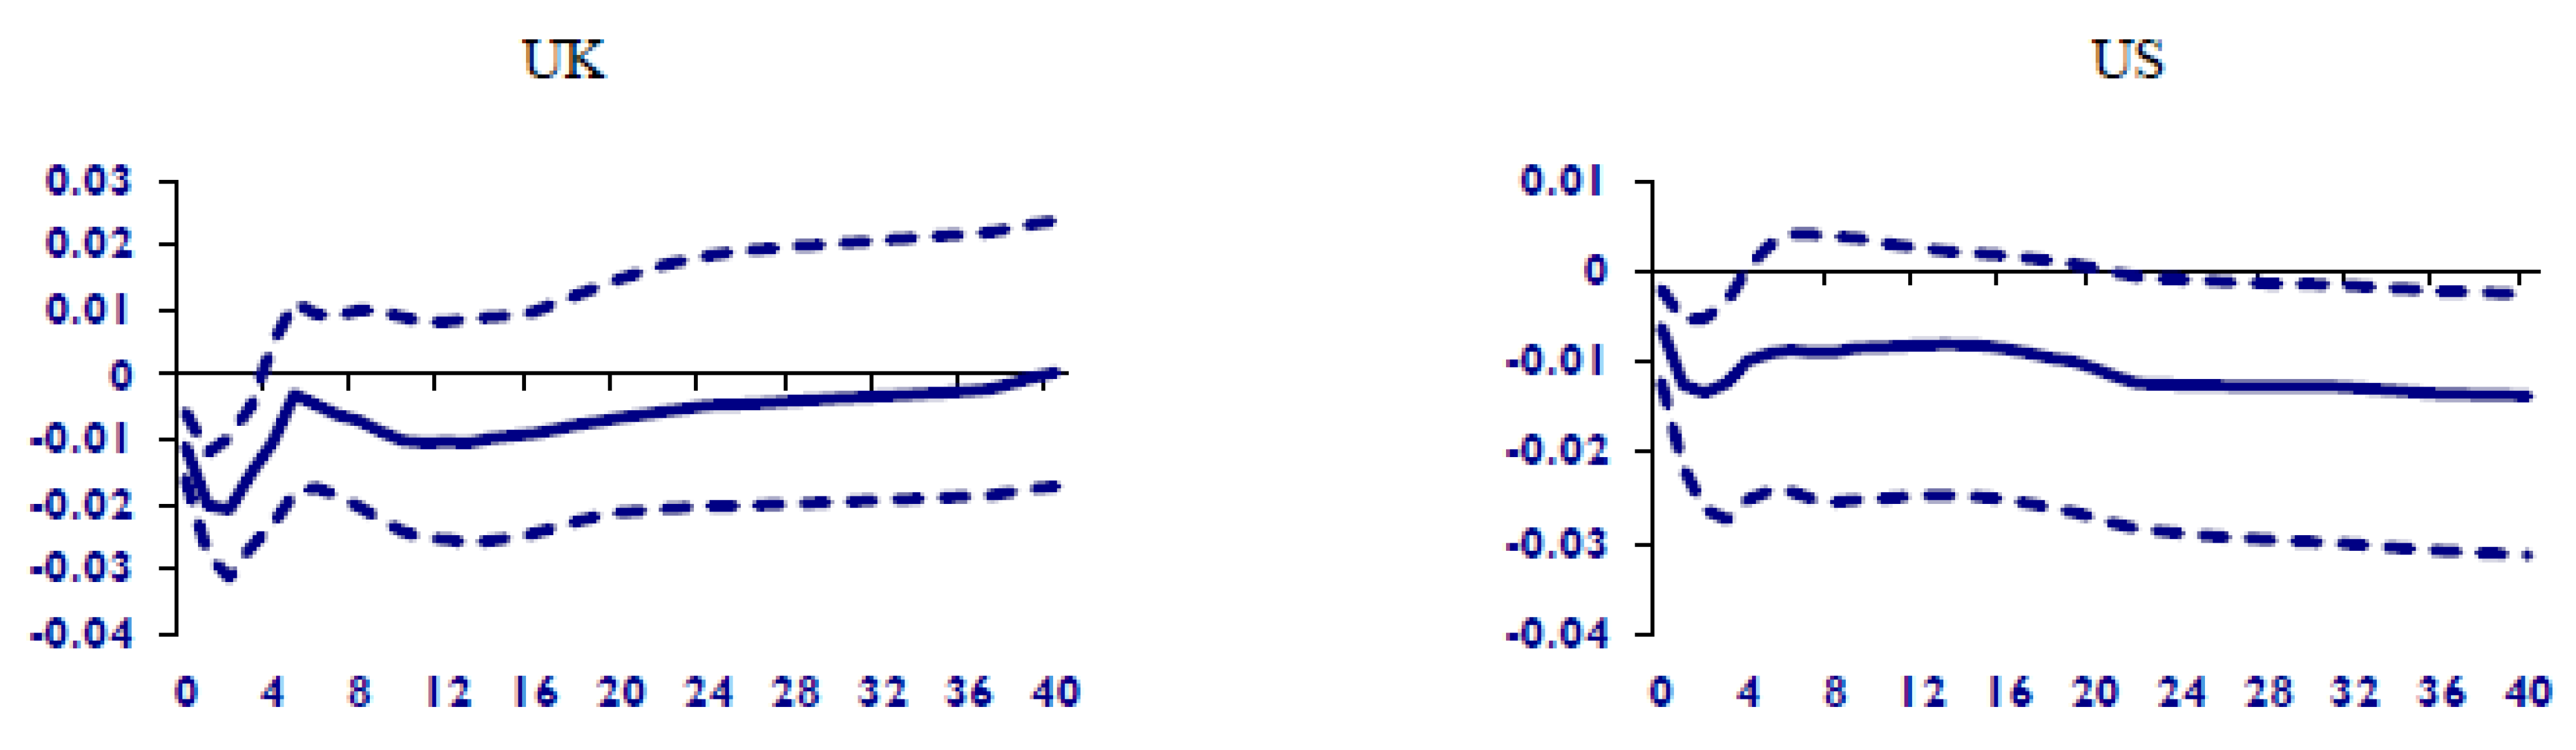
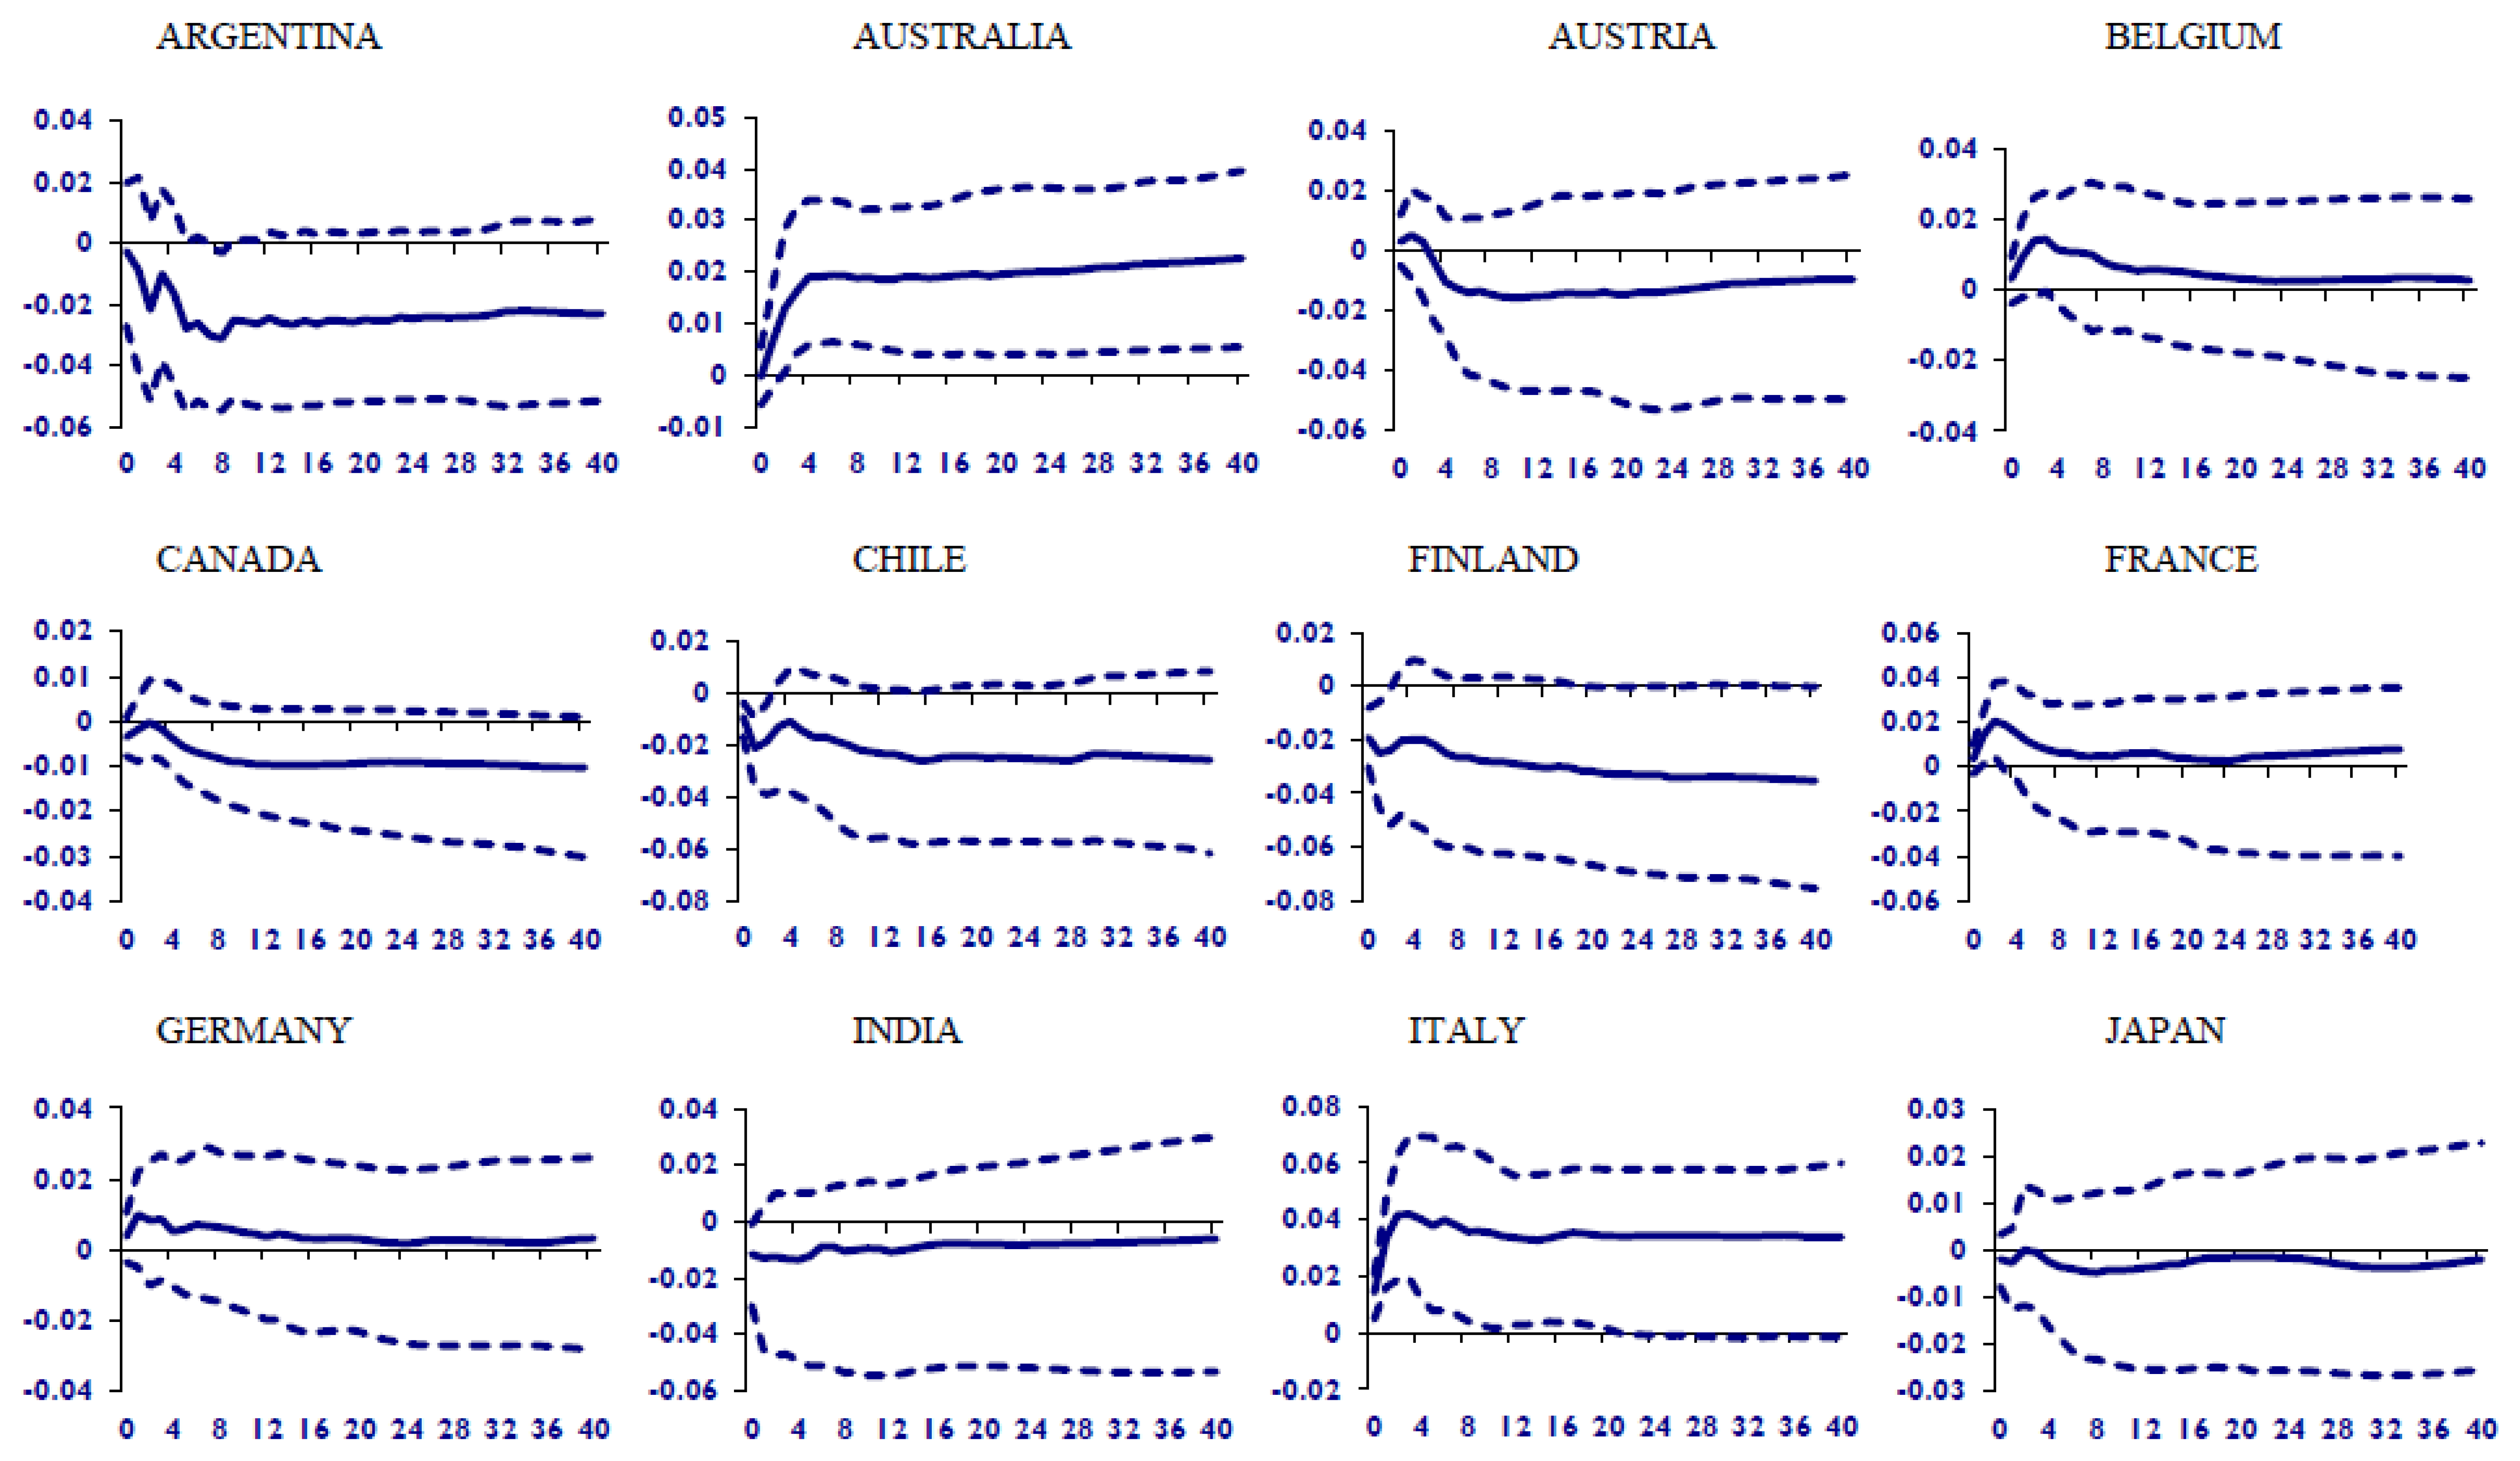
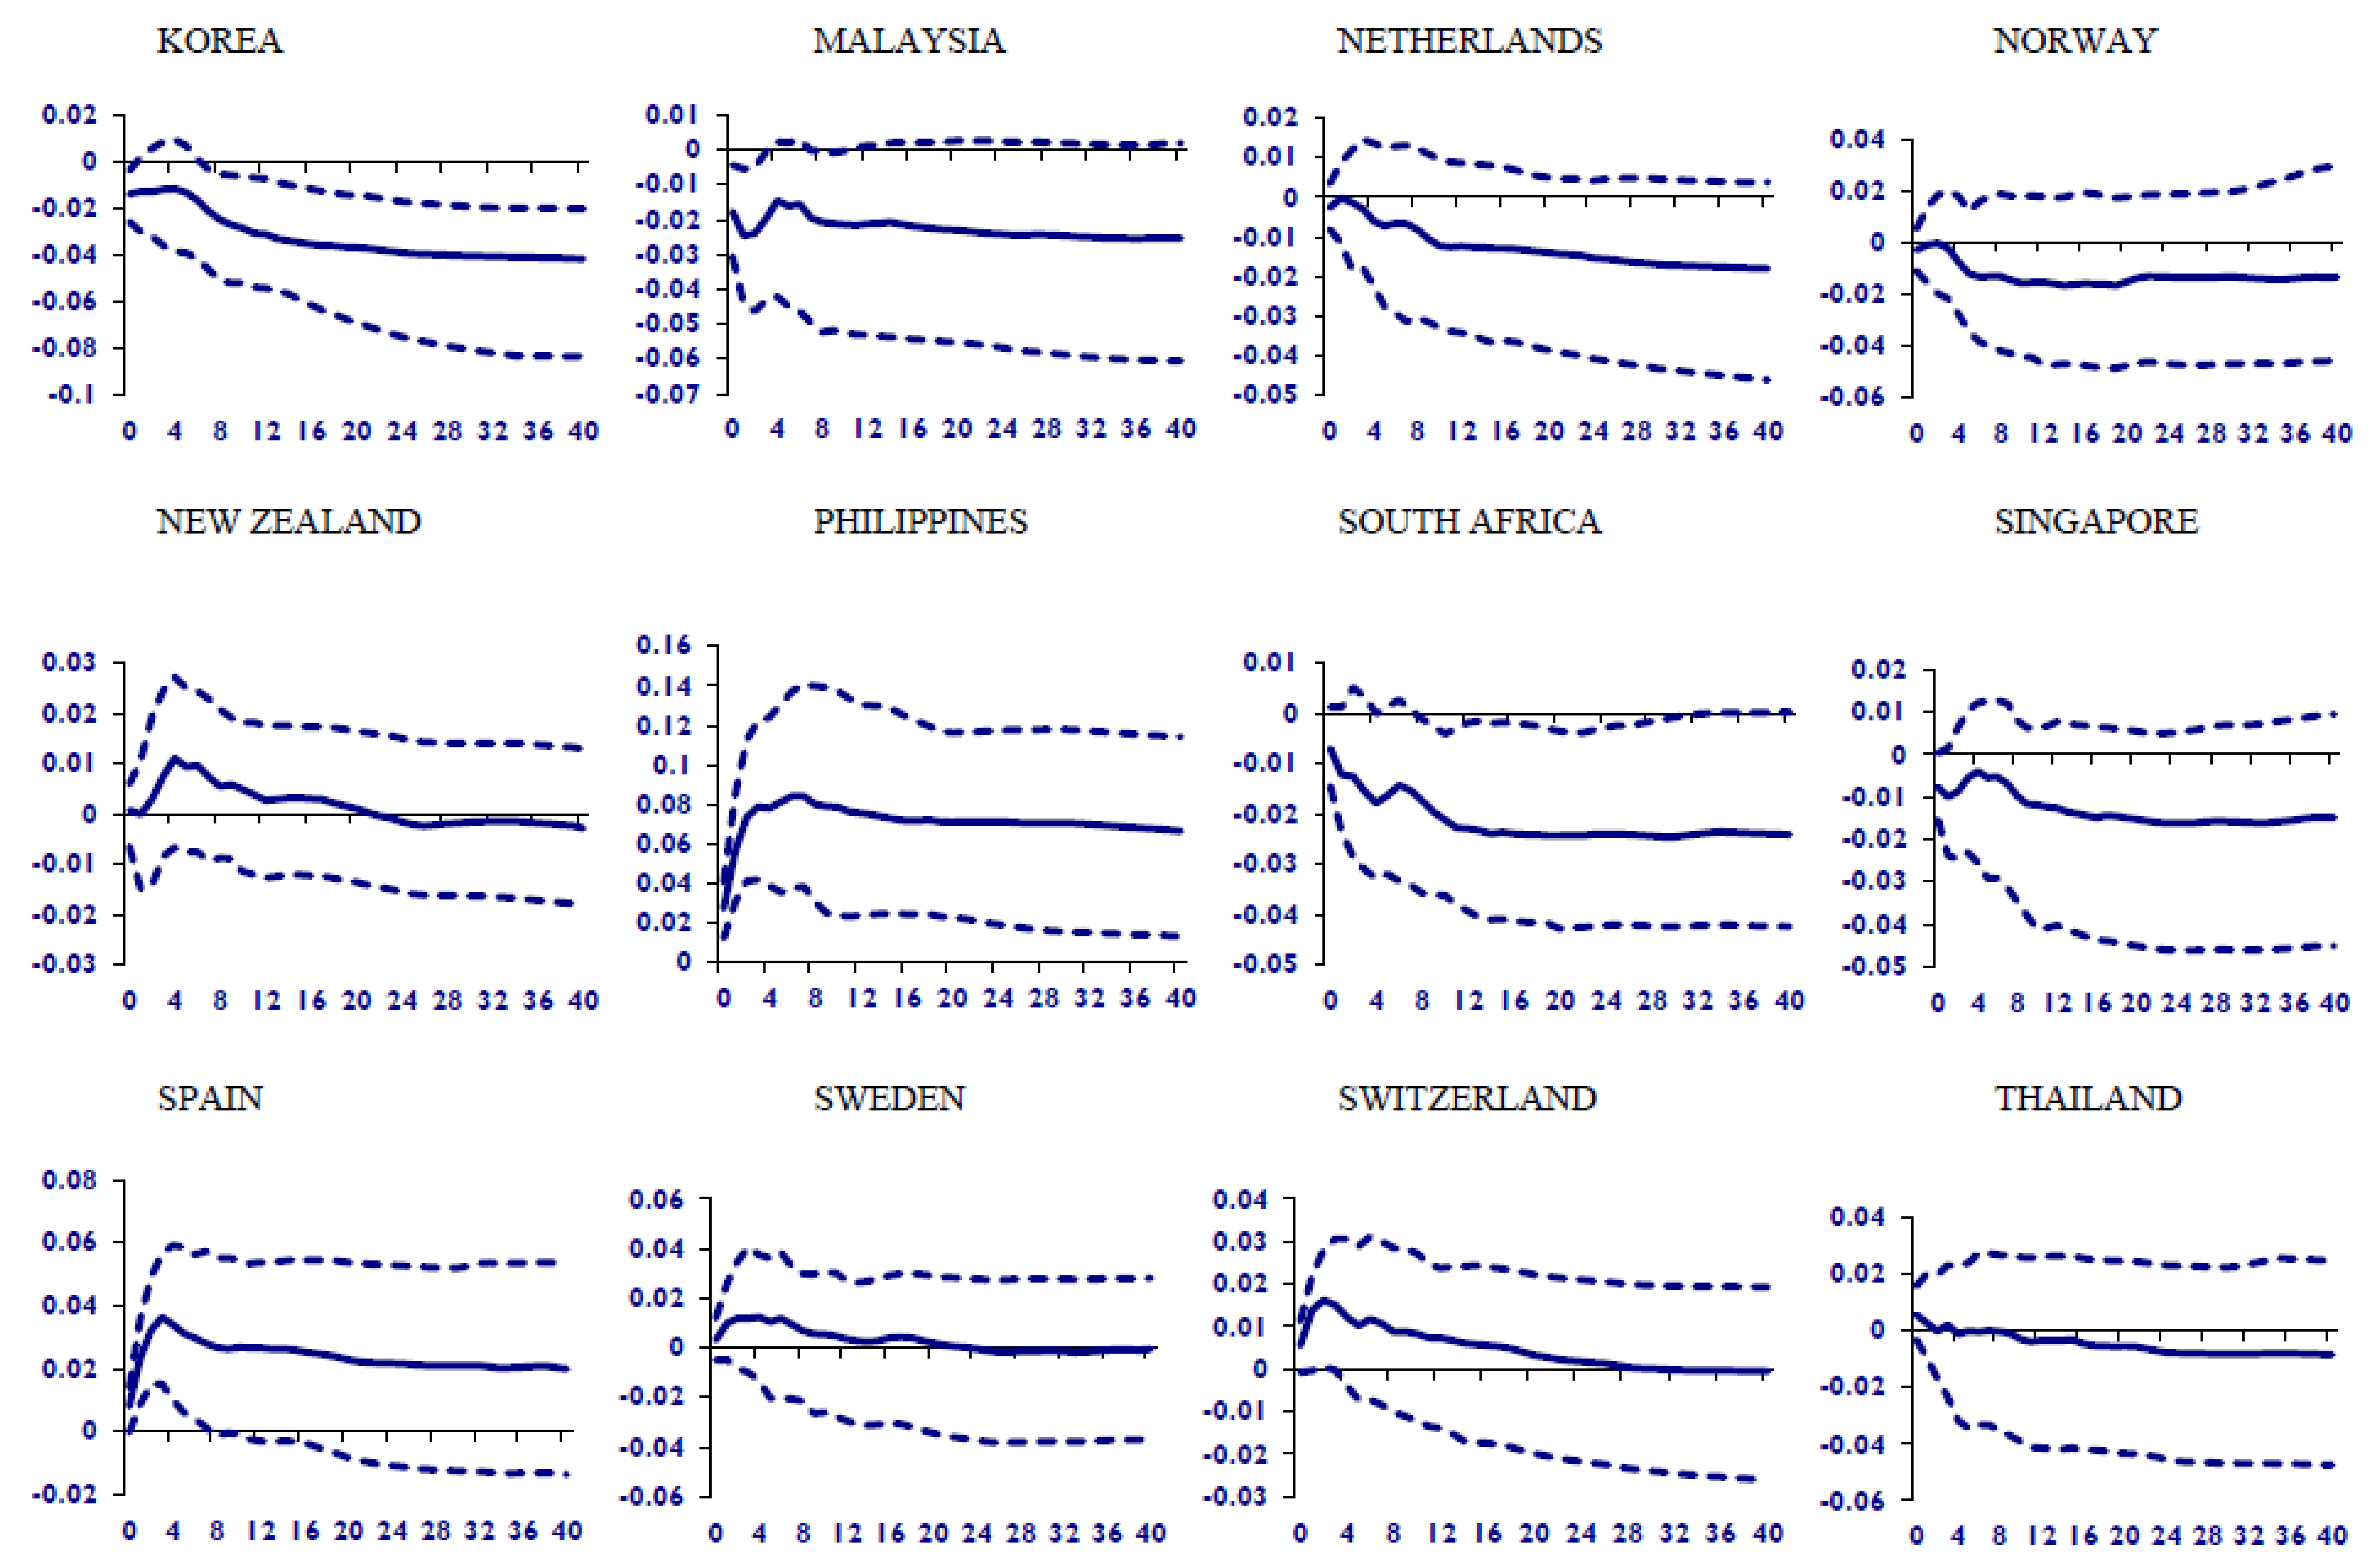
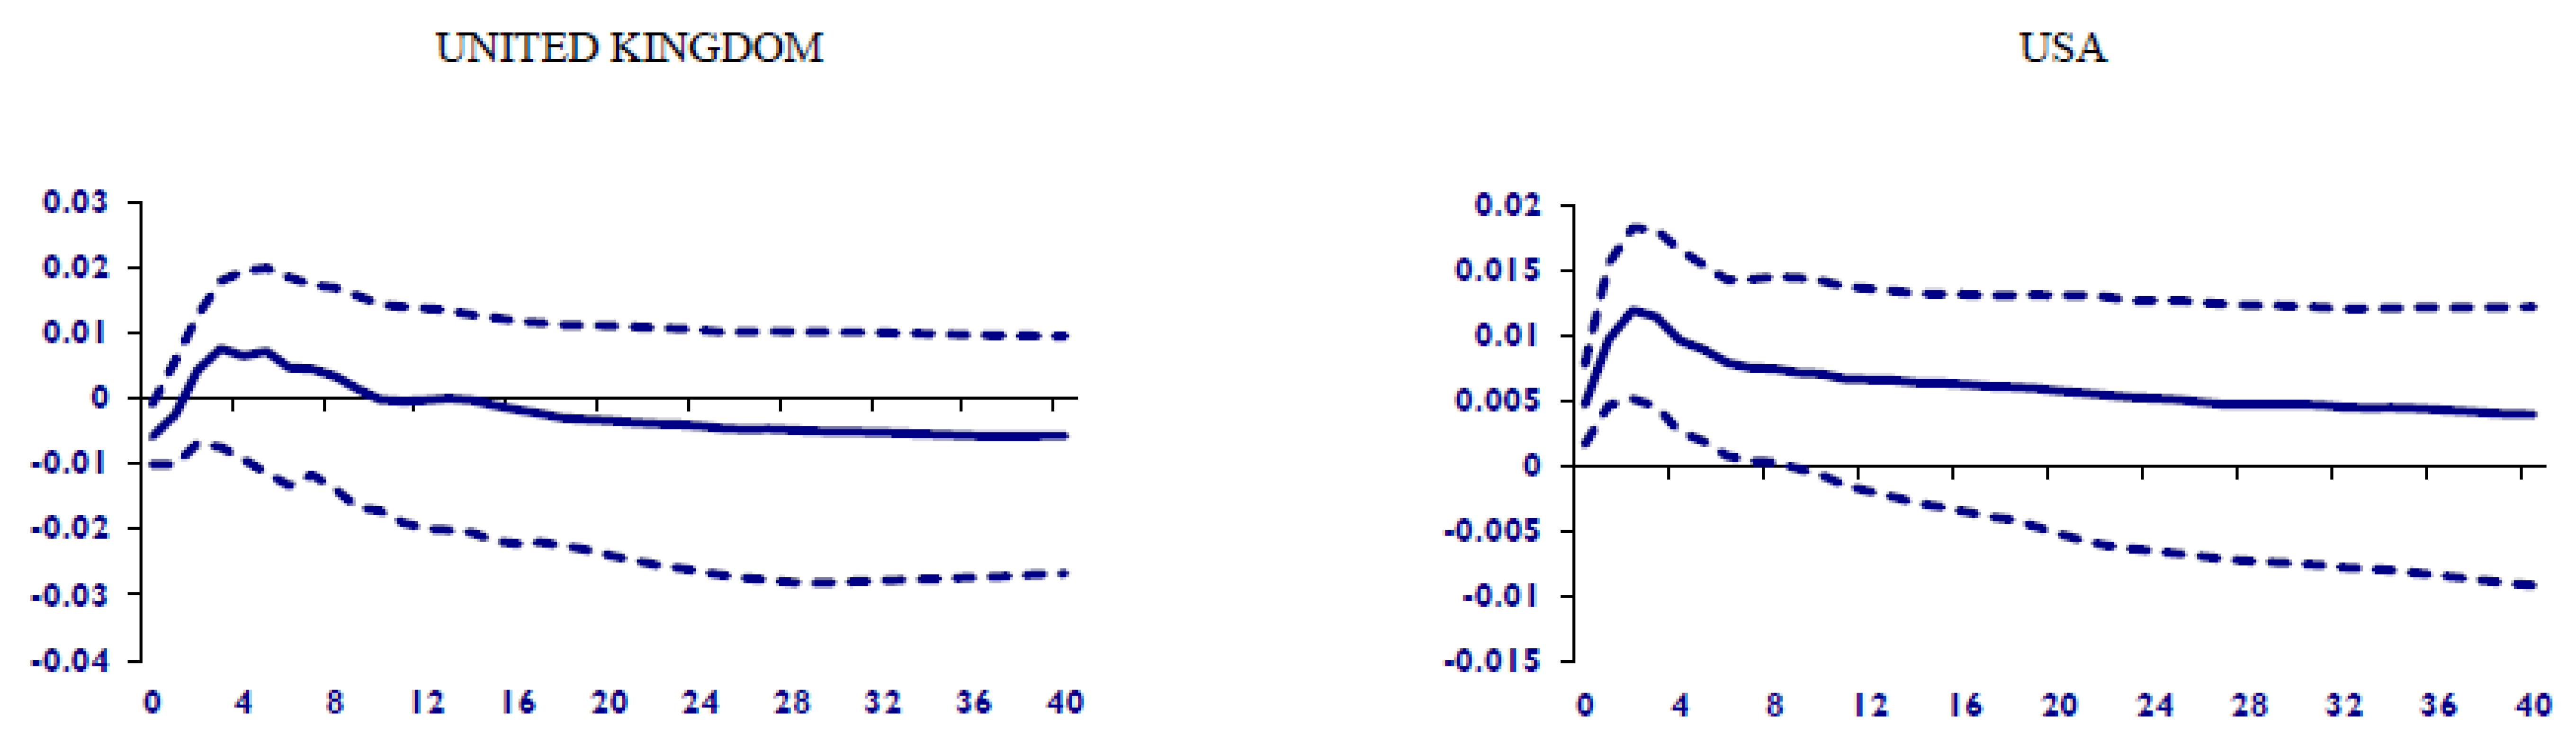
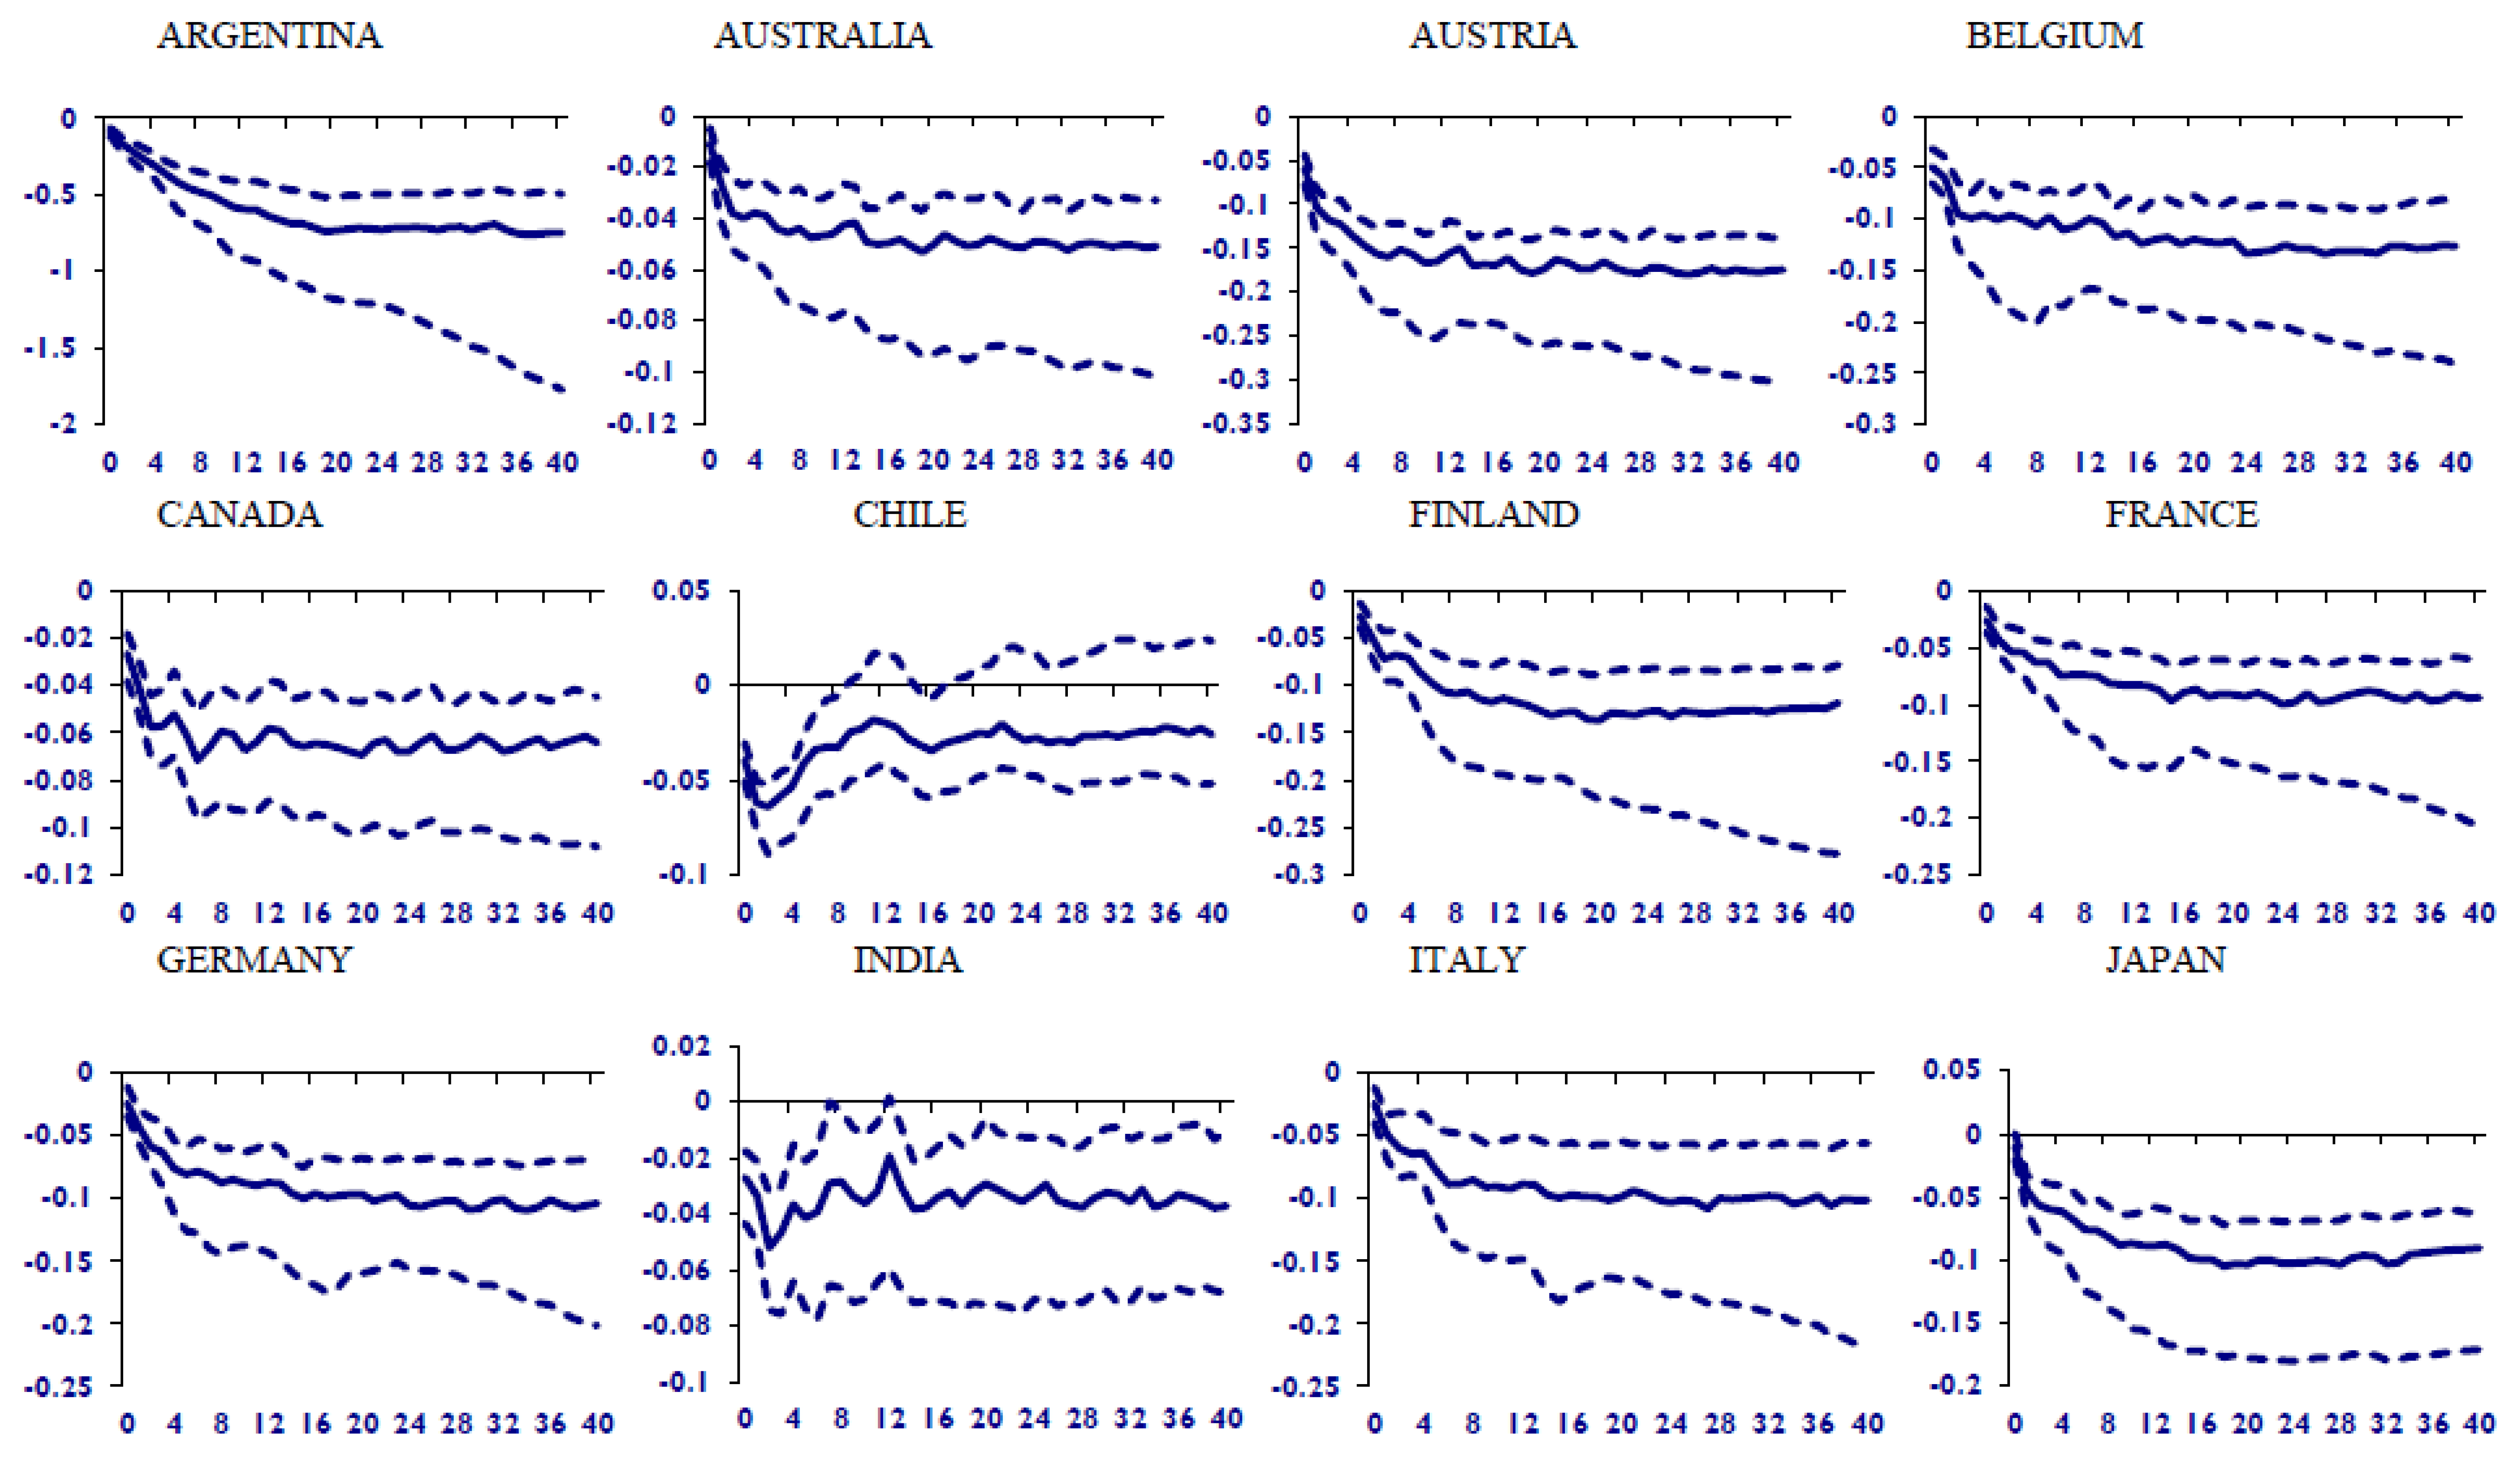
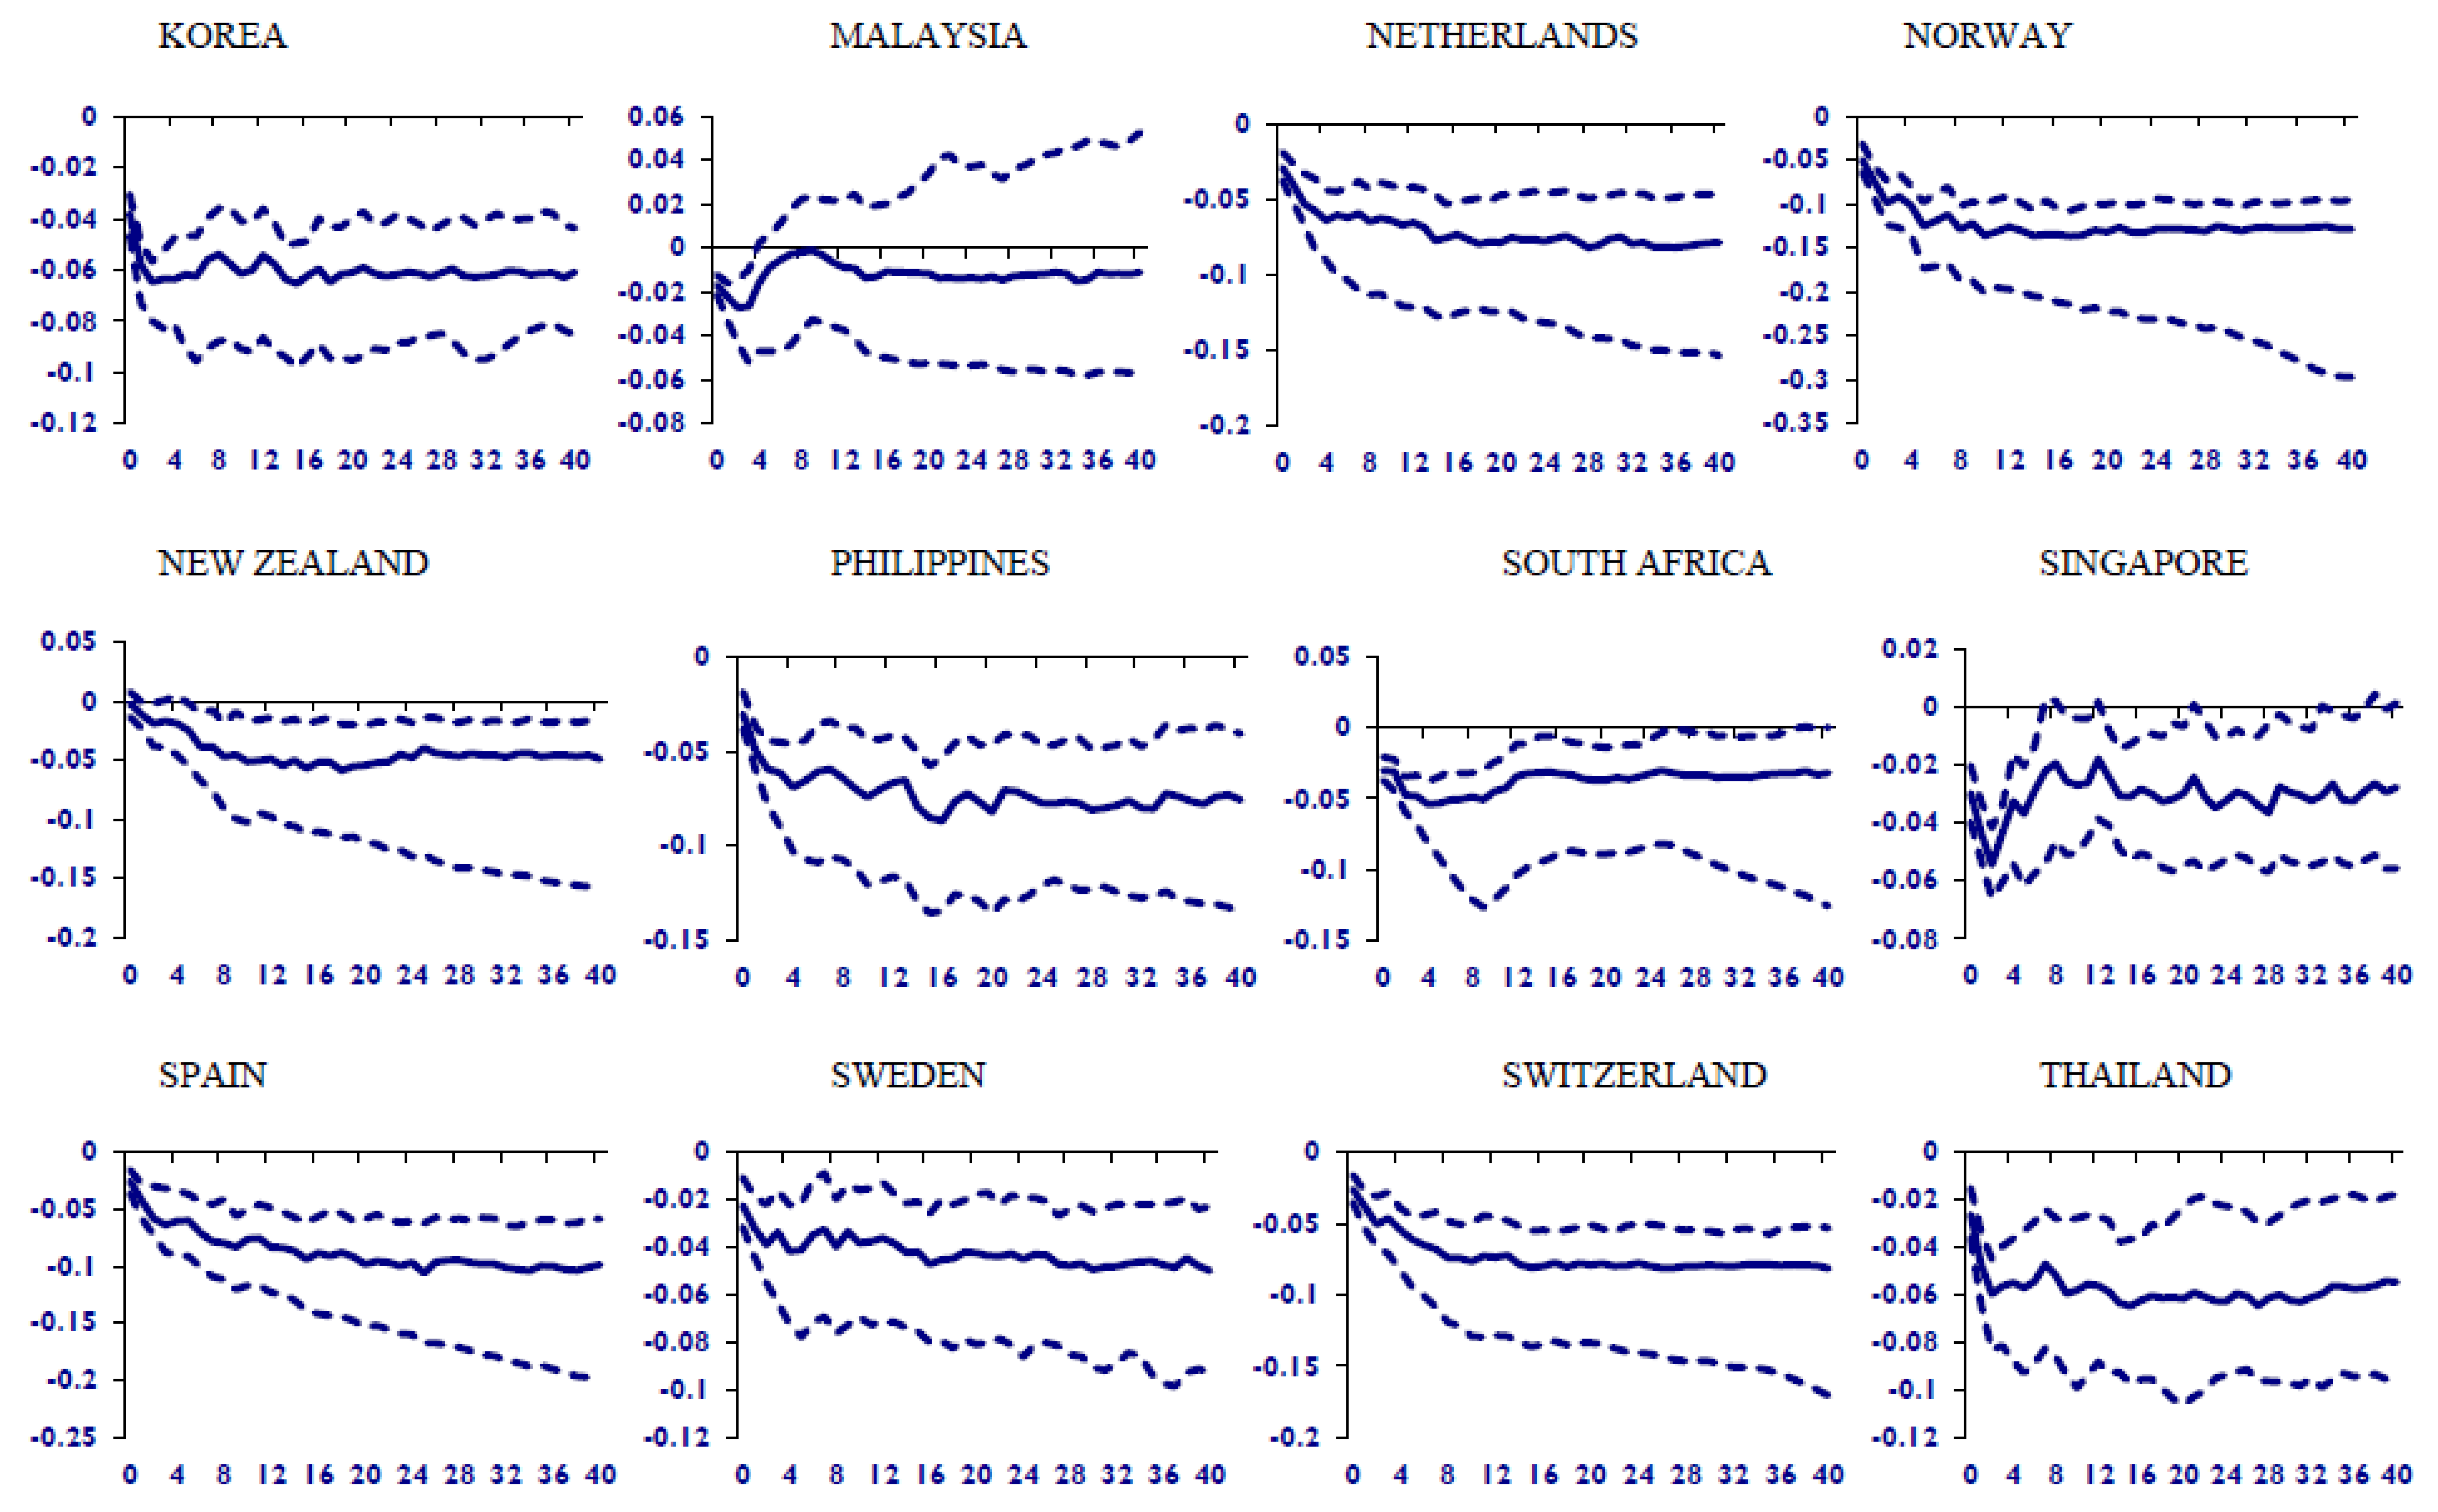
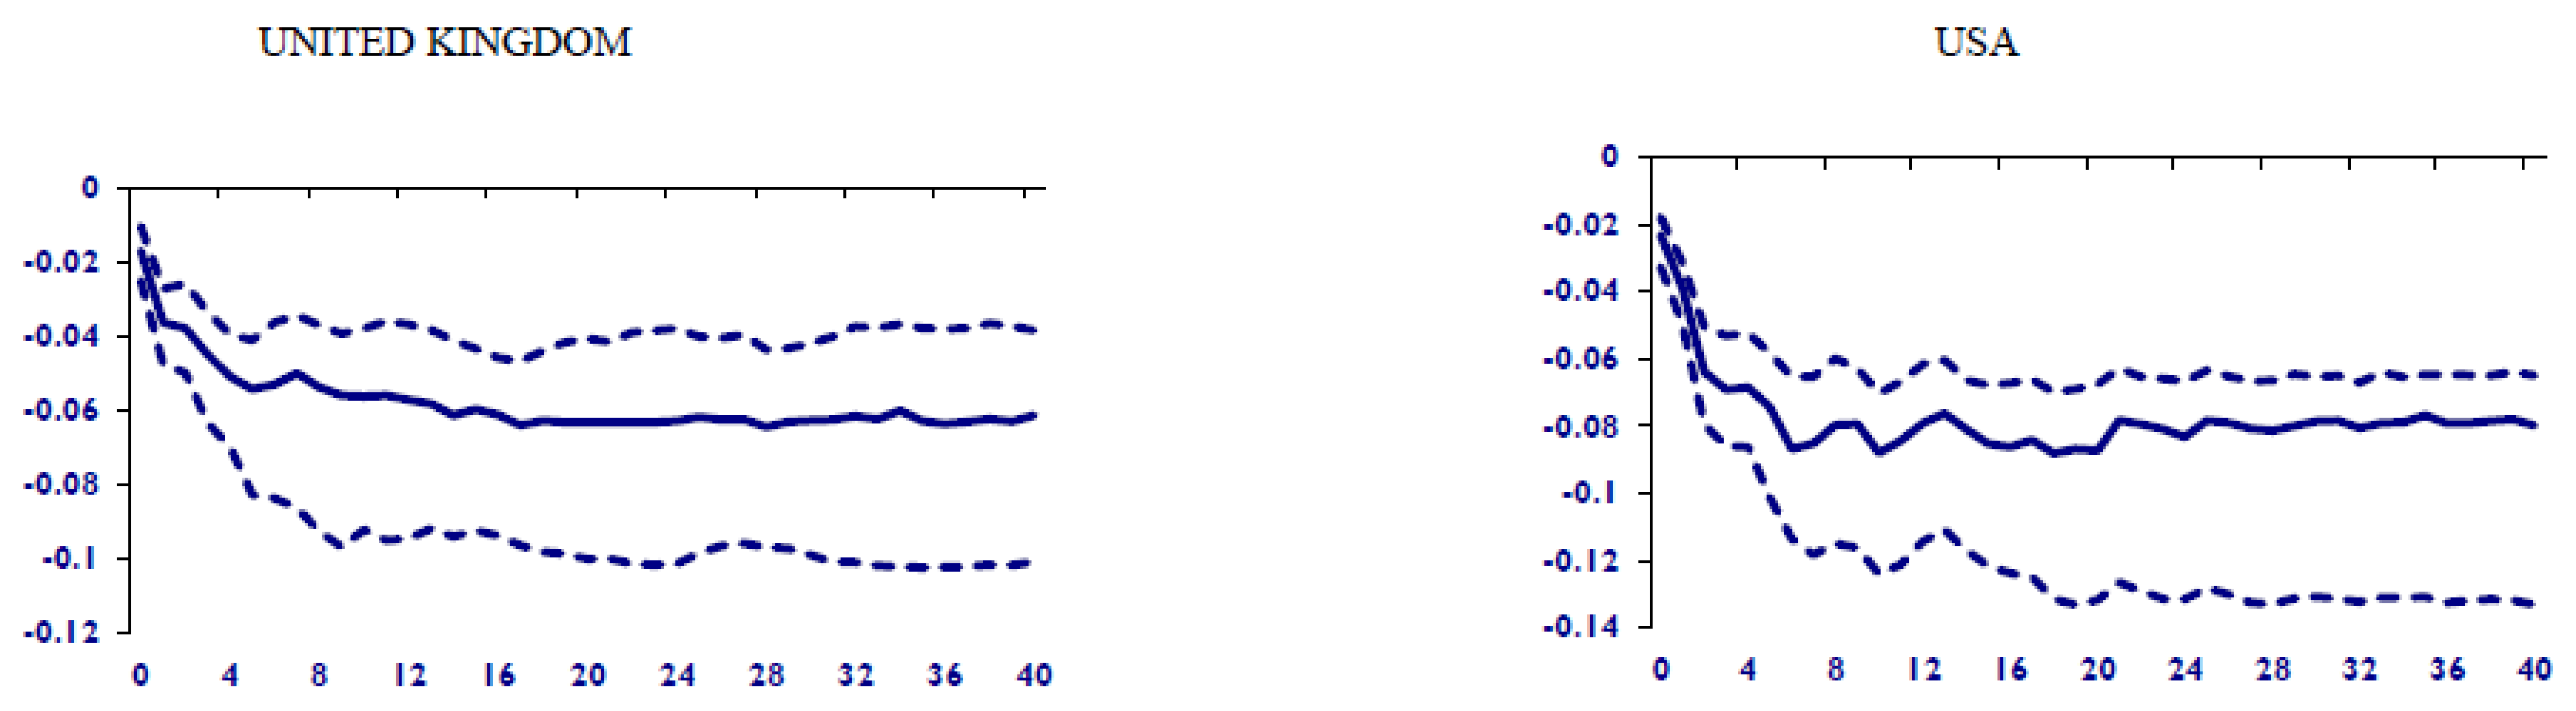
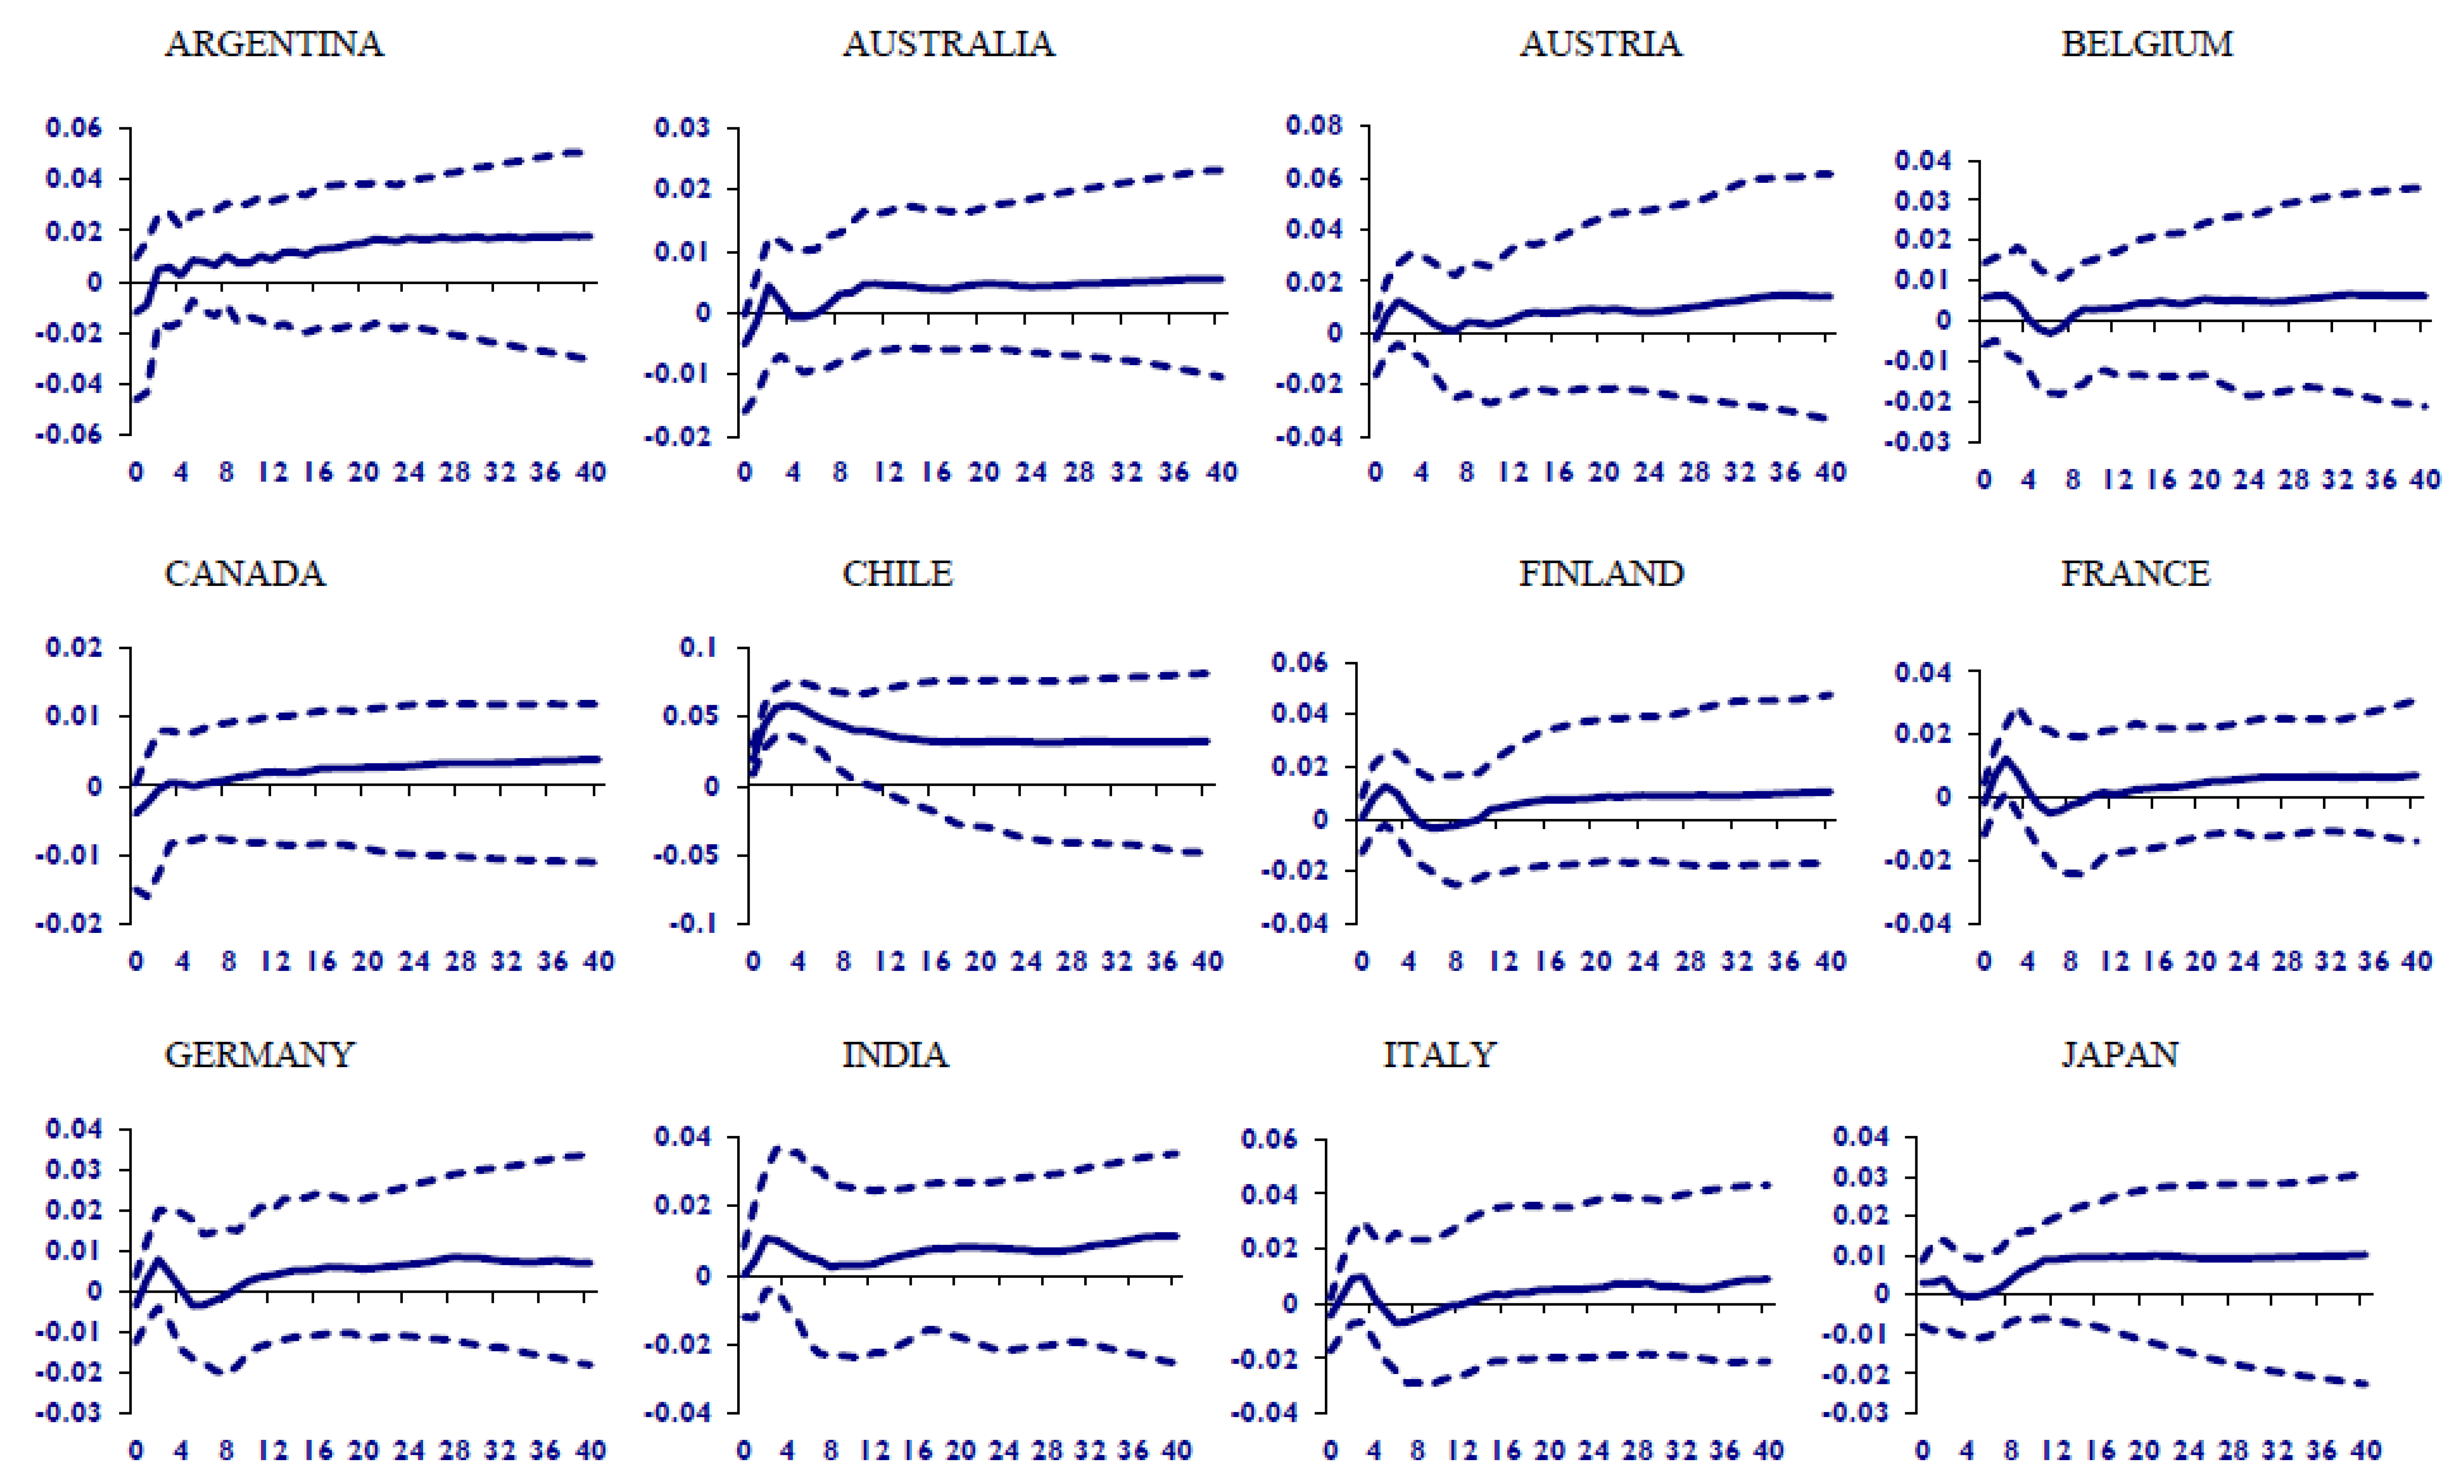
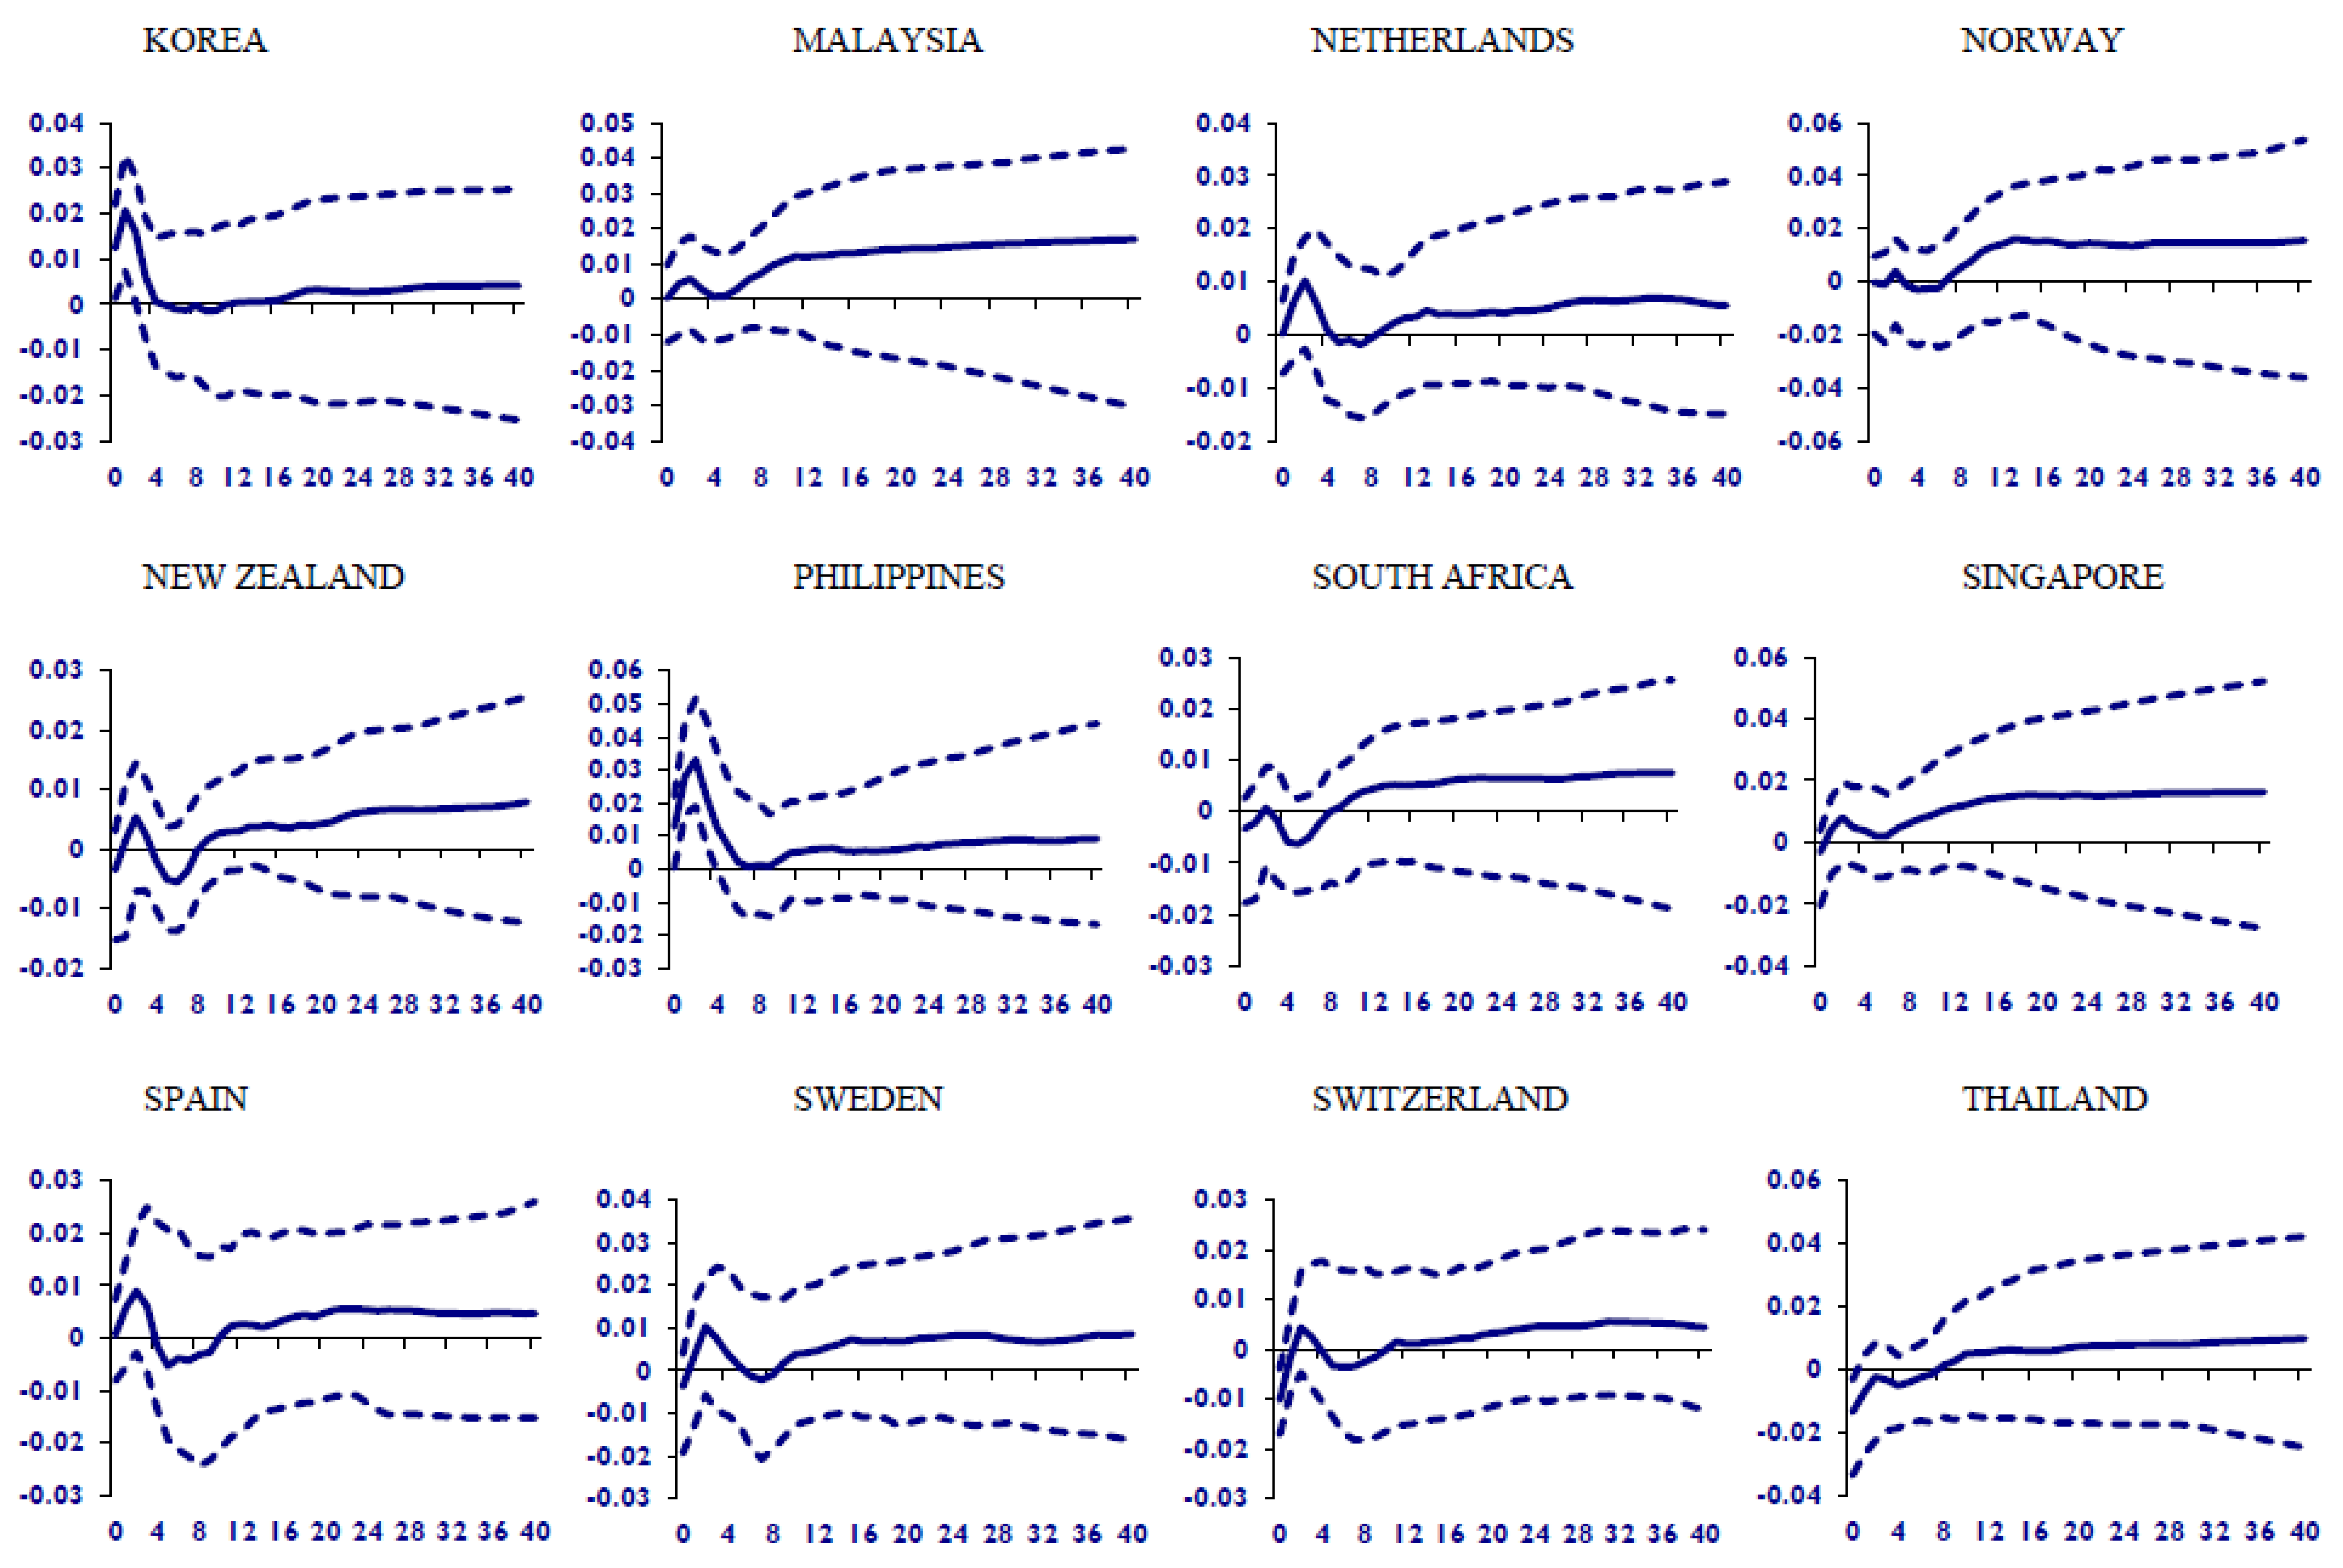
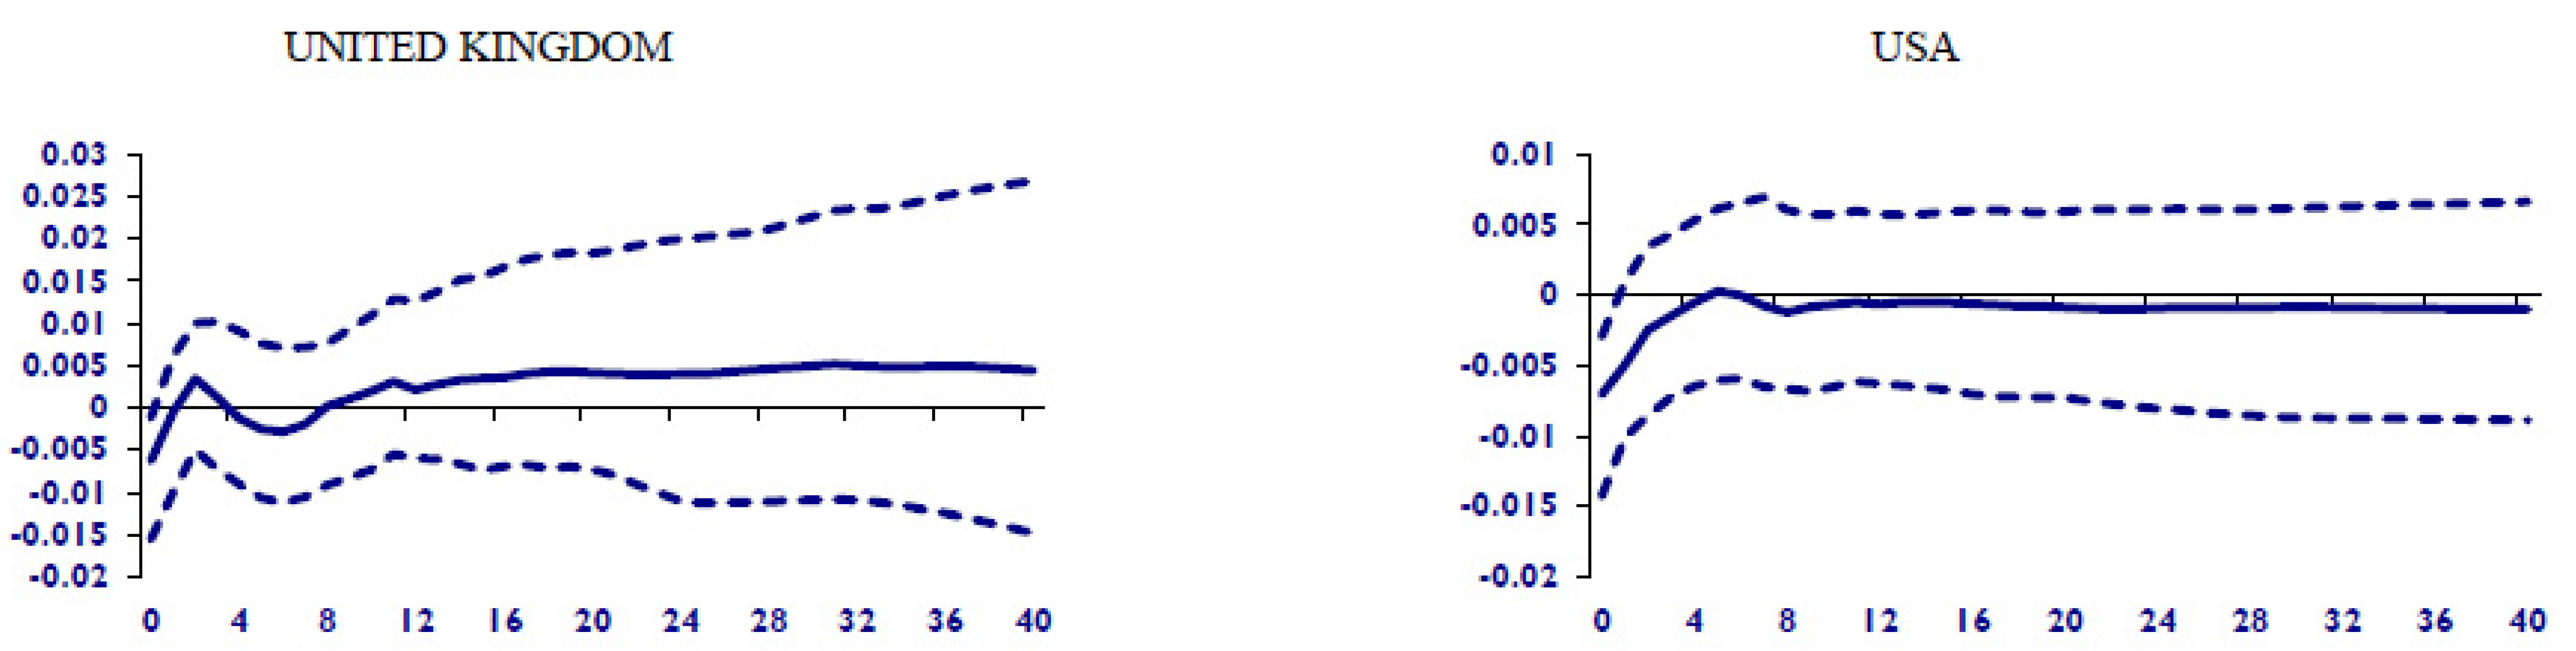
In this section, we present the results of country-specific impulse response functions to assess the impact of shocks emanating from crude oil price uncertainty on real stock prices across the considered 26 economies as captured in our GVAR analysis. The impulse responses of real stock prices to a one standard deviation shock to oil price uncertainty are presented in Figure 1 and Figure 2, respectively, at the individual country and group levels. In each plot, the median response is represented in solid lines while the (16–84%) lower and upper bootstrapped error bands are depicted with dotted lines. In addition, the impacts are measured in percentage by multiplying the values indicated by the solid lines by 100. Considering the recent evidence in Maghyereh and Abdoh (2020) and the theoretical arguments by Bernanke (1983) and Pindyck (1991), our hypothesis is that higher oil uncertainty should negatively impact stock prices, either from a risk-taking perspective (Yin and Lu 2022) or profitability and cash flow perspectives (Demirer et al. 2015).
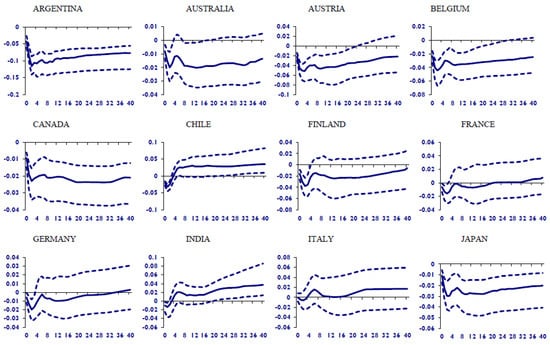
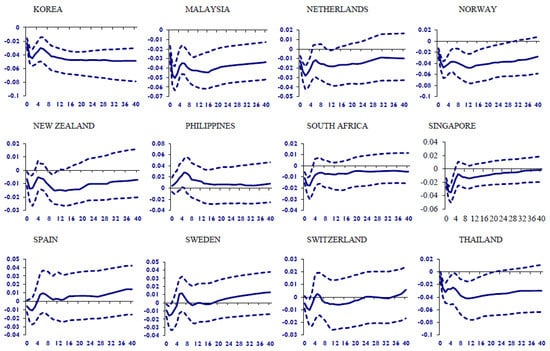
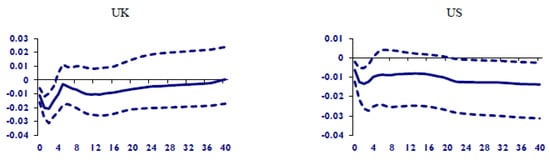
Figure 1.
GVAR-based oil price uncertainty shocks and real stock prices (country-level). Note: The figure depicts the country-specific impulse response functions of real stock prices to a one standard deviation increase in oil price uncertainty. The median impulse response is presented in solid lines, while the 16–84% lower and upper bootstrapped error bands are shown in dotted lines. The impact is measured in percentage points (by multiplying the estimates in the figure with 100) over the quarterly horizon.
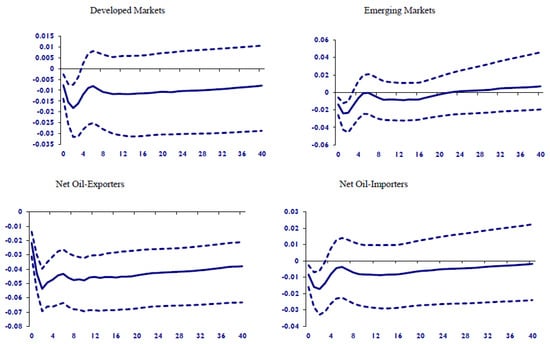
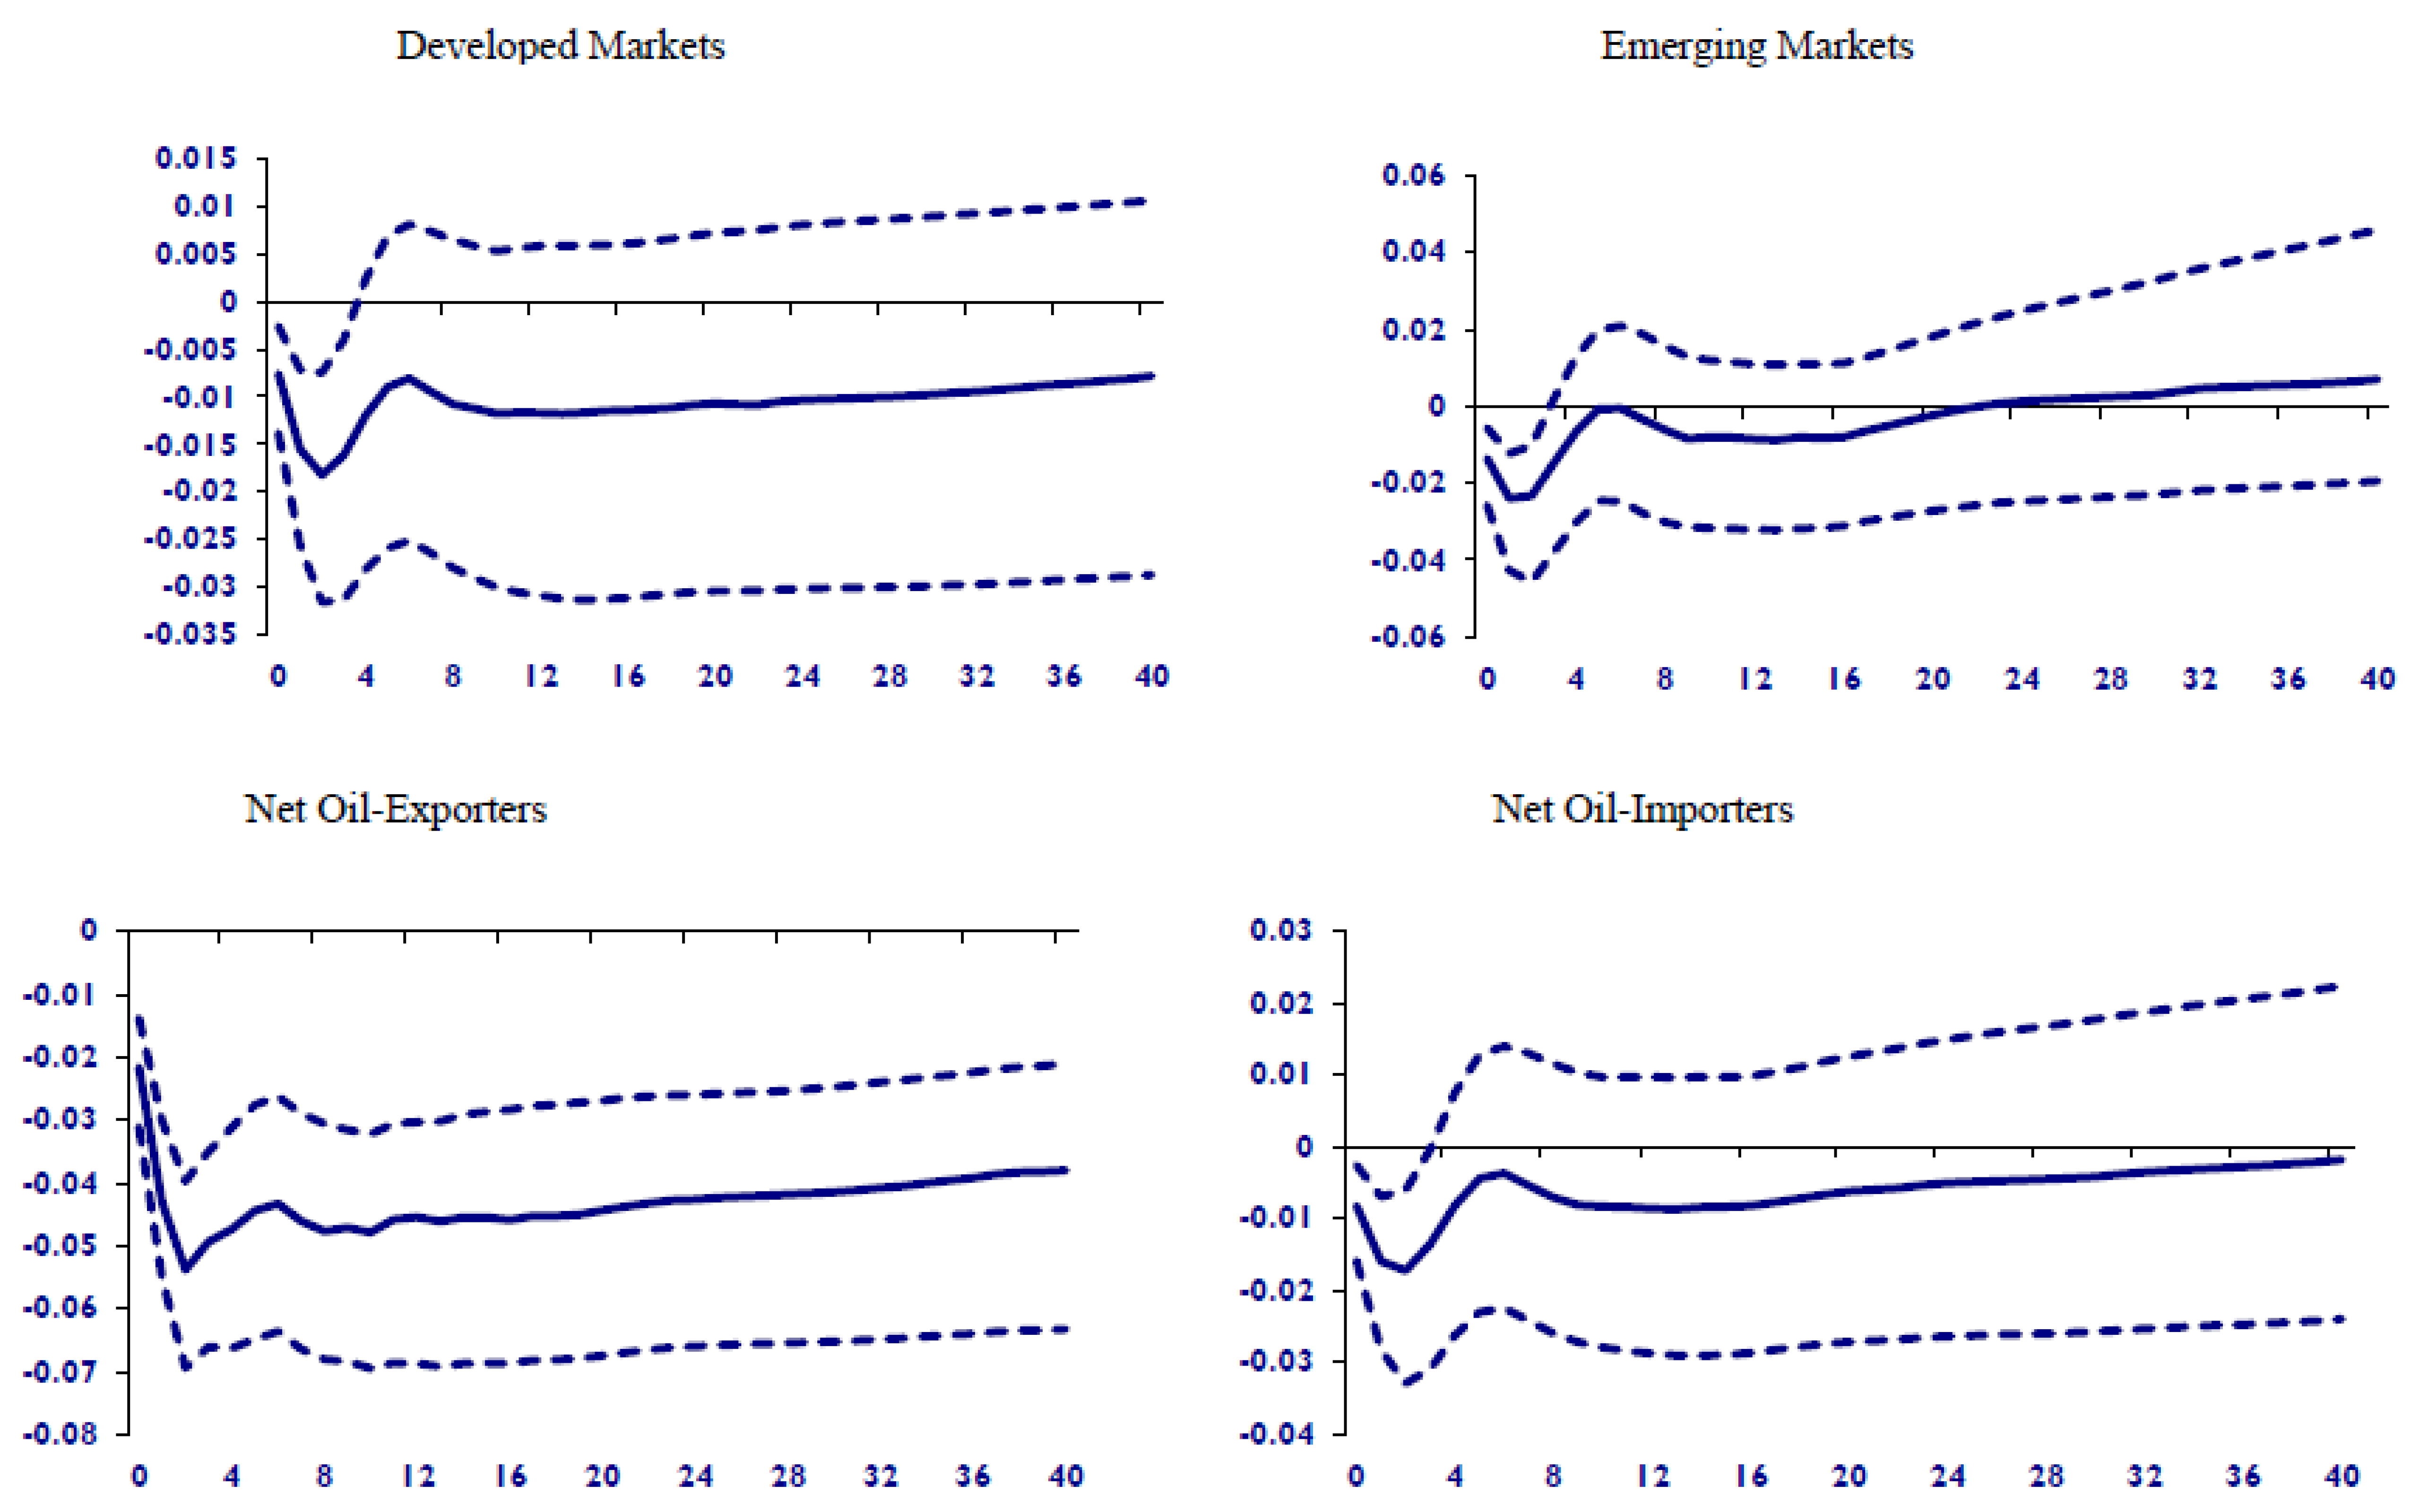
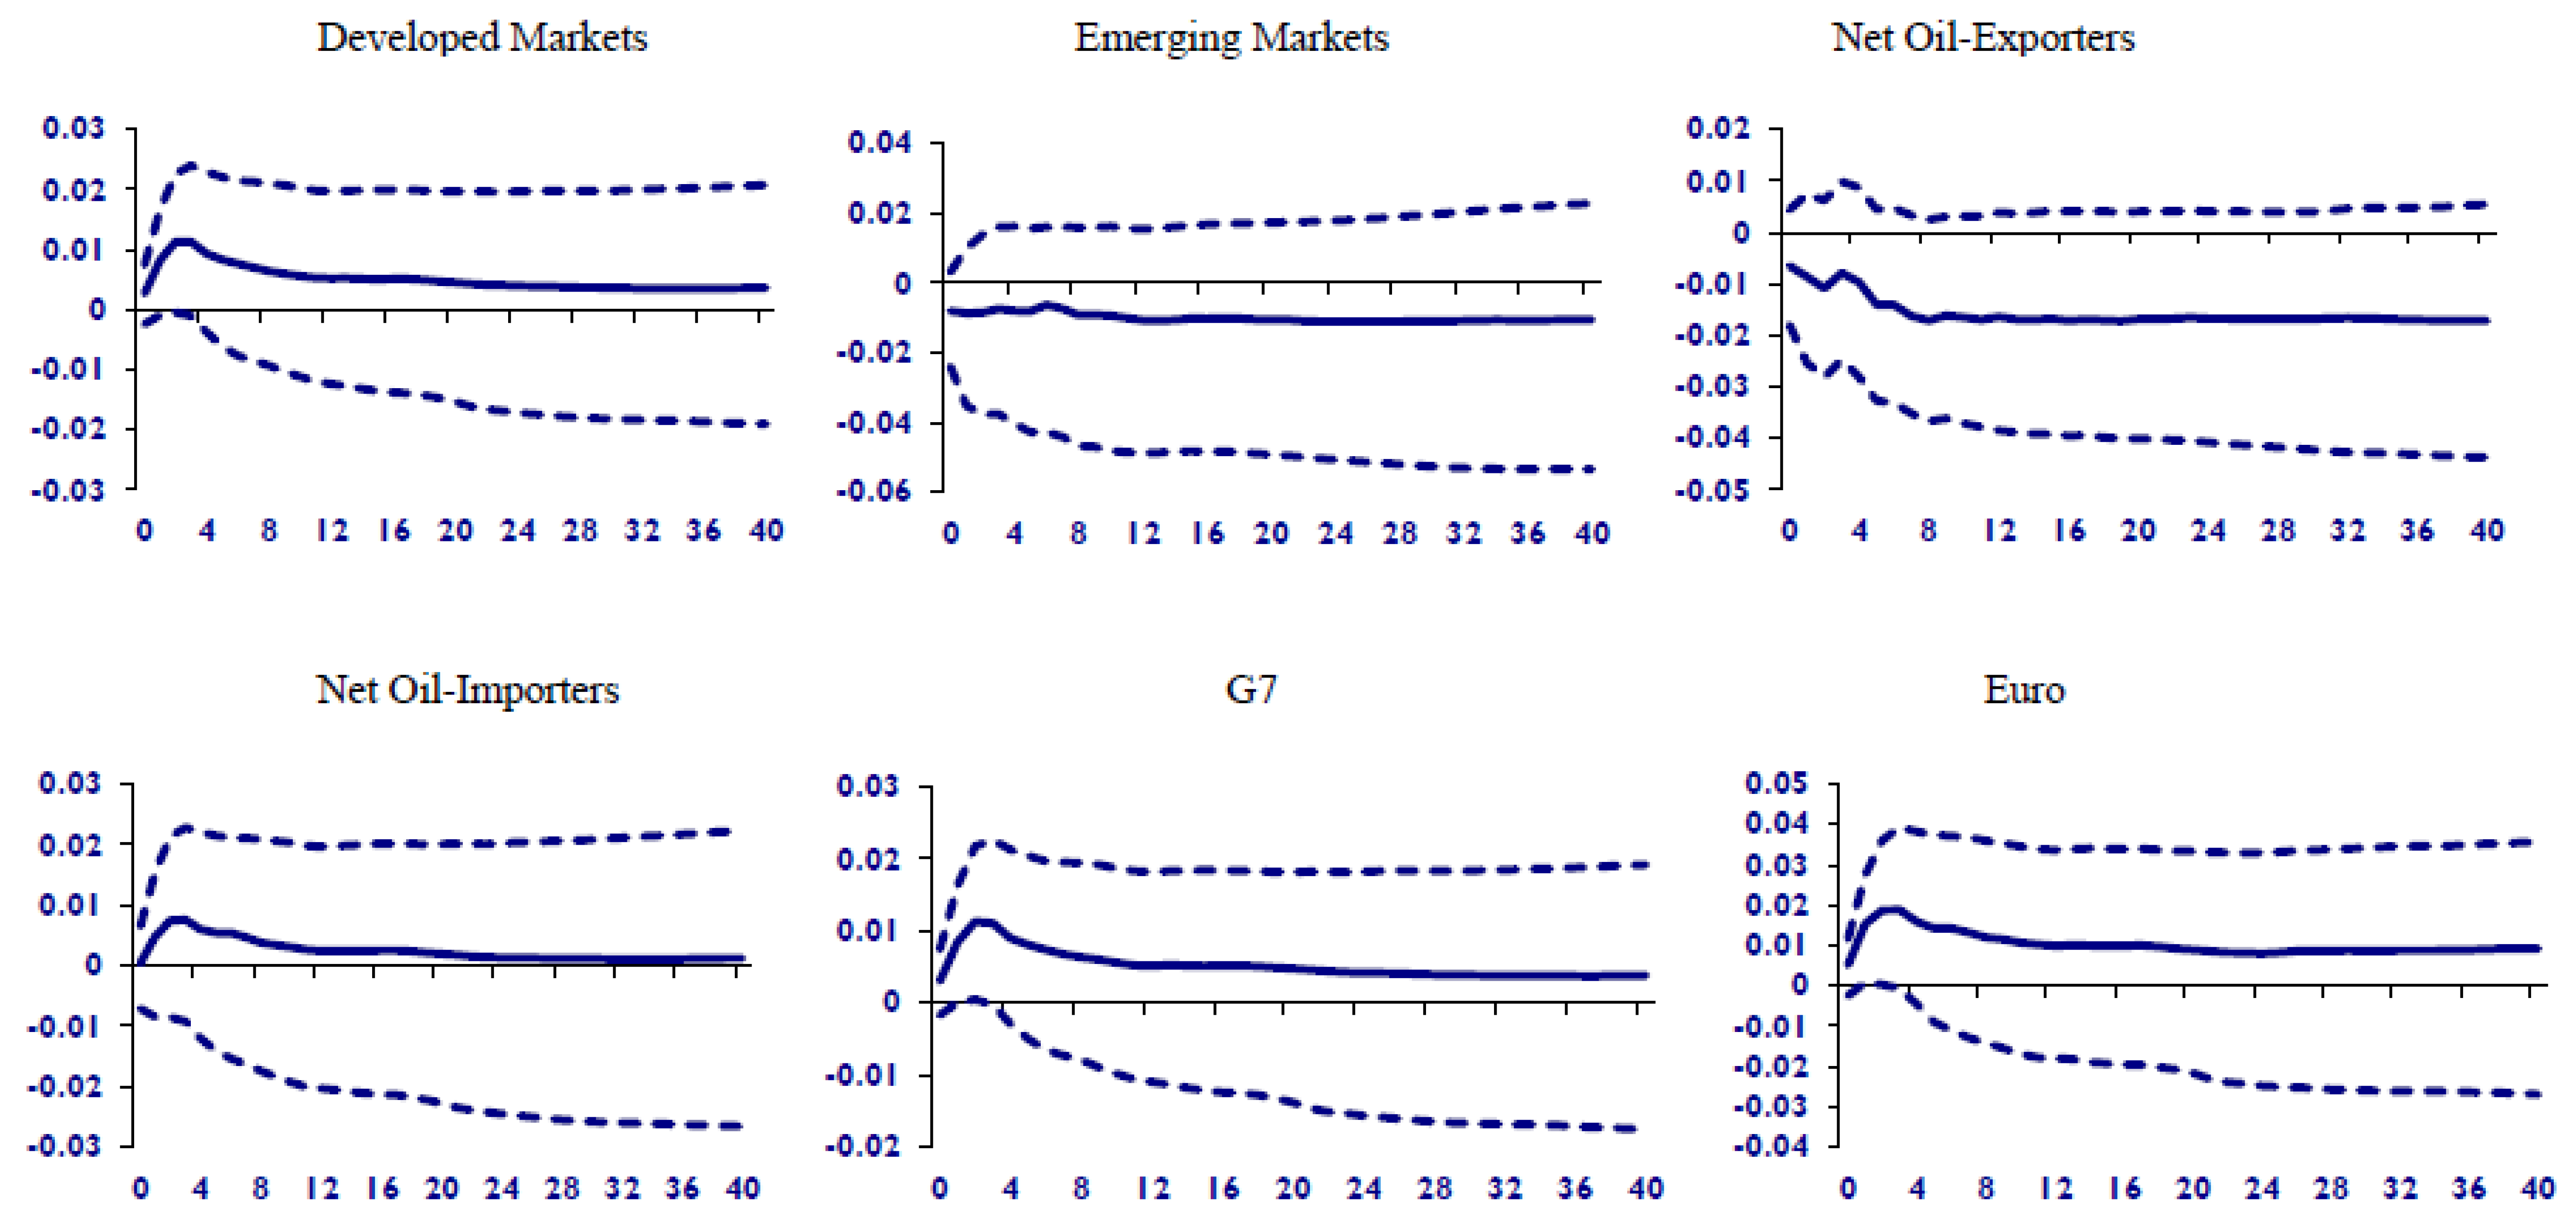
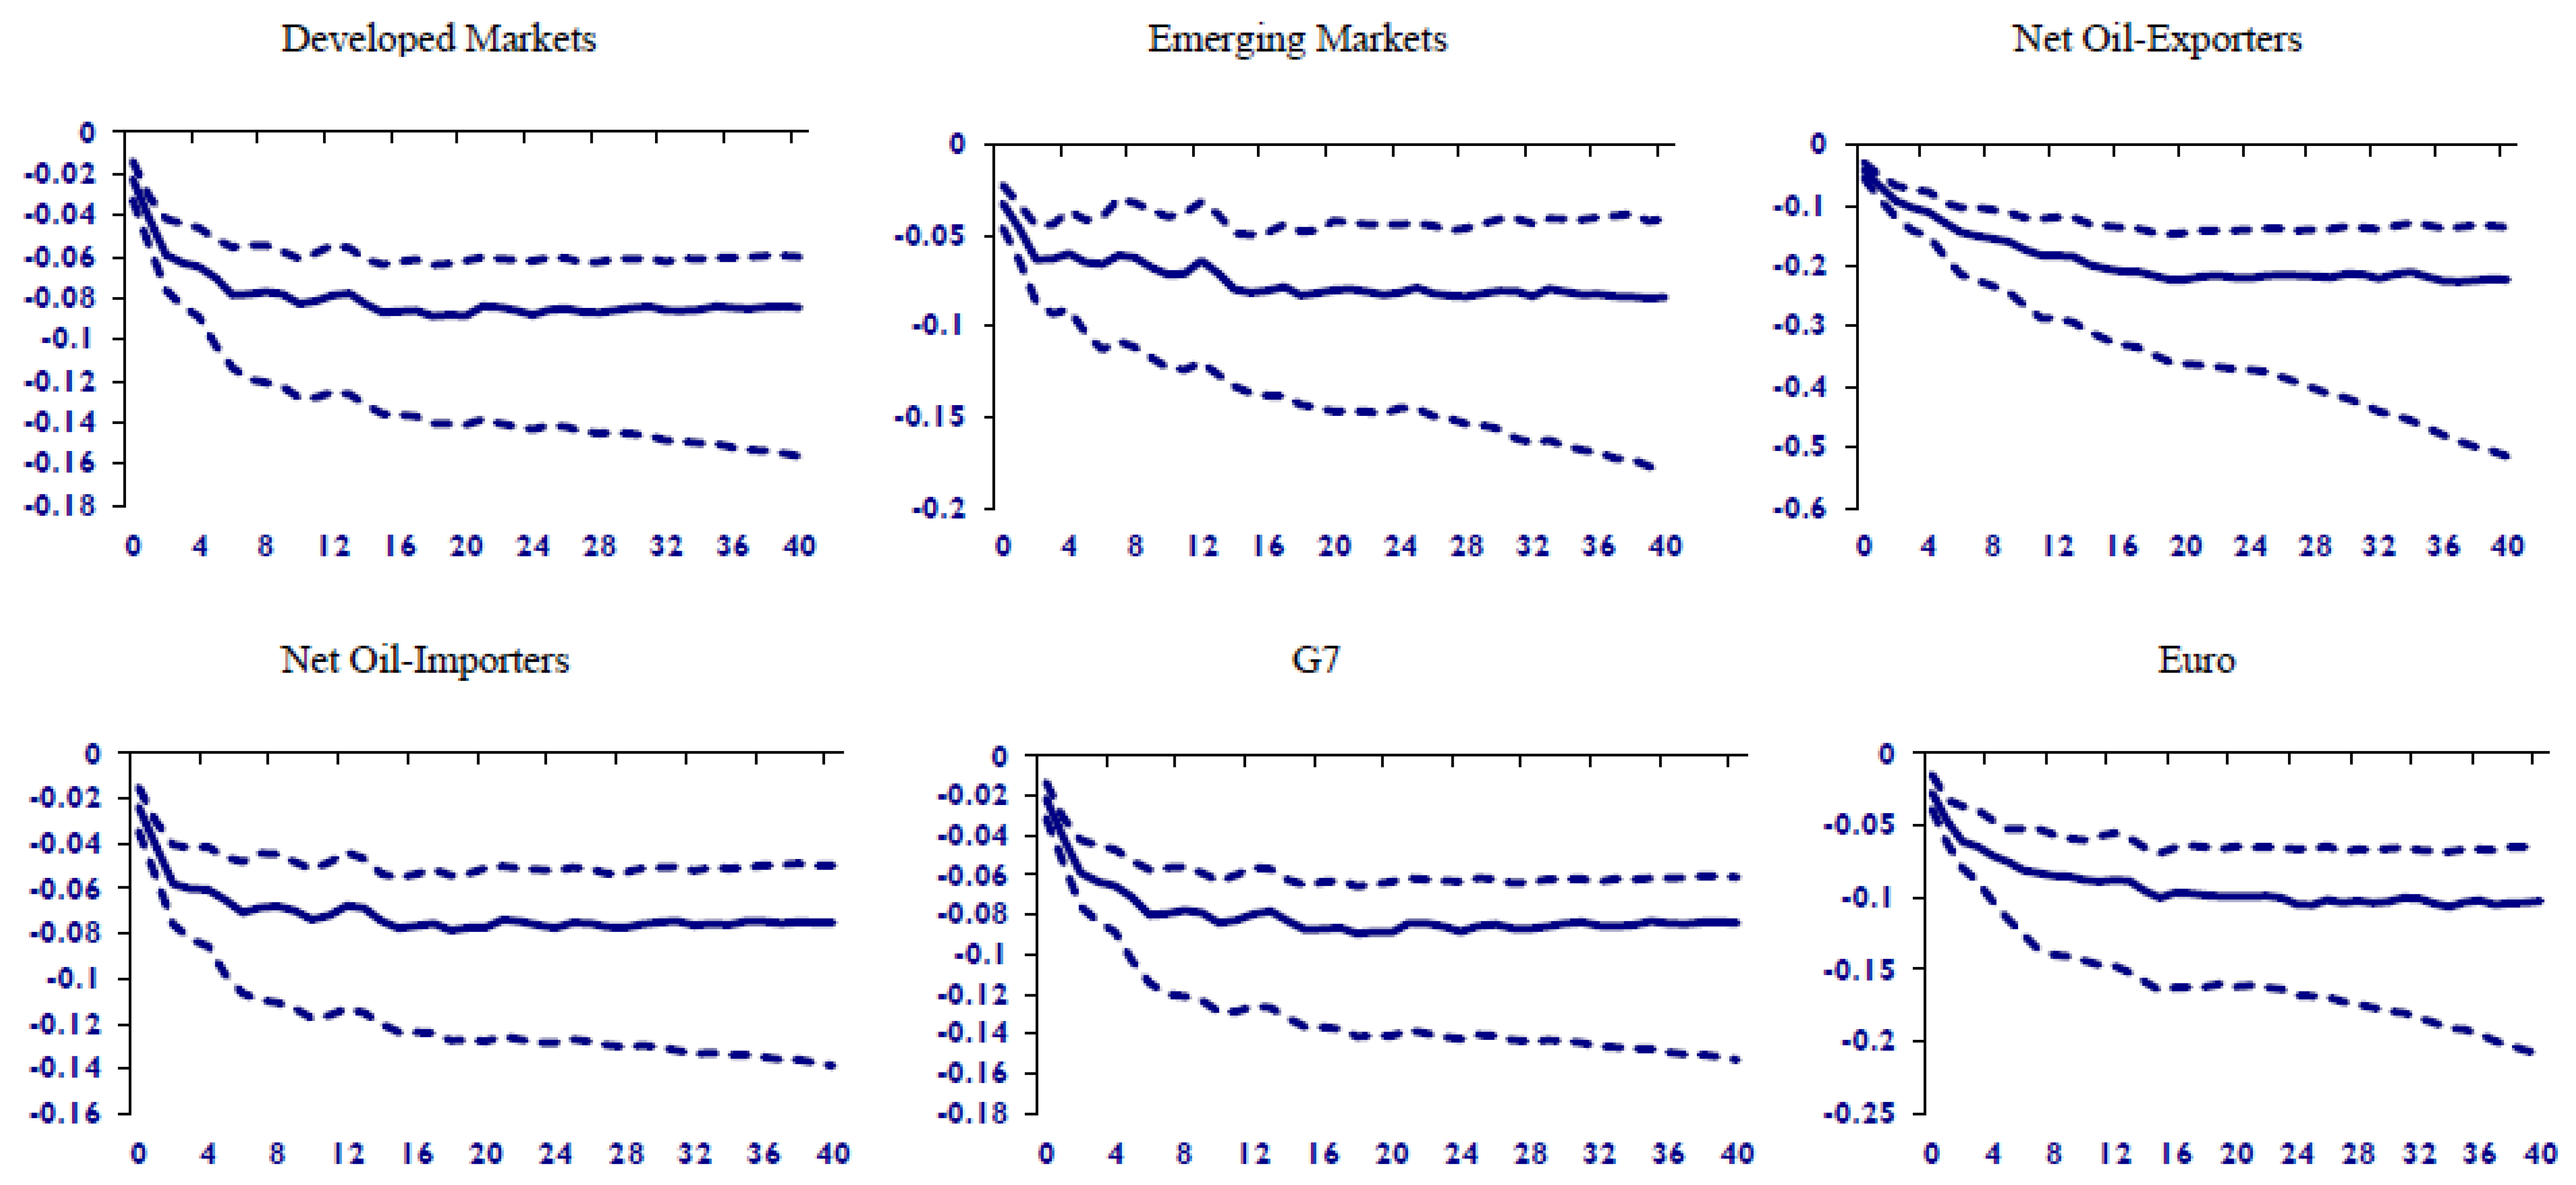
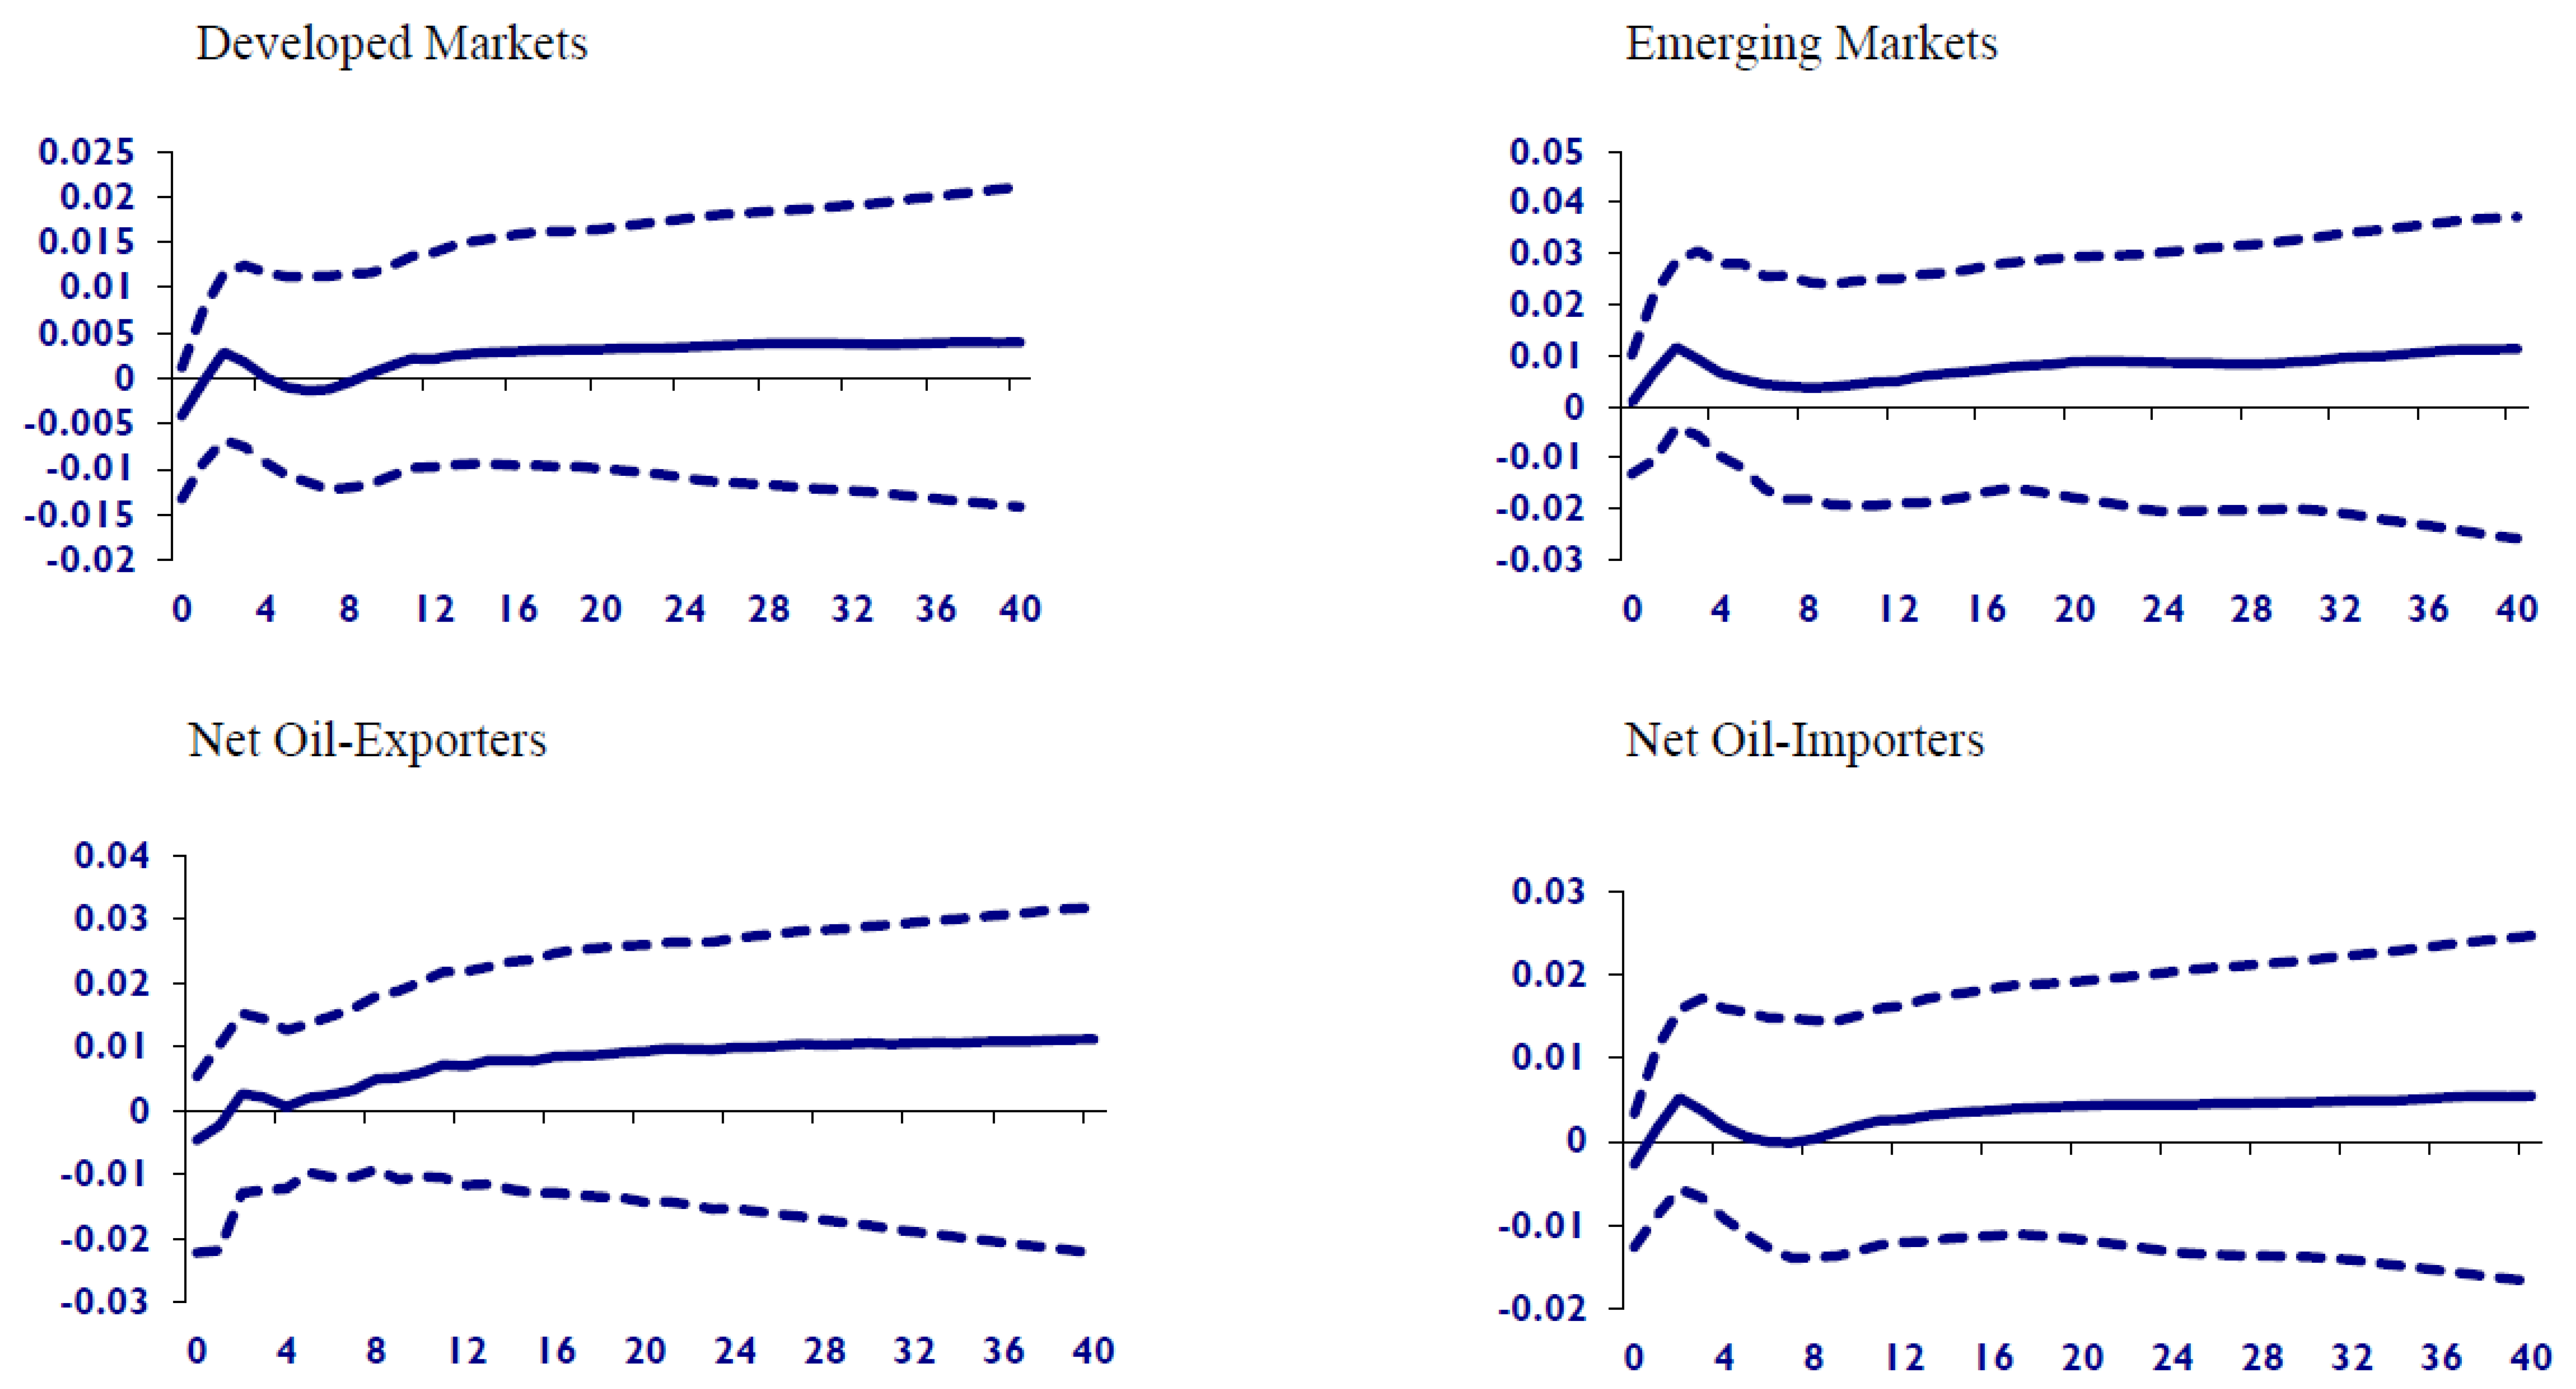
Figure 2.
GVAR-based oil price uncertainty shocks and real stock prices (country groups). Note: The figure depicts the impulse response functions of real stock prices of country groups to a one standard deviation increase in oil price uncertainty. The median impulse response is presented in solid lines, while the 16–84% lower and upper bootstrapped error bands are shown in dotted lines. The impact is measured in percentage points (by multiplying the estimates in the figure with 100) over the quarterly horizon.
We observe in Figure 1 that a one-standard-deviation shock prompted by oil uncertainty causes a statistically significant initial decline in real stock prices in the large majority of the countries in the sample (23 out of the 26). In terms of the magnitude of the impact, consistent with the recent evidence by Chen and Demirer (2022) on global oil exposures, we observe rather heterogenous effects in the magnitude of the responses, ranging from 1% to 10% with generally larger effects observed for net oil-exporting countries as well as those with high economic complexity as will be discussed in our subsequent analysis. The largest negative impact is observed in the case of S. Korea and Malaysia whereas the effect is found to be insignificantly negative for several countries including Italy, the Philippines, and Spain. Interestingly, however, while the impact of the oil uncertainty shock is generally significantly negative for all economies, the stock market recovery varies across the global markets, suggesting that global stock markets exhibit heterogeneity in how they respond to oil uncertainty shocks in the medium to long runs. Our results, thus, align well with the findings of Chen (2009); Basher et al. (2012); and Alsalman (2016) although none of these works simultaneously assess different levels of economies as in our case. While Chen (2009) and Basher et al. (2012) find that a positive shock to oil prices depresses the emerging market stock prices, Alsalman (2016) reports an insignificant effect of oil price uncertainty on US stock returns.
Most stock markets seem to experience a positive correction in the intermediate term after the initial negative response to an oil uncertainty shock, most notably Chile, for which the market recovers quite steadily over the next several quarters following the shock. In comparison, countries like Argentina, Canada, Malaysia, and Norway seem to experience extended slumps due to the oil market shock, understandably because they have largely oil-dependent economies. The same argument could be made for Japan and especially Korea, for which the oil shock seems to exert extended downward pressure on real stock prices, which can be partly attributed to the drag oil uncertainty exerts on industrial activities with consequences on firm profits and investments. A closer review of some stylised facts suggests that Japan and Korea rank higher in economic complexity6 compared to their peers with high oil consumption,7 therefore, any shock to oil, which serves as a major input to the unique variety of products, would have far-reaching effects on production (see Salisu et al. 2021) and by extension stock valuations.
Figure 2 presents the impact of a one-standard-deviation shock to oil price uncertainty on various country groups based on developed/emerging and net oil-exporting/importing classifications.8 This consideration, particularly for the latter, is motivated by the evidence in the literature suggesting heterogeneous response of stock markets of net oil-exporters and net oil-importers to oil price shocks (see, for example, Wang et al. 2013; Salisu and Isah 2017; among others). The results from country groups in Figure 2 generally confirm the inferences obtained from individual country-level analyses. We find that the shock to oil price uncertainty results in an initial reduction in real stock prices across all country groups, with the impact being felt the most by the net oil-exporting economies. Specifically, a one standard deviation shock to oil price uncertainty results in about 5.4% and 1.7% fall in real stock prices of net oil-exporting and net oil-importing groups, respectively (in the 2nd quarter following the shock), while it results in about 1.8% and 2.3% fall, respectively, for the developed and emerging economies (at the same forecast horizon). While it is not unexpected to find that emerging stock markets have greater exposure to oil price uncertainty and thus respond more to oil uncertainty shocks compared to their developed counterparts, the relatively larger response of net exporters compared to net oil importers is interesting. Clearly, the stock markets whose economies are more dependent on oil are more likely to be negatively impacted by oil price uncertainty than those with less dependence on oil. However, the larger impact on oil exporters could be explained by the lack of diversification in exports and the reliance of those economies on the so-called petrodollars, which in turn, generates a bigger impact on their stock markets. In comparison, net oil importers exhibit relatively greater resilience to these shocks despite their reliance on oil imports, which can be explained by the relative strength of their import/export diversification. Similarly, emerging markets seem to show some level of resilience against oil uncertainty shocks, as the impact later turns positive, albeit at a long horizon, even though the initial negative impact is stronger than developed equity markets.
From an investment perspective, the results suggest that country diversification in the face of rising oil market uncertainty can still be beneficial for global investors as global stock markets exhibit a rather heterogeneous pattern in their recovery rates to oil market shocks. Therefore, investors who are concerned about rising oil market uncertainty and how this might impact stock market returns can find some comfort in the results such that a dynamic country allocation strategy can not only help to mitigate the negative effects of such shocks but also help improve portfolio returns as these stock markets recover from the shock in the intermediate and long term. For policymakers, our findings can be used as a guide to further examine the role of the economic fundamentals that lead to the observed heterogeneity in the response of these markets to oil price uncertainty shocks.
4.2. Additional Results
4.2.1. The Role of Global Financial Crisis (GFC)
To better appreciate the effect of oil price uncertainty on the real stock prices under different economic conditions, we analyse, in this sub-section, the distinct role of the global financial crisis (GFC) in the oil-stock market nexus. Thus, we partitioned our sample periods into pre- and post-GFC periods (see Figure 3 and Figure 4 for pre-GFC and Figure 5 and Figure 6 for post-GFC). To further allow for more classifications and generalisation of results, we also present the results of the IRFs for different regions including Euro and the G7 countries. Our results show that virtually all the markets seem to be resilient to oil price uncertainty shocks during the pre-GFC as some of them can be used to hedge against the oil price risk. This is observed from the IRFs where they are largely insignificant over a long forecast horizon after a standard deviation shock to oil price uncertainty. This is evident for both the emerging and developed markets including the Euro and G7 countries. However, this pattern observed during the pre-GFC era appears to have largely disappeared after the GFC as global stocks markets respond significantly negatively to the oil price uncertainty shock during this period. Therefore, the negative IRF outcomes reported for the full sample in Figure 1 and Figure 2 are largely driven by the post-GFC period. In other words, the connection between oil price uncertainty and stock markets is episodic and ignoring this feature may lead to biased outcomes.
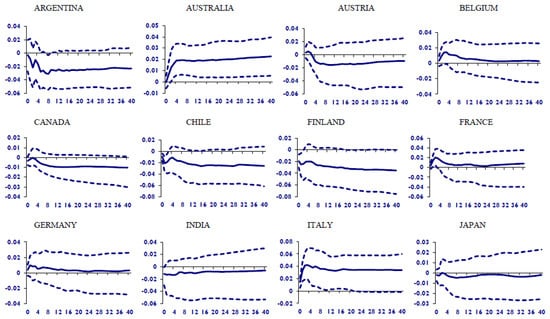
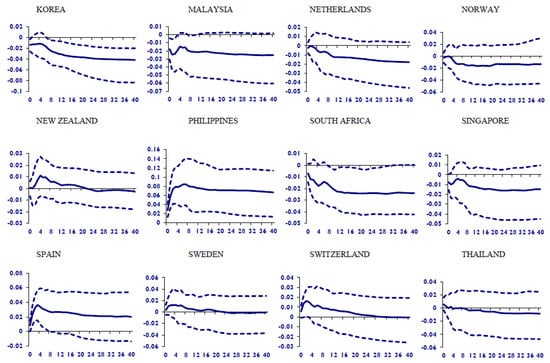
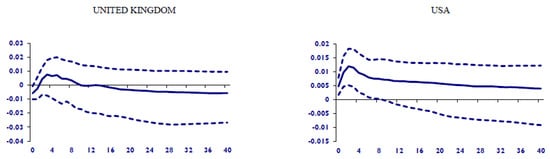
Figure 3.
Country-specific oil price uncertainty shocks and real stock prices (pre-gfc). Note: The figure depicts the country-specific impulse response functions of real stock prices to a one standard deviation increase in oil price uncertainty. The median impulse response is presented in solid lines, while the 16–84% lower and upper bootstrapped error bands are shown in dotted lines. The impact is measured in percentage points (by multiplying the estimates in the figure with 100) over the quarterly horizon.
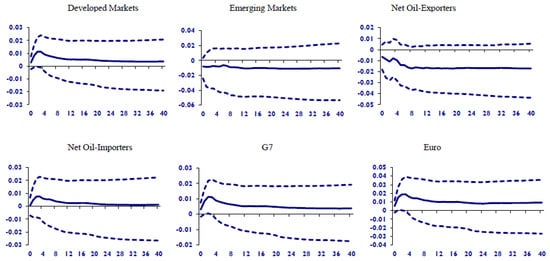
Figure 4.
Country group oil price uncertainty shocks and real stock prices (pre-gfc). Note: The figure depicts the impulse response functions of real stock prices of country groups to a one standard deviation increase in oil price uncertainty. The median impulse response is presented in solid lines, while the 16–84% lower and upper bootstrapped error bands are shown in dotted lines. The impact is measured in percentage points (by multiplying the estimates in the figure with 100) over the quarterly horizon.
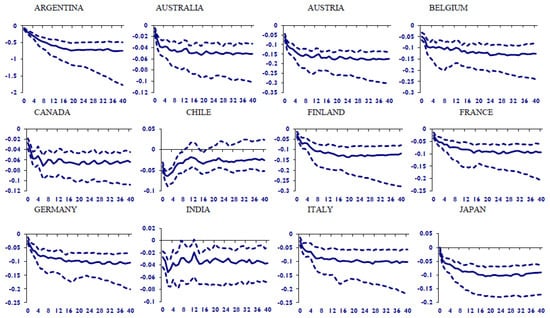
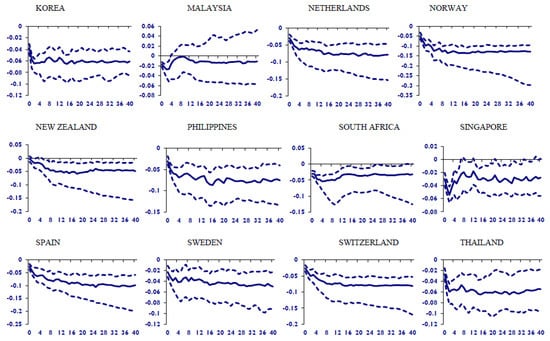

Figure 5.
Country-specific oil price uncertainty shocks and real stock prices (post-gfc). Note: The figure depicts the country-specific impulse response functions of real stock prices to a one standard deviation increase in oil price uncertainty. The median impulse response is presented in solid lines, while the 16–84% lower and upper bootstrapped error bands are shown in dotted lines. The impact is measured in percentage points (by multiplying the estimates in the figure with 100) over the quarterly horizon.
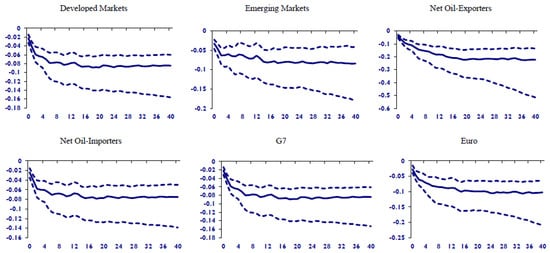
Figure 6.
Country group oil price uncertainty shocks and real stock prices (post-gfc). Note: The figure depicts the impulse response functions of real stock prices of country groups to a one standard deviation increase in oil price uncertainty. The median impulse response is presented in solid lines, while the 16–84% lower and upper bootstrapped error bands are shown in dotted lines. The impact is measured in percentage points (by multiplying the estimates in the figure with 100) over the quarterly horizon.
4.2.2. Robustness Checks with an Alternative Measure for Oil Price Uncertainty
In order to assess the robustness of our findings, we also consider an alternative measure of oil price uncertainty based on the GARCH specification, and the IRFs are presented in Figure 7 and Figure 8 for the individual countries and different groups. Unlike the SV-based oil price uncertainty measure, we find that most of the IRFs are insignificant, and this behaviour is particularly evident for the country groups when the GARCH-based measure is used. As previously espoused in Section 1, the results seem to support the argument raised by Nguyen et al. (2021) that the SV-based oil price uncertainty is a better measure of oil price uncertainty as it appropriately captures the inherent dynamics in the crude oil market. This also highlights the importance of the choice of the metric to capture oil market uncertainty for policymakers as the economic assessment of oil market shocks on the real economy depends on the metric employed in the analysis.
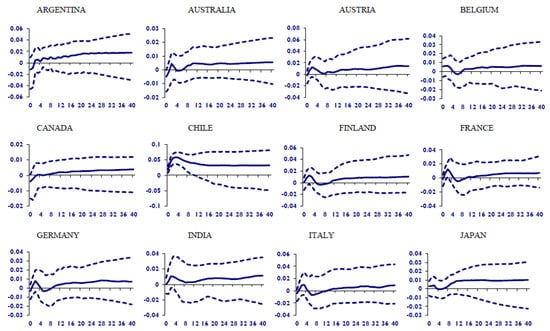
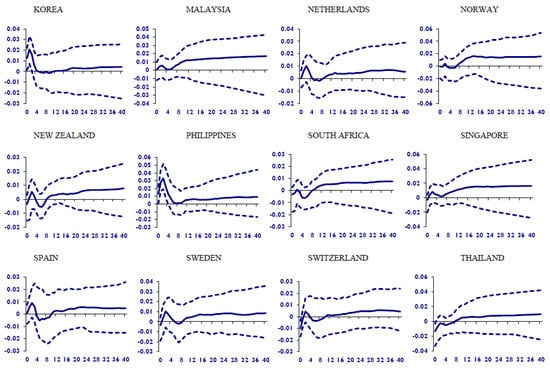
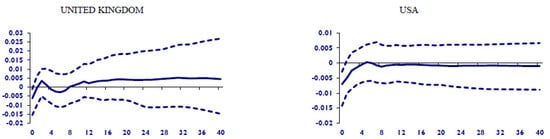
Figure 7.
GARCH-based oil price uncertainty shocks and real stock prices (country-specific). Note: The figure depicts the country-specific impulse response functions of real stock prices to a one standard deviation increase in oil price uncertainty. The median impulse response is presented in solid lines, while the 16–84% lower and upper bootstrapped error bands are shown in dotted lines. The impact is measured in percentage points (by multiplying the estimates in the figure by 100) over the quarterly horizon.
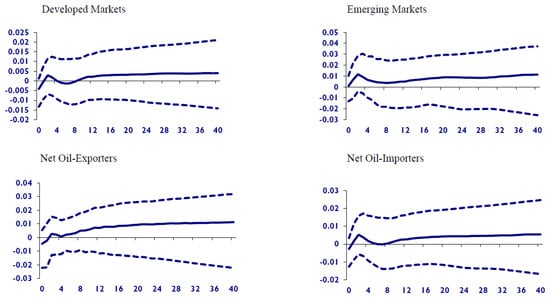
Figure 8.
GARCH-based oil price uncertainty shocks and real stock prices (country groups). Note: The figure depicts the impulse response functions of real stock prices of country groups to a one standard deviation increase in oil price uncertainty. The median impulse response is presented in solid lines, while the 16–84% lower and upper bootstrapped error bands are shown in dotted lines. The impact is measured in percentage points (by multiplying the estimates in the figure by 100) over the quarterly horizon.
5. Conclusions
In this study, we examine the nexus between oil and stock markets from a novel perspective by utilising a recently proposed, model-free measure of oil price uncertainty within a Global Vector Autoregressive (GVAR) framework covering 26 global stock markets. We show that oil price uncertainty shocks dampen real stock prices in the large majority of the countries in our sample, with the effect found to be more persistent for those with higher economic complexity and greater reliance on oil in their exports. While the effect of the uncertainty shock is negative for most countries in the short run, we observe a great deal of heterogeneity in the recovery of certain countries/regions from the shock. This is in line with the evidence in the literature that the oil–stock market relationship is not homogeneous across global markets, which offers useful pointers for possible hedging strategies against rising oil market uncertainty. One possible strategy is to devise a conditional investment scheme in which investors hold long positions in emerging market exchange-traded funds (ETFs) funded by short positions in developed stock market ETFs, conditioned on the state of the oil price uncertainty, along the lines of Demirer et al. (2020a).
From a policy perspective, considering that stock prices serve as a leading indicator of macroeconomic variables (Stock and Watson 2003), the impact of oil price uncertainty on equity markets is likely to prolong the direct effects of the same on economic activities (Van Eyden et al. 2019). In other words, high oil price uncertainty depresses economic activities (Salisu et al. 2021), and this could drive firms to delay investment decisions until the uncertainty is lower (Elder and Serletis 2009; Henriques and Sadorsky 2011). Thus, the decision to cut investment usually has an overarching effect on firms’ profitability and their stock prices (Bayrakdaroglu et al. 2017). Hence, authorities in oil-rich, as well as emerging economies, should be devising policies to make domestic risk management instruments readily available for firms in the wake of rising oil price uncertainty. This could be in the form of facilitating the development of national derivatives markets in which local firms can utilise futures and options contracts to mitigate their exposure to oil price shocks. For future research, considering the growing evidence that disentangling oil uncertainty based on the nature and origin of the oil price shock in terms of demand or supply can improve the inferences regarding the effect of oil price uncertainty on financial markets (e.g., Demirer et al. 2020b), it would be interesting to implement the disentangled oil uncertainty series within the GVAR framework, which could offer better insights into the heterogeneous responses of stock markets to oil price uncertainty shocks. This is an area we reserve for future research, besides analysing second-moment effects of oil uncertainty on other financial markets as in Liu et al. (2013).
Author Contributions
A.A.S.: Conceptualization, Methodology, Formal Analysis, Writing—Original Draft, Reviewing & Editing. R.G.: Conceptualization, Methodology, Software, Formal Analysis, Writing—Original and Revised Drafts, Reviewing and Editing. R.D.: Conceptualization, Writing—Original and Revised Drafts, Reviewing & Editing, Project Administration. All authors have read and agreed to the published version of the manuscript.
Funding
This research received no external funding.
Data Availability Statement
The GVAR data used for this study can be obtained from https://sites.google.com/site/gvarmodelling/data, accessed on 17 July 2022. Data for the oil uncertainty index which is not captured in the GVAR dataset can be obtained from https://sites.google.com/site/nguyenhoaibao/oil-market-uncertainty?authuser=0, accessed on 17 July 2022.
Acknowledgments
We would like to thank three anonymous referees for many helpful comments. However, any remaining errors are solely ours.
Conflicts of Interest
The authors declare no conflict of interest.
Notes
| 1 | Basher and Sadorsky (2006) employ a multi-factor model to show that oil price risk tends to strongly affect a large set of emerging stock market returns. |
| 2 | The developed markets include Australia, Austria, Belgium, Canada, Finland, France, Germany, Italy, Japan, The Netherlands, Norway, New Zealand, Singapore, Spain, Sweden, Switzerland, United Kingdom and the USA; while the emerging markets are Argentina, Chile, India, Malaysia, Philippines, South Africa, South Korea and Thailand. Our choice of countries is guided by data availability, as we consider a more representative classification for all the countries following the Morgan Stanley Classification Index (MSCI). In other words, countries with fewer number of years as being developed but more years as emerging are classified as emerging, and same holds for our consideration for the developed countries. |
| 3 | https://www.econ.cam.ac.uk/people-files/emeritus/mhp1/GVAR/GVAR.html, accessed on 17 July 2022. |
| 4 | Data is available at https://www.econ.cam.ac.uk/people-files/emeritus/mhp1/GVAR/GVAR.html, accessed on 17 July 2022. However, data for the oil uncertainty index is not captured in the GVAR dataset and can be obtained from https://sites.google.com/site/nguyenhoaibao/oil-market-uncertainty?authuser=0, accessed on 17 July 2022. Note that, the monthly values of the oil price uncertainty index is converted to quarterly values by taking three-month averages over a quarter to match the quarterly frequency of the GVAR dataset. |
| 5 | The oil price uncertainty index is based on the conditional volatility of the unpredictable component of the real price of oil as measured by the Consumer Price Index (CPI)-deflated nominal values of the conventional US refiners’ acquisition cost for imported crude oil. The reader is referred to Nguyen et al. (2021) for further technical details. |
| 6 | See the link for the ranking and discussion of economic complexity https://www.visualcapitalist.com/countries-ranked-by-their-economic-complexity/, accessed on 17 July 2022. Highly ranked countries in terms of economic complexity imply a high diversity of exported products and sophisticated and unique exported products (i.e., few other countries produce similar products). |
| 7 | See the link for the ranking of countries by oil consumption per capita https://www.eia.gov/tools/faqs/faq.php?id=709&t=6, accessed on 17 July 2022. |
| 8 | The classification of countries into emerging and developed economies is drawn from the market classification by the Morgan Stanley Capital International (MSCI) (see https://www.msci.com/market-classification, accessed on 17 July 2022), while the World Fact Book of the Central Intelligence Agency (CIA) is used to group countries into net oil exporting and net oil importing countries. |
References
- Alsalman, Zeina. 2016. Oil price uncertainty and the US stock market analysis based on a GARCH-in-mean VAR model. Energy Economics 59: 251–60. [Google Scholar] [CrossRef]
- Aye, Goodness. 2015. Does oil price uncertainty matter for stock returns in South Africa? Investment Management and Financial Innovations 12: 179–88. [Google Scholar]
- Aye, Goodness, Mehmet Balcilar, and Rangan Gupta. 2017. International stock return predictability: Is the role of US time-varying? Empirica 44: 121–46. [Google Scholar] [CrossRef] [Green Version]
- Basher, Syed Abul, Alfred Haug, and Perry Sadorsky. 2012. Oil prices, exchange rates and emerging stock markets. Energy Economics 34: 227–40. [Google Scholar] [CrossRef] [Green Version]
- Basher, Syed Abul, and Perry Sadorsky. 2006. Oil price risk and emerging stock markets. Global Finance Journal 17: 224–51. [Google Scholar] [CrossRef]
- Bass, Alexander. 2017. Does oil prices uncertainty affect stock returns in Russia: A bivariate GARCH-in-mean approach. International Journal of Energy Economics and Policy 7: 224–30. [Google Scholar]
- Bayrakdaroglu, Ali, Çağatay Mirgen, and Ezgi Kuyu. 2017. Relationship between profitability ratios and stock prices: An empirical analysis on BIST-100. Press Academia Procedia 6: 1–10. [Google Scholar] [CrossRef]
- Benavides, Domingo Rodríguez, Miguel Ángel Martínez García, and Luis Fernando Hoyos Reyes. 2019. Uncertainty of the international oil price and stock returns in Mexico through an SVAR-MGARCH. Contaduría y administración 64: 1–16. [Google Scholar]
- Bernanke, Ben Shalom. 1983. Irreversibility, uncertainty, and cyclical investment. Quarterly Journal of Economics 98: 85–106. [Google Scholar] [CrossRef]
- Chen, Chun-Da, and Riza Demirer. 2022. Oil beta uncertainty and global stock returns. Energy Economics 112: 106150. [Google Scholar] [CrossRef]
- Chen, Shiu-Sheng. 2009. Do higher oil prices push the stock market into bear territory? Energy Economics 32: 490–95. [Google Scholar] [CrossRef]
- Chudik, Alexander, and Mohammad Hashem Pesaran. 2016. Theory and practice of GVAR modelling. Journal of Economic Surveys 30: 165–97. [Google Scholar] [CrossRef]
- Demirer, Riza, Aydin Yuksel, and Asli Yuksel. 2020a. Oil price uncertainty, global industry returns and active investment strategies. Journal of Economic Asymmetries 22: e00177. [Google Scholar] [CrossRef]
- Demirer, Riza, Rangan Gupta, Christian Pierdzioch, and Syed Jawad Hussain Shahzad. 2020b. The predictive power of oil price shocks on realized volatility of oil: A note. Resources Policy 69: 101856. [Google Scholar] [CrossRef] [PubMed]
- Demirer, Rıza, Shrikant Jategaonkar, and Ahmed Khalifa. 2015. Oil price risk exposure and the cross-section of stock returns: The case of net exporting countries. Energy Economics 49: 142–40. [Google Scholar] [CrossRef]
- Diaz, Elena Maria, Juan Carlos Molero, and Fernando Perez de Gracia. 2016. Oil price volatility and stock returns in the G7 economies. Energy Economics 54: 417–30. [Google Scholar] [CrossRef] [Green Version]
- Elder, John, and Apostolos Serletis. 2009. Oil price uncertainty in Canada. Energy Economics 31: 852–56. [Google Scholar] [CrossRef]
- Hatemi, J. Abdulnasser, Abdulrahman Al Shayeb, and Eduardo Roca. 2017. The effect of oil prices on stock prices: Fresh evidence from asymmetric causality tests. Applied Economics 49: 1584–92. [Google Scholar] [CrossRef]
- Henriques, Irene, and Perry Sadorsky. 2011. The effect of oil price volatility on strategic investment. Energy Economics 33: 79–87. [Google Scholar] [CrossRef]
- Jiranyakul, Komain. 2014. Does oil price uncertainty transmit to the Thai stock market? Journal of Economic & Financial Studies 2: 16–25. [Google Scholar]
- Jo, Soojin. 2014. The effects of oil price uncertainty on global real economic activity. Journal of Money, Credit and Banking 46: 1113–35. [Google Scholar] [CrossRef]
- Jordan, Steven, Andrew Vivian, and Mark Wohar. 2016. Forecasting market returns: Bagging or combining? International Journal of Forecasting 33: 102–20. [Google Scholar] [CrossRef] [Green Version]
- Jordan, Steven, Andrew Vivian, and Mark Wohar. 2017. Stock returns forecasting with metals: Sentiment vs. fundamentals. The European Journal of Finance 24: 458–77. [Google Scholar] [CrossRef] [Green Version]
- Liu, Ming-Lei, Qiang Ji, and Ying Fan. 2013. How does oil market uncertainty interact with other markets? An empirical analysis of implied volatility index. Energy 55: 860–68. [Google Scholar] [CrossRef]
- Maghyereh, Aktham, and Hussein Abdoh. 2020. Asymmetric effects of oil price uncertainty on corporate investment. Energy Economics 86: 1–19. [Google Scholar] [CrossRef]
- Masih, Rumi, Sanjay Peters, and Lurion De Mello. 2011. Oil price volatility and stock price fluctuations in an emerging market: Evidence from South Korea. Energy Economics 33: 975–86. [Google Scholar] [CrossRef]
- Mohaddes, Kamiar, and Mehdi Raissi. 2020. Compilation, Revision and Updating of the Global VAR (GVAR) Database, 1979Q2-2019Q4. Mimeo: University of Cambridge, Judge Business School. [Google Scholar] [CrossRef]
- Nguyen, Bao, Tatsuyoshi Okimoto, and Trung Duc Tran. 2021. Uncertainty-dependent and sign-dependent effects of oil market shocks. Journal of Commodity Markets 26: 100207. [Google Scholar] [CrossRef]
- Pesaran, Mohammad. Hashem, Til Schuermann, and Scott Weiner. 2004. Modeling Regional Interdependencies Using a Global Error-Correcting Macroeconometric Model. Journal of Business and Economic Statistics 22: 129–62. [Google Scholar] [CrossRef]
- Pindyck, Robert. 1991. Irreversibility, uncertainty, and investment. Journal of Economic Literature 29: 1110–48. [Google Scholar]
- Prodromou, Tina, and Riza Demirer. 2022. Oil Price Shocks and Cost of Capital: Does Market Liquidity Play a Role? Available online: https://ssrn.com/abstract=4144883 (accessed on 17 July 2022).
- Rahman, Sajjadur. 2021. Oil price volatility and the US stock market. Empirical Economics 61: 1461–89. [Google Scholar] [CrossRef]
- Sadorsky, Perry. 1999. Oil price shocks and stock market activity. Energy Economics 21: 449–69. [Google Scholar] [CrossRef]
- Salisu, Afees Adebare, Rangan Gupta, and Abeeb Olaniran. 2021. The effect of oil uncertainty shock on real GDP of 33 countries: A global VAR approach. Applied Economics Letters, 1–6. [Google Scholar] [CrossRef]
- Salisu, Afees Adebare, and Kazeem Isah. 2017. Revisiting the oil price and stock market nexus: A nonlinear Panel ARDL approach. Economic Modelling 66: 258–71. [Google Scholar] [CrossRef]
- Silvapulle, Param, Russell Smyth, Xibin Zhang, and Jean-Pierre Fenech. 2017. Nonparametric panel data model for crude oil and stock prices in net oil importing countries. Energy Economics 67: 255–67. [Google Scholar] [CrossRef]
- Sousa, Ricardo, Andrew Vivian, and Mark Wohar. 2016. Predicting asset returns in the BRICs: The role of macroeconomic and fundamental predictors. International Review of Economics and Finance 41: 122–43. [Google Scholar] [CrossRef] [Green Version]
- Stock, James, and Mark Watson. 2003. Forecasting Output and Inflation: The Role of Asset Prices. Journal of Economic Literature XLI: 788–829. [Google Scholar]
- Swaray, Raymond, and Afees Adebare Salisu. 2018. A firm-level analysis of the upstream-downstream dichotomy in the oil-stock nexus. Global Finance Journal 37: 199–218. [Google Scholar] [CrossRef]
- Van Eyden, Renee, Mamothoana Difeto, Rangan Gupta, and Mark Wohar. 2019. Oil price volatility and economic growth: Evidence from advanced economies using more than a century’s data. Applied Energy 233: 612–21. [Google Scholar] [CrossRef] [Green Version]
- Wang, Yudong, Chongfeng Wu, and Li Yang. 2013. Oil price shocks and stock market activities: Evidence from oil-importing and oil-exporting countries. Journal of Comparative Economics 41: 1220–39. [Google Scholar] [CrossRef]
- Yin, Libo, and Man Lu. 2022. Oil uncertainty and firms’ risk-taking. Energy Economics 108: 105922. [Google Scholar] [CrossRef]
- Zhu, Hui-Ming, Su-Fang Li, and Keming Yu. 2011. Crude oil shocks and stock markets: A panel threshold cointegration approach. Energy Economics 33: 987–94. [Google Scholar] [CrossRef]
Publisher’s Note: MDPI stays neutral with regard to jurisdictional claims in published maps and institutional affiliations. |
© 2022 by the authors. Licensee MDPI, Basel, Switzerland. This article is an open access article distributed under the terms and conditions of the Creative Commons Attribution (CC BY) license (https://creativecommons.org/licenses/by/4.0/).