1. Introduction
Although studies have noted the positive impact of re-exports on the economy, we did not find any scientific literature on the distribution of the economic effects of companies’ re-export activities between the national economy, that is, the country in which the re-export company is a resident, and the economies of foreign countries. We also could not find any studies on the cost structure of re-export companies across different sectors and industries of the economy. For example, there seem to be no studies on the impact of re-export companies’ activities on the banking and insurance industries or the IT sector. We also did not find any studies looking at the direct and indirect effects of re-exports on the national economy and the local multiplier effect. At the same time,
Domański and Gwosdz (
2010) note that the application of the multiplier effect in the local and regional economy cannot be overestimated, as it can help us to understand the growth mechanisms underlying the local and regional economy, as well as the effectiveness of regional economic policies.
Research by
Notten (
2015) notes that firm-level studies on re-exports are lacking. The lack of research on the impact of companies’ re-export activities on the economy is not due to a lack of interest in such research but to the lack of relevant data or the difficulty in obtaining the necessary information (
Jones et al. 2020). We believe that one of the constraining factors in research on the economics of re-exports may also be the lack of a calculation framework for economic effects based on primary data on companies’ re-export operations.
Given the aforementioned research gaps and the important role of re-exports in international trade and the economy, the aim of our study is to consider the impact of companies’ re-export activities on sectors of the economy and on the economy as a whole. Based on this, we consider the following issues in our study: first, the distribution of economic effects of companies’ re-export activities between the national economy and foreign economies; second, the distribution of economic effects of re-export companies among sectors and industries of the national economy; and, third, direct and indirect effects of companies’ re-export activities on the national economy, which also gave us the opportunity to determine the local multiplier effect.
In the process of preparing the study, we found that there are not enough official statistics to answer the research questions, nor is there enough data reflected in the balance sheets and appendices to the balance sheets that companies submit to the state revenue service. We also did not find sufficient company data in such databases as Amadeus. This is explained by the fact that in balance sheets, appendices to balance sheets, and other official reports, companies are not required to indicate data on the distribution of company costs between re-export and non-re-export operations, between the national economy and foreign economies, and among sectors of the economy.
In the scientific literature, we could not find a calculation framework on the basis of which it would be possible to calculate the effects of a company’s re-export activities on the economy, the distribution of effects between the national economy and foreign economies, or the distribution of effects among sectors and industries of the economy. Therefore, an additional task of our study was to create a reasonable calculation framework for the effects of specific companies’ re-export activities on sectors and the economy, with the distribution of effects between the national economy and foreign economies.
Our study constitutes empirical research that fits into the issues of contemporary theories of international exchange, the theory of intermediation, the economics of foreign trade, the theory of the local multiplier, and the theory of economic growth.
Our contribution is that we have shown, in a specific example, the mechanism of how an intermediary wholesale company, most of whose operations comprise re-export, affects industries, sectors, and the economy as a whole. We have identified the main factors that determine the level of influence of a re-export company on sectors and the economy, as well as the distribution of effects between the national economy and foreign economies. We also segmented the costs of the re-export company between the national economy and foreign economies and among sectors and industries. In addition, we substantiated a calculation framework, on the basis of which it is possible to make calculations to assess the impact of re-export companies on sectors, industries, and the economy as a whole.
The data we obtained allowed us to calculate the magnitude of the direct and indirect effects of the company’s re-export activity, which ultimately gave us the opportunity to test the local multiplier for re-export activity for the first time. The calculation framework of economic effects we developed and the results we obtained could provide an example and starting point for subsequent studies on the impact of re-exports on sectors and on the economy at the company level. They could also serve as a guideline for policymakers, stakeholders, and other interested organizations and individuals when calculating the economic effects of re-export companies and resellers on sectors and the economy.
The article is structured as follows. In the
Section 2, we review the relevant literature. In the
Section 3, we present the research methodology and data. In the
Section 4, we examine the distribution of the economic effects of the re-export company’s activities between the national economy and foreign economies. In the
Section 5, the issues of distribution of the economic effects of the re-export company’s activities among sectors and industries of the national economy are considered, and in the
Section 6, we look at the direct and indirect effects of re-exports on the national economy and the local multiplier effect. This is followed by a section on conclusions and suggestions for future research.
3. Methodology
3.1. Rationale for the Choice of Method and Number of Study Samples
To answer the research questions, there is not enough data from official statistics, nor enough data reflected in the balance sheets and appendices to the balance sheets that companies submit to the state revenue service, nor enough company data in such databases as Amadeus. This is explained by the fact that in balance sheets, appendices to the balance sheets, and other official reports, companies are not required to indicate data on the distribution of company costs between re-export and non-re-export operations, between the national economy and foreign economies, and among sectors of the economy.
Given the lack of necessary data in databases, answering the research questions required access to companies’ primary documentation, including data on companies’ re-export transactions; grouping primary data on companies’ expenditures on re-export activities by type of cost; and segregation of costs by sector and industry and between the domestic market and foreign contracting companies. However, official statistics do not have data of this level of detail. In addition, for a more correct interpretation of the structure and magnitude of the economic effects of the company’s re-export activities, we needed to compare the results of the analysis with the business model implemented by the companies, as well as to obtain an interpretation of the results of the analysis of primary documentation by top managers of the companies in question. For these reasons, to answer the research questions, we could not use other methods based on the processing of data from official statistics on a wider array of companies.
We also rejected the online questionnaire method for a number of reasons. Firstly, the research questions require researchers’ access to sensitive or confidential information. This aspect could objectively cause the reluctance of the vast majority of respondents to fill out a survey questionnaire, even with the guarantee of confidentiality. Secondly, sampling and structuring the information we need is possible only if a company’s level of digitalization is high enough, and it requires a significant investment of time by company employees. Thirdly, there are different business models for re-export activities. Therefore, upon receipt of the survey responses, it would be necessary to identify and classify the business model for each company’s re-export activities. However, this would not be possible based on the questionnaire alone. Furthermore, we have not found a classification of business models for re-export activities and typologies of re-export companies in the literature, and accordingly, it would be difficult to produce scientifically based harmonization on the results in the context of the company types and business models pursued by companies. Fourthly, in the case of receiving, say, several dozen completed survey questionnaires, it would be practically impossible to verify the quality of primary data selection as well as the accuracy and reliability of company calculations. This is because, when applying case studies, researchers need to have confidence in the accuracy, conceptuality, and validity of the variables (
Seawright and Gerring 2008).
Based on the above, we decided that case study research would be the most appropriate method for answering our research questions.
We decided to limit the number of cases considered in the study to one case for the following reasons. Firstly, the issues facing our study were not previously examined in the scientific literature, so we considered it important to analyse one specific case as thoroughly as possible. Secondly, for the first study of the impact of a re-export company on sectors and on the national economy, we considered it important to create a calculation framework, ensure the accuracy of the data obtained, define a more correct methodology and research methods, and obtain a more detailed interpretation by the top managers of the company. The number of study samples could be increased in subsequent studies.
3.2. Determining the Criteria for Selecting a Sample for Case Study Research
Since our study focuses on the case of one company, in selecting this company, we took into account that it should meet the criteria most typical for re-export companies. The literature indicates that most re-exports are conducted by wholesale trading companies (
Notten 2015;
Statistics Netherlands 2016) and that most re-export activity is conducted by small companies (
Notten 2015). The results of our unpublished research and the interviews carried out as part of this study also suggest that re-exports are predominantly conducted by SMEs whose primary focus is wholesale trade. Data from
Notten (
2015) reports on re-export statistics from a number of countries, such as Estonia, Lithuania, Finland, and Poland, and data obtained from our surveys show that electronics, household appliances, and computer components are among the most common product groups for re-exports.
To ensure that the research sample is not a random phenomenon, in addition to the abovementioned company characteristics, we put forward the following criteria when selecting the research sample. First, the share of re-exports should exceed 50% of the company’s net turnover. (According to the recommendations of
Beņkovskis et al. (
2016), re-export companies are companies where re-exports account for at least 25% of net turnover). Second, the company must be more than three years old. This criterion is due to the fact that most young companies cease to exist within a few years, so the results obtained may be uncharacteristic or random. Third, we did not consider micro-companies in our case study selection for the following reasons: micro-companies are less transparent, and in cases where micro-company strategies are focused on development, it is very likely that the micro-company should be moved into the category of small companies. Fourth, we wanted to consider a case in which the company’s business model aims to create higher added value, rather than one of the simpler business models that are more typical for micro-companies. Fifth, a company’s re-export activities should not be based on optimizing customs duties and reducing CIT, as evidenced by the studies we mentioned in the literature review. Sixth, the company must have been operating at a profit in at least two of the last three years (2019, 2020, and 2022). This criterion goes a long way toward characterizing the sustainability and efficiency of the company’s business model, especially since 2020 and 2021 were challenging years in the context of the COVID-19 pandemic. Seventh, management should have agreed to provide not only official accounting and statistical reports, but also internal reporting and other necessary information, some of which is sensitive or confidential information. We also needed to ensure that the necessary information was grouped according to the structure required for the study and that all key managers of the company were interviewed, which was necessary for a qualitative interpretation of the results obtained.
Therefore, when selecting a sample for case study research, we chose a company that specializes in the wholesale of television, audio and home appliances, and computer components and that falls into the category of SMEs and meets the criteria listed above.
3.3. Company Information and Classification Parameters of the Re-Export Company
To better understand the context of the case study research, in this subsection we will present some characteristics of the company considered in the study.
The company was founded more than 20 years ago and has been re-exporting for about 10 years. The company is engaged in the wholesale trade of computer components, electronics, and household appliances. Re-export was initially an auxiliary business and later became the main line of business and the main source of the company’s income and profit.
The company is located in one of the EU countries included in the OECD. According to the
OECD (
2022), the country of residence of the firm is among the countries where the level of taxing wages is significantly higher than the average among OECD countries. According to the EU classification, the company is medium-sized (
European Commission 2016). However, the net turnover indicator of the company is several times higher than the upper threshold value of net turnover of medium-sized companies. The volume of re-exports in each of the last three years significantly exceeded EUR 100 million, and the share of re-exports in net turnover exceeds 80%. The company’s assets amount to about EUR 20 million, and its equity capital is about EUR 10 million.
Since its founding, the company has not changed its country of residence and has not used offshore schemes, branches, or subsidiaries for tax optimization or reduction in customs duties. The company is private and is owned by several residents of the country in which it is registered. All co-owners work for the company. The company has about 70 full-time employees, of whom 44 are fully employed in re-exports. In 2021, the average gross salary of the re-export employees was EUR 4563 per month. This is substantially higher than the average gross wage in the company’s country of residence.
The company buys and sells in more than 60 countries on all continents (except Antarctica). The main sales market is the EU, but the share of sales in other continents is gradually increasing. In 2021, the company had sales in seven countries of the former USSR, but the share of these sales did not exceed 10% of total sales.
The distribution of effects among sectors of the economy and between the national economy and foreign economies largely depends on the type of re-export company. Therefore, in order to more correctly interpret the results of the study and be able to compare them with the results of future studies, we will determine how the re-export company considered in our case can be classified. Since there are no studies of types of re-export companies in the scientific literature, we will be guided by the classification of types of re-export companies of our as yet unpublished study. This classification includes the following main parameters: (1) Company size—micro, small, medium, or large. (2) Whether the company has non-re-export activities; the share of re-export in the company’s net turnover (25–50%, 50–75%, 75–95%, more than 95%). (3) Description of the main elements of the strategy for re-export activities and the business model of re-export activities. (4) The competitiveness of the market, the intensity of re-export operations, and the specifics of the re-exported goods.
In accordance with the above parameters, the company considered in our study can be classified as follows. It is a medium-sized company that is a distributor of about ten leading brands in several countries in its region, as well as a private label wholesaler in the local and regional markets, that is, it is not only engaged in re-export activities. The share of re-exports in the net turnover of the company is in the category of 75–95%. The strategy for the company’s re-export activity is aimed at a wide presence in many countries in all regions of the world (the company has about 200 suppliers and about 300 companies that buy goods). The strategy for the company’s re-export activities provides for a moderate level of commercial risks, a low level of regulatory risks, and the absence of branches and subsidiaries; that is, it is an organic growth strategy. It also provides for the processing of all imported goods for subsequent re-export in a warehouse in the company’s country of residence. The strategy and business model of the company’s re-export activity are aimed at obtaining high added value by providing customers with a wide range of basic and additional services. The company operates in highly competitive markets and competes both with official regional distributors and with other wholesale intermediaries, including re-export companies, which also have access to these types of goods to some extent. The re-export company has a high intensity of re-export operations: 30–50 shipments to different companies per day.
3.4. Research Methods
The main research method was a case study. We also used the following research methods.
First, this is an analysis of internal reports and working documents of the company. To obtain the data necessary for analysis, the company’s employees, according to the algorithm we developed, selected data by category of transactions and payments. Based on the samples obtained, we made calculations of the cost structure by cost type and other calculations necessary for our study. Sampling and calculations were performed separately for each of the following types of costs: transportation; insurance; banks; warehousing, including utilities and security services; IT expenses; office rent and utility costs; professional services (lawyers, financial and tax advisors, recruitment services, auditors); natural resource tax and utilization; fuel and car fleet maintenance; representation and advertising costs; customs duties; subscription fees; office supplies; customs clearance; communication costs; commission fees; personnel training costs; labour costs; labour taxes; mandatory social security contributions; and other types of taxes. During sampling, all types of costs were divided into costs paid in the company’s country of residence and outside it.
Second, we conducted nine in-depth interviews with company management. We interviewed the CEO, CFO, Development Director, International Sales Director, Import Director, Transportation Logistics Manager, Warehouse Logistics Manager, IT Manager, and Chief Accountant. We held several meetings with the CEO, CFO, Development Director, and International Sales Director to clarify preliminary calculations and interpret the results. As a result of the extended interviews, we received data on the goals, strategy, and business model for the company’s re-export activities and the reasons for choosing and changing the company’s strategy and the business model of the company’s re-export activities. We also received information about other possible options for the strategy of wholesale re-export companies, business models for re-export activities, and an interpretation of data obtained as a result of the analysis. Conducting the abovementioned extended interviews gave us the opportunity to obtain the necessary detailed information as recommended by
Seawright and Gerring (
2008) and to interpret the results more accurately.
We also had a discussion with the company’s external auditor about the reliability of the data reflected in the balance sheet and the calculation of the firm’s profits and losses. It should be noted that for the last 8 years, the company has been audited by an international auditing company operating in more than 150 countries.
Third, we conducted in-depth interviews with the CEOs/co-owners of five companies that engage in re-export activities. These companies are located in three different EU countries. Each of the participants in the in-depth interviews has at least 10 years of experience in re-export companies. Two of these companies are medium-sized companies, two are small companies, and one is a micro-company according to the EU classification. Note that four of the five CEOs/co-owners of these companies are involved in re-export sales of the same product groups as the company examined in our study. For all of these companies, re-export activity is the main type of business, and for two of these companies, it is the only kind of business.
Conducting extended interviews with the CEOs/co-owners of the five aforementioned companies allowed us to delve deeper and comprehensively consider the types of strategies and business models of re-export companies, the types of re-export companies, and the factors that affect the distribution of economic effects of re-export companies among sectors and between the national economy and foreign economies. The use of this additional research method allowed us to make a more accurate interpretation of the findings.
3.5. Guarantees of Confidentiality
In order to obtain detailed data on the performance of re-export companies, we provided confidentiality guarantees to company management and participants in the extended interviews. The provision of confidentiality guarantees was necessary because the strategy, business model, and a number of other data required for this study are sensitive or confidential information.
The confidentiality guarantees included stipulations not to mention the name of the companies, the country of residence, and other parameters by which the companies could be identified.
We have followed the guidelines and rules set forth in the Ethical Principles for the European Economist, recommended by the
European Economic Association (
2022), in providing assurances of confidentiality.
3.6. Data
Data on the volume of re-exports, the types of costs for contractor services, and the distribution of costs for contractor services between foreign and domestic companies, as well as other necessary data, were extracted from the company’s internal statements, from which the balance sheet and profit and loss statement for 2021 were compiled.
In accordance with the rules of accounting, when importing goods, one part of the companies’ costs is reflected in the section “Cost of production of products sold, cost of purchasing goods sold or services provided”. These are expenses for storage of imported goods in intermediate warehouses before delivery of the goods to the importing company’s warehouse, transportation costs for delivery of goods to the importing company’s warehouse, and expenses for payment of customs fees and duties and payment for customs brokerage services.
The second part of the costs is reflected in the subsections of the “Gross Profit” section. These are the costs of sales, administrative expenses, other business expenses, and interest payments. Therefore, when extracting the data necessary for the calculations, we extracted both the data related to the section “Cost of production of products sold, cost of purchasing goods sold or services provided” and the data related to the cost of sales, cost of administration, other costs of economic activity and interest payments and similar costs from the company’s internal reporting. The inclusion of the “Cost of production of products sold, cost of purchasing goods sold or services provided” group in the cost analysis is an important aspect of the calculation framework since the costs reflected in this balance sheet item accounted for 17.2% of the total amount of services paid to contractors. The calculation framework we used allowed us to correctly calculate the cost structure by type of service, the ratio of costs between payments to foreign and domestic market contractors, and the value of the secondary effects of the firm’s re-export activities.
It was necessary to check for possible deviations in the data we obtained for 2021 on the share of re-exports in the company’s net turnover and the cost structure for providing re-export activity compared to previous time periods. Therefore, we compared the data we obtained with the data for 2019, 2020, and the first 9 months of 2022. We did not find any significant deviations, which indicates that the data for 2021 presented in the study are quite typical for the company.
3.7. Methods for Calculating the Direct and Secondary Effects of Re-Exports on the National Economy and the Local Multiplier Effect
There are several methods for calculating direct and indirect (secondary) economic effects and the principles that must be followed in calculating these data (
Weisbrod and Weisbrod 1997).
To calculate the local multiplier effect, we chose the method of comparing costs that create direct and indirect effects on the economy. We chose this method because we had access to all of the re-export company’s costs and the ability to group these costs into the cost groups we needed. With the aforementioned data, the cost comparison method ensures more accurate as well as more comparable results.
The direct effects calculations included the costs of paying income tax, social security contributions, value-added tax (VAT), and corporate income tax (CIT) for 2021.
Based on the recommendations of
Weisbrod and Weisbrod (
1997), the calculation of the company’s direct economic effects through re-export activities did not take into account the profit received by the company from re-export activities.
The calculation of the secondary effects of the company’s re-export activities on the national economy was made according to the total amount that the company paid to domestic market contractors for the services necessary to support the re-export activity.
The local multiplier effect was calculated as the ratio of the sum of the company’s costs for the services of domestic market contractors (ensuring the company’s re-export activities) to the value of the primary effects of the company’s re-export activities on the national economy.
5. Distribution of the Economic Effects of the Re-Export Company’s Activities among Sectors and Industries of the National Economy
In this section, we will look at the cost structure of a re-export company to pay for the services of external contractors by sectors and industries of the national economy. The reviewed studies have shown that transportation and logistics costs are the most important factor affecting re-export intensity (
Rettab and Azzam 2008). However, we did not find studies that addressed the segmentation of outsourced services that are necessary for re-export operations. Yet this is an important and relevant issue, as it characterizes the impact of re-exports on sectors and industries of the national economy.
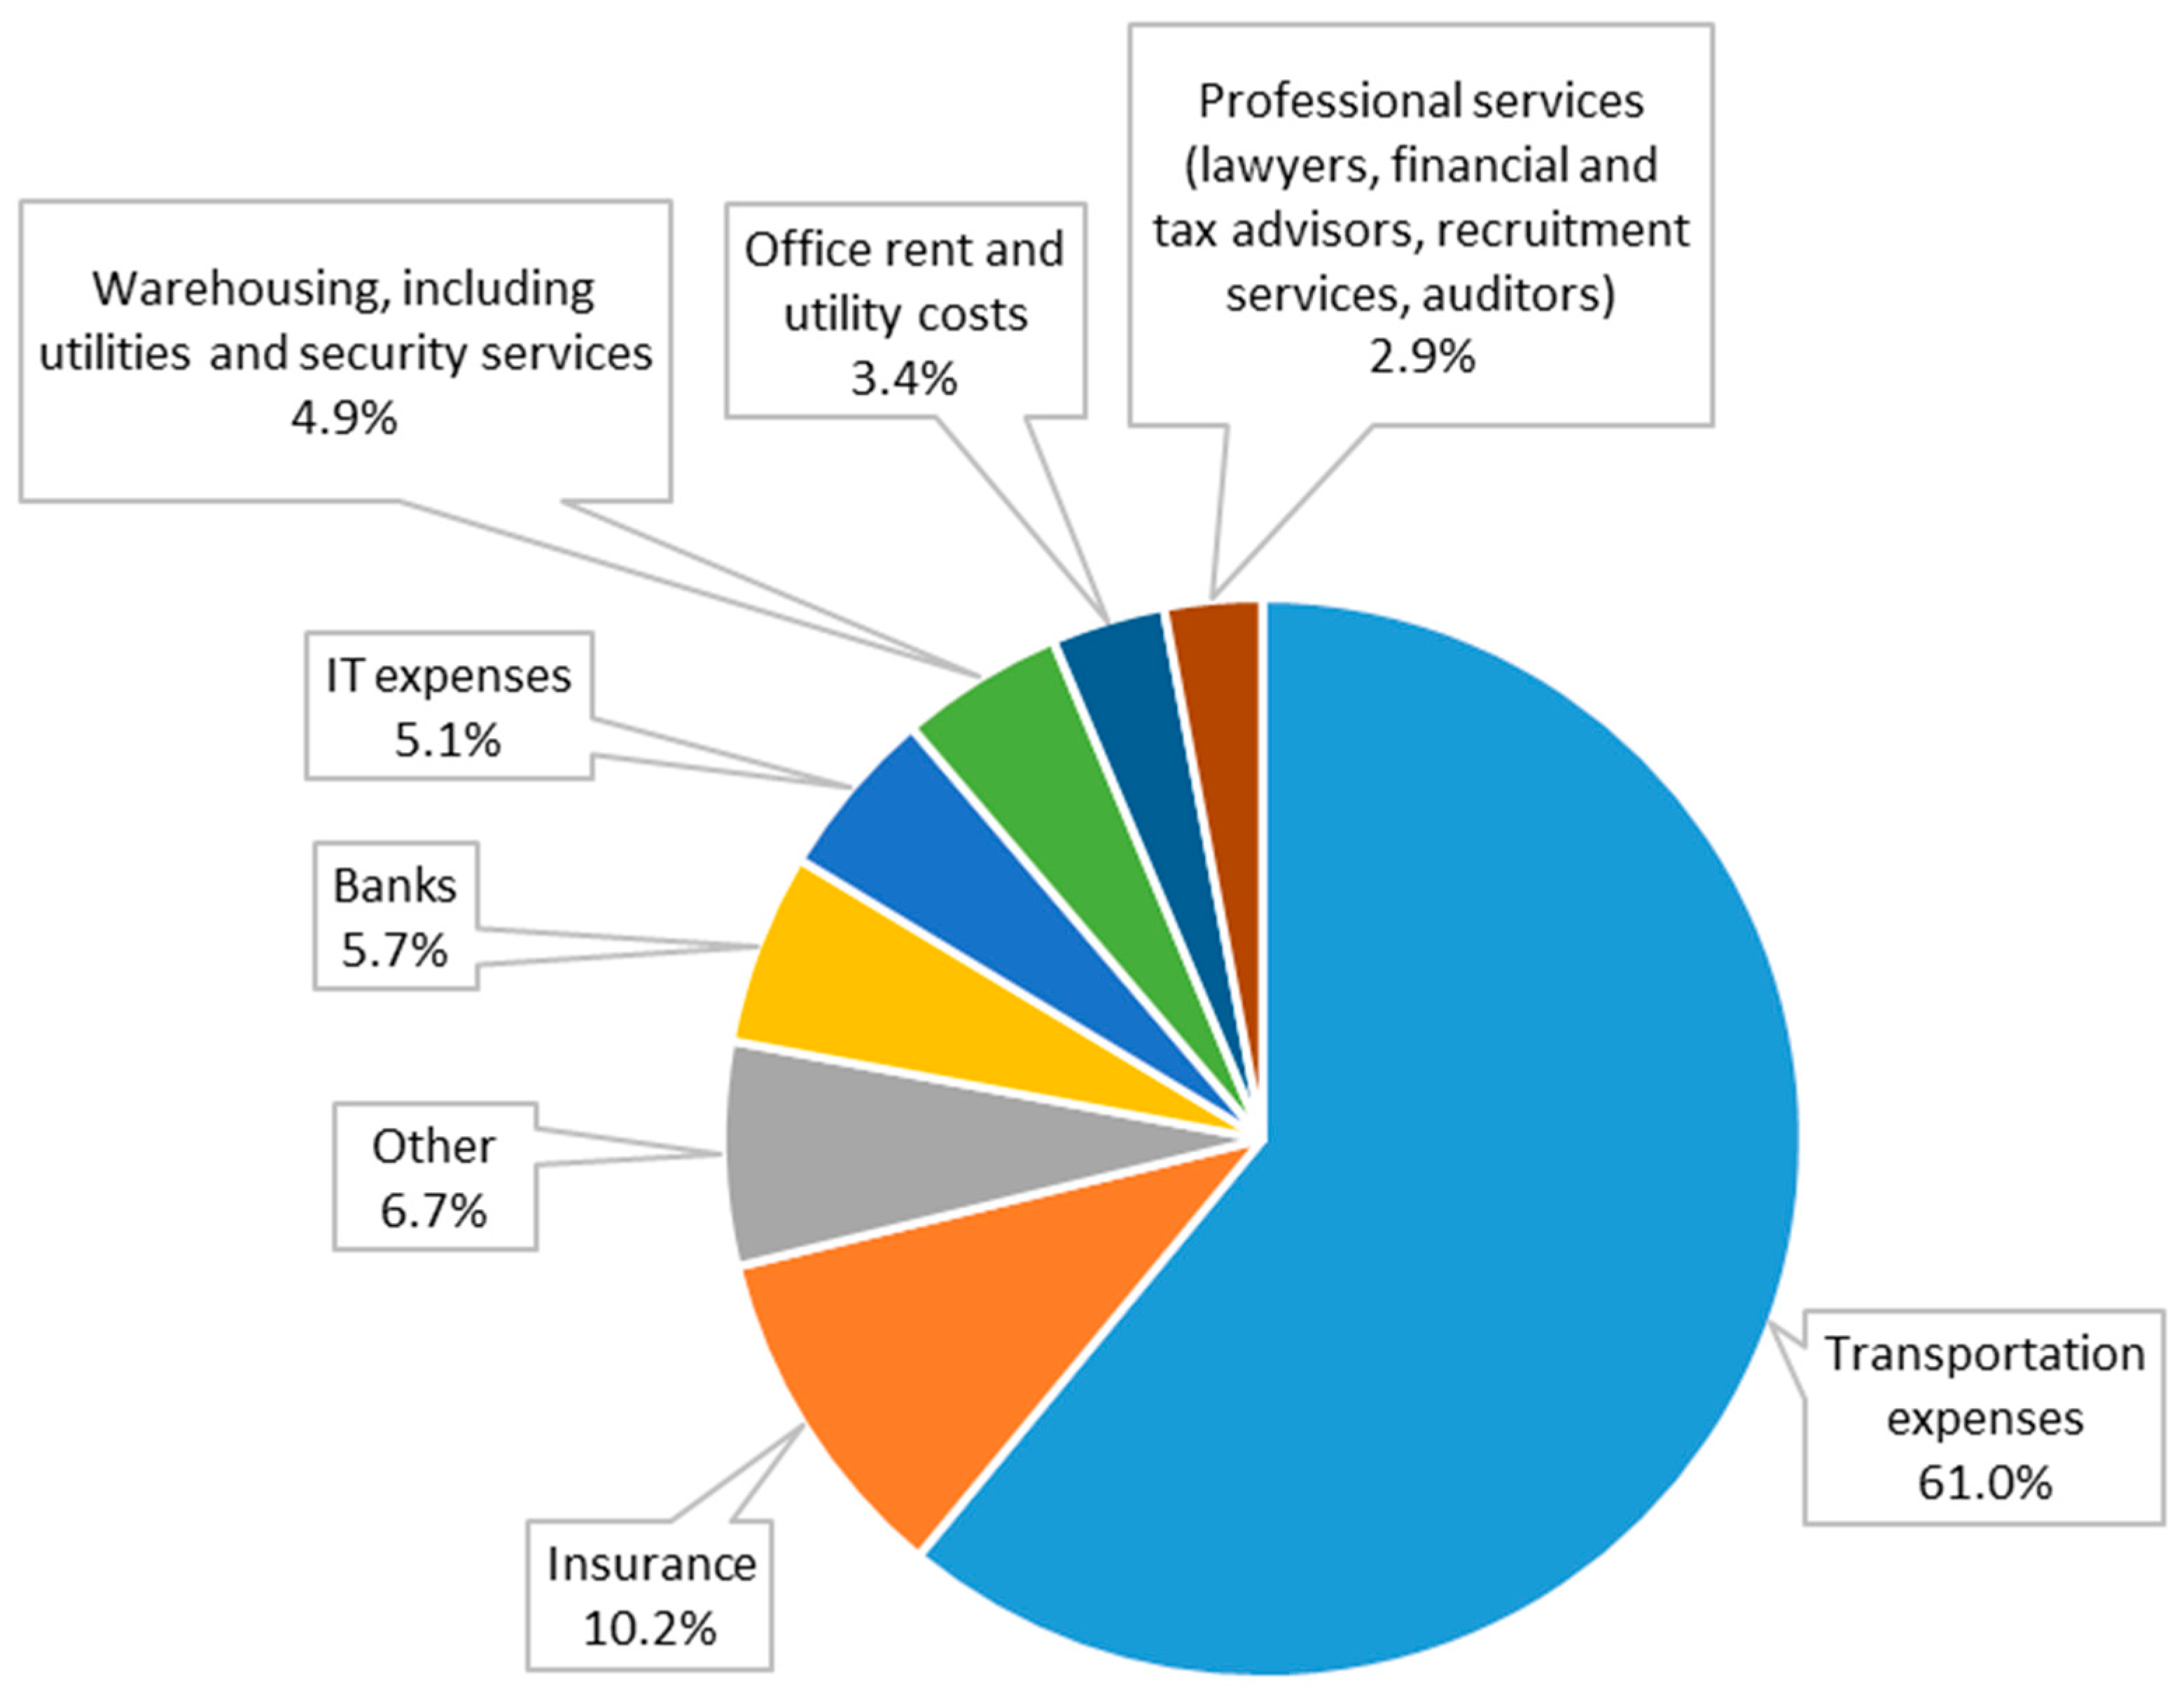
Figure 1 shows the segmentation of the re-export company’s main types of costs for services from domestic market contractors. A detailed structure of the re-export company’s costs for services from domestic market contractors, with a division into the domestic market and foreign contractors, is presented in
Appendix A Table A1.
Our analysis shows that the largest share of payments to domestic market contractors (61.0%) consists of transportation expenses. Such a high share of transportation costs can be explained by the peculiarities of the business model used by the re-export company, namely, selling goods in smaller batches than purchases, as well as sending a significant number of shipments by express delivery, which is more expensive. Even if re-exports were to be shipped in the same quantity as imports and not at express delivery prices, the share of transportation costs would still exceed 30% of the total share of domestic market contractors’ services. Our findings that transportation services account for the largest share of re-export company costs correlate with those of
Rettab and Azzam (
2008). We also calculated that transportation costs account for more than 25% of the company’s revenues from re-export activities and are the second-largest expense item, not much less than the company’s labour costs (including taxes and compulsory social security contributions).
Given the data obtained on the value of the re-export company’s costs for transport, it is understandable that companies want, if possible (depending on the business model), to locate warehouses in countries that are the shortest distance from suppliers and end buyers.
The second-largest share of services paid to domestic market contractors is insurance (10.2%). It seems surprising that this, not warehouse logistics or bank payments, should comprise the second-largest share.
Therefore, let’s take a closer look at the reasons for the high share of insurance in payments to domestic market contractors. Two types of insurance account for about 95% of the re-export company’s payments for insurance services. Payments for insurance of goods in transit and in warehouses constitute about 65% of payments for insurance services. The company insures goods imported for re-export purposes and re-exported goods from the time of purchase to the time of receipt of goods by the purchaser, as well as the goods that are in the company’s warehouses. Insurance of all types of goods during transportation and in warehouses is due to the high price of goods at a relatively low weight and volume. The price of, for example, computer components placed on a single pallet is usually several tens of thousands of euros or more, whereas the price of a truck of televisions may be EUR 200 thousand. Accordingly, such parameters, as well as the fact that these are widely distributed goods with fairly high liquidity, make them susceptible to theft and various types of fraud that occur regularly. Respondents of the study indicated that they are aware of a number of thefts in the millions and even tens of millions, even from warehouses, and thefts in the shipping process are fairly regular. For example, the company in the case study once received reimbursement from an insurance company for the theft of goods from an intermediate warehouse in another country in excess of EUR one million.
In addition, the firm insures the risks of prepayment for goods when purchasing them, the risks of accounts receivable when granting deferred payment, and a number of other risks. The share of this type of insurance in all insurance expenses is about 30%. A re-export company uses this type of insurance for several reasons. Firstly, to cover losses in case of non-delivery of cargo or non-payment of accounts receivable. In 2021, the insurance company paid out about EUR 150 thousand to the re-export company as a result of the insolvency of one of the buyers. Secondly, prepayment and receivables insurance broadens the range of suppliers and buyers and makes the level of services provided by the firm better and more comprehensive. Improving the quality and breadth of services comes from prepayment to suppliers or post-payment to buyers. Such forms of payment have a positive effect in terms of both adding value and enhancing the competitiveness of the re-export company as a result of expanding the circle of customers and increasing the level of customer loyalty.
Respondents note that if the goods the company re-exports are not susceptible to theft, if suppliers receive payment after delivery, and if buyers do not receive deferred payment, the share of insurance costs in the re-export company’s total costs may be very small. The same is true if the re-export company does not insure, or does not insure in full, the above risks. In such cases, insurance costs may comprise less than 1% of contractors’ services. Respondents point out that a high share of a re-export company’s insurance costs is compensated to some extent by lower-than-standard bank lending rates and/or higher limits of crediting provided by banks. This can be explained by the fact that by reducing the risk of potential losses, the company also reduces the bank’s risk of not being able to repay its loans.
The third-largest share of services from domestic market contractors paid for by the re-export company comprises banking services (5.7%). Such a significant share of financial services is justified by the peculiarities of the business model implemented by the re-export company. Firstly, there is a need to maintain a large volume of goods in stock. Secondly, the company has to make prepayments for goods purchases and provide deferred payment to buyers. Both the first and the second require additional financial resources, in this case bank credit and, accordingly, the cost of paying overdraft fees for appropriation and for used and unused credit limits. Secondly, for the convenience of customers, purchase and sales transactions are made in several types of currencies. This requires regular conversion, for which bank fees are paid. Thirdly, due to the large number of bank payments, including urgent payments, a significant part of the funds paid to banks constitutes transaction fees.
Respondents note that many re-export companies could have a much smaller share of banking services in the following cases. First, a smaller number of suppliers and buyers. Second, a lower intensity of re-export operations. Third, fewer comprehensive services are provided to counterparties; namely, not providing prepayments to suppliers or deferrals to buyers, or less inventory (both in quantity and assortment), which in turn would reduce overdraft service costs. It follows that the amount of costs incurred by re-export companies for bank services largely depends on the business model for re-export activities.
The fourth-largest share of the re-export company’s costs paid to external contractors is IT expenses (5.1%). The value of costs for IT services is almost the same as for services of the banking sector and services related to the rent and maintenance of warehouses. The costs for IT services could be higher because some of the developments in the field of automation and digitalization of processes are carried out by employees who are on the staff of the company. Although the firm has a fairly high level of process automation and digitalization, developments in this area continue in order to improve the quality of work with clients and increase the efficiency of other processes. A significant part of these costs is directed toward the improvement of various aspects of cybersecurity. The results of extended interviews with the company’s top managers indicate that despite a fairly high level of process digitalization, the share of IT costs will not decrease in the coming years.
The fifth-largest share of costs is related to warehousing, including utilities and security services (4.9%). Based on a review of relevant literature, such as
Rettab and Azzam (
2008);
Gehlhar (
2010); and
Zorgenfreija and Bērziņa (
2015), it could be assumed that warehousing and warehouse logistics services should be the second-largest beneficiary of a company’s re-export activities. This would probably be the case, if not for several factors explained by the peculiarities of the business model for the company’s re-export activities in the case study. (We reviewed these factors in detail in
Section 4.1.2). If the re-export company did not rent a warehouse and did not organize storage logistics using its own employees, services for warehouse logistics, depending on seasonality and the market situation, would make up for 12% to 24% of external contractors’ services each month. Accordingly, the services of the warehouse (warehouse logistics) would be the second-largest cost. In the case study of the re-export company we examined, warehouse logistics services include only warehouse rent and operation costs, which amount to 5.4% of the re-export company’s costs for the services of domestic market contractors, since operations at the rented warehouse are performed by employees of the re-export company.
Since the firm’s re-export processes are supported by 44 employees, 31 of whom are office workers, the sixth-largest share of costs paid to external contractors comprises costs associated with office rent and utilities (3.4%). These costs could be lower, but the company has been paying quite a bit more attention to ESG issues, including the working conditions of employees. For example, the office area per employee is about 14 m2, and right in the office, the company has both its own cafe and a small gym with a full set of equipment.
The last, seventh significant share of costs paid to external contractors comprises professional services (2.9%). This includes such services as checking the level of counterparties’ solvency in order to make decisions on the possibility of granting deferred payments, paying for the development of such documents as customer identification procedures (KYC), tax and legal advice, personnel recruitment services, and a number of other professional services. The firm’s top management believes that the amount paid for professional services is quite justified, as in addition to other benefits, it significantly reduces financial and reputational risks, in the event of which the direct and indirect costs would be incommensurably greater.
As a result of the above analysis of the structure and value of the re-export company’s costs for the services of external contractors, we can draw the following conclusions.
Firstly, the strategy and business model for a company’s re-export activities is the main factor that influences the size and proportion of the economic effects of the company’s re-export activities among sectors and industries of the economy.
Secondly, if a re-export company employs a strategy and business model that provides for a significant volume and high intensity of re-export operations and a sufficiently comprehensive level of services for its suppliers and buyers, the main beneficiaries of re-exports among sectors and industries are transport, insurance, banks, warehouse logistics, and IT.
Thirdly, the structure and values of the costs paid to contractors by the re-export company considered in the case study indicate that the company is implementing a strategy and business models that provide a higher level of added value, increased competitiveness, reduced risks and, consequently, the long-term sustainability of the company.
Fourthly, the cost structure of re-export companies may change significantly, for example, if a company implements simpler strategies and business models for re-export activities. That is, they do not create significant added value and/or do not have a high intensity of operations. In such cases, transportation costs may occupy a much smaller share in the re-export company’s cost structure, especially when the goods are not imported into the re-export company’s country of residence and/or, for example, the amount of shipments is quite large and the shipments are infrequent.
6. Direct and Indirect Effects of Re-Exports on the National Economy and the Local Multiplier Effect
6.1. Impact of Direct Effects of the Re-Export Company on the National Economy
The magnitude of the impact of the direct effects of the re-export company’s activities on the national economy depends on the company’s labour costs (including income tax and compulsory social security contributions) and the amount of other taxes paid.
We calculated the labour costs of resident employees who ensure re-export operations for the company in our study. In 2021, these costs amounted to EUR 1899 thousand (including personal income taxes and mandatory social security contributions). It should be noted that labour costs of domestic employees (including taxes and mandatory social security contributions) in 2021 amounted to 30% of the company’s costs for re-export operations, or 19.9% of the company’s income from re-export operations.
Payment of other types of taxes to the budget (CIT and VAT) amounted to EUR 233 thousand. (In this figure, we did not take into account such taxes and payments to the state or municipal budget as, for example, the natural resource tax and utilization, which amounted to EUR 58 thousand, but which should hardly be attributed to direct economic effects).
As a result, the direct economic effect of the re-export activities of the company considered in the case study was EUR 2132 thousand in 2021.
Based on our analysis and the survey responses, we can conclude that the magnitude of the direct effects of re-export companies’ activities on the national economy mainly depends on the following factors.
First, the strategy and business model for re-export activities implemented by the company. The more the strategy and business model of a re-export company are aimed at increasing added value and expanding the volume of re-export activities, the greater the value of the direct effects that a re-export company has on the national economy. This conclusion is based on the fact that in order to increase the value added, the re-export company must increase the range and depth of basic and additional services provided, and, as shown in the case under consideration, increasing the depth of basic services is almost impossible without increasing the number of company employees in the country of residence. An increase in the volume of re-export activities, albeit not proportionally (due to the scale effect), also requires an increase in the number of employees of the re-export company. In both the first and second cases, the wage fund, taxes related to wages, and compulsory social insurance contributions increase, and with the growth of the company’s sales and profitable activities, other tax payments also increase, for example, CIT. It should be noted that the listed types of costs of the company form the direct effects of the influence of companies on the economy.
Second, the number and skill level of resident workers and the ratio between the amount of spending on local workers and foreign workers/non-residents who are paid a salary, and pay taxes in, their country of residence.
Third, it depends on the tax policy of the re-export company. This includes the countries in which the company pays CIT when it has permanent establishments and, in the case of multinational enterprises, the country in which it has its profit centre.
Based on the above factors, we can draw one more conclusion regarding the impact of the re-export company’s direct effects on the national economy.
The magnitude of the direct economic effects on the national economy depends mainly on internal rather than external factors. However, it seems obvious—and this was also noted by the survey respondents—that the abovementioned internal factors are in many cases influenced by external factors, such as the availability of infrastructure necessary for re-exports in the country of residence, the price of labour, tax policy in the country of residence, and a number of other external factors.
6.2. Impact of Indirect or Secondary Effects of the Re-Export Company on the National Economy
In order to determine the value of indirect or secondary effects of re-export activities on the national economy, we determined the value of expenses that the re-export company paid to domestic market contractors for services (
Appendix A Table A1). The amounts paid to domestic market contractors or the value of indirect effects of the company’s re-export activities in 2021 was EUR 3698 thousand.
We also calculated that payments to domestic contractors accounted for 58.5% of the re-export company’s total costs, representing 38.7% of the company’s revenues from re-export activities.
Based on our analysis and on the survey responses, we can draw the following conclusions.
Although the services of domestic market contractors account for 96.7%, the absolute value of the re-export company’s indirect effects on the national economy may vary as a result of the following factors.
Firstly, an increase (or decrease) in the volume and/or intensity of re-export operations, as well as an increase in the range of services provided to customers while maintaining the cost structure between domestic market contractors and contractor companies that are not residents and/or between operations performed by company employees and operations performed by domestic market contractors.
Secondly, it depends on whether the re-export company performs warehouse logistics operations independently or using a contracting company and, if a contracting company is used for warehouse logistics, on whether the company is a resident of the country where the re-export company is a resident. If the warehouse is not located in the re-export company’s country of residence, it is highly likely that the value of the re-export company’s indirect effects on the national economy will also decrease. The decrease in the magnitude of the re-export company’s secondary (indirect) effects on the national economy will also occur as a result of the fact that the re-export company, for certain reasons, will choose non-domestic market contractors for other types of services, such as insurance and banking services (or payment systems).
Based on the above, we can conclude that the value of a re-export company’s indirect or secondary effects on the national economy may be influenced by both internal and external factors. Internal factors that can influence the value of a re-export company’s secondary (indirect) effects may include the development strategy for re-export activities, the business model for re-export activities, or, for example, the re-export company’s ability to attract additional financial resources to increase the volume and/or intensity of re-export operations or broaden services provided to clients, or a number of other less significant factors.
The following are examples of external factors that can have a negative impact on the amount of a re-export company’s secondary economic effects: introduction of regulations that have a negative impact on re-export activities, including the introduction of economic sanctions that restrict sales to a certain range of customers; a decrease in the competitiveness of infrastructure services in the country of residence; increased tax rates; and a number of other factors.
It follows from the above that the magnitude of the re-export company’s secondary (indirect) effects on the national economy may be a rather variable value, which depends on both internal and external factors.
6.3. Local Multiplier Effect
In the previous two subsections, we calculated the value of direct and indirect (secondary) effects of a company’s re-export activities on the national economy. This gives us an opportunity to calculate the local multiplier value.
To calculate the local multiplier value, we compared data on the re-export company’s costs for domestic market contractors with the company’s labour costs, including income tax and social security contributions, as well as CIT and VAT. The results of our calculation showed that the local multiplier value for re-export company activities was 1.73.
To check the validity of our results, let us compare our data with the results of previous studies on the local multiplier value for countries, regions, and industries. We obtained a lower local multiplier value than was determined in the study by
Weisbrod and Weisbrod (
1997). They find that the multiplier values for most industries are generally around 2.5–3.5 for national impact and 2.0–2.5 for state impact. However, in a more recent study.
Domański and Gwosdz (
2010) note that the real figure for a properly defined local multiplier value is usually between 1.20 and 1.50. They also note that regional multiplier values may be higher. Our definition of the local multiplier value (1.73) is almost in the middle between the values determined by the two abovementioned groups of researchers.
Based on our comparison of the three studies in which we measured the local multiplier value, we can draw two conclusions. First, our results on local multiplier values are quite accurate. Second, we obtained empirical confirmation of the local multiplier values determined by
Weisbrod and Weisbrod (
1997) and
Domański and Gwosdz (
2010).
However, we are more inclined to stick to the local multiplier values defined by
Domański and Gwosdz (
2010) or, as they mention, higher than these if the regional level is considered. In our opinion, the local multiplier value for the re-export industry as a whole can hardly be higher than 2.0. We justify our position with the following arguments.
The company considered in our case is likely to have a higher local multiplier value than the average in re-exports for several reasons. As we noted, the company has a high share of domestic market contracts (96.7%) which has an upward impact on the local multiplier value. On the other hand, the company has a relatively large number of employees who carry out re-export operations. This has a downward effect on our local multiplier value.
However, one study (
Notten 2015) notes that re-export is predominantly engaged by companies with a small number of employees. Accordingly, we can assume that the factor of the number of employees in most re-export companies will most likely have a neutral or increasing influence on the possible local multiplier value in the re-export industry. Of course, the local multiplier value will be strongly influenced by the factor of the presence of foreign workers who are not residents of the country where the re-export company is registered, as well as the use of outstaffing services by the re-export company. This means that the more non-resident employees in the company and/or the more outstaffing applied, the lower the numerator and the higher the denominator and, accordingly, the higher the value of the local multiplier.
In the previous subsections, we have shown that the magnitude of direct and indirect effects of re-exports on the economy depends on both internal and external factors, which, as we have shown, depend on different circumstances and causes. In addition,
Moretti (
2010) finds that the multiplier is likely to vary not only across industries but also across skill groups. Therefore, we believe a more accurate assessment of re-exports’ effects on the economy can be provided by the absolute values of indicators that generate primary and secondary effects of re-exports on the economy. The local multiplier value for the re-export industry could play the role of an approximate evaluation indicator. We believe that the most realistic local multiplier value for the re-export industry is 1.5, and the values for specific re-export companies will, in the overwhelming majority of cases, range from 1.2 to 2.0.
Furthermore, note that the calculation of both indirect effects and the local multiplier value require access to the primary documentation of re-export companies. This is because many companies engage in re-export activities along with other activities. For this reason, if statistics on re-exports are not mandatory in the company’s country of residence, it is not possible to obtain data on the value of contractors and, moreover, to separate them into domestic market contractors and contractors from other countries. Nor is it possible to obtain data on the number of employees engaged in re-export operations, either in the re-export company itself or in companies which are contractors. Even if a country has introduced mandatory statistics on re-exports, without analysis of a firm’s primary documents, it is impossible to segment by sector or industry. Therefore, the most accurate method of calculating the secondary effects of re-exports on the economy and the local multiplier value is field research of a certain array of re-export companies in a region/country, based on the assessment of payments made to domestic market contractors. Estimating the local multiplier value based on the number of employees at contractors would make such a method very expensive, time-consuming, and virtually impossible in the case of a significant number of research samples.
7. Conclusions
We conducted a study of the impact of re-export company activities on sectors and on the economy as a whole. Our study is probably the first study that has examined the impact of a specific re-export company on the national economy and foreign economies.
We found that the business model, as an element of a company’s re-export strategy, is the main factor that influences the distribution of economic effects of companies’ re-export activities between the national economy and foreign economies and among sectors and industries of the economy.
We also identified the most important factors that affect the distribution of economic effects of companies’ re-export activities between the national economy and foreign economies, as well as among sectors and industries.
In addition, we found that the magnitude of the direct economic effects of companies’ re-export activities on the national economy mainly depends on internal rather than external factors. However, at the same time, external factors influence internal factors in many cases. We also found that the magnitude of the indirect effects of a re-export company on the national economy can have quite a variable value, which depends on both internal and external factors.
Calculating the magnitude of direct and indirect effects allowed us to calculate the local multiplier value for the company’s re-export activities, which amounted to 1.73. Our results are the first attempt to determine the value of the local multiplier using the example of a specific re-export company and fit into the average values of the local multiplier calculated by
Weisbrod and Weisbrod (
1997) and
Domański and Gwosdz (
2010) for countries and economic sectors. Accordingly, we not only compared the correctness of our calculations but also, using a different research method, presented an empirical confirmation of the local multiplier values determined by
Weisbrod and Weisbrod (
1997) and
Domański and Gwosdz (
2010).
We also proposed a reasonable calculation framework for the effects of re-export activities of specific companies on sectors and the economy with the distribution of effects between the national economy and foreign economies.
Let us make a few more conclusions from the results of our study.
The greatest effect on the national economy comes from resident re-export companies which meet the following criteria. Firstly, they predominantly use domestic market contractors. Secondly, they apply a strategy and business model of re-export activities, which create a higher level of added value through additional services. Thirdly, they consider re-exports as a long-term strategy, rather than a short-term benefit from reduced customs duties or tax optimization. The survey results indicate that medium-sized and large re-export companies for which re-exports are not the only type of business most often meet these criteria. Respondents also indicated that re-export companies meeting the above criteria, as a rule, have the long-term sustainability of the company as one of their goals. Therefore, as a rule, they do not apply aggressive types of tax optimization and assess reputation and other types of risks more deeply.
The conclusions of our study regarding the calculation of direct and indirect effects of re-export activities and, accordingly, the local multiplier value, were drawn based on data from only one re-export company. Although this company is fairly typical in terms of re-export activities, caution should be exercised when projecting the local multiplier value we obtained onto the entire re-export industry. However, this value (1.73) correlates well with local multiplier values for sectors, regions, and countries presented in the studies by
Weisbrod and Weisbrod (
1997) and
Domański and Gwosdz (
2010).


