Article

Managers’ Perception and Attitude toward Financial Risks Associated with SMEs: Analytic Hierarchy Process Approach

by
Mahmaod Alrawad
1,2,*,
Abdalwali Lutfi
3,4,*,
Mohammed Amin Almaiah
5,6,7,*,
Adi Alsyouf
8,
Akif Lutfi Al-Khasawneh
9,
Hussin Mostafa Arafa
1,10,
Nazar Ali Ahmed
1,11,
Ahmad M. AboAlkhair
1,12 and
Magdy Tork
3
1
Quantitative Method, College of Business Administration, King Faisal University, Al Ahsa 31982, Saudi Arabia
2
College of Business Administration and Economics, Al-Hussein Bin Talal University, Ma’an 71111, Jordan
3
Department of Accounting, College of Business, King Faisal University, Al-Ahsa 31982, Saudi Arabia
4
Applied Science Research Center, Applied Science Private University, Amman 11931, Jordan
5
Department of Computer Networks, College of Computer Sciences and Information Technology, King Faisal University, Al-Ahsa 31982, Saudi Arabia
6
Faculty of Information Technology, Applied Science Private University, Amman 11931, Jordan
7
Department of Computer Science, King Abdullah the II IT School, The University of Jordan, Amman 11942, Jordan
8
Department of Managing Health Services and Hospitals, Faculty of Business Rabigh, College of Business (COB), King Abdulaziz University, Jeddah 21991, Saudi Arabia
9
Financial and Administrative Sciences Department, AL-Balqa’ Applied University, Irbid University College, Irbid 1293, Jordan
10
Department of Statistics, Mathematics and Insurance Faculty of Commerce, Assiut University, Assiut 71515, Egypt
11
Insurance Department, Faculty of Commerce, Al-Neelain University, Khartoum 11121, Sudan
12
Department of Applied Statistics and Insurance, Mansoura University, Mansoura 35516, Egypt
*
Authors to whom correspondence should be addressed.
J. Risk Financial Manag. 2023, 16(2), 86; https://doi.org/10.3390/jrfm16020086
Submission received: 8 December 2022 / Revised: 27 January 2023 / Accepted: 29 January 2023 / Published: 1 February 2023

Abstract

:
This study aimed to identify financial and cash flow risks associated with SMEs and investigated how managers perceived these risks using the analytical hierarchical process (AHP). Accordingly, a three-level decision model was structured using two criteria, probability and consequences, and a list of six different types of risks as decision alternatives. Data were collected by a survey questionnaire from SME managers/owners and analyzed in accordance with the AHP method. The results show that the priority weight for risk criteria was 52% for probability and 48% for consequences. Further, with an average weight of 18.8%, the risk of an increase in bank charges ranked as the highest type of risk faced by SMEs. However, the risk of low or no profits was ranked as the lowest with an average weight of 13.4%. This study is one of the few, if not the first, to investigate SME managers’ perceptions using an AHP method and to provide insightful information on how SME managers/owners perceived various financial and cash flow risks. The study results may support the use of the AHP method in understanding managers’ perceptions and attitudes toward various types of risks associated with SMEs.

1. Introduction

Over the last two decades, academics and practitioners in the field of risk management have shown a growing interest in the adoption and implementation of risk management frameworks by organizations regardless of their types, size, structure, and ownership (Altanashat et al. 2019; Annamalah et al. 2018; Bohnert et al. 2017; Kommunuri et al. 2016). Much of the previous research into this area has established the fundamental role risk management plays in helping organizations achieve their objectives; increase efficiency, effectiveness, and competitiveness; and more importantly, how these frameworks can support companies in all aspects of their business processes. Obviously, integrating a risk management framework within an organizational structure requires allocating resources and staff, providing training programs, and developing and maintaining a robust risk culture (Bohnert et al. 2017; Khassawneh 2014). While these requirements are critical for the success of risk management adoption and implementation, these requirements represent significant challenges to all forms of organizations, and the requirements for SMEs become more challenging to achieve. Therefore, most SMEs tend to overcome this issue by implementing an informal approach to risk management, by which the complete process is carried out by the firm managers or owners. This has caused risk management practices in SMEs to be incomplete and mainly rely on qualitative approaches to risk assessment (Durst et al. 2018; Falkner and Hiebl 2015; Henschel and Durst 2016).
A brief review of the related literature reveals that much of the academic effort has focused on various aspects of risk management, including risk analysis, risk perception, risk assessment, risk communications, and risk management practices in businesses (Alrawad et al. 2022; Brockhaus 1976; Brockhaus and Nord 1979; Brockhaus 1980; Lutfi et al. 2023; Sexton and Bowman 1983; Smith and Miner 1983). However, much of the literature focuses on risk management adoption and implementation by large and medium businesses, with relatively less focus on SMEs. Furthermore, in a systematic review conducted by Falkner and Hiebl (2015), it was found that only 27 articles were published on the subject of risk management in small- and medium-sized enterprises (SMEs), and only two of these studies were carried out in developing countries, including Turkey and Chain. Therefore, this study was developed as an attempt to fill the gap and support the limited literature on SMEs’ risk management and assessment processes.
Accordingly, the present research aimed at identifying financial and cash flow risks associated with micro and small businesses and investigating how managers perceive these risks using the analytical hierarchical process (AHP). The study aimed to answer the following questions: how do SME owners/managers perceive financial risks? Which particular risk component is more relevant to SMEs (consequents vs. probability)? How do SME managers/owners prioritize financial and cash flow risks? The use of the AHP method aims to help decision-makers during the evaluation of the impact of different SME risk items. In this novel framework, the SMEs’ risk items were prioritized by the experts by means of the analytic hierarchy process. The remainder of the paper proceeds as follows. Section 2 presents the literature review and theoretical foundation of the research topic. A detailed description of the research methodology and data collection procedures is presented in Section 3. In Section 4, the data analysis and research results are discussed. The last section provides the conclusion, implications, and research limitations as well as directions for future research.

2. Background

The notion of risk and uncertainty could be attributed to Frank Knight’s seminal work “Risk, Uncertainty and Profit” (1921). Prior to Knight, the terms risk and uncertainty were used interchangeably to describe the adverse effect of an action or an event. In his book, Knight attempts to emphasize the differences between risk and uncertainty and argues that both terms represent a different level of information acquisition. Accordingly, if the level of information we hold regarding an event is adequate to estimate its probability and consequences, then the term “risk” will be more appropriate to describe this event. Otherwise, uncertainty is presumed. Knight’s work came at a time when much theoretical and empirical research related to risk and risk perception was conducted by scholars from economics and statistical decision theory disciplines. Consequently, much of the literature focused on quantifying and measuring risk using quantitative-based theories and models, such as revealed preference, utility theory, and game theory, all of which commonly depend on real data and statistics, such as the number of deaths, accidents, losses, and costs of injuries. However, underlining the differences between both concepts (risk and uncertainty) has changed the way the risk concept is viewed and studied (Stone and Grønhaug 1993). Hence, researchers and practitioners start to investigate and assess risks using qualitative methods that are based on stated preference approaches, including the Delphi technique, the SWIFT analysis, the probability—consequence matrix, and multi-criteria decision-making techniques, such as the analytic hierarchy process.

2.1. Uncertainty and Consequence

The International Organization for Standardization (ISO) defined risk as “the effect of uncertainty on objectives.” (ISO 2009). According to the definition, the concept of uncertainty was used to emphasize that risk could represent a threat or an opportunity that could be invested in by the organization to achieve competitive advantages. However, this view of risk is not common among managers, as most of them tend to view risk as an event that only holds a negative outcome (Almaiah et al. 2022d; Chiles and McMackin 1996; March and Shapira 1987; Yates and Stone 1992). According to Zoghi (2017), uncertainty comes from the shortage or lack of information associated with an event, such as its consequence or likelihood of occurrence. Thus, uncertainty represents the unpredictability of an event that impacts corporate performance or the inadequacy of information about these events.
All commonly known risk management standards (e.g., ISO 31000, COSO, and IRM) agree that risk management should follow a generic framework of identification, analysis, assessment, treatment, and risk monitoring. For example, ISO 31000 describes risk management as a process that consists of five stages. These stages start with establishing the context by the management team defining the risk management plan. Such a plan should be in line with business objectives. In the second stage, organizations attempt to identify all the risks that could affect the organization’s objectives. The third stage evaluates all the identified risks by calculating the probability of occurrence and the consequence of these risks. The fourth stage depends mainly on top management’s risk appetite. In other words, what level of risk the management team is willing to take? Finally, risk treatment of unaccepted risks should be set with the most appropriate action to reduce risks.
Much of the previous research into SMEs risk assessments has reported risk by the respondents using one-dimensional measures (e.g., risk score) (Almaiah et al. 2022c; Georgousopoulou et al. 2014; Hudakova et al. 2018a, 2018b; Hudáková et al. 2017; Masár and Hudáková 2019). For instance, in their study, Hudakova et al. (2018a, 2018b) used risk scores to investigate SMEs’ perceived risk using four risk categories, including market risks, financial risks, economic risks, and personal risks. This score was then used to rank the risks based on their importance. Other research has also used the same approach but with a 7-point Likert scale (e.g., from 1 = completely disagree to 7 = completely agree) (Brustbauer 2016; Brustbauer and Peters 2013). However, this approach to evaluating risk perception is limited, as it will only produce an ordinal scale and will only measure risk consequences and ignore the likelihood (Cunningham et al. 2005).
However, few studies have evaluated SMEs’ perceptions using the risk management framework’s recommended evaluation method (Asgary et al. 2020). More precisely, evaluating risk from an attitudinal perspective based on two proposed components: expected consequences and event probability. For instance, Asgary et al. (2020), in their study, investigated SME managers’ risk perceptions of major global risks using consequences and likelihoods. The study used a list of risks produced by the world economic forum that includes 30 types of global risk sources. These risks were scored by respondents using a 5-point scale, ranging from minimal to catastrophic for the consequence dimension and from very unlikely to very likely for the likelihood dimension. The study used simpler multiplication procedures to produce risk scores (e.g., risk score or level = consequence * likelihood). Accordingly, the current research addresses micro and small business managers’ perceptions of risks associated with small businesses in Jordan. The present study followed the risk management steps proposed by ISO. First, the current research identified risks associated with Jordan’s small businesses. The risk analysis was conducted on the specified list of risks.

2.2. Analytic Hierarchical Process

The analytical hierarchy process is a multiple-criteria decision-making method (MCDM) frequently used by risk managers to assess individuals’ risk perceptions of various risks and hazards. Thomas Saaty initially developed the method in the early 1980s (R. W. Saaty 1987; T. L. Saaty 2003, 1991, 1988, 1977; Saaty and Vargas 2006) to assist decision-makers in dealing with situations requiring multiple criteria or attributes. The method involves comparing and prioritizing a set of alternatives based on pre-set criteria or their relative importance. The pairwise comparisons between decision alternatives create a hierarchical structure that can be used for complex decision-making problems (T. L. Saaty 1991). The parsimony of the model has made it very popular in many applications requiring a multi-criteria decision-making process, including risk assessment and management, where both quantitative and qualitative criteria are considered in forming a decision. However, the model was criticized for being labor-intensive and sometimes unwieldy for decisions with many alternatives. For instance, a decision with 10 alternatives requires 90 pairwise comparisons (e.g., number of pairwise comparisons = n(n − 1)/2). AHP analysis involves four main stages to reach the final list of priorities or weights; these stages are explained in more detail in the analysis section.

3. Materials and Methods

Data were collected using a survey questionnaire adapted from prior studies (Almuhisen et al. 2021; Aminbakhsh et al. 2013; Radivojević and Gajović 2014; Unver and Ergenc 2021). The questionnaire was divided into two parts. The first part collected respondents’ sociodemographic information, while the second part captured owner/manager risk perceptions of a list of six financial risks, including (low or no profits, low or no cash flow, revenue shortfall, financing issues, customer payment issues, and increases in bank charges) based on two risk characteristics: consequences and probability. Each risk was evaluated using a 5-point Likert scale ranging from 1 (insignificant) to 5 (catastrophic) for the consequence factor and from 1 (very seldom) to 5 (very often) for the probability factor.
The population of this study consisted of 2281 Jordanian SMEs registered in the Jordan commerce chamber (Almaiah et al. 2022b; Lutfi et al. 2022b; Lutfi et al. 2020), from which a sample of 400 was taken using a simple random sampling method. A list of email addresses was obtained from the Jordan commerce chamber for the SMEs registered in their database. The questionnaire was sent on 2 August 2020, with a gentle reminder that the respondents of the questionnaire should be SME owners or employees directly and actively involved in managerial or supervisory positions. Respondents were invited to participate in this study and were asked to complete online questionnaires using google forms within four weeks. A reminder email was sent on 9 August to increase the response rate. As a result, a total of 130 responses were received, with an initial response rate of 32.5 percent. The collected data were then subject to an outlier screen and unengaged respondents test. The test was carried out by calculating the standard deviations for each respondent’s survey items (Churchill 1979). A zero or low value (S.D ≤ 1) suggested that the respondent did not read the questions and entered the same answer for most, if not all, of the questions (e.g., 1,1,1,1,1 or 5,5,5,5,5). Accordingly, 23 responses were eliminated for not being engaged. This brought the number of valid responses to 107 cases, indicating a response rate of 27 percent. AHP does not rely on statistical analyses to generalize the research findings; therefore, having a low response rate did not affect the study finding validity. Moreover, it is not uncommon to have low response rates when studying SMEs (Alshirah et al. 2021; Asgary et al. 2020; Abdalwali Lutfi 2022; Havierniková and Kordoš 2019; Lutfi et al. 2020, 2022a, 2022c).

4. Application of the AHP for Assessing SME Risk Perception (Data Analysis)

Data were first collected and monitored for outliers and missing data to measure SME managers’ risk assessments of financial risks using AHP. Each respondent was asked to evaluate all the risks mentioned earlier based on two risk characteristics: probability and consequence. The evaluation was based on personal judgment considering the risk characteristics and the respondents’ previous exposure to risk. The data were then analyzed following the AHP procedure described in Section 2.

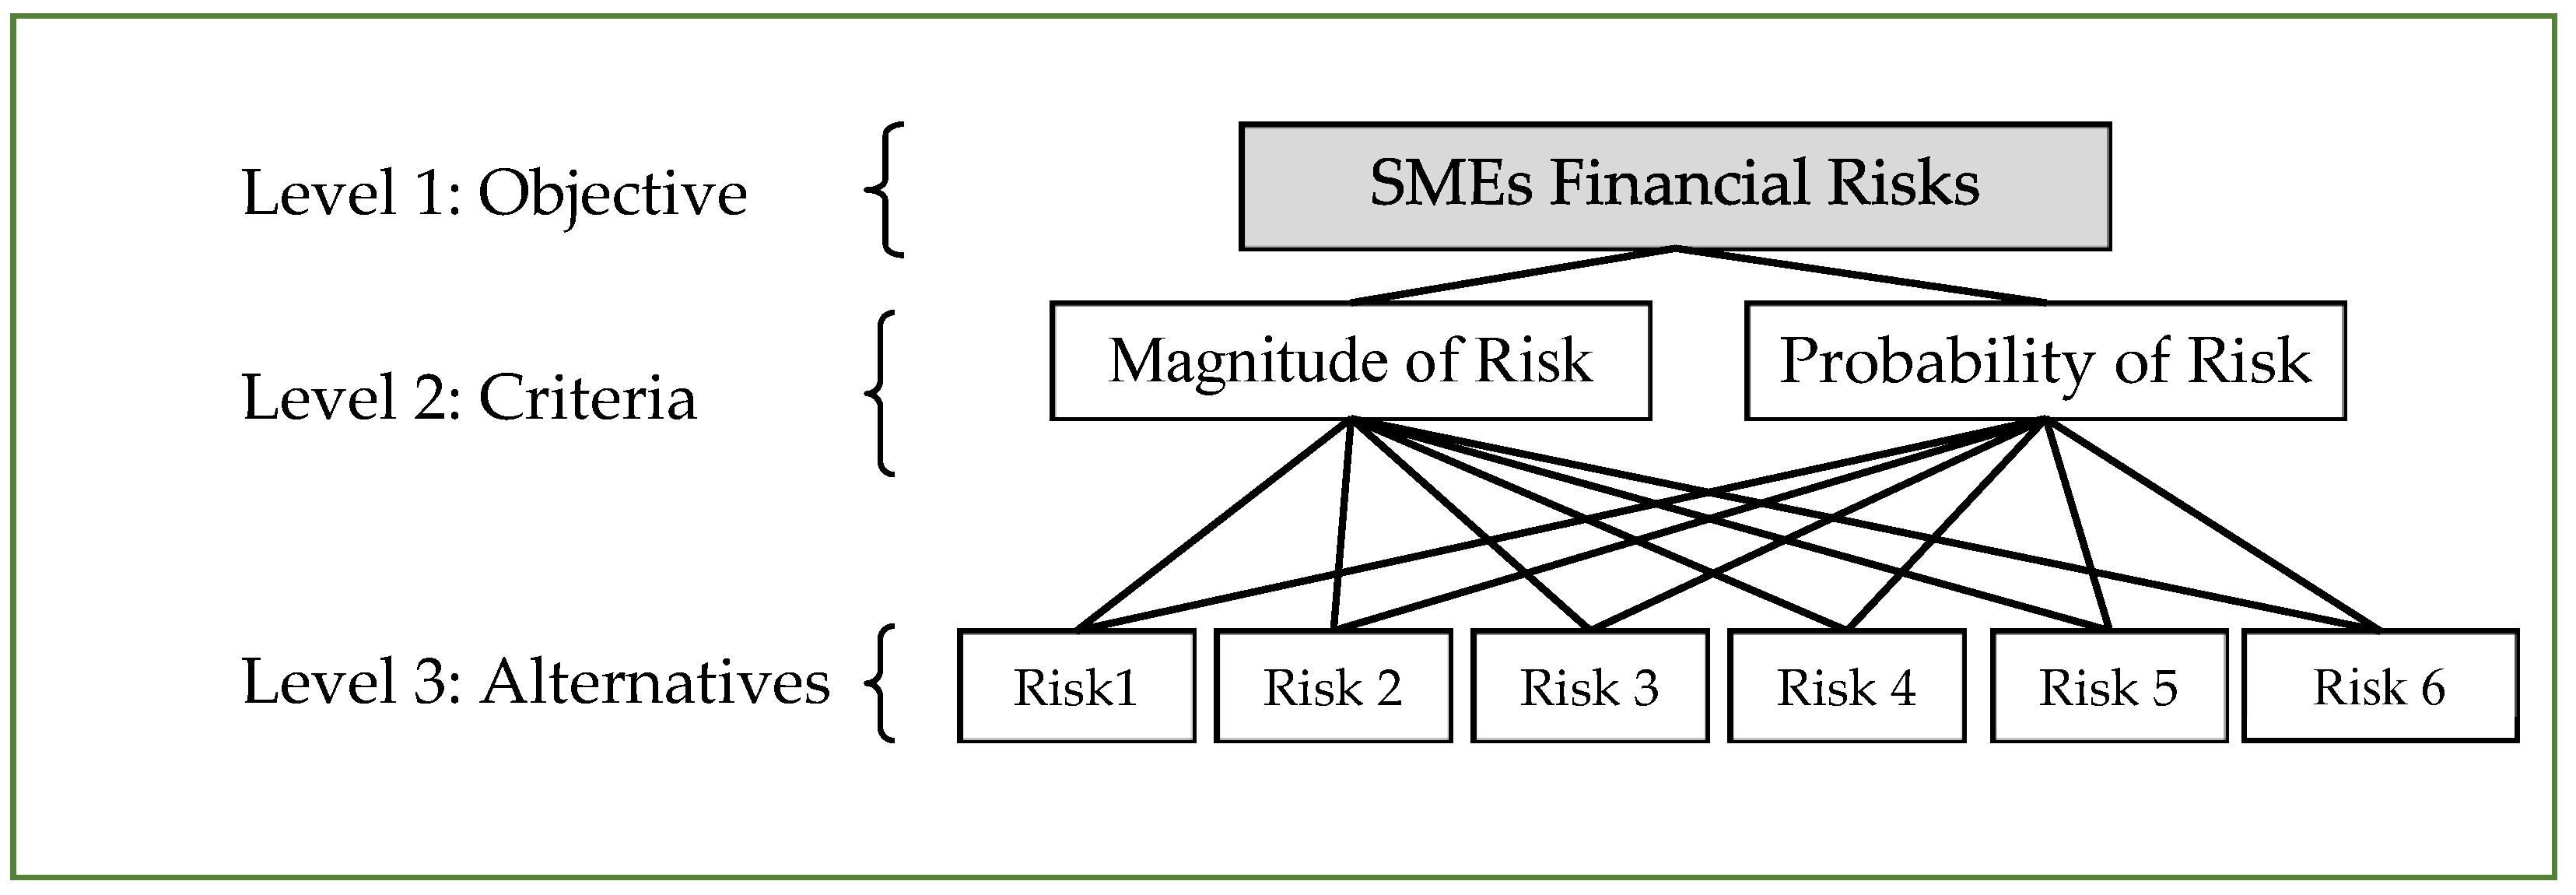
4.1. Step 1: Hierarchy Construction

The analysis can be developed as shown in hierarchy construction Figure 1. As shown in Figure 1, the upper level of the hierarchy construction shows the main purpose of the analysis was to assess SME financial risk. The second level of the structure consists of two criteria/attributes used in the assessment: the magnitude of the risk and the probability of its occurrence. Level three represents the decision alternatives, which consisted of a list of financial risks faced by SMEs.

4.2. Step 2: Pairwise Comparison (Building the Comparison Matrix)

The second step involved collecting data from decision-makers by questionnaire. At this stage, respondents were asked to perform pairwise comparisons between pairs of risks based on the pre-set criteria, risk probability, risk occurrence, and their severity using a subjective scale developed by T. L. Saaty (1991), shown in Table 1.
The comparison between the risks was then used to populate the comparison matrix (A) using the geometric mean of all respondents’ ratings, as seen in Equation (1). The elements of the comparison matrix (R1 vs. R2) shown in Equation (2) represent the geometric means of respondents’ preferences considering alternative (R1) compared to alternative (R2). The matrix was then used to calculate the average weight of the selected criteria and alternatives in Equation (2).
GM -       a i j = a i j 1 a i j 2 . a i j n n
A = [ a 11 a 12 a 16 a 21 a 22 a 2 j a i 1 a i 2 a i j ] ,   A = [ R 1   vs .   R 1 R 1   vs .   R 2 R 1   vs .   R 6 R 2   vs .   R 1 R 2   vs .   R 2 R 2   vs .   R 6 R 6   vs .   R 1 R 6   vs .   R 2 R 6   vs .   R 6 ]
Table 2 and Table 3 show the pairwise comparison for the list of risks based on both criteria, the probability, and the severity.
The elements in the comparison matrix for both criteria listed in Table 2 and Table 3 were then normalized. The normalization process was performed by dividing each element of the comparison matrix by the sum of the column elements using Equation (3).
b i j = a i j i = 1 n a i j
After normalizing the comparison matrix, both Eigenvalues and Eigenvectors were calculated for the pairwise comparison matrix. First, the criteria weights for all risks, shown in Table 4 and Table 5, were obtained by averaging the elements in each row using Equation (4). For example, the criteria weights for low or no profit risks with respect to the criterion consequences in Table 4 were calculated by averaging all elements on the first row divided by the number of risks (e.g., 0.1486 + 0.1408 + 0.1493 + 0.1496 + 0.1494 + 0.1477/6 = 0.1476).
w i = j = 1 n c i j n

4.3. Stage 3: Consistency Vector

The next step was obtaining the weighted sum matrix by multiplying the comparison matrix with the criteria weight, as shown in matrix D. After normalizing the comparison matrix, both the Eigenvalues and Eigenvectors were calculated for the pairwise comparison matrix.
W = [ W 1 W 2 W n ]
D = [ a 11 a 12 a 1 n a 21 a 22 a 2 n a n 1 a n 2 a n n ]     [ W 1 W 2 W n ]
E i = d i w i   ,     ( i = 1 , 2 , 3 , , n )
D = [ 1.000 0.789 0.896 0.914 0.933 0.836 1.252 1.000 1.107 1.122 1.133 1.048 1.116 0.904 1.000 1.029 1.040 0.938 1.094 0.891 0.942 1.000 1.040 0.926 1.072 0.883 0.962 0.962 1.000 0.910 1.196 1.196 1.066 1.080 1.098 1.000 ]     [ 0.147 0.182 0.165 0.162 0.158 0.182 ] = [ 0.891 1.104 0.999 0.982 0.960 1.104 ]
After that, the consistency vector was obtained using Equation (5) to calculate the weighted vector.
λ m a x = 1 n i = 1 n ( A w ) i w i
where lambda max ( λ m a x ) represents the maximum eigenvalue of the comparison matrix. Then, we calculated lambda max using Equation (5) for the risk consequence and severity consistency vector (WI/w)
W = eigenvector
λ m a x = maximum eigenvalue
λ m a x ( s e v e r t y ) = 6.041             { C I = 0.0083 C R = 0.0064 < 10 %
λ m a x ( p r o b a b i l i t y ) = 6.072             { C I = 0.0144 C R = 0.01162 < 10 %

4.4. Stage 4: Testing Consistency Index

The final step in the AHP analysis was testing the quality of the analysis output. This was achieved by testing the expert decision consistency of the pairwise comparison judgments. According to AHP literature, the procedure for testing consistency involves several steps. First, the highest eigenvector or relative weight for all criteria needed to be calculated, and this was done in the previous section. The second step involved calculating the consistency index (CI) value using Equation (6).
C I = λ m a x n n 1
The third step required calculating the consistency ratio (CR) using Equation (7). To do so, we first needed to identify the random consistency value based on several alternatives used in this study. As shown in Table 6, the random index (RI) number for an AHP analysis with six alternatives is RI = 1.24 (R. W. Saaty 1987).
C R = C I R I
Accordingly, the results of the consistency test for both criteria are reported in Table 7. As shown in the table below, both criteria’s CR values were less than (<0.10) (T. L. Saaty 2003). Accordingly, the present AHP analysis achieved an acceptable level of expert decision consistency.

5. Discussion

This study aimed to answer three research questions. Firstly, how SME owners/managers perceived various types of financial and cash flow risks? Secondly, which particular risk components are more relevant to SMEs? Finally, how do SME managers/owners prioritize various financial and cash flow risks? Accordingly, a list of financial and cash flow risks was formulated and evaluated by SME managers based on two risk competencies (likelihood and probability) using online survey questionnaires. Data were then analyzed using an analytical hierarchical process (AHP). Several findings can be drawn from these results, which are shown in Table 8. The most obvious findings to emerge from the analyses were that:
First, the calculated weights of both risk components showed that severity (at 51.5%) was regarded by SME managers as the most important criterion for risk assessment, while probability (45.5%) was the second most important. However, this finding is inconsistent with the results of prior research. For instance, Asgary et al. (2020) found that for all considered risks, SME managers/owners ranked risk likelihood to be more important than risk impact. However, caution should be taken when comparing the present study’s research results with those reported by Asgary et al. (2020) since both studies used different analysis approaches. The study by Asgary et al. calculated risk likelihood and impact using only respondent mean scores, while in the present research, we calculated the weighted average of both risk components using AHP. Furthermore, the mean score was calculated and reported for each risk category separately, while in the present study, all scores were included in the weight calculation process.
Second, the study found that, with an overall risk score of 18.7%, the risk of increased bank charges was rated as the most significant type. The risk customer payment issues, with an 18% overall risk score, were rated second, followed by low or no cash flow risk at 16.8%. Financing issues ranked in fourth place, and revenue shortfall ranked in fifth place. Low or no profits risk came last on the list, with an overall risk score of 13.4%. However, a comparison with other published results was not possible due to the lack of previous research. Furthermore, much of the previous research used a general list of risks (Asgary et al. 2020; Hudakova et al. 2018a, 2018b; Hudáková et al. 2017; Masár and Hudáková 2019). For instance, Masár and Hudáková (2019) assessed SME managers’ perceptions in Slovakia using eight general risk groups without providing detailed analysis or information regarding the exact content of these groups (e.g., market risks, financial risks, economic risks, personal risks, operational risks, legal risks, or other risks).

6. Conclusions

The process of assessing financial risk in SMEs can be completed in different ways and through different methods. However, a common problem in all approaches is the lack of quantitative information that can provide reliable risk assessment. Therefore, to overcome this issue, practitioners implement various forms of decision-support methodologies, including AHP and FAHP. The advantages of these methods lie in their ability to provide meaningful numbers, which decision-makers can use to form their decisions with some level of confidence. In this paper, we evaluated financial risks faced by SMEs from managers’/owners’ perspectives. Accordingly, this paper describes a risk assessment process for financial risks faced by SMEs using the AHP method. In this method, managers’ subjective assessments of risk are obtained, transformed into quantitative information, and used to rank.

6.1. Practical Implications and Theoretical Contribution

The present research findings hold several practical implications and theoretical contributions. First, the literature on SME risk assessment is limited, and the field remains relatively under-investigated. Much of the previous research measures risk using a one-dimensional measure, such as risk score (Almaiah et al. 2022a; Alsyouf et al. 2022, 2021). Accordingly, the present study adds to the existing body of literature on SME risk assessment by investigating managers’ perceptions using more reliable risk metrics. Furthermore, by proposing and evaluating the use of AHP as a methodological approach to evaluate risks associated with SMEs. Moreover, the study adds to our understanding of how SMEs perceive financial and cash flow-related risks. The study also holds some practical implications for SME managers/owners. First, the findings suggest that SMEs should explore the use of reliable risk assessment methods, such as AHP. These methods will help SMEs acquire a better understanding of the risks they face. Second, the study highlights the importance of ranking various types of risks associated with the business, which will help SMEs adjust their priorities in choosing which risk to address first.

6.2. Limitations and Future Studies

Several limitations were found in this study. First, the use of self-report methods in data collection, such as survey questions, has its own limitations and shortfalls, including low response rates, unengaged respondents, and missing values, which may compromise the validity and reliability of the statistical analyses. However, the AHP method used its own reliability method that does not rely on the sample size, such as commonly used statistical analyses (e.g., regression, correlation, and factor analysis). Furthermore, the present study was exploratory in nature and aimed to provide some support for the use of AHP in the SME risk assessment process. Therefore, the used list of risks was limited to only six types of financial and cash flow risks. Future research could examine an extensive list of risks to see if the AHP can produce meaningful information. In addition, future research could overcome the shortfall of using survey methods and investigate SMEs’ risks using more reliable methods.

Author Contributions

Conceptualization, M.A. and A.L.; methodology, M.A.A.; software, M.A.A.; validation, H.M.A., A.M.A. and M.T.; formal analysis, M.A.; investigation, A.L.A.-K.; resources, H.M.A. and N.A.A.; data curation, A.A.; writing—original draft preparation, M.A.; writing—review and editing, A.L., A.M.A. and M.T.; visualization, A.L.A.-K.; supervision, M.A. and N.A.A.; project administration, M.A.; funding acquisition, M.A. All authors have read and agreed to the published version of the manuscript.

Funding

This work was supported by the Deanship of Scientific Research, Vice Presidency for Graduate Studies and Scientific Research, King Faisal University, Saudi Arabia [Grant No. 2799].

Data Availability Statement

The data presented in this study are available on request from the corresponding author.

Conflicts of Interest

The authors declare no conflict of interest.

References

  1. Almaiah, Mohammed Amin, Ali Mugahed Al-Rahmi, Fahad Alturise, Mahmaod Alrawad, Salem Alkhalaf, Abdalwali Lutfi, Waleed Mugahed Al-Rahmi, and Ali Bani Awad. 2022a. Factors Influencing the Adoption of Internet Banking: An Integration of ISSM and UTAUT with Price Value and Perceived Risk. Frontiers in Psychology 13: 919198. [Google Scholar] [CrossRef]
  2. Almaiah, Mohammed Amin, Fahima Hajjej, Rima Shishakly, Abdalwali Lutfi, Ali Amin, and Ali Bani Awad. 2022b. The Role of Quality Measurements in Enhancing the Usability of Mobile Learning Applications during COVID-19. Electronics 11: 1951. [Google Scholar] [CrossRef]
  3. Almaiah, Mohammed Amin, Raghad Alfaisal, Said A. Salloum, Fahima Hajjej, Rima Shishakly, Abdalwali Lutfi, Mahmaod Alrawad, Ahmed Al Mulhem, Tayseer Alkhdour, and Rana Saeed Al-Maroof. 2022c. Measuring Institutions’ Adoption of Artificial Intelligence Applications in Online Learning Environments: Integrating the Innovation Diffusion Theory with Technology Adoption Rate. Electronics 11: 3291. [Google Scholar] [CrossRef]
  4. Almaiah, Mohammed Amin, Raghad Alfaisal, Said A. Salloum, Shaha Al-Otaibi, Omar Said Al Sawafi, Rana Saeed Al-Maroof, Abdalwali Lutfi, Mahmaod Alrawad, Ahmed Al Mulhem, and Ali Bani Awad. 2022d. Determinants Influencing the Continuous Intention to Use Digital Technologies in Higher Education. Electronics 11: 2827. [Google Scholar] [CrossRef]
  5. Almuhisen, Maram, Hüseyin Gökçekuş, and Tahir Çelik. 2021. Developing an AHP Risk Assessment Model for PPP Projects in Jordan. Journal of Engineering Research 10: 15–23. [Google Scholar] [CrossRef]
  6. Alrawad, Mahmaod, Abdalwali Lutfi, Sundus Alyatama, Ibrahim A. Elshaer, and Mohammed Amin Almaiah. 2022. Perception of Occupational and Environmental Risks and Hazards among Mineworkers: A Psychometric Paradigm Approach. International Journal of Environmental Research and Public Health 19: 3371. [Google Scholar] [CrossRef] [PubMed]
  7. Alshirah, Malek Hamed, Abdalwali Lutfi, Ahmad Farhan Alshira’h, Mohamed Saad, Nahla Mohamad El Sayed Ibrahim, and Fatihelelah Mohammed Mohammed. 2021. Influences of the Environmental Factors on the Intention to Adopt Cloud Based Accounting Information System among SMEs in Jordan. Accounting 7: 645–54. [Google Scholar] [CrossRef]
  8. Alsyouf, Adi, Abdalwali Lutfi, Mohammad Al-Bsheish, Mu’taman Jarrar, Khalid Al-Mugheed, Mohammed Amin Almaiah, Fahad Nasser Alhazmi, Ra’ed Masa’deh, Rami J. Anshasi, and Abdallah Ashour. 2022. Exposure Detection Applications Acceptance: The Case of COVID-19. International Journal of Environmental Research and Public Health 19: 7307. [Google Scholar] [CrossRef]
  9. Alsyouf, Adi, Ra’ed Masa’deh, Moteb Albugami, Mohammad Al-Bsheish, Abdalwali Lutfi, and Nizar Alsubahi. 2021. Risk of Fear and Anxiety in Utilising Health App Surveillance Due to COVID-19: Gender Differences Analysis. Risks 9: 179. [Google Scholar] [CrossRef]
  10. Altanashat, Mohammad, Maged Al Dubai, and Sadun Alhety. 2019. The Impact of Enterprise Risk Management on Institutional Performance in Jordanian Public Shareholding Companies. Journal of Business and Retail Management Research 13: 256–68. [Google Scholar] [CrossRef] [Green Version]
  11. Aminbakhsh, Saman, Murat Gunduz, and Rifat Sonmez. 2013. Safety Risk Assessment Using Analytic Hierarchy Process (AHP) during Planning and Budgeting of Construction Projects. Journal of Safety Research 46: 99–105. [Google Scholar] [CrossRef] [PubMed]
  12. Annamalah, Sanmugam, Murali Raman, Govindan Marthandan, and Aravindan Kalisri Logeswaran. 2018. Implementation of Enterprise Risk Management (ERM) Framework in Enhancing Business Performances in Oil and Gas Sector. Economies 6: 4. [Google Scholar] [CrossRef]
  13. Asgary, Ali, Ali Ihsan Ozdemir, and Hale Özyürek. 2020. Small and Medium Enterprises and Global Risks: Evidence from Manufacturing SMEs in Turkey. International Journal of Disaster Risk Science 11: 59–73. [Google Scholar] [CrossRef]
  14. Bohnert, Alexander, Nadine Gatzert, Robert E. Hoyt, and Philipp Lechner. 2017. The Relationship between Enterprise Risk Management, Value and Firm Characteristics Based on the Literature. Zeitschrift Für Die Gesamte Versicherungswissenschaft 106: 311–24. [Google Scholar] [CrossRef]
  15. Brockhaus, Robert H. 1976. Risk Taking Propensity of Entrepreneurs. In Academy of Management Proceedings. Briarcliff Manor: Academy of Management, pp. 457–60. [Google Scholar]
  16. Brockhaus, Robert H., and Walter R. Nord. 1979. An Exploration of Factors Affecting the Entrepreneurial Decision: Personal Characteristic vs. Environmental Conditions. In Academy of Management Proceedings. Briarcliff Manor: Academy of Management, pp. 364–68. [Google Scholar]
  17. Brockhaus, Robert H., Sr. 1980. Risk Taking Propensity of Entrepreneurs. Academy of Management Journal 23: 509–20. [Google Scholar] [CrossRef]
  18. Brustbauer, Johannes. 2016. Enterprise Risk Management in SMEs: Towards a Structural Model. International Small Business Journal: Researching Entrepreneurship 34: 70–85. [Google Scholar] [CrossRef]
  19. Brustbauer, Johannes K., and Mike Peters. 2013. Risk Perception of Family and Non-Family Firm Managers. International Journal of Entrepreneurship and Small Business 20: 96. [Google Scholar] [CrossRef]
  20. Chiles, Todd H., and John F. McMackin. 1996. Integrating Variable Risk Preferences, Trust, and Transaction Cost Economics. Academy of Management Review 21: 73–99. [Google Scholar] [CrossRef]
  21. Churchill, Gilbert A. 1979. A Paradigm for Developing Better Measures of Marketing Constructs. Journal of Marketing Research 16: 64–73. [Google Scholar] [CrossRef]
  22. Cunningham, Lawrence F., James H. Gerlach, Michael D. Harper, and Clifford E. Young. 2005. Perceived Risk and the Consumer Buying Process: Internet Airline Reservations. International Journal of Service Industry Management 16: 357–72. [Google Scholar] [CrossRef]
  23. Durst, Susanne, Guido Bruns, and Thomas Henschel. 2018. The Management of Knowledge Risks: What Do We Really Know? In Global Business Expansion: Concepts, Methodologies, Tools, and Applications. Hershey: IGI Global, pp. 258–69. [Google Scholar]
  24. Falkner, Eva Maria, and Martin R. W. Hiebl. 2015. Risk Management in SMEs: A Systematic Review of Available Evidence. The Journal of Risk Finance 16: 122–44. [Google Scholar] [CrossRef]
  25. Georgousopoulou, Margarita, Max Chipulu, Udechukwu Ojiako, and Johnnie Johnson. 2014. Investment Risk Preference among Greek SME Proprietors: A Pilot Study. Journal of Small Business and Enterprise Development 21: 177–93. [Google Scholar] [CrossRef]
  26. Havierniková, Katarína, and Marcel Kordoš. 2019. Selected Risks Perceived by SMEs Related to Sustainable Entrepreneurship in Case of Engagement into Cluster Cooperation. Entrepreneurship and Sustainability Issues 6: 1680–93. [Google Scholar] [CrossRef]
  27. Henschel, Thomas, and Susanne Durst. 2016. Risk Management in Scottish, Chinese and German Small and Medium-Sized Enterprises: A Country Comparison. International Journal of Entrepreneurship and Small Business 29: 112–32. [Google Scholar] [CrossRef]
  28. Hudáková, Mária, Jaroslav Schönfeld, Ján Dvorský, and Mária Lusková. 2017. The Market Risk Analysis and Methodology of Its More Effective Management in Smes in the Slovak Republic. Montenegrin Journal of Economics 13: 151–61. [Google Scholar] [CrossRef]
  29. Hudakova, Maria, Matej Masar, and Katarina Buganova. 2018a. Assessment of the financial risks of the small and medium-sized enterprises in Slovakia. Economic and Social Development: Book of Proceedings 10: 505–13. [Google Scholar]
  30. Hudakova, Maria, Matej Masar, Maria Luskova, and Milan Robin Patak. 2018b. The Dependence of Perceived Business Risks on the Size of SMEs. Journal of Competitiveness 10: 54–69. [Google Scholar] [CrossRef]
  31. ISO. 2009. Guide, ISO. 73: 2009: Risk Management Vocabulary. Geneva: International Organization for Standardization. [Google Scholar]
  32. Khassawneh, Abd Alwali. 2014. The influence of organizational factors on accounting information systems (AIS) effectiveness: A study of Jordanian SMEs. International Journal of Marketing and Technology 4: 36. [Google Scholar]
  33. Kommunuri, John, Anil Narayan, Mark Wheaton, and Lilibeth Jandug. 2016. Enterprise Risk Management and Firm Performance Empirical Evidence from Vietnam. Working Paper, New Zealand Journal of Applied Busines Research 14: 17–28. [Google Scholar]
  34. Lutfi, Abdalwali. 2022. Understanding the Intention to Adopt Cloud-Based Accounting Information System in Jordanian SMEs. The International Journal of Digital Accounting Research 22: 47–70. [Google Scholar] [CrossRef]
  35. Lutfi, Abdalwali, Adi Alsyouf, Mohammed Amin Almaiah, Mahmaod Alrawad, Ahmed Abdullah Khalil Abdo, Akif Lutfi Al-Khasawneh, Nahla Ibrahim, and Mohamed Saad. 2022a. Factors Influencing the Adoption of Big Data Analytics in the Digital Transformation Era: Case Study of Jordanian SMEs. Sustainability 14: 1802. [Google Scholar] [CrossRef]
  36. Lutfi, Abdalwali, Akif Lutfi Al-Khasawneh, Mohammed Amin Almaiah, Adi Alsyouf, and Mahmaod Alrawad. 2022b. Business Sustainability of Small and Medium Enterprises during the COVID-19 Pandemic: The Role of AIS Implementation. Sustainability 14: 5362. [Google Scholar] [CrossRef]
  37. Lutfi, Abdalwali, Mahmaod Alrawad, Adi Alsyouf, Mohammed Amin Almaiah, Ahmad Al-Khasawneh, Akif Lutfi Al-Khasawneh, Ahmad Farhan Alshira’h, Malek Hamed Alshirah, Mohamed Saad, and Nahla Ibrahim. 2023. Drivers and Impact of Big Data Analytic Adoption in the Retail Industry: A Quantitative Investigation Applying Structural Equation Modeling. Journal of Retailing and Consumer Services 70: 103129. [Google Scholar] [CrossRef]
  38. Lutfi, Abdalwali, Manaf Al-Okaily, Adi Alsyouf, Abdallah Alsaad, and Abdallah Taamneh. 2020. The Impact of AIS Usage on AIS Effectiveness Among Jordanian SMEs: A Multi-Group Analysis of the Role of Firm Size. Global Business Review 20: 627–39. [Google Scholar] [CrossRef]
  39. Lutfi, Abdalwali, Saleh Nafeth Alkelani, Malak Akif Al-Khasawneh, Ahmad Farhan Alshira’h, Malek Hamed Alshirah, Mohammed Amin Almaiah, Mahmaod Alrawad, Adi Alsyouf, Mohamed Saad, and Nahla Ibrahim. 2022c. Influence of Digital Accounting System Usage on SMEs Performance: The Moderating Effect of COVID-19. Sustainability 14: 15048. [Google Scholar] [CrossRef]
  40. March, James G., and Zur Shapira. 1987. Managerial Perspectives on Risk and Risk Taking. Management Science 33: 1404–18. Available online: http://www.jstor.org/stable/2631920 (accessed on 1 December 2022). [CrossRef]
  41. Masár, Matej, and Mária Hudáková. 2019. Attitude of slovak small and medium-sized enterprises towards risk management—Investigation of the regional differences. CBU International Conference Proceedings 7: 200–6. [Google Scholar] [CrossRef]
  42. Radivojević, Gordana, and Vladimir Gajović. 2014. Supply Chain Risk Modeling by AHP and Fuzzy AHP Methods. Journal of Risk Research 17: 337–52. [Google Scholar] [CrossRef]
  43. Saaty, Roseanna W. 1987. The Analytic Hierarchy Process—What It Is and How It Is Used. Mathematical Modelling 9: 161–76. [Google Scholar] [CrossRef]
  44. Saaty, Thomas L. 1977. A Scaling Method for Priorities in Hierarchical Structures. Journal of Mathematical Psychology 15: 234–81. [Google Scholar] [CrossRef]
  45. Saaty, Thomas L. 1988. What Is the Analytic Hierarchy Process? In Mathematical Models for Decision Support. Berlin/Heidelberg: Springer, pp. 109–21. [Google Scholar]
  46. Saaty, Thomas L. 1991. Some Mathematical Concepts of the Analytic Hierarchy Process. Behaviormetrika 18: 1–9. [Google Scholar] [CrossRef]
  47. Saaty, Thomas L. 2003. Decision-Making with the AHP: Why Is the Principal Eigenvector Necessary. European Journal of Operational Research 145: 85–91. [Google Scholar] [CrossRef]
  48. Saaty, Thomas L., and Luis G. Vargas. 2006. Decision Making with the Analytic Network Process. Berlin/Heidelberg: Springer, vol. 282. [Google Scholar]
  49. Sexton, Donald L., and Nancy Bowman. 1983. Determining Entrepreneurial Potential of Students. In Academy of Management Proceedings. Briarcliff Manor: Academy of Management, pp. 408–12. [Google Scholar]
  50. Smith, Norman R., and John B. Miner. 1983. Type of Entrepreneur, Type of Firm, and Managerial Motivation: Implications for Organizational Life Cycle Theory. Strategic Management Journal 4: 325–40. [Google Scholar] [CrossRef]
  51. Stone, Robert N., and Kjell Grønhaug. 1993. Perceived Risk: Further Considerations for the Marketing Discipline. European Journal of Marketing 27: 39–50. [Google Scholar] [CrossRef]
  52. Unver, Saliha, and Ibrahim Ergenc. 2021. Safety Risk Identification and Prioritize of Forest Logging Activities Using Analytic Hierarchy Process (AHP). Alexandria Engineering Journal 60: 1591–99. [Google Scholar] [CrossRef]
  53. Yates, J. Frank, and E. R. Stone. 1992. Risk appraisal. In Risk-Taking Behavior. Edited by J. Frank Yates. Chichester: John Wiley & Sons, pp. 49–85. [Google Scholar]
  54. Zoghi, Farzaneh Soleimani. 2017. Risk Management Practices and SMEs: An Empirical Study on Turkish SMEs. International Journal of Trade, Economics and Finance 8: 123–27. [Google Scholar] [CrossRef] [Green Version]
Figure 1. The devised AHP model for prioritizing SEMs’ financial risks.
Jrfm 16 00086 g001
Table 1. Pairwise comparison scale for AHP preferences.
Rating Definition Explanation
1Equally preferredAlternative i and j are of equal value.
3Moderately preferredAlternative i has a slightly higher value than j.
5Strongly preferredAlternative i has a strongly higher value than j.
7Very strongly preferredAlternative i has a very strongly higher value than j.
9Extremely preferredAlternative i has a higher value than j.
2,4,6,8Intermediate scaleThe intermediate scale between two adjutant judgment
Reciprocal Reverence the preferenceIf alternative i have a lower value than j
Source: (T. L. Saaty 1991)
Table 2. Pairwise comparison matrix for risk categories based on probability criteria.
R1R2R3R4R5R6
Low or no profits10.7070.8520.6820.5970.657
Low or no cash flow1.41411.2150.9960.8500.944
Revenue shortfall1.1740.82310.7870.6810.765
Financing issues 1.4661.0041.27110.8600.959
Customer’s payments issues 1.6751.1761.4681.16311.136
Increase in bank charges 1.5221.5221.3081.0430.8811
Sum8.2516.2327.1135.6714.8695.461
Table 3. Pairwise comparison matrix for risk categories (magnitude of risk).
R1R2R3R4R5R6
Low or no profits10.7980.8960.9140.9330.836
Low or no cash flow1.25211.1071.1221.1331.048
Revenue shortfall1.1160.90411.0291.0400.938
Financing issues 1.0940.8910.97211.040.926
Customer’s payments issues 1.0720.8830.9620.96210.910
Increase in bank charges 1.1961.1961.0661.0801.0981
Sum6.7315.6736.0026.1066.2445.658
Table 4. Normalized matrix for consequences.
R1R2R3R4R5R6Wi
Low or no profits0.14860.14080.14930.14960.14940.14770.1476
Low or no cash flow0.18610.17630.18440.18370.18140.18520.1828
Revenue shortfall0.16580.15930.16660.16850.16660.16590.1654
Financing issues 0.16260.15710.16190.16380.16660.16360.1626
Customer’s payments issues 0.15931.15560.16020.15750.16020.16090.1589
Increase in bank charges 0.17771.21090.17760.17690.17590.17670.1826
∑ = 1.000
Table 5. Normalized matrix for severity.
R1R2R3R4R5R6Wi
Low or no profits0.12120.11350.11970.12030.12260.12030.1196
Low or no cash flow0.17140.16050.17080.17570.17460.17290.1710
Revenue shortfall0.14230.13210.14060.13880.13990.14000.1390
Financing issues 0.17760.16110.17860.17630.17660.17560.1743
Customer’s payments issues 0.20310.18870.20640.20500.20540.20800.2028
Increase in bank charges 0.18440.24420.18390.18390.18080.18310.1934
∑ = 1.000
Table 6. Average random consistency (RI).
Size 12345678910
Random consistency000.580.901.121.241.321.411.451.49
Source: (R. W. Saaty 1987)
Table 7. Consistency test results.
N = 6Probability of RisksMagnitude of Risks
Lambda max ( λ m a x )6.0726.041
Consistency index (CI)0.01440.0083
Consistency ratio (CR)0.01160.0064
Random index (RI)1.241.24
Table 8. Risk perception of the uncertainties (weights and ranks of SME financial risks).
Risk Probability of RiskMagnitude of RiskOverallRank
(0.4846)(0.5154)risk
Low or no profits0.11960.14760.13406th
Low or no cash flow risk0.17100.18280.17713rd
Revenue shortfall0.13900.16540.15265th
Financing issues 0.17430.16260.16834th
Customer’s payments issues 0.20280.15890.18022nd
Increase in bank charges 0.19340.18260.18781st
Disclaimer/Publisher’s Note: The statements, opinions and data contained in all publications are solely those of the individual author(s) and contributor(s) and not of MDPI and/or the editor(s). MDPI and/or the editor(s) disclaim responsibility for any injury to people or property resulting from any ideas, methods, instructions or products referred to in the content.

