Article

Does Geopolitical Risk Matter for Sovereign Credit Risk? Fresh Evidence from Nonlinear Analysis

College of Economics and Administrative Sciences, Imam Mohammad Ibn Saud Islamic University (IMSIU), P.O. Box 5701, Riyadh 11564, Saudi Arabia
*
Author to whom correspondence should be addressed.
J. Risk Financial Manag. 2023, 16(3), 148; https://doi.org/10.3390/jrfm16030148
Submission received: 10 January 2023 / Revised: 15 February 2023 / Accepted: 17 February 2023 / Published: 22 February 2023
(This article belongs to the Special Issue Advances in Fixed Incomes and Risk Management)

Abstract

:
The recent geopolitical uncertainty and the alarming increase in the sovereign credit risk of many countries have motivated us to investigate the potential asymmetric co-movement between geopolitical risk and sovereign credit risk for nineteen countries (China, Russia, USA, Brazil, UK, South Korea, Mexico, Saudi Arabia, Turkey, Sweden, Spain, Norway, Italy, Morocco, France, Bahrain, Abu Dhabi, Japan, and Greece). Using data consisting of Sovereign Credit Default Swap (SCDS), Geopolitical Risk (GPR), and the Quantile-on-Quantile approach (QQA), empirical findings indicate that (i) the effects of GPR on SCDS were heterogeneous, mainly positive, asymmetric, and varied across quantiles and countries; (ii) when the SCDS and GPR are both in upper quantiles, the impacts of GPR are more pronounced; (iii) the countries with the most significant sovereign wealth funds (Norway, China, Saudi Arabia) are less affected by geopolitical uncertainty.

1. Introduction

Credit risk is the financial loss arising when borrowers default on their debt. Essentially, it is a risk that accounts for the possibility of a counterparty defaulting on paying its debt (Arora and Kaur 2020). The chance of default from the counterparty offers a great deal of uncertainty to lenders. Thus, from a risk management perspective, credit risk plays a significant role in detecting and assessing these probabilities and proposing keen measures to mitigate possible future losses. Moreover, credit risk has gained considerable attention from practitioners, policymakers, regulators, and academics following the global financial crisis.
There are various types of credit risk, including corporate credit risk and sovereign credit risk. While the earlier deals with corporations’ default risk, the sovereign credit risk refers to a risk of a country defaulting on its debt. Sovereign credit risk is the country’s inability to pay back its international debts (Lee et al. 2016). This type of risk has gained more attention since the European debt crisis emerged, especially since it did not affect countries in Eurozone solely. Instead, it had an impact on the global economy. Therefore, numerous literature-related works have focused on examining and studying sovereign credit risk after the European debt crisis.
Sovereign credit risk has gained importance due to its significance to policymakers, countries’ ability to borrow, and investors who wish to diversify their portfolios internationally. Most of the existing studies focus argues the importance of global macroeconomics and risk factors in explaining the changes in SCDS spreads (e.g., Pan and Singleton (2008); Hilscher and Nosbusch (2010); Longstaff et al. (2011); Oliveira et al. (2012); Amstad et al. (2016); Stolbov (2017); Bouri et al. (2018); Naifar (2020); Rikhotso and Simo-Kengne (2022); among others). In addition, the recent increase in sovereign credit default swaps of many countries caused by Russia’s invasion of Ukraine motivated us to investigate the impact of geopolitical risk on sovereign credit risk. Therefore, there is a need to study the effect of such a factor on sovereign credit risk.
This paper contributes to the growing body of literature in three different ways. First, we investigate the asymmetric co-movement between the geopolitical risk index (GPR) and sovereign credit risk proxied by the sovereign credit default swap (SCDS) for a large and diversified sample, including nineteen countries (China, Russia, USA, Brazil, UK, South Korea, Mexico, Saudi Arabia, Turkey, Sweden, Spain, Norway, Italy, Morocco, France, Bahrain, Abu Dhabi, Japan, and Greece). To the best of our knowledge, there are no reported studies on the impact of GPR on SCDSs for a sample including diversified countries. Second, we use the Quantile-on-Quantile Approach (QQA) proposed by Sim and Zhou (2015). The QQA is a generalization of the standard quantile regression that enables one to examine how the quantiles of GPR affect the conditional quantiles of SCDSs. Third, our sample period corresponds to some significant geopolitical events (e.g., the 2007–2008 global financial crisis; the 2009–2010 European sovereign debt crisis; the 2010–2013 Arab Spring; the 2015 Paris attack; the 2016 North Korean nuclear tests; the 2020 Brexit; the 2021–2022 Russia–Ukraine tensions, etc.) that can affect the nonlinear dynamics of sovereign credit risk differently.
In this paper, we address the following unanswered questions. (i) Does co-movement exist between the SCDS spreads and geopolitical risk? (ii) Are there asymmetric dynamics between variables? (iii) Does the co-movement between SCDS spreads and geopolitical risk variables change across quantiles and countries?
According to Bloom (2009), increased geopolitical unpredictability can lead to consumers delaying their purchases and businesses delaying investments due to the need for precautionary savings. According to Cheng and Chiu (2018), 38 poor and developing economies have experienced significant economic contractions because of increased global geopolitical risks. Additionally, geopolitical risk shocks contribute significantly to business cycle fluctuations in these nations (on average, about 22% of the variation in total output). Alam et al. (2023) state that geopolitical events act as external shocks by raising economic and political uncertainty and resulting in subpar firm investment. Feng et al. (2023) demonstrate that the increase in geopolitical risk leads to the contraction of capital flows for 45 major economies. Based on the above literature, geopolitical risk affects economic conditions and leads to fluctuations in business cycles. As a result, geopolitical risk can affect the sovereign credit of a country and can lead to a change in SCDS spreads. So, we can formulate the following hypotheses:
H1. 
The geopolitical risk affects the dynamics of SCDS spreads.
H2. 
The co-movement between geopolitical risk and SCDS spreads is asymmetric.
H3. 
The dynamics across geopolitical risk and SCDS spreads change across quantiles and countries.
The remainder of this paper is structured as follows. Section 2 presents the literature review. Section 3 illustrates the methodology of the study. Section 4 describes the data and the preliminary statistics. Section 5 presents and discusses the empirical findings. Section 6 presents the robustness check. Section 7 concludes the paper.

2. Literature Review

Most current studies concentrate on explaining the determinants of SCDS spreads. The first set of studies highlights how crucial country-specific factors and macroeconomic fundamentals are in explaining changes in sovereign credit risk (e.g., Abid and Naifar (2006), Hilscher and Nosbusch (2010), Liu and Morley (2012), Eyssell et al. (2013), among others). Sovereign credit risk and domestic fundamentals may be linked through several channels. According to Merton (1974), when the firm’s assets are worth less than the face value of its debt, the firm defaults. The Black–Scholes–Merton option pricing model is the structural model because it establishes a link between the firm’s asset (capital) structure and default risk. The Merton (1974) model states that default risks arise at maturity if a company’s assets are worth less than its outstanding debt. The unobservable value of a firm’s assets fluctuates randomly, and the structural models use these variations to calculate the probability of default.
In contrast to structural credit risk modeling, reduced-form models model the default time as an unforeseen event that a wide range of distinct market-related factors may influence. Jarrow and Protter (2004) contend that the crucial distinction between structural and reduced-form models lies not in the default time property (predictable versus unpredictability) but in the information set made available to the modeler. The structural models can be transformed into reduced-form models as the information set changes and becomes less refined, from the firm’s management to those observed by the market.
A growing body of research investigates the impact of uncertainty factors and global variables on sovereign credit default swaps. Chuffart and Hooper (2019) investigated the effect of oil price returns on SCDS spreads for two major oil producers, Russia and Venezuela. Using a time-varying transition probabilities Markov switching model, empirical results show that crude oil price returns significantly impact Venezuela’s CDS spreads but do not explain Russian CDS spread changes. Kartal (2020) studied the behavior of Turkey’s SCDS spreads before and during the COVID-19 pandemic. He finds that global equity uncertainty affects the dynamics of SCDSs before and during the COVID-19 pandemic. Naifar (2020) investigated the drivers of SCDS spread changes in the case of Gulf Cooperation Council countries. Empirical results show that global financial uncertainty (VIX index) and the global conventional bond market uncertainty (MOVE index) are the main drivers of SCDS variations. Rikhotso and Simo-Kengne (2022) investigated the tail dependence structures of SCDSs and global risk factors (crude oil price, VIX index, and local exchange rates against the US dollar) in BRICS countries from 21 March 2016 to 18 March 2021. Using a copula approach, empirical findings show that the VIX index is essential in driving sovereign CDS spreads in the BRICS countries under extreme market conditions, with Brazil having the highest co-dependency. Ma et al. (2018) studied the determinants of SCDSs in eleven emerging countries. They found that local stock index return, exchange rate changes, and credit rating changes in the country affect the SCDS variation in the tranquil regime, whereas global variables affect the SCDS spreads in a bad state.
Despite the growing literature on the drivers of sovereign credit risk spreads, only a few studies investigated the impact of geopolitical risk on sovereign credit risk. Bratis et al. (2021) examined the relationship between SCDSs, sovereign bond markets, and geopolitical risk for selected core and periphery EMU countries (Germany, France, Portugal, Italy, Ireland, Spain, and Greece) during and after the global financial crisis. Using daily data from 2009 to 2014 and causality tests (VAR and BEKK-GARCH), empirical results show a causal relationship and volatility spillovers between SCDSS, sovereign bond spreads, and geopolitical risk. Simonyan and Bayraktar (2022) investigated the asymmetric relationship between SCDSS, country-specific factors, and global uncertainty factors. Using monthly data from eleven emerging countries during the period from January 2008 to May 2020, empirical results indicate that the equity index, international reserves, VIX index, and oil prices are the most significant drivers of SCDS spreads. However, the geopolitical risk index is insignificant in explaining the dynamics of SCDS changes.
Our study is different from Simonyan and Bayraktar’s (2022) study in many ways. First, our sample is larger and includes nineteen countries. Second, the period of our study covers the 2021 Russia–Ukraine tensions event. Third, we use an asymmetric framework based on quantile methods (Quantile-on-Quantile Approach, QQA). The QQA allows us to investigate how the quantiles of geopolitical risk affect the conditional quantiles of SCDS changes. QQA is a generalization of the standard quantile regression approach, capturing the dependence structure under different market conditions.

3. Research Methodology

The QQA advanced by Sim and Zhou (2015) permits us to investigate how the quantiles of the GPR index affect the conditional quantiles of SCDSs:
S C D S t = β θ ( G P R t ) + u t θ
where SCDSt represents the sovereign credit default swap in time t, GPRt denotes the global geopolitical risk index in time t, θ is the θth quantile of the conditional distribution of the SCDS returns, and u t θ is a quantile error term whose conditional θth quantile is equal to zero. β θ ( · ) is an unknown function that can be approximated through a first-order Taylor expansion around a quantile G P R τ :
β θ ( G P R t ) β θ ( G P R τ ) + β θ ( G P R τ ) ( G P R t G P R τ )
where β θ is the partial derivative of β θ ( G P R t ) with respect to GPR and β θ ( G P R τ ) , which can be renamed as β 0 ( θ , τ )  and  β 1 ( θ , τ ) , respectively:
β θ ( G P R t ) β 0 ( θ , τ ) + β 1 ( θ , τ ) ( G P R t G P R τ ) .
By substituting Equation (1) in Equation (3), we obtain Equation (4):
S C D S t β 0 ( θ , τ ) + β 1 ( θ , τ ) ( G P R t G P R τ ) ( C ) + u t θ
The term (c) in Equation (4) is the θth conditional quantile of the SCDS returns. The local linear regression estimates of the parameters b 0 and b 1 are attained by solving the following minimization problem:
min b 0 , b 1 i = 1 n ρ θ [ S C D S t b 0 b 1 ( G P R ^ t G P R ^ τ ) ] K ( F n ( G P R ^ t ) τ h )
Here, ρ θ ( u ) is the quantile loss function, defined as ρ θ ( u ) = u ( θ I ( u < 0 ) ) , and I is the usual indicator function. K ( · ) denotes the kernel function and h is the bandwidth parameter of the kernel1.

4. Data Description and Preliminary Tests

4.1. Data Description

To study the potential asymmetric co-movement between GPR and sovereign credit risk, we used monthly log-return data for the GPR from August 2008 to December 2021. The GPR index we used was developed by Caldara and Iacoviello (2022)2. Figure 1 illustrates the dynamics of GPR returns during the sample period.
Figure 1 shows the GPR return dynamics during the study period. We note important geopolitical risk events, including the 2007–2008 global financial crisis; the 2009–2010 European sovereign debt crisis; the 2010–2013 Arab Spring; the 2015 Paris attack; the 2016 North Korean nuclear tests; the 2020 Brexit; the 2020 oil crash; and the 2021 Russia–Ukraine tensions.
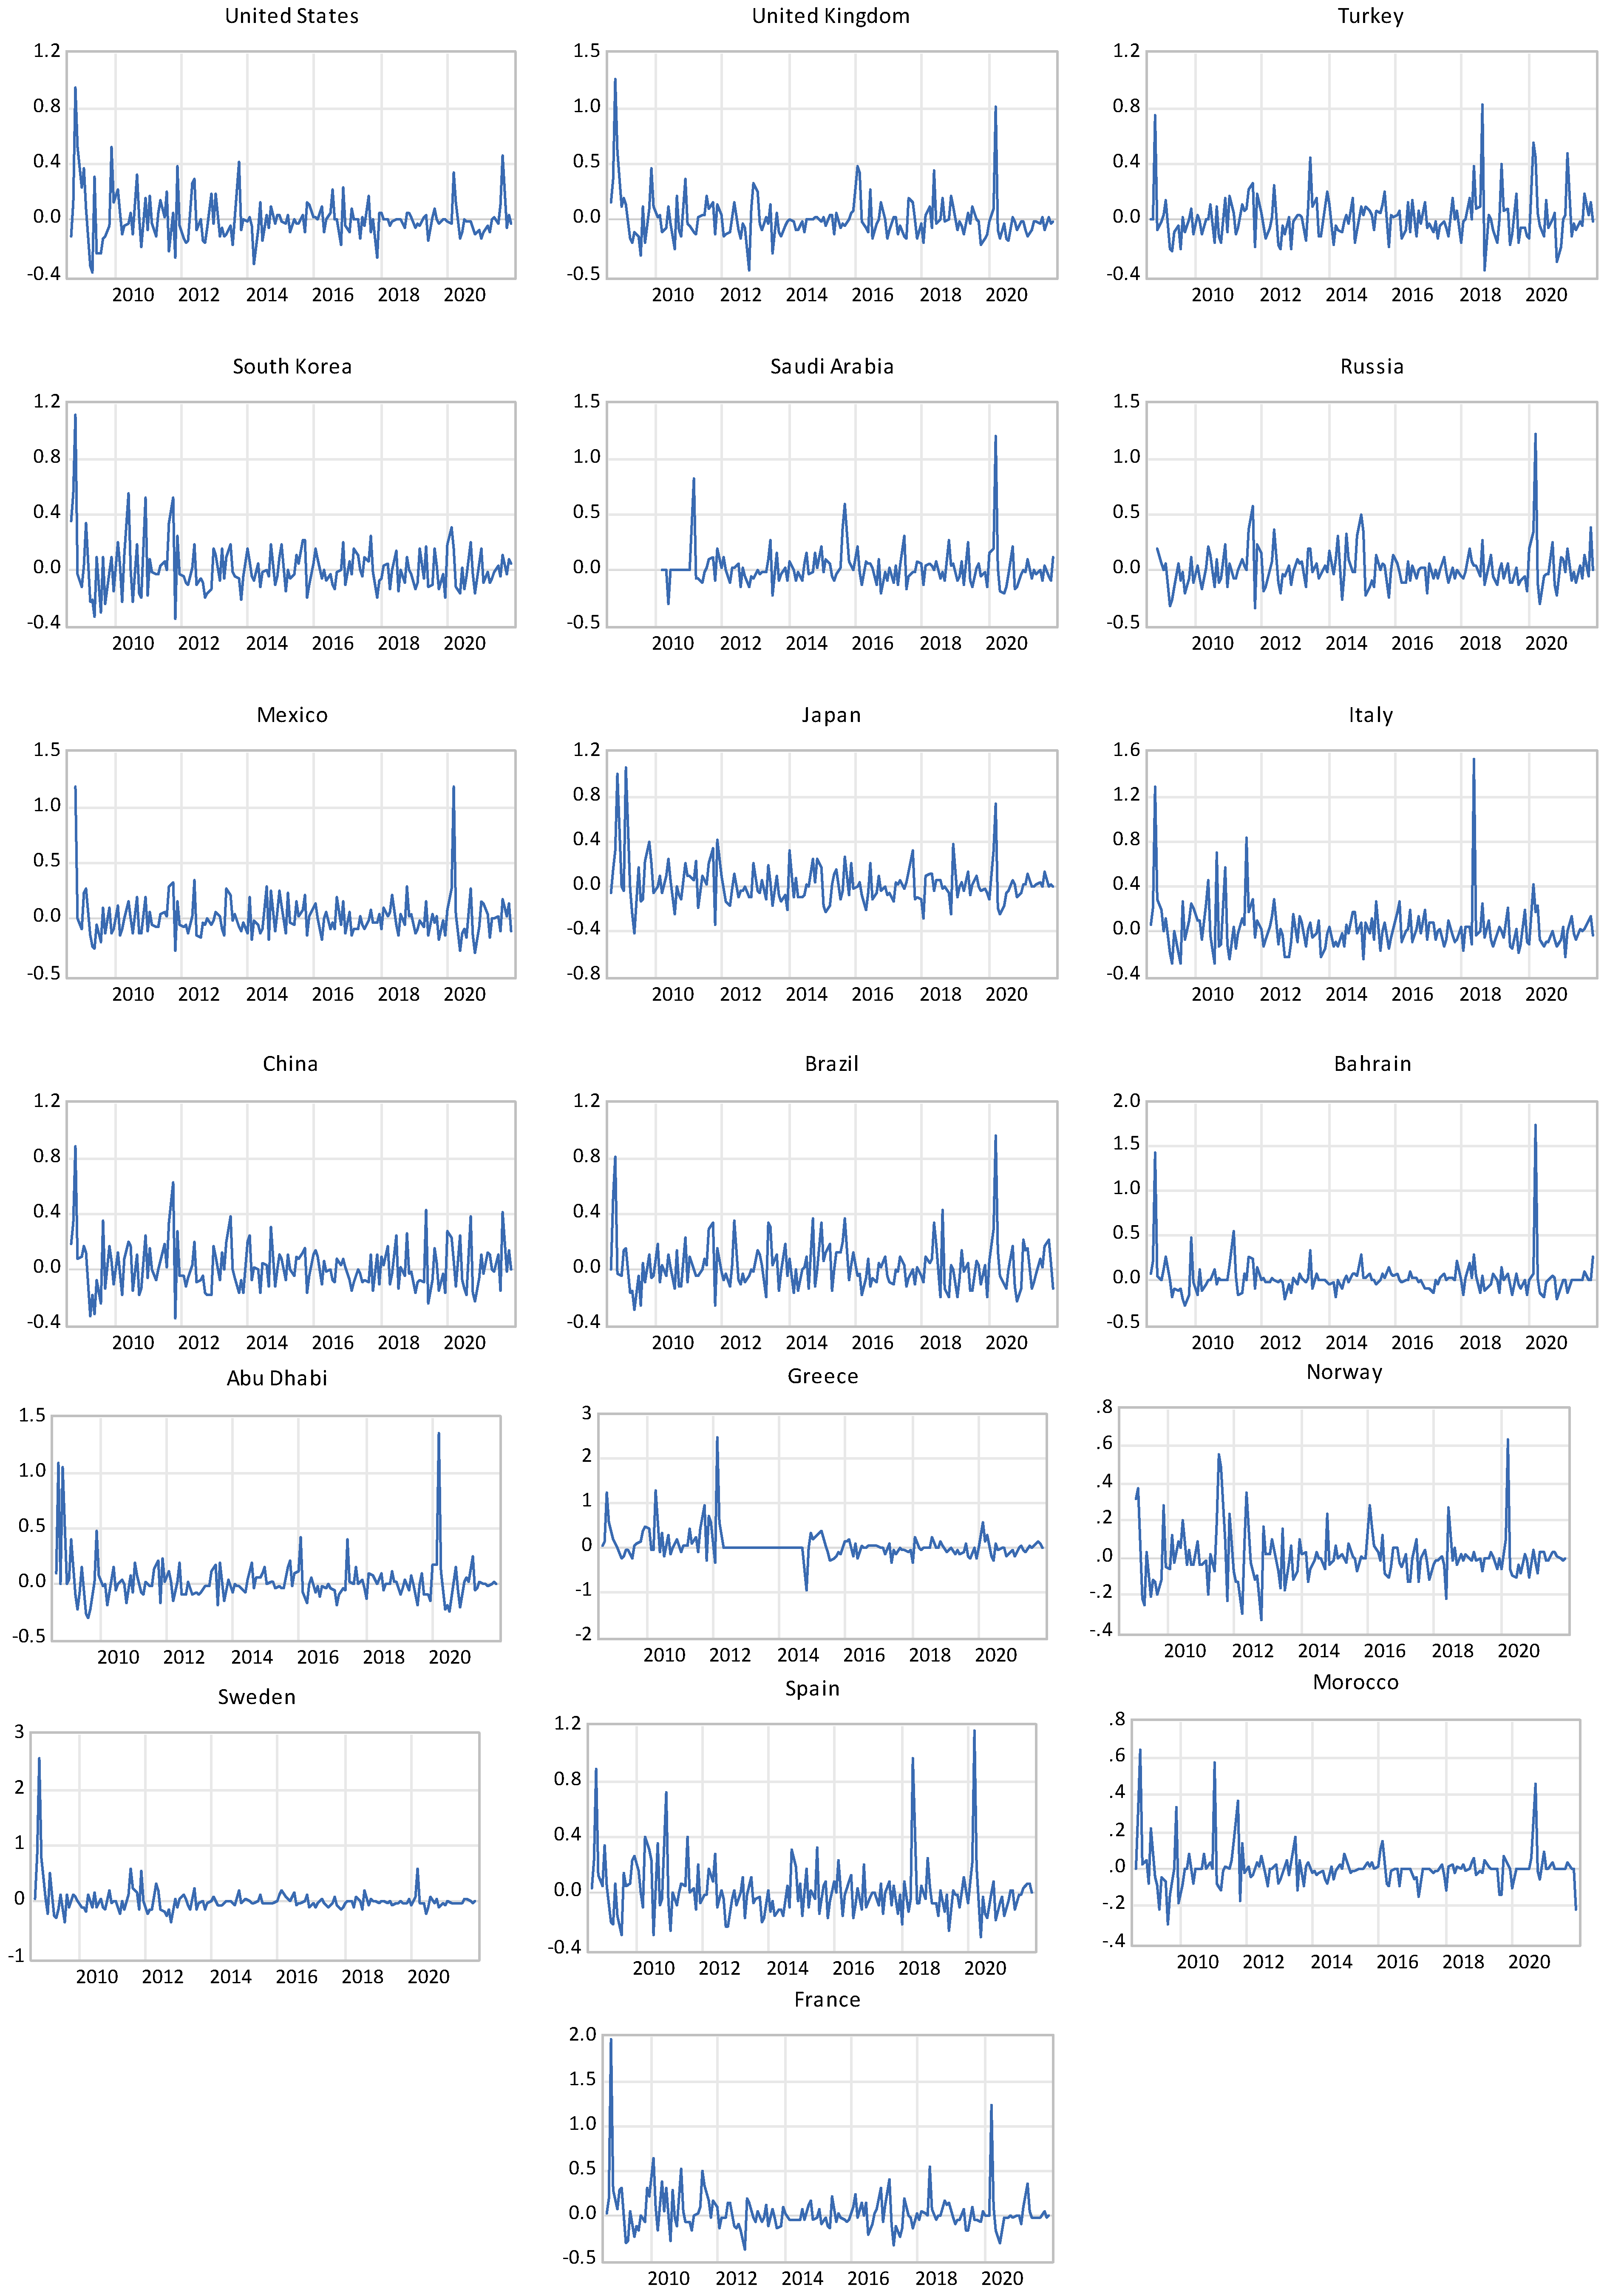
The sovereign credit risk is proxied by using SCDS data with a 5-year maturity, as these contracts are the most liquid in the credit default swap market. The data consist of monthly log-return in SCDS mid-spreads obtained from the Bloomberg database. The availability of liquid SCDS limits the selection of the countries of the study. Figure 2 illustrates the time-varying of SCDSs of nineteen countries (China, Russia, USA, Brazil, UK, South Korea, Mexico, Saudi Arabia, Turkey, Sweden, Spain, Norway, Italy, Morocco, France, Bahrain, Abu Dhabi, Japan, and Greece).
Figure 2 shows that the SCDS spread returns of all countries exhibited a remarkable rise during 2008–2009 when global financial stability risks increased sharply, caused by the global financial crisis. Figure 2 also indicates that SCDS returns of many European countries (e.g., Spain, Italy, and France) exhibited a remarkable surge in early 2020 following Brexit. The SCDS spreads of many sample countries exhibited a remarkable rise in early 2020 following the oil price crash in March 2020 when the spot price for West Texas Intermediate crude oil decreased by 65% from its price in January 2020.

4.2. Preliminary Statistics

Table 1 presents the summary statistics, and preliminary tests of SCDS spread returns and GPR returns.
Table 1 indicates that the standard deviation of SCDS spread returns is the highest in the case of Greece, followed by Italy and Spain. The Kurtosis coefficients for SCDS spread returns are greater than three, and the skewness coefficients for SCDS spreads are different for all datasets. The SCDS spreads returns tend to have heavy tails or outliers. Table 1 points out that the unconditional distribution of SCDSs of all nineteen countries is asymmetric and justifies the use of quantile-on-quantile regression. The Jarque–Bera test confirms the rejection of the normality distribution of all datasets.

5. Empirical Results and Discussion

5.1. Empirical Results

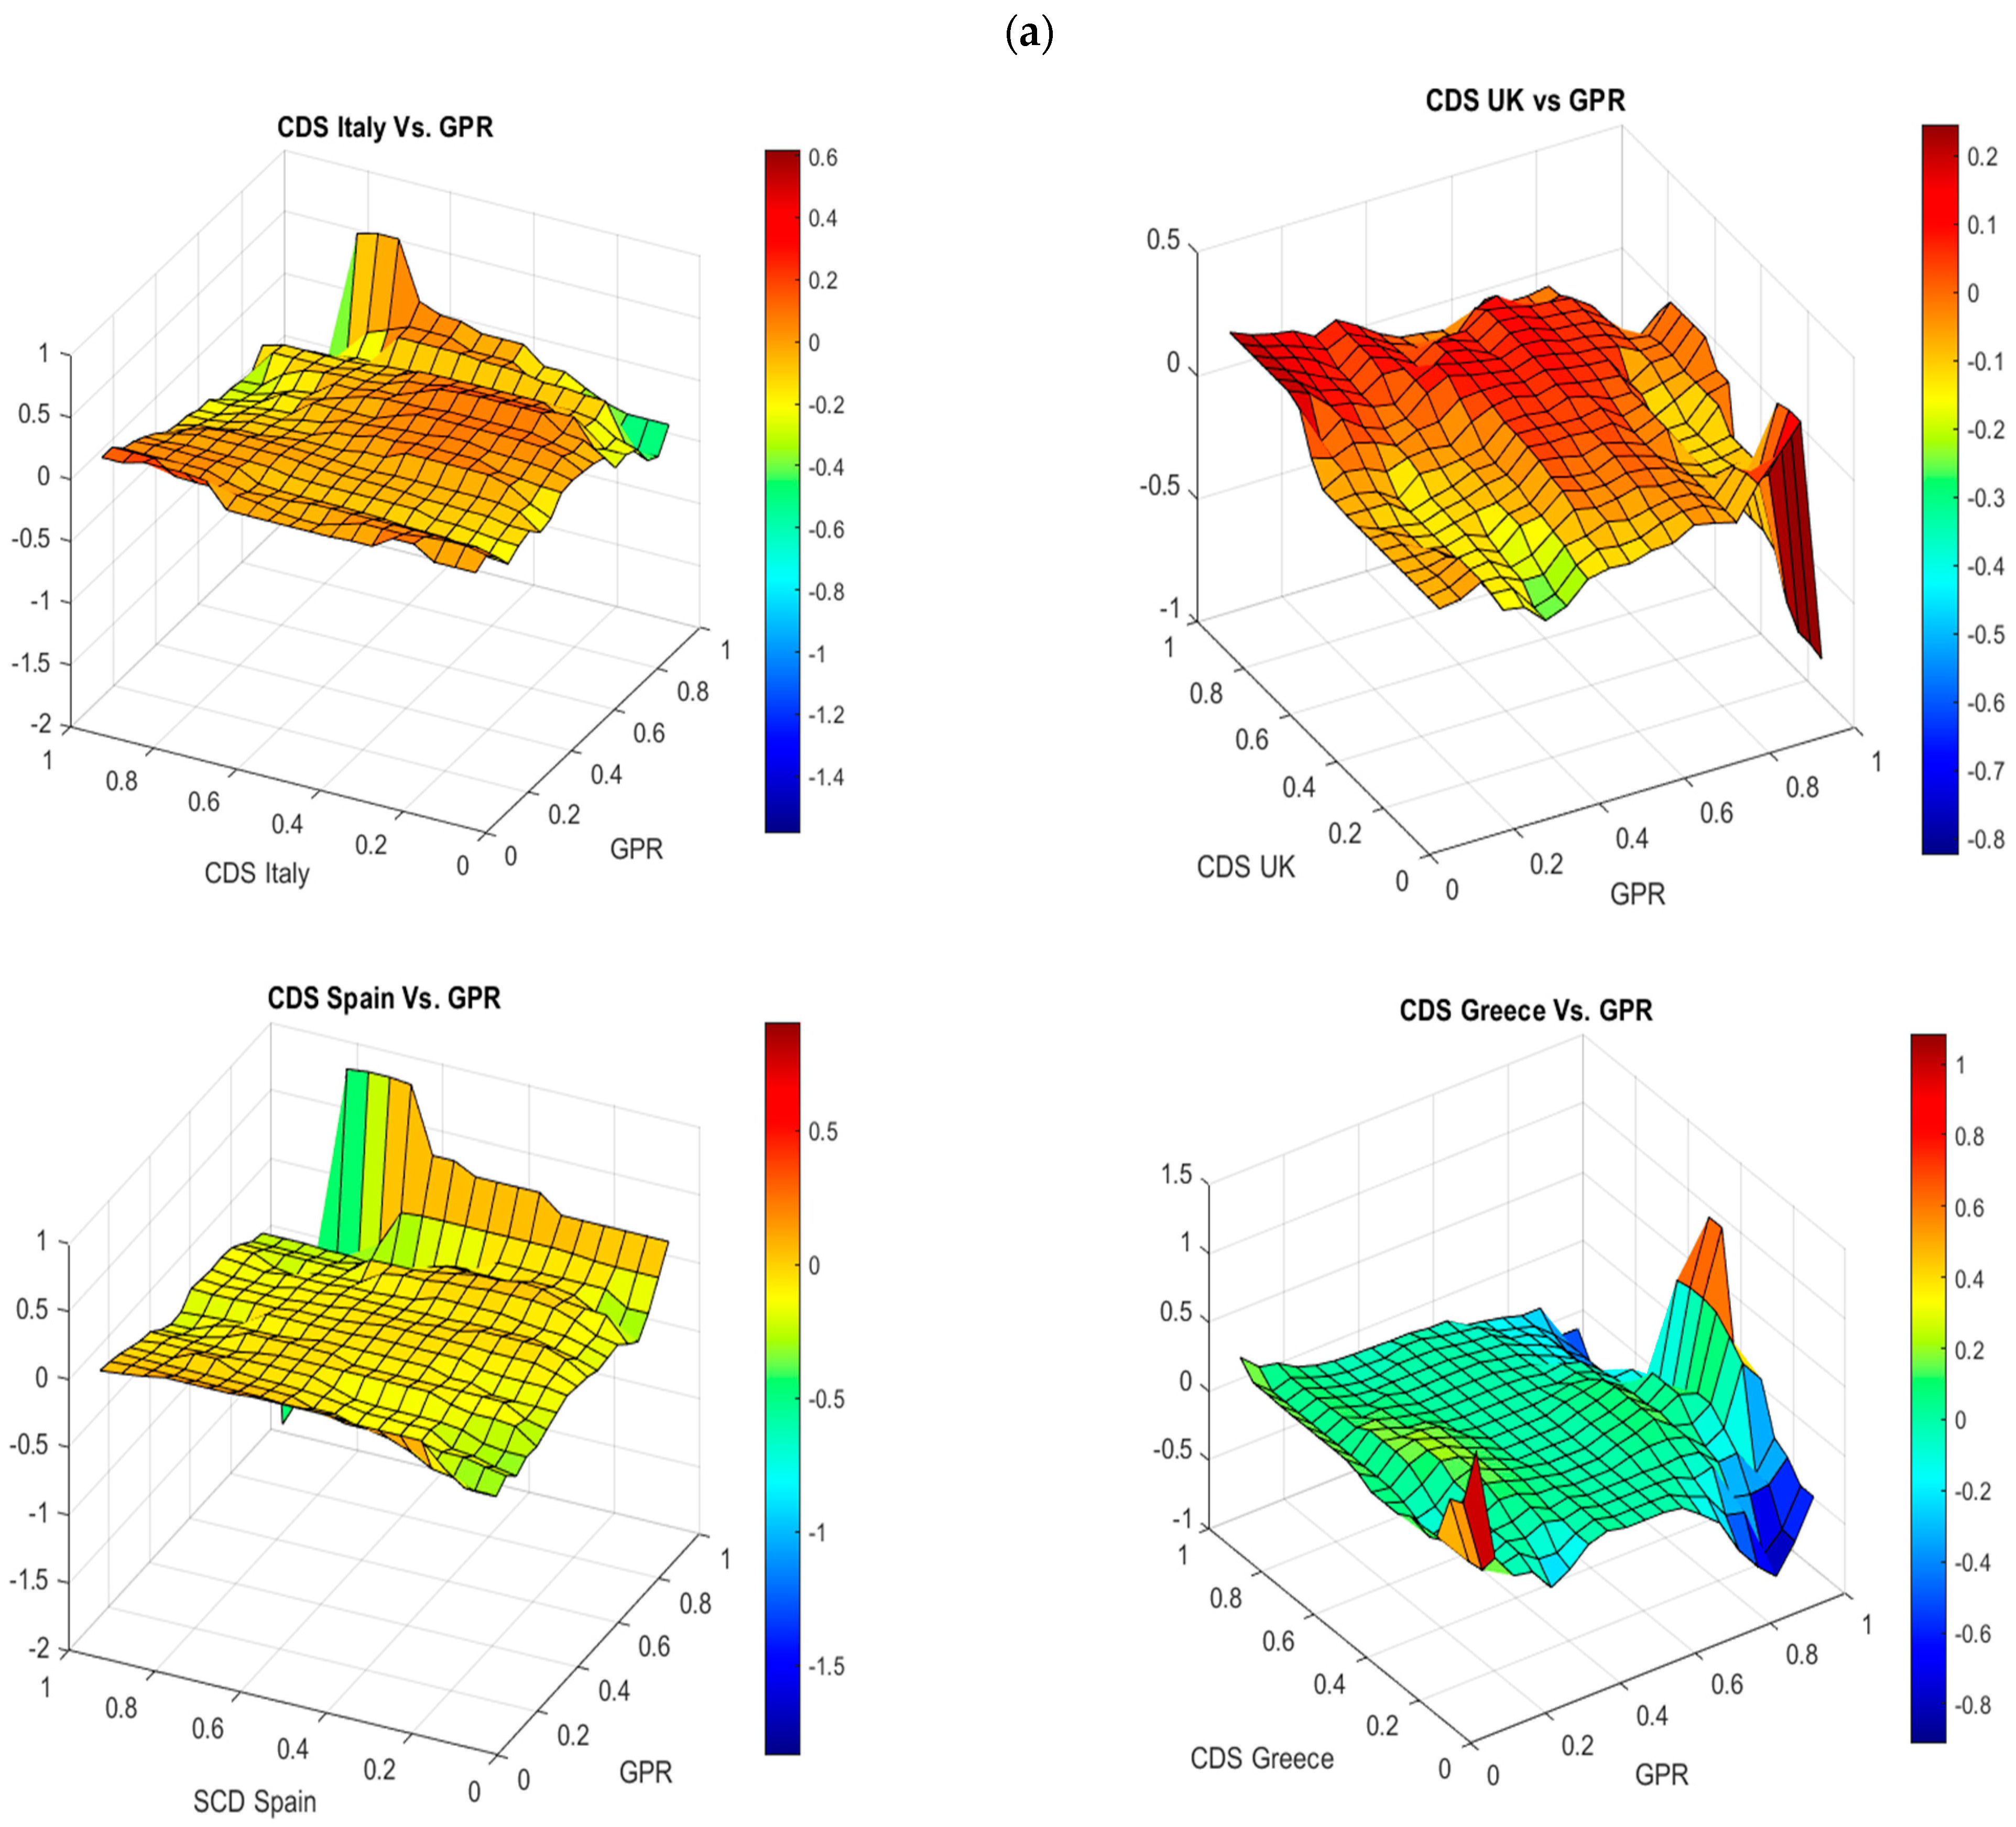
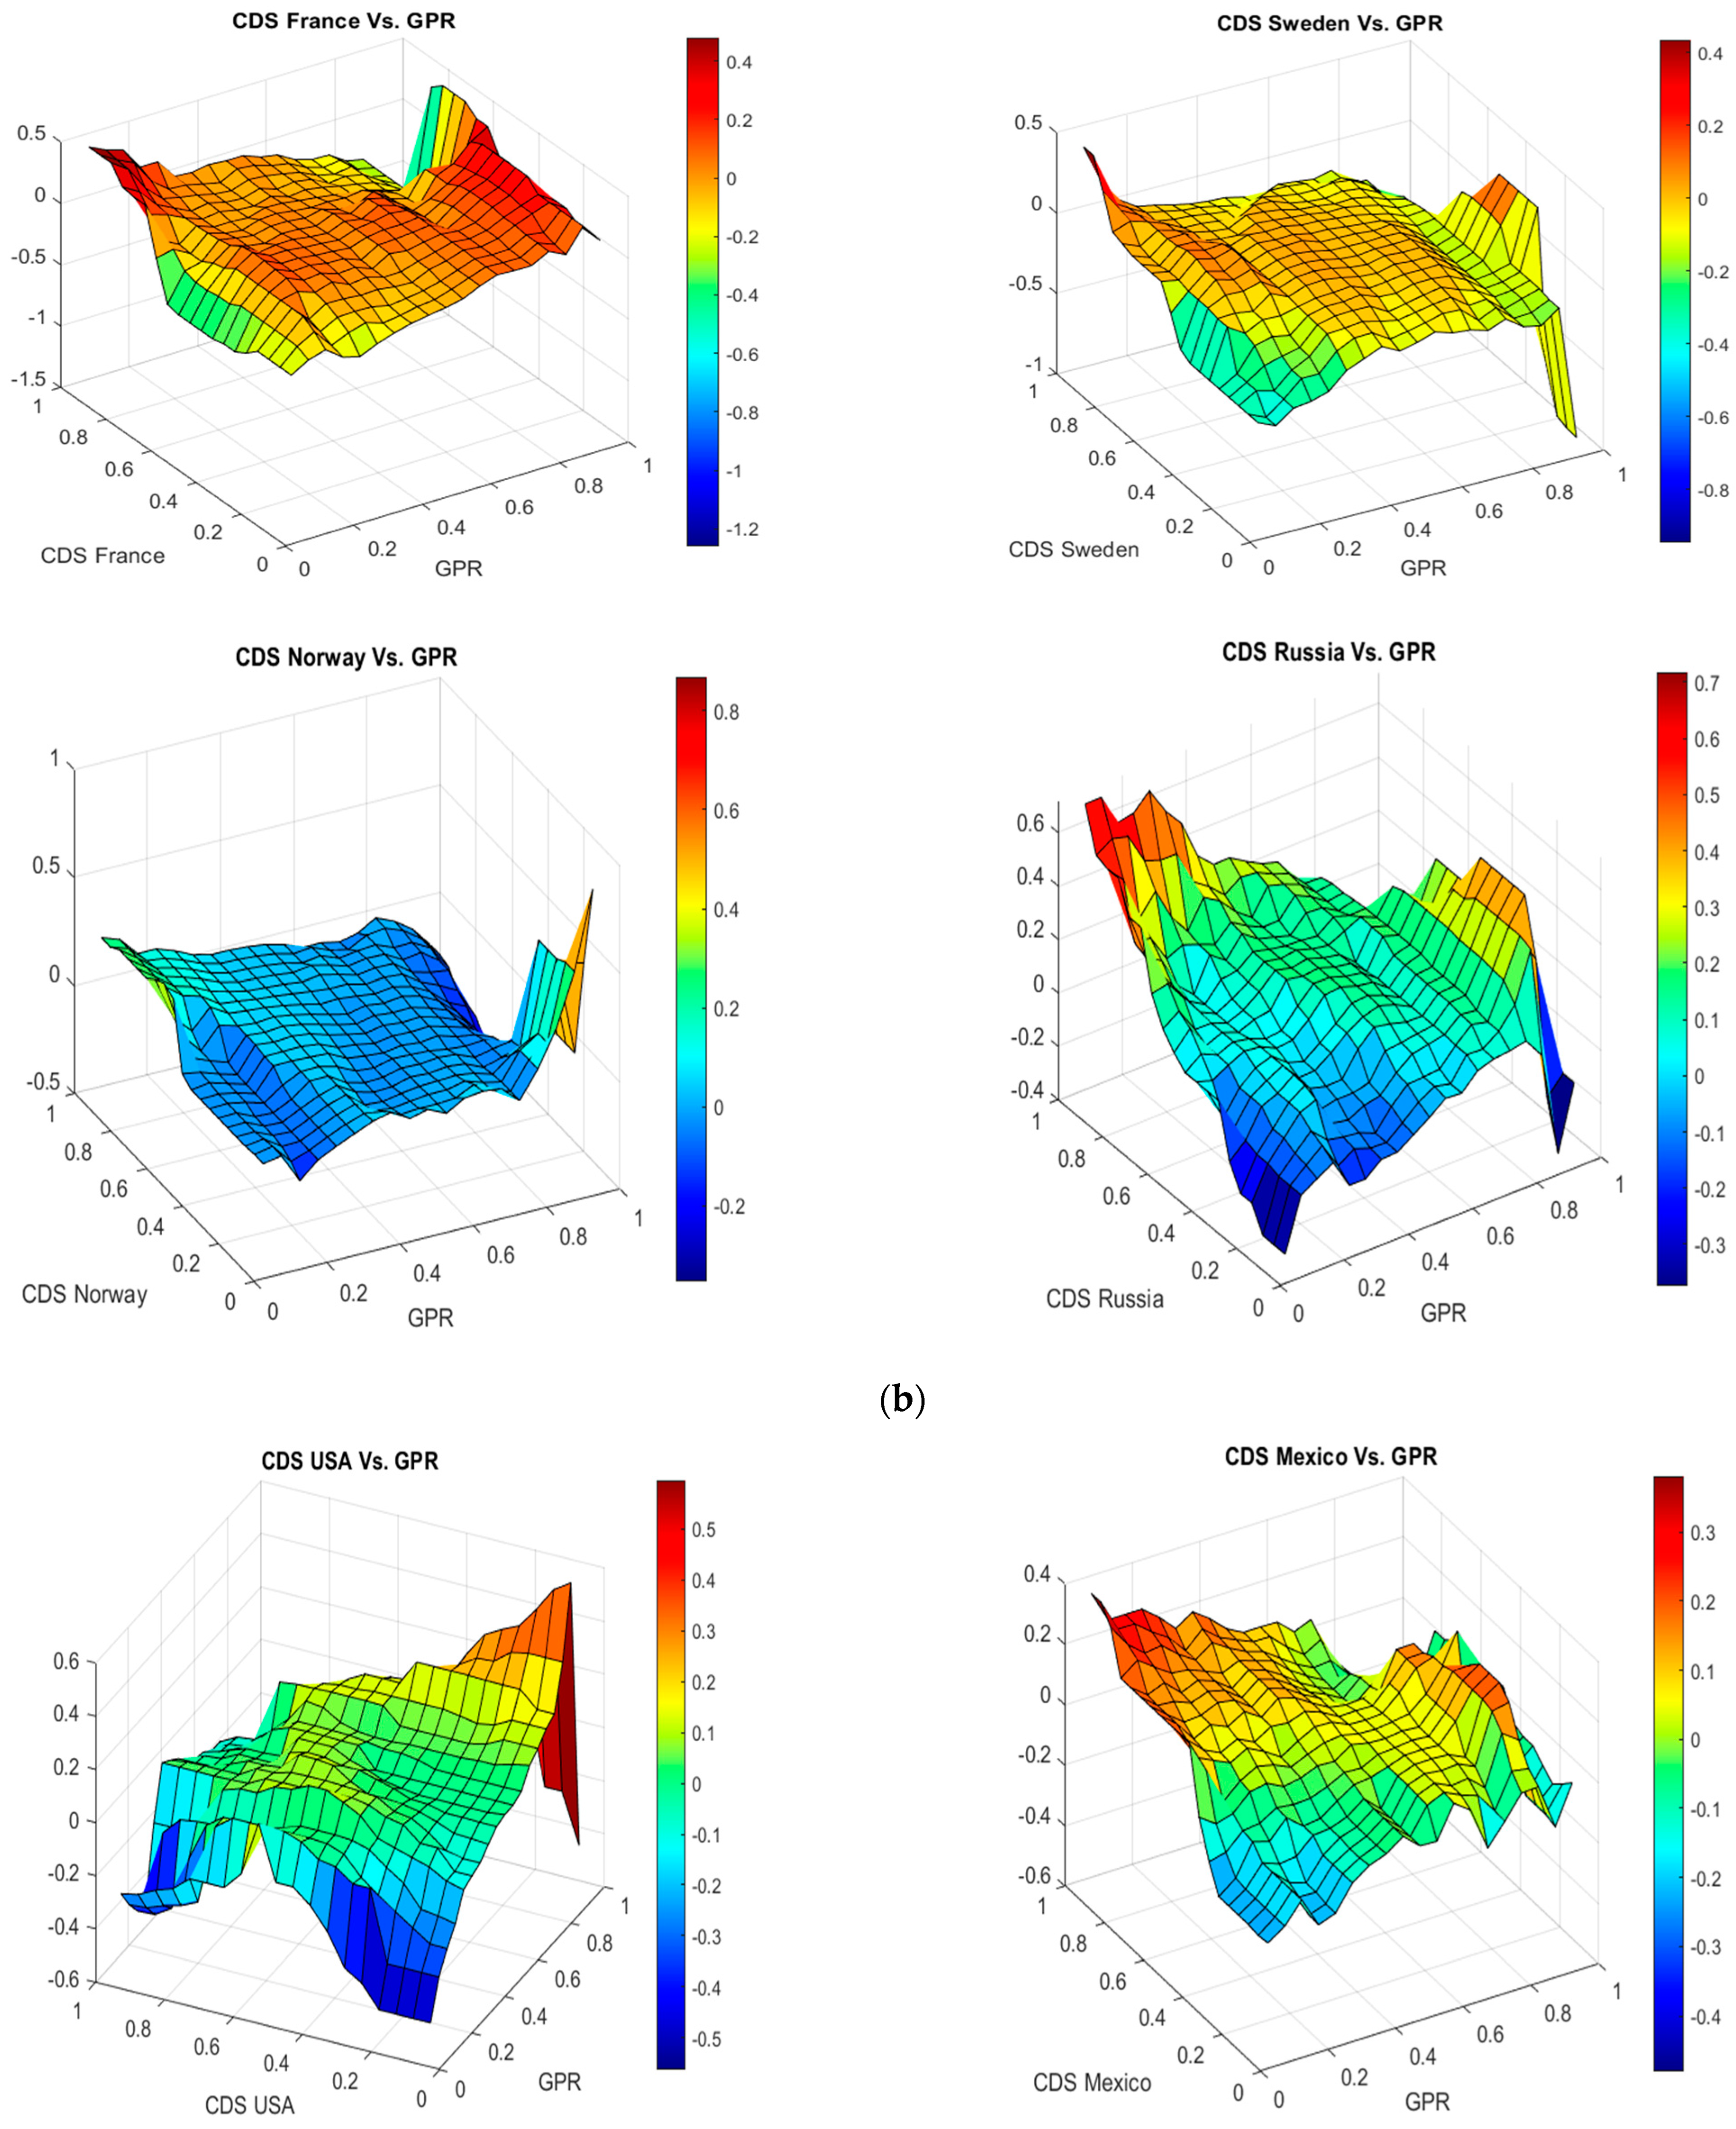
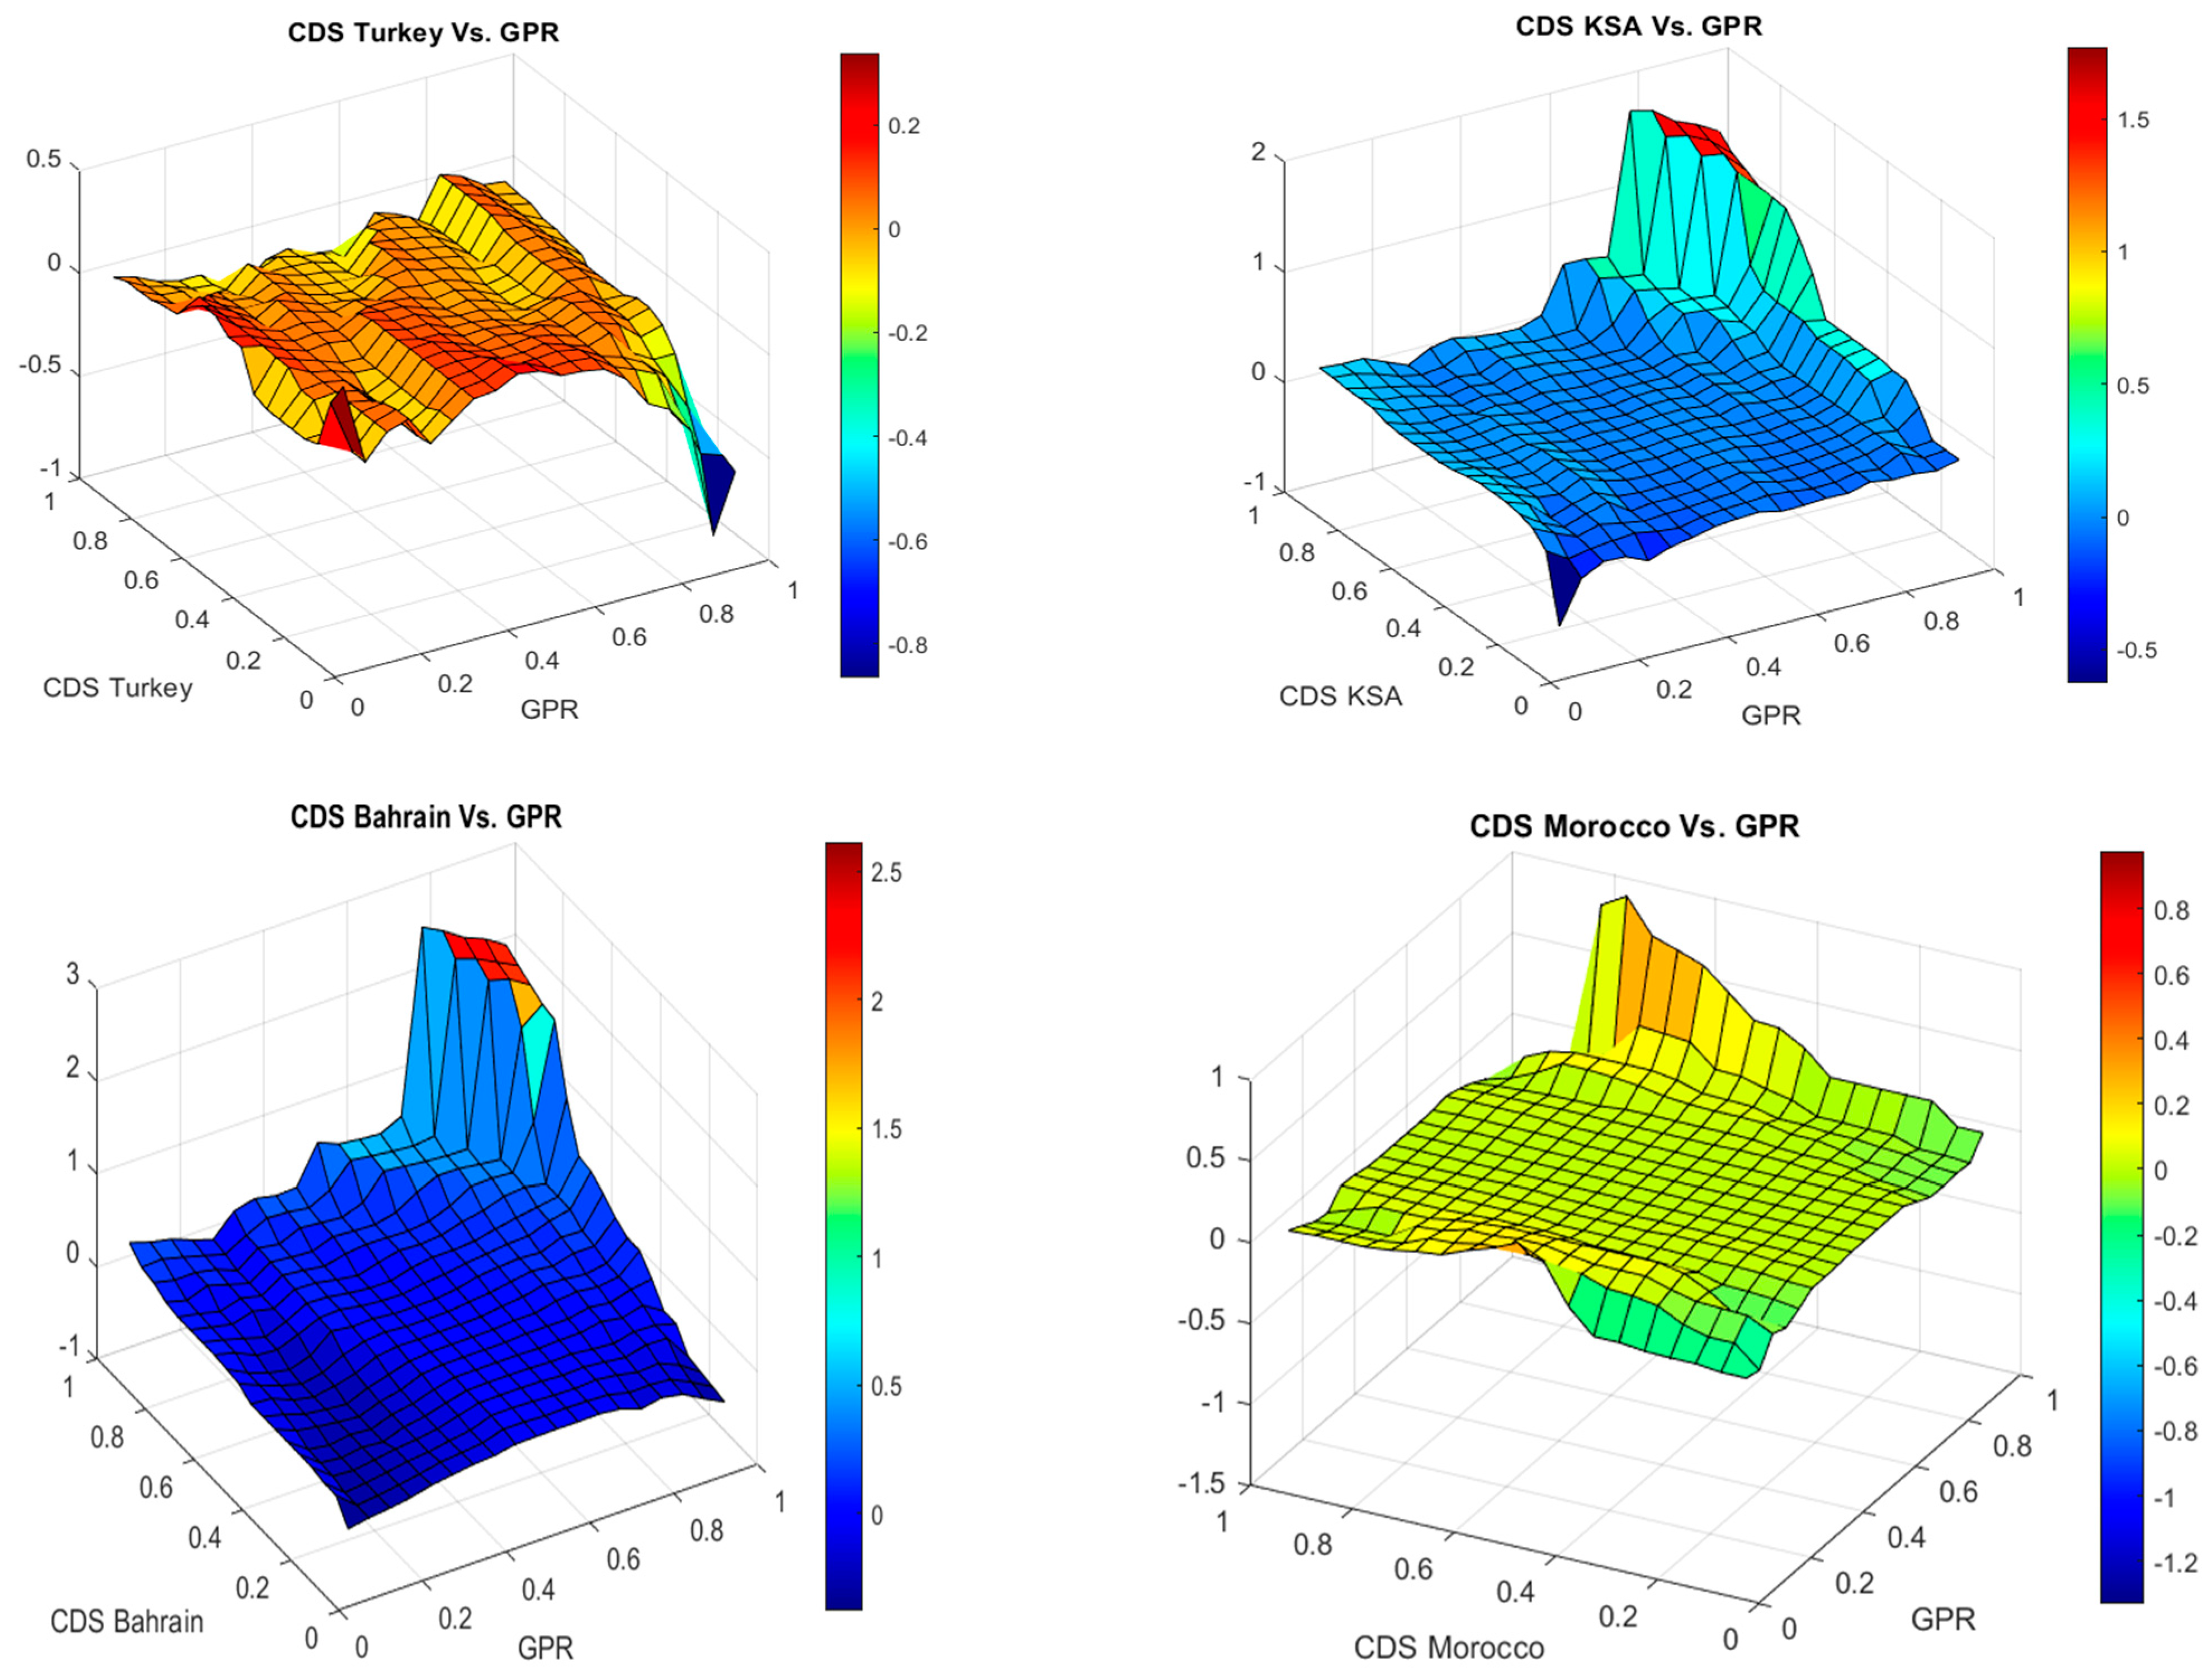
This section investigates the asymmetric co-movement between GPR and SCDSs using QQA for nineteen countries. Figure 3 shows the slope coefficient estimate, which catches the influence of the τth quantile of GPR returns on the θth quantile of the SCDS returns, at various values of θ and τ .

5.2. Results Discussion

Figure 3a illustrates the GPR index’s effect on European countries’ SCDS spread returns. In the case of France, the slope coefficient ranges from −1.4 to 0.6. The impact of the GPR index on SCDS spread return is positive and stable at most combinations of quantiles of SCDS returns and positive and strong in the regions, which combine the upper quantiles of SCDS returns and the upper quantiles of the GPR index. This finding indicates that global geopolitical risk positively affects the SCDS returns in most quantiles. The positive and strong relationship is more pronounced in the extreme upper quantiles of the GPR, and SCDS returns. The impact of the GPR index on Spain’s and Italy’s SCDS spread returns are similar to the impact on France’s SCDS spread returns, and we see a positive and high relationship between the upper quantiles of GPR and SCDS returns. In the case of the UK, the slope coefficient ranges from −0.8 to 0.2. The impact of the GPR index on SCDS spread return is positive, mainly on lower and intermediate quantiles. The impact of GPR is negative and strong in the regions, which combine the lower quantiles of SCDS returns and the upper quantiles of the GPR index. The finding suggests that the GPR impact strongly and positively the UK SCDS spread returns in the lower quantiles of SCDS (when SCDS spreads are low). In the case of Sweden, GPR exhibits a negative or near-zero correlation with SCDS spreads. The negative correlation is more pronounced in the regions, which combine the lower quantiles of SCDS returns and the upper quantiles of the GPR index. In the case of Norway, we notice a negative or near-zero correlation with SCDS spreads at most quantiles but a positive relation in the areas which combine the intermediate quantiles of SCDS returns and the upper quantiles of the GPR index. In the case of Russia, the slope coefficient ranges from −0.3 to 0.7. The impact of the GPR index on Russian SCDS spread return is positive and strong at most combinations of quantiles of SCDS returns. However, we notice a negative relationship in the zones, which combine the lower quantiles of SCDS returns and the lower and upper quantiles of the GPR index. In the case of Greece, we notice a near-zero or slightly positive correlation of GPR with SCDS spreads at most quantiles. When the SCDS market and GPR are both in upper quantiles, the positive impact of the GPR regarding Greece’s sovereign credit risk is more pronounced. These findings are not aligned with Simonyan and Bayraktar’s (2022) results, who find that the geopolitical risk index is insignificant in pricing SCDS spreads of eleven emerging countries.
Figure 3b shows that all SCDSs for American countries (USA, Mexico, Brazil) have a mixed negative and positive relationship with GPR. The strength of these relationships varies across quantiles. The GPR positively and strongly impact the SCDS in Mexico and Brazil when the SCDS is in upper quantiles. The negative relationship is more pronounced in the case of the USA, where both the SCDS and GPR are in a lower quantile. However, we observe a positive relation in the regions, which combine the lower quantiles of SCDS returns and the upper quantiles of the GPR index. These findings show that emerging countries (e.g., Mexico and Brazil) with moderate sovereign wealth funds are more sensitive to the increase of the geopolitical risk.
Figure 3c shows that GPR positively affects the SCDS across most combinations of quantiles of SCDS returns in the case of South Korea, Japan, Morocco, Abu Dhabi, and Turkey. The strength of these conditioned relationships is more pronounced when SCDS and GPR are both in upper quantiles. GPR has a negative impact, generally at most quantiles, in the cases of China, Saudi Arabia, and Bahrain. This finding can be explained by the importance of sovereign wealth funds of these countries that alleviate the impact of global uncertainty factors. According to Sovereign Wealth Fund Institute (SWFI)3, the total assets of the China Investment Corporation are ranked as the first sovereign wealth fund with total assets equal to $1,350,863,000,000, followed by Norway Government Pension Fund Global with total assets equal to $1,136,144,193,600. The GPR positively affects the SCDS in Saudi Arabia and Bahrain only when the SCDS and GPR are both in upper quantiles.

6. Robustness Check of QQA Findings

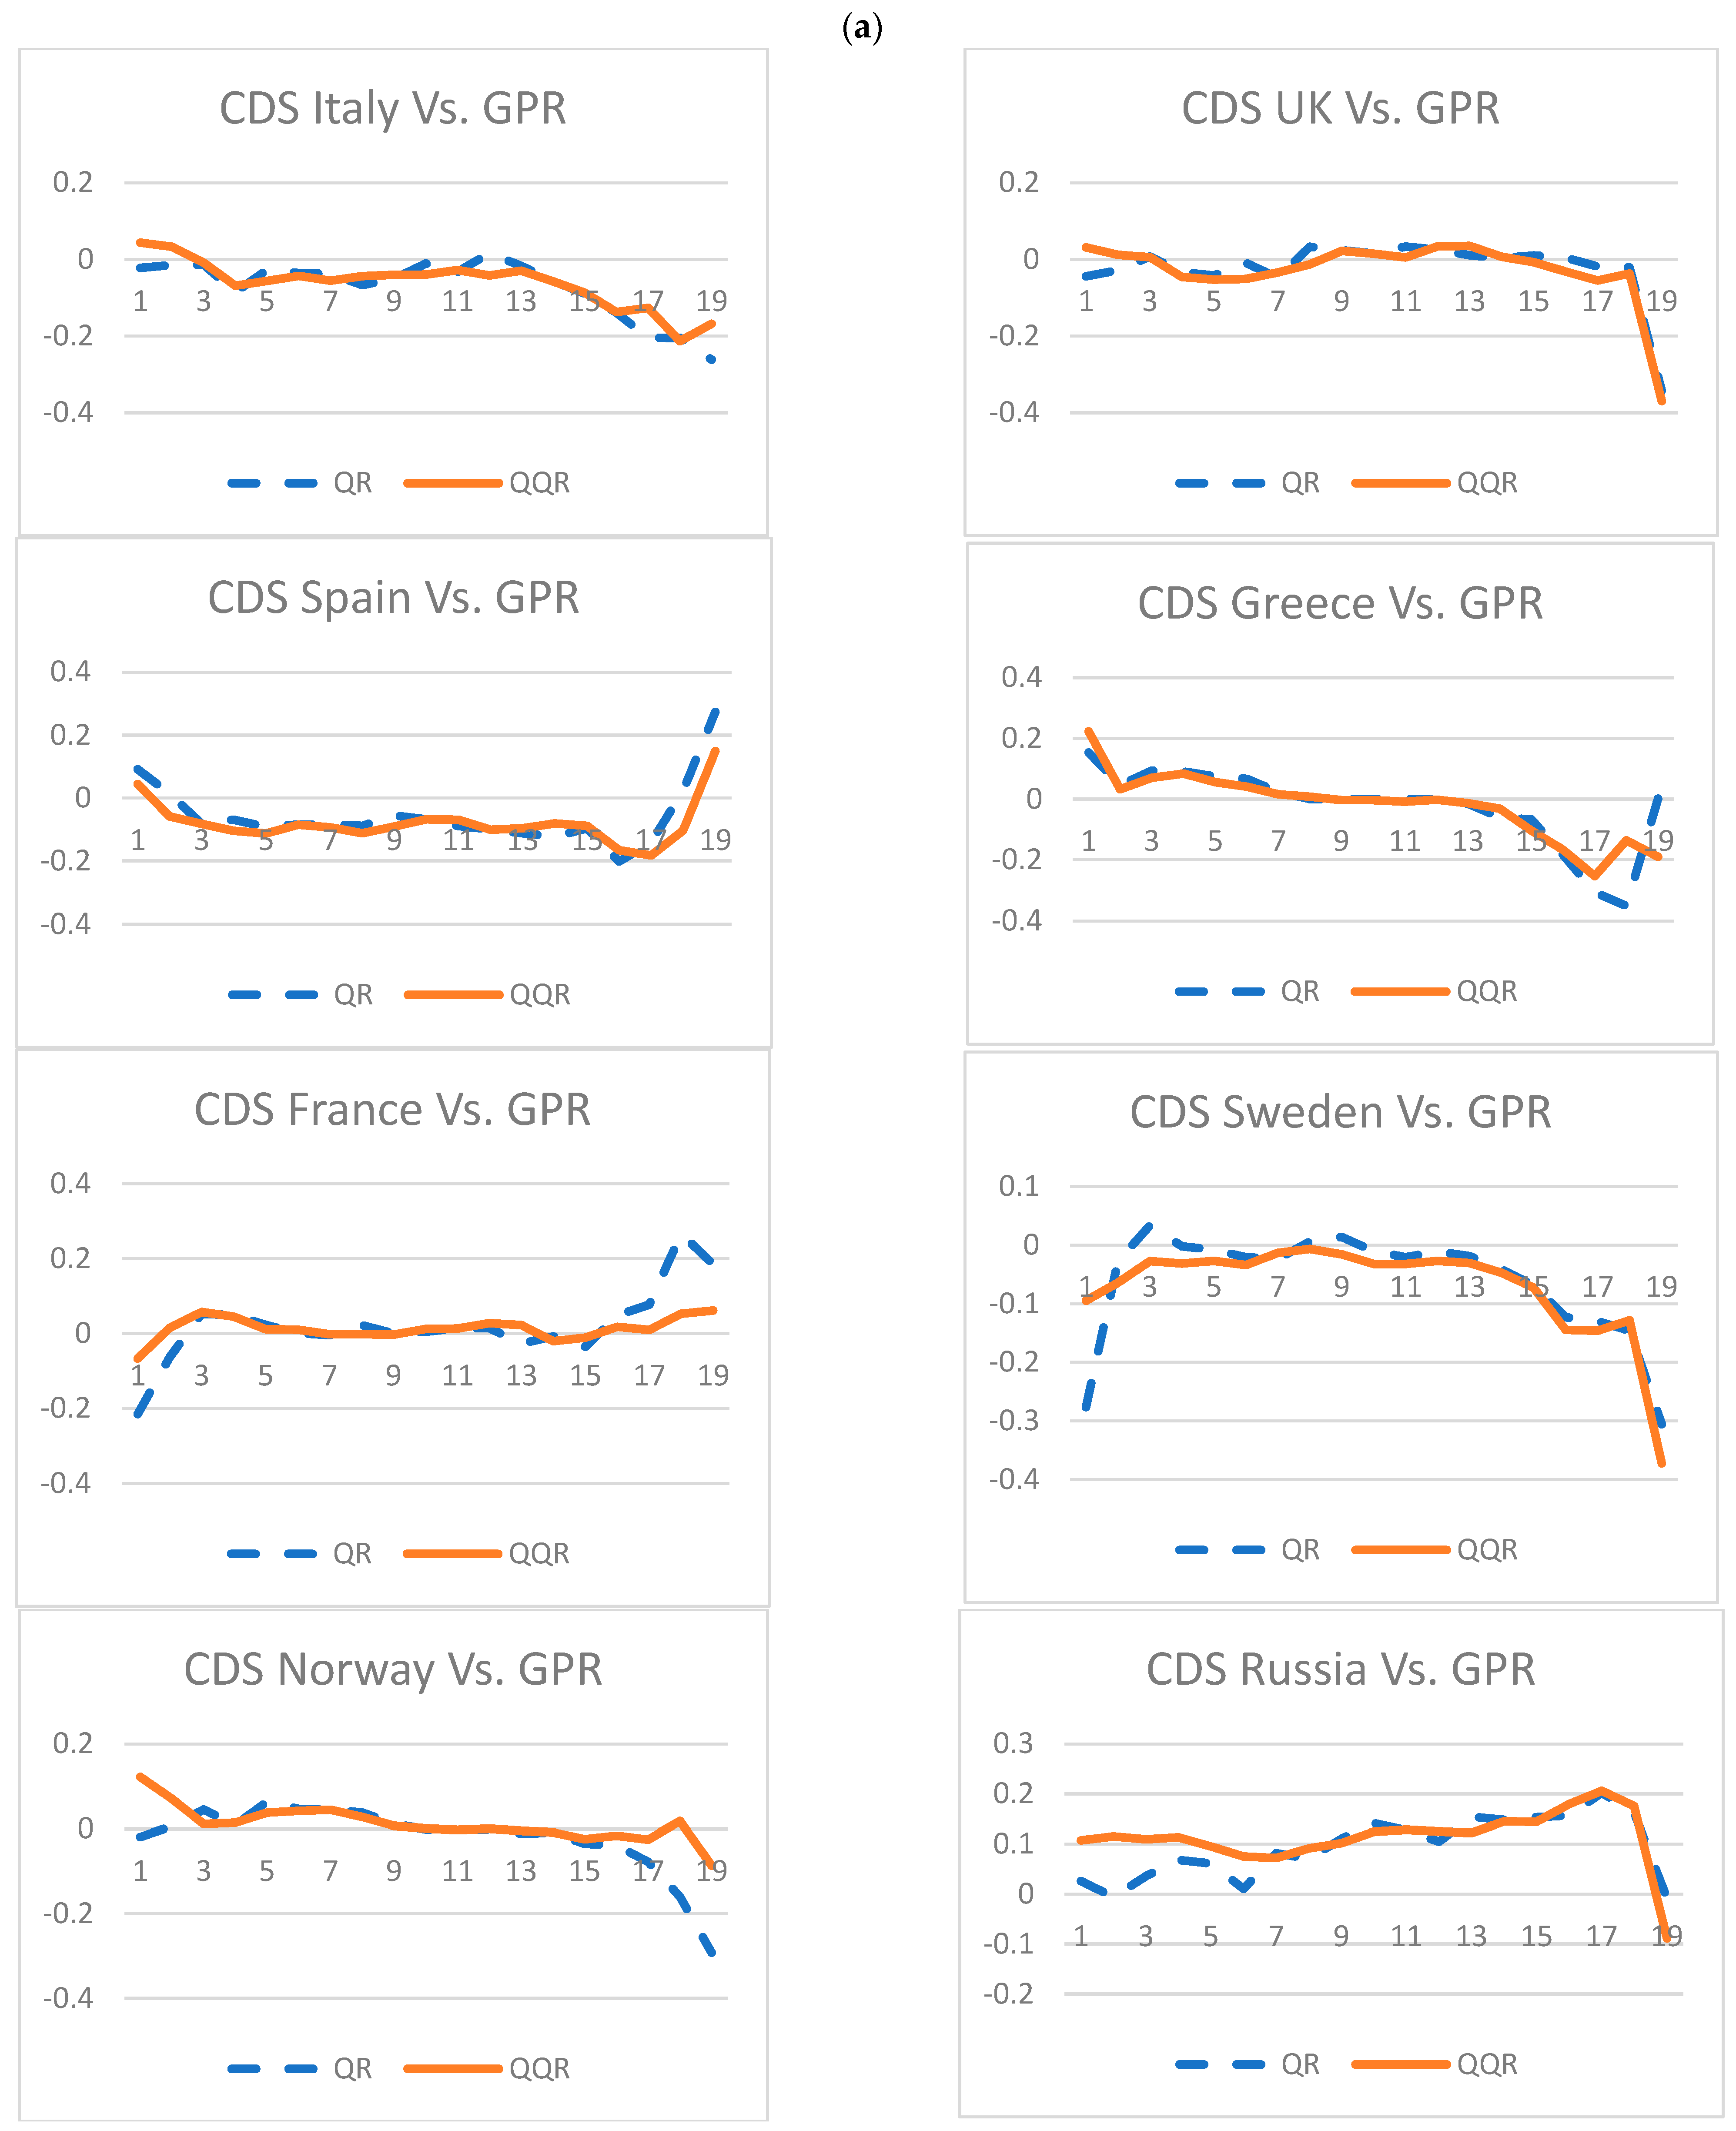
The QQA regresses the θth quantile of SCDS spread returns on the τth quantile of the GPR index returns. Therefore, the quantile regression approach (QR) estimates can be recovered from the QQA estimates. Hence, the QR parameters indexed by θ can be attained by making a simple average of the QQA parameters along with τ . In this situation, we compare the estimated QR parameters with the τ-averaged QQA parameters, and we can check the validity of the QQA estimates. Figure 4 plots the parameters of the QQA and QR approaches.
Figure 4 shows that the average QQA estimates of the slope coefficients have almost the same behavior as the QR estimates for all the SCDSs. Therefore, Figure 4 validates our previous findings of the QQA since the charts indicate that the average QQA estimates of the slope coefficients have approximately the same behavior as QR estimates for all variables. Figure 4 supports our initial finding, as given in Figure 3. In addition, Figure 4 confirms that the effects of GPR on SCDSs were heterogeneous, mainly positive, asymmetric, and varied across quantiles and countries.

7. Conclusions and Recommendations

This paper contributes to the existing literature and presents a piece of novel empirical evidence by investigating the asymmetric co-movement between geopolitical risk and sovereign credit risk for nineteen countries (China, Russia, USA, Brazil, UK, South Korea, Mexico, Saudi Arabia, Turkey, Sweden, Spain, Norway, Italy, Morocco, France, Bahrain, Abu Dhabi, Japan, and Greece). Our findings support our hypotheses and indicate that (i) the GPR affects the dynamics of SCDS spreads in an asymmetric framework; (ii) the effects of GPR on SCDS were heterogeneous, asymmetric, and mainly positive at most combinations of quantiles and varied across countries; (iii) the positive impacts of GPR are more pronounced when the SCDS and GPR are both in upper quantiles; (iv) the countries with the most significant sovereign wealth funds are less affected by geopolitical uncertainty.
The recommendations that can be drawn from our findings are (i) countries should increase the funds of their sovereign wealth funds to solve their illiquidity in bond and credit markets in periods of high geopolitical uncertainty; (ii) sovereign credit risk management activities should be strategically approached based on the expected geopolitical uncertainty level; (iii) the strategies of leading international borrowers should be revised and adjusted following the expected geopolitical uncertainty, since an increase in GPR leads to an increase of sovereign credit risk and adversely affects the funding costs.
Admittedly, the empirical study in this article is limited to nineteen countries, and the extension of the sample, including poor, emerging, and developing economies, can provide more information about the dynamic linkage between GPR and SCDS spreads. Additionally, the study of the extreme time-varying spillovers and connectedness between GPR, SCDS spreads, and global uncertainty variables can provide a clearer picture of the dynamic behavior of GPR and SCDS spreads.

Author Contributions

Conceptualization, N.N.; methodology, N.N.; software, N.N.; validation, N.N.; formal analysis, N.N.; investigation N.N.; resources, S.A.; data curation, S.A.; writing—original draft preparation, N.N.; writing—review and editing, N.N. and S.A.; visualization, N.N.; supervision, N.N.; project administration, N.N.; funding acquisition, N.N. and S.A. All authors have read and agreed to the published version of the manuscript.

Funding

This research was funded by the Deanship of Scientific Research, Imam Mohammad Ibn Saud Islamic University (IMSIU), Saudi Arabia, through Grant No. (221407021).

Data Availability Statement

The data presented in this study are available on request from the corresponding author.

Acknowledgments

The authors extend their appreciation to the Deanship of Scientific Research, Imam Mohammad Ibn Saud Islamic University (IMSIU), Saudi Arabia, for funding this research work through Grant No. (221407021).

Conflicts of Interest

The authors declare no conflict of interest.

Notes

1
Kernel Function is a method used to take data as input and transform it into the required form of processing data.
2
The index was downloaded from https://www.matteoiacoviello.com/gpr.htm on 15 November 2022. The index construction is based on counting the number of articles related to adverse geopolitical events in ten newspapers for each month.
3

References

  1. Abid, Fathi, and Nader Naifar. 2006. The determinants of credit default swap rates: An explanatory study. International Journal of Theoretical and Applied Finance 9: 23–42. [Google Scholar] [CrossRef]
  2. Alam, Ahmed W., Reza Houston, and Ashupta Farjana. 2023. Geopolitical risk and corporate investment: How do politically connected firms respond? Finance Research Letters, 103681. [Google Scholar] [CrossRef]
  3. Amstad, Marlene, Eli Remolona, and Jimmy Shek. 2016. How do global investors differentiate between sovereign risks? The new normal versus the old. Journal of International Money and Finance 66: 32–48. [Google Scholar] [CrossRef] [Green Version]
  4. Arora, Nisha, and Pankaj Deep Kaur. 2020. A Bolasso based consistent feature selection enabled random forest classification algorithm: An application to credit risk assessment. Applied Soft Computing 86: 105936. [Google Scholar] [CrossRef]
  5. Bloom, Nicholas. 2009. The impact of uncertainty shocks. Econometrica 77: 623–85. [Google Scholar]
  6. Bouri, Elie, Syed Jawad Hussain Shahzad, Naveed Raza, and David Roubaud. 2018. Oil volatility and sovereign risk of BRICS. Energy Economics 70: 258–69. [Google Scholar] [CrossRef]
  7. Bratis, Theodore D., Georgios P. Kouretas, Nikiforos Laopodis, and Prodromos Vlamis. 2021. Sovereign Credit and Geopolitical Risks during and after the EMU Crisis. December 30. Available online: https://ssrn.com/abstract=4051483 (accessed on 4 December 2022).
  8. Caldara, Dario, and Matteo Iacoviello. 2022. Measuring geopolitical risk. American Economic Review 112: 1194–225. [Google Scholar] [CrossRef]
  9. Cheng, Chak Hung Jack, and Ching-Wai Jeremy Chiu. 2018. How important are global geopolitical risks to emerging countries? International Economics 156: 305–25. [Google Scholar] [CrossRef]
  10. Chuffart, Thomas, and Emma Hooper. 2019. An investigation of oil prices impact on sovereign credit default swaps in Russia and Venezuela. Energy Economics 80: 904–16. [Google Scholar] [CrossRef]
  11. Dickey, David A., and Wayne A. Fuller. 1979. Distribution of the estimators for autoregressive time series with a unit root. Journal of the American Statistical Association 74: 427–431. [Google Scholar]
  12. Eyssell, Thomas, Hung-Gay Fung, and Gaiyan Zhang. 2013. Determinants and price discovery of China sovereign credit default swaps. China Economic Review 24: 1–15. [Google Scholar] [CrossRef]
  13. Feng, Chaonan, Liyan Han, Samuel Vigne, and Yang Xu. 2023. Geopolitical risk and the dynamics of international capital flows. Journal of International Financial Markets, Institutions and Money 82: 101693. [Google Scholar] [CrossRef]
  14. Hilscher, Jens, and Yves Nosbusch. 2010. Determinants of sovereign risk: Macroeconomic fundamentals and the pricing of sovereign debt. Review of Finance 14: 235–62. [Google Scholar] [CrossRef] [Green Version]
  15. Jarrow, Robert, and Philip Protter. 2004. A short history of stochastic integration and mathematical finance: The early years, 1880–970. Lecture Notes-Monograph Series 45: 75–91. [Google Scholar]
  16. Kartal, Mustafa Tevfik. 2020. The Behavior of Sovereign Credit Default Swaps (CDS) Spread: Evidence from Turkey with the Effect of COVID-19 Pandemic. Available online: https://ssrn.com/abstract=3642652 (accessed on 10 January 2023).
  17. Lee, Jongsub, Andy Naranjo, and Stace Sirmans. 2016. Exodus from sovereign risk: Global asset and information networks in the pricing of corporate credit risk. The Journal of Finance 71: 1813–56. [Google Scholar] [CrossRef]
  18. Liu, Yang, and Bruce Morley. 2012. Sovereign credit default swaps and the macroeconomy. Applied Economics Letters 19: 129–32. [Google Scholar] [CrossRef] [Green Version]
  19. Longstaff, Francis A., Jun Pan, Lasse H. Pedersen, and Kenneth J. Singleton. 2011. How sovereign is sovereign credit risk? American Economic Journal: Macroeconomics 3: 75–103. [Google Scholar] [CrossRef] [Green Version]
  20. Ma, Jason Z., Xiang Deng, Kung-Cheng Ho, and Sang-Bing Tsai. 2018. Regime-switching determinants for spreads of emerging markets sovereign credit default swaps. Sustainability 10: 2730. [Google Scholar] [CrossRef] [Green Version]
  21. Merton, Robert C. 1974. On the pricing of corporate debt: The risk structure of interest rates. The Journal of Finance 29: 449–70. [Google Scholar]
  22. Naifar, Nader. 2020. What explains the sovereign credit default swap spreads changes in the GCC region? Journal of Risk and Financial Management 13: 245. [Google Scholar] [CrossRef]
  23. Oliveira, Luís, José Dias Curto, and João Pedro Nunes. 2012. The determinants of sovereign credit spread changes in the Euro-zone. Journal of International Financial Markets, Institutions and Money 22: 278–304. [Google Scholar] [CrossRef]
  24. Pan, Jun, and Kenneth J. Singleton. 2008. Default and Recovery Implicit in the Term Structure of Sovereign CDS Spreads. Journal of Finance 63: 2345–84. [Google Scholar] [CrossRef] [Green Version]
  25. Rikhotso, Prayer M., and Beatrice D. Simo-Kengne. 2022. Dependence structures between Sovereign credit default swaps and global risk factors in BRICS countries. Journal of Risk and Financial Management 15: 109. [Google Scholar] [CrossRef]
  26. Sim, Nicholas, and Hongtao Zhou. 2015. Oil prices, US stock returns, and the dependence between their quantiles. Journal of Banking and Finance 55: 1–8. [Google Scholar] [CrossRef]
  27. Simonyan, Serdar, and Sema Bayraktar. 2022. Asymmetric dynamics in sovereign credit default swaps pricing: Evidence from emerging countries. International Journal of Emerging Markets, ahead-of-print. [Google Scholar]
  28. Stolbov, Mikhail. 2017. Determinants of sovereign credit risk: The case of Russia. Post-Communist Economies 29: 51–70. [Google Scholar] [CrossRef]
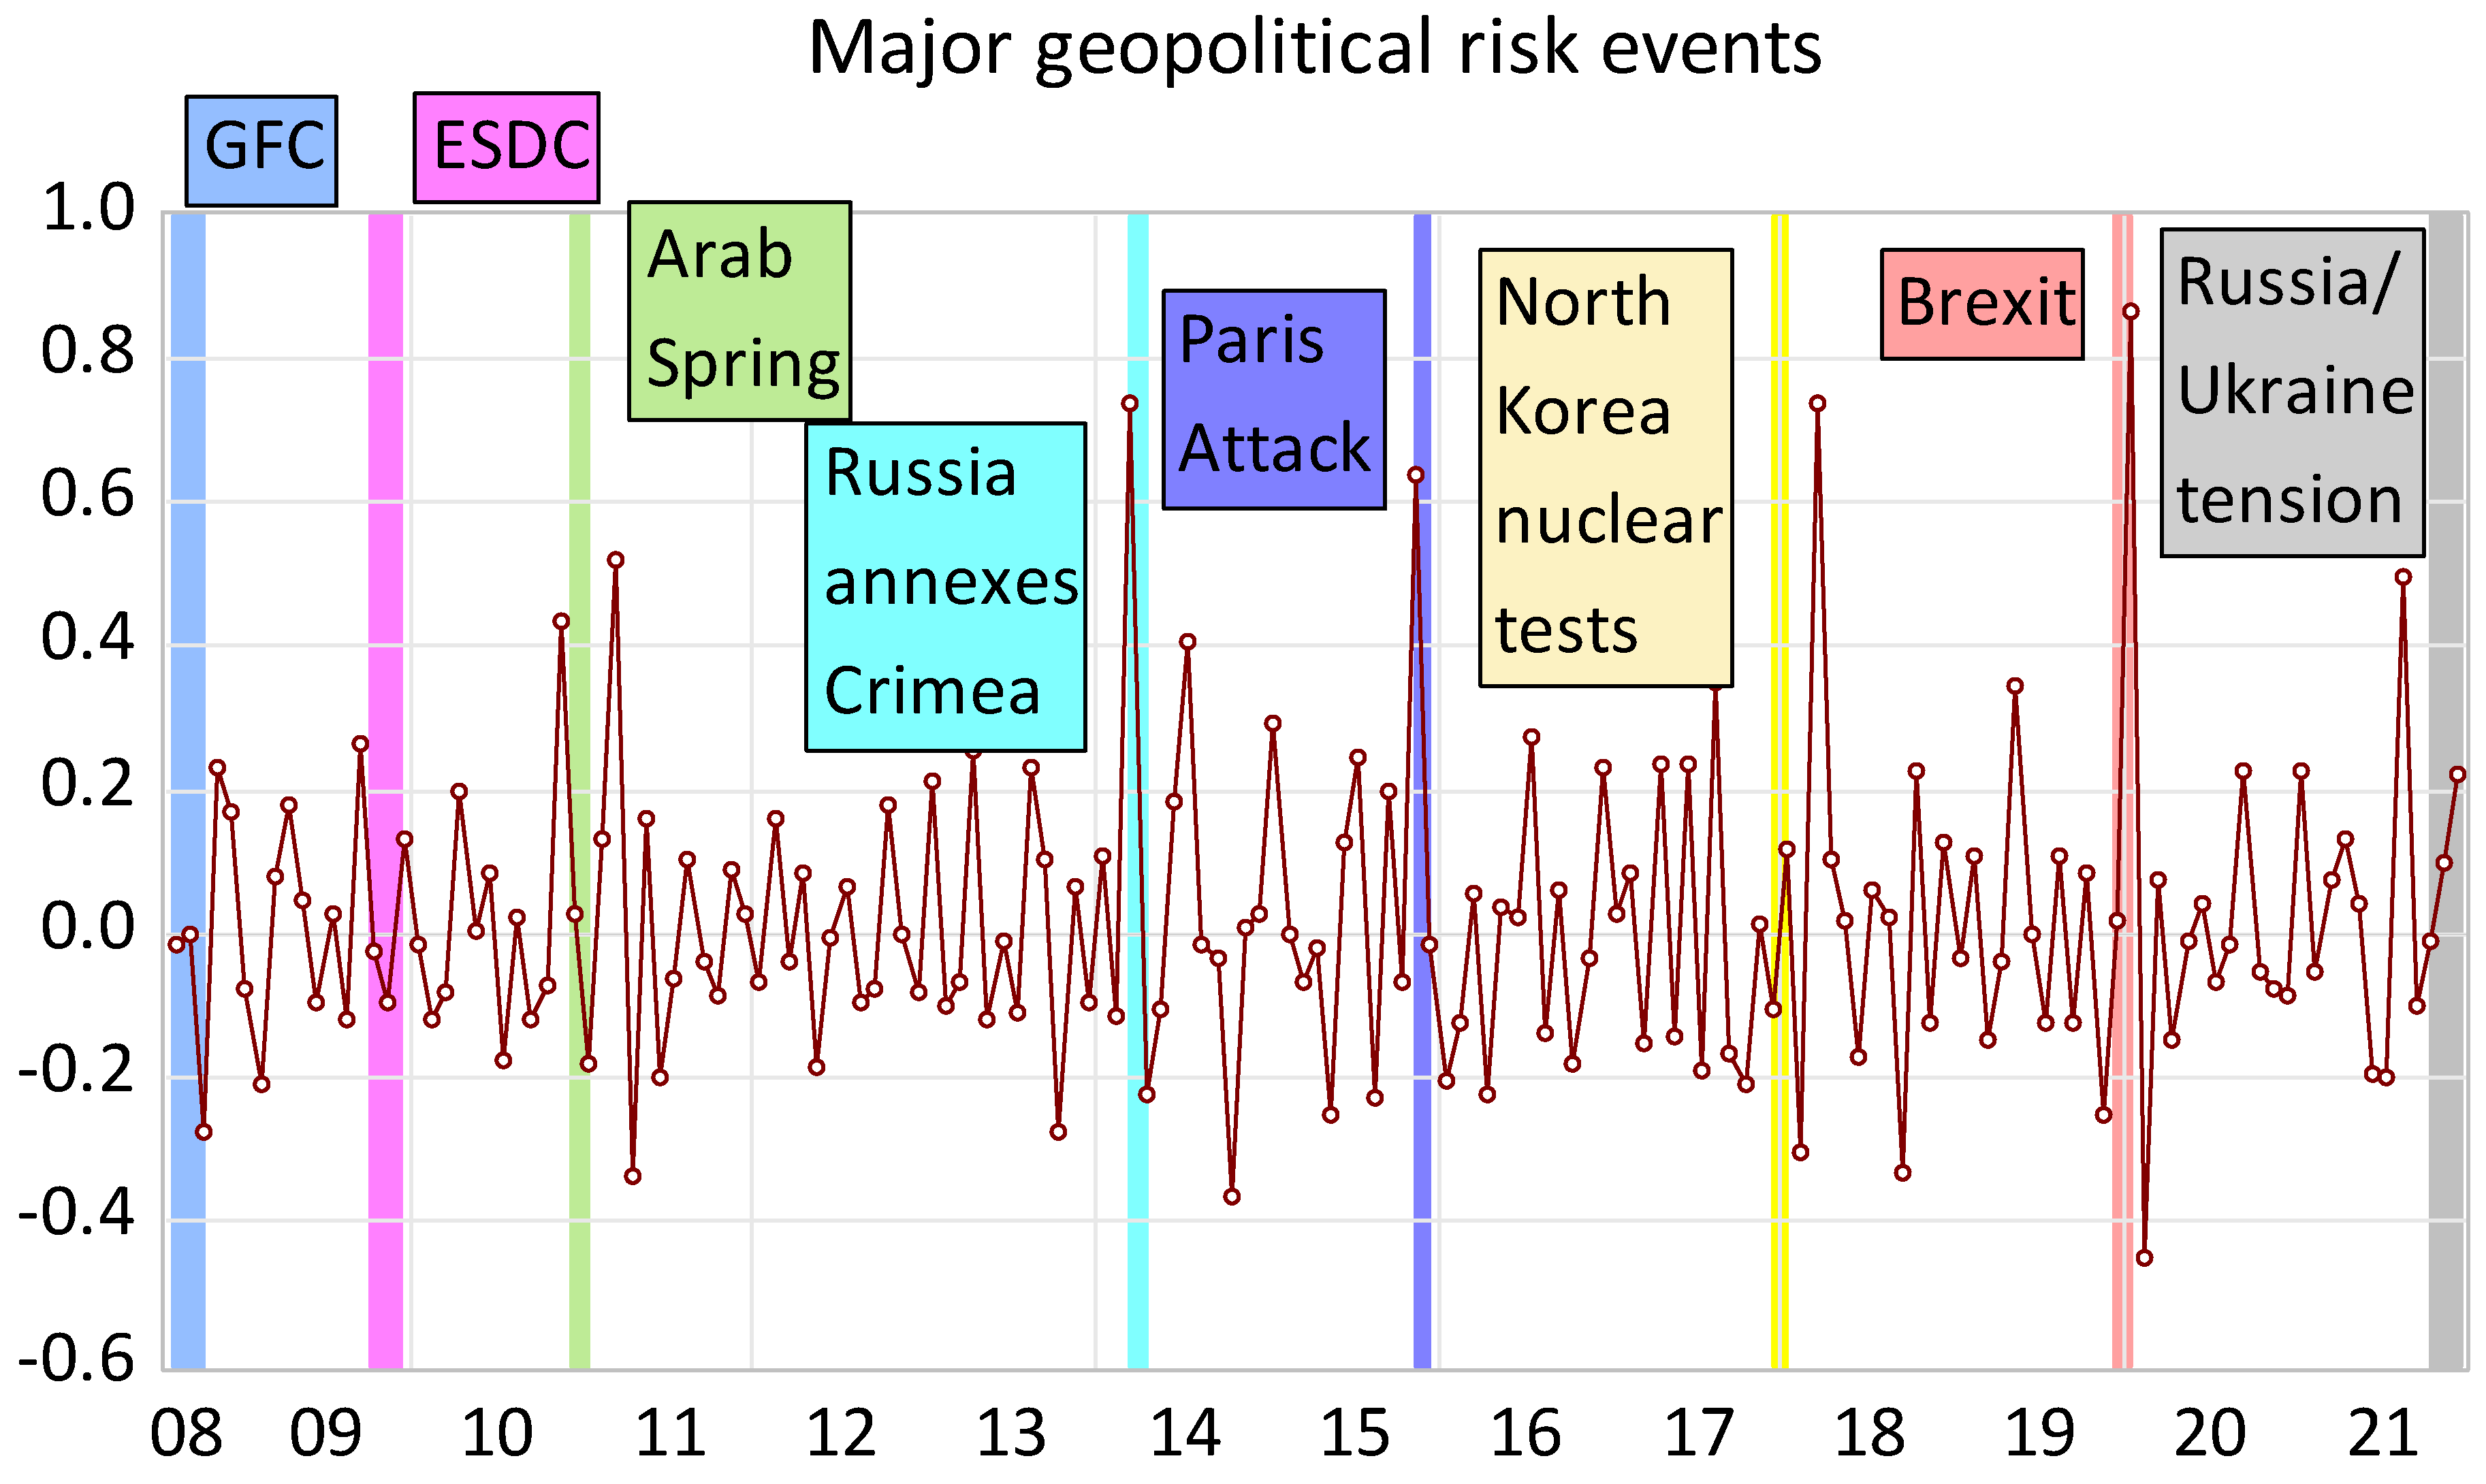
Figure 1. The time-varying dynamics of the GPR index changes during the period of the study.
Jrfm 16 00148 g001
Figure 2. The time-varying dynamics of the SCDSs of nineteen countries. Note: The sample period of the study starts from August 2008 of all SCDS data except for SCDS Mexico (October 2008); SCDS Russia (November 2008); SCDS Norway (January 2009 and SCDS Saudi Arabia (March 2010).
Jrfm 16 00148 g002
Figure 3. The quantile-on-quantile estimates of the impact of the GPR on nineteen SCDSs. (a): The quantile-on-quantile estimates of the impact of the GPR on SCDSs in Europe countries. (b): The quantile-on-quantile estimates of the impact of the GPR on SCDSs in American countries. (c): The quantile-on-quantile estimates of the impact of the GPR on SCDSs in Asia and African countries.
Jrfm 16 00148 g003aJrfm 16 00148 g003bJrfm 16 00148 g003cJrfm 16 00148 g003d
Figure 4. The comparison between the quantile-on-quantile approach (QQA) and the quantile regression (QR). (a): The comparison between (QQA) and the (QR) in the case of European countries. (b): The comparison between (QQA) and the (QR) in the case of American countries. (c): The comparison between (QQA) and the (QR) in the case of Asia and African countries.
Jrfm 16 00148 g004aJrfm 16 00148 g004bJrfm 16 00148 g004c
Table 1. Descriptive statistics.
USAUKTURKEYSWEDENSPAIN
Mean−0.000856−0.0033870.018345−0.0028520.006305
Median−0.003803−0.0221780.006626−0.016751−0.015939
Maximum0.4576921.0116560.8334230.5877711.160102
Minimum−0.322093−0.456866−0.362187−0.377613−0.320695
Std. Dev.0.1247010.1609100.1617740.1331640.197209
Skewness0.9831802.1843301.4873381.6012962.656169
Kurtosis5.30599413.937727.8711339.05500214.44007
Jarque–Bera54.33971820.7530192.7451277.6079941.3193
Probability0.0000000.0000000.0000000.0000000.000000
ADF test−10.70847 *−9.346816 *−12.76449 *−8.565483 *−11.51723 *
KSARUSSIANORWAYMOROCCOMEXICO
Mean0.0062800.0112880.0029990.0028770.010310
Median−0.000242−0.012258−0.0105620.000000−0.016317
Maximum1.2022831.2152520.6370810.5703701.191064
Minimum−0.312242−0.349671−0.333769−0.215942−0.302280
Std. Dev.0.1717890.1864930.1284510.0897610.167421
Skewness3.4167522.3111211.7780062.9744672.664748
Kurtosis21.8784614.402749.89789419.0092018.81280
Jarque–Bera2384.967895.7095356.33811725.7991647.485
Probability0.0000000.0000000.0000000.0000000.000000
ADF test−11.03391 *−11.38031 *−10.72578 *−11.24817 *−14.14826 *
FRANCECHINABRAZILBAHRAINABU DHABI
Mean0.0067210.0085060.0151920.0136410.001649
Median−0.028504−0.013722−0.0074710.000141−0.015502
Maximum1.2306400.6293920.9668051.7581411.361971
Minimum−0.397952−0.361098−0.266117−0.232484−0.267276
Std. Dev.0.1852300.1565250.1628570.1828860.161774
Skewness2.4966790.8649101.7822296.3766154.361900
Kurtosis15.962654.18803910.0844560.0467536.72696
Jarque–Bera1141.70426.05532372.127320217.117180.540
Probability0.0000000.0000020.0000000.0000000.000000
ADF test−10.61641 *−12.76762 *−10.80039 *−11.22886 *−11.32624 *
S. KOREAITALYJAPANGREECEGPR
Mean−0.0012200.0138280.0014070.0388660.019803
Median−0.025695−0.021359−0.0097540.000000−0.004461
Maximum0.5505621.5298560.7421252.4733610.863505
Minimum−0.362825−0.302794−0.348788−0.980346−0.451271
Std. Dev.0.1463100.2115280.1510640.3125990.203804
Skewness0.9880313.4105931.1172033.8666361.183766
Kurtosis5.12333722.059176.49044429.884165.832712
Jarque–Bera49.779172424.534101.62334630.15791.43096
Probability0.0000000.0000000.0000000.0000000.000000
ADF test−9.505437 *−12.14745 *−12.02839 *−11.09709 *−11.20894 *
Notes: The descriptive statistics are for the sample period from August 2008 until December 2021. JB is the Jarque–Bera test for normality. The ADF (the Augmented Dickey and Fuller (1979)) is the empirical statistics of the unit root test. The asterisk (*) indicates the rejection of the null hypotheses at a 1% level.
Disclaimer/Publisher’s Note: The statements, opinions and data contained in all publications are solely those of the individual author(s) and contributor(s) and not of MDPI and/or the editor(s). MDPI and/or the editor(s) disclaim responsibility for any injury to people or property resulting from any ideas, methods, instructions or products referred to in the content.