
Bidirectional Risk Spillovers between Chinese and Asian Stock Markets: A Dynamic Copula-EVT-CoVaR Approach


Abstract
1. Introduction
2. Literature Review
3. Methods and Materials
3.1. Methods
3.2. Materials
4. Empirical Results
4.1. Marginal Model Results
4.2. Copula Model Results
4.3. Risk Spillover Results
4.4. Robustness Diagnosis
5. Discussion
6. Conclusions
6.1. Conclusions and Policy Implications
6.2. Limitations and Future Research Recommendations
Author Contributions
Funding
Institutional Review Board Statement
Informed Consent Statement
Data Availability Statement
Conflicts of Interest
Appendix A

| Model | |||||||||
|---|---|---|---|---|---|---|---|---|---|
| Hong Kong | DCC-Gaussian | - | - | - | - | - | - | 0.0145 *** | 0.9825 *** |
| (0.004) | (0.006) | ||||||||
| Taiwan | TVP-SJC | 0.7250 | −7.0520 *** | −0.5377 | 0.8000 | −10.0000 | 0.0752 | - | - |
| (0.543) | (2.547) | (0.409) | (0.985) | (7.179) | (0.755) | ||||
| Japan | TVP-SJC | 0.1231 *** | −0.5705 *** | 0.9746 *** | −0.8562 | −9.9998 | −0.5462 | - | - |
| (0.037) | (0.171) | (0.008) | (2.064) | (8.660) | (0.426) | ||||
| South Korea | TVP-SJC | 0.6935 | −6.0411 *** | −0.3243 | 0.6762 | −9.4605 ** | 0.2312 | - | - |
| (0.487) | (2.160) | (0.243) | (0.631) | (3.804) | (0.314) | ||||
| India | TVP-SJC | −2.6189 *** | −0.0461 | −0.6515 *** | 1.0991 *** | −6.7035 *** | 0.7574 *** | - | - |
| (0.917) | (3.763) | (0.242) | (0.381) | (1.977) | (0.066) | ||||
| Singapore | TVP-SJC | 0.0379 | −5.2209 | −0.9527 *** | −1.9171 | −9.9998 | −0.9978 *** | - | - |
| (1.292) | (4.136) | (0.057) | (4.406) | (17.562) | (0.010) | ||||
| Malaysia | DCC-Gaussian | - | - | - | - | - | - | 0.0123 * | 0.9735 *** |
| (0.007) | (0.022) | ||||||||
| Thailand | TVP-SJC | 0.1507 ** | −1.0471 * | 0.9069 *** | −1.9173 | −1.4408 | 0.1177 | - | - |
| (0.075) | (0.555) | (0.086) | (2.348) | (3.130) | (0.550) | ||||
| Indonesia | TVP-SJC | −0.0674 | −8.4142 ** | −0.9554 *** | −2.7839 | −8.3967 | −0.9126 *** | - | - |
| (0.860) | (3.417) | (0.027) | (2.919) | (9.814) | (0.128) | ||||
| Philippines | TVP-SJC | 0.1017 | −1.6277 * | 0.7873 *** | −3.2370 | −9.2955 | −0.1378 | - | - |
| (0.208) | (0.947) | (0.138) | (6.443) | (13.859) | (0.451) |

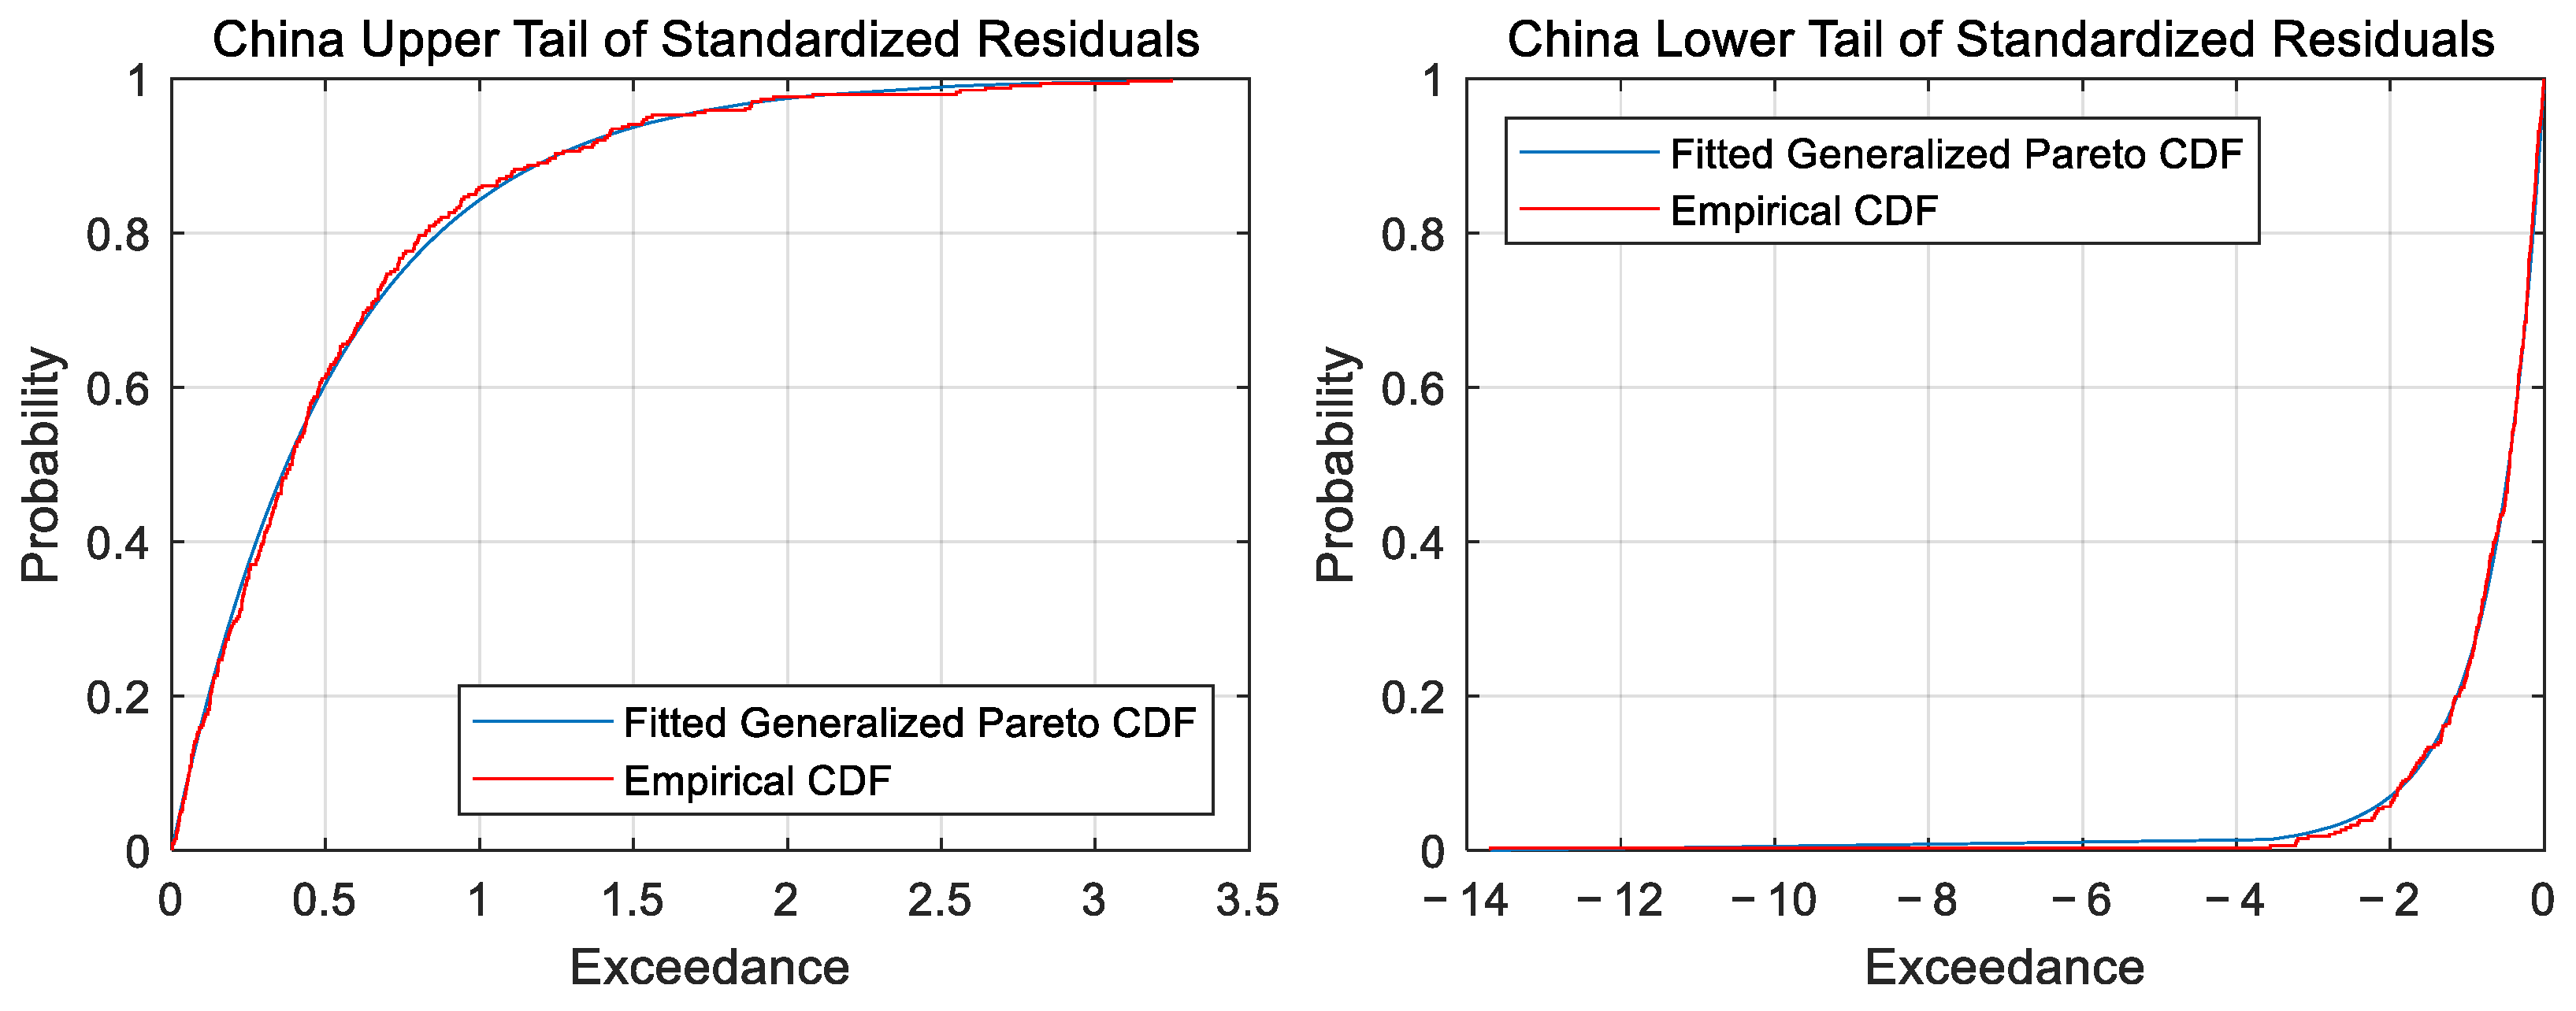
| 1 | Considering the non-normality of GARCH residuals, this paper assumes that standardized residuals obey skew-t distribution to capture asymmetries and fat tails. |
| 2 | Since the parameter γ of the Chinese stock return series is not significant, the AR(1)-GARCH(1,1)-skew-t model is used to estimate the Chinese stock market. |
| 3 | Due to space limitations, this paper only lists the fitting results of the Chinese stock market, and the results of other stock markets are available upon request. |
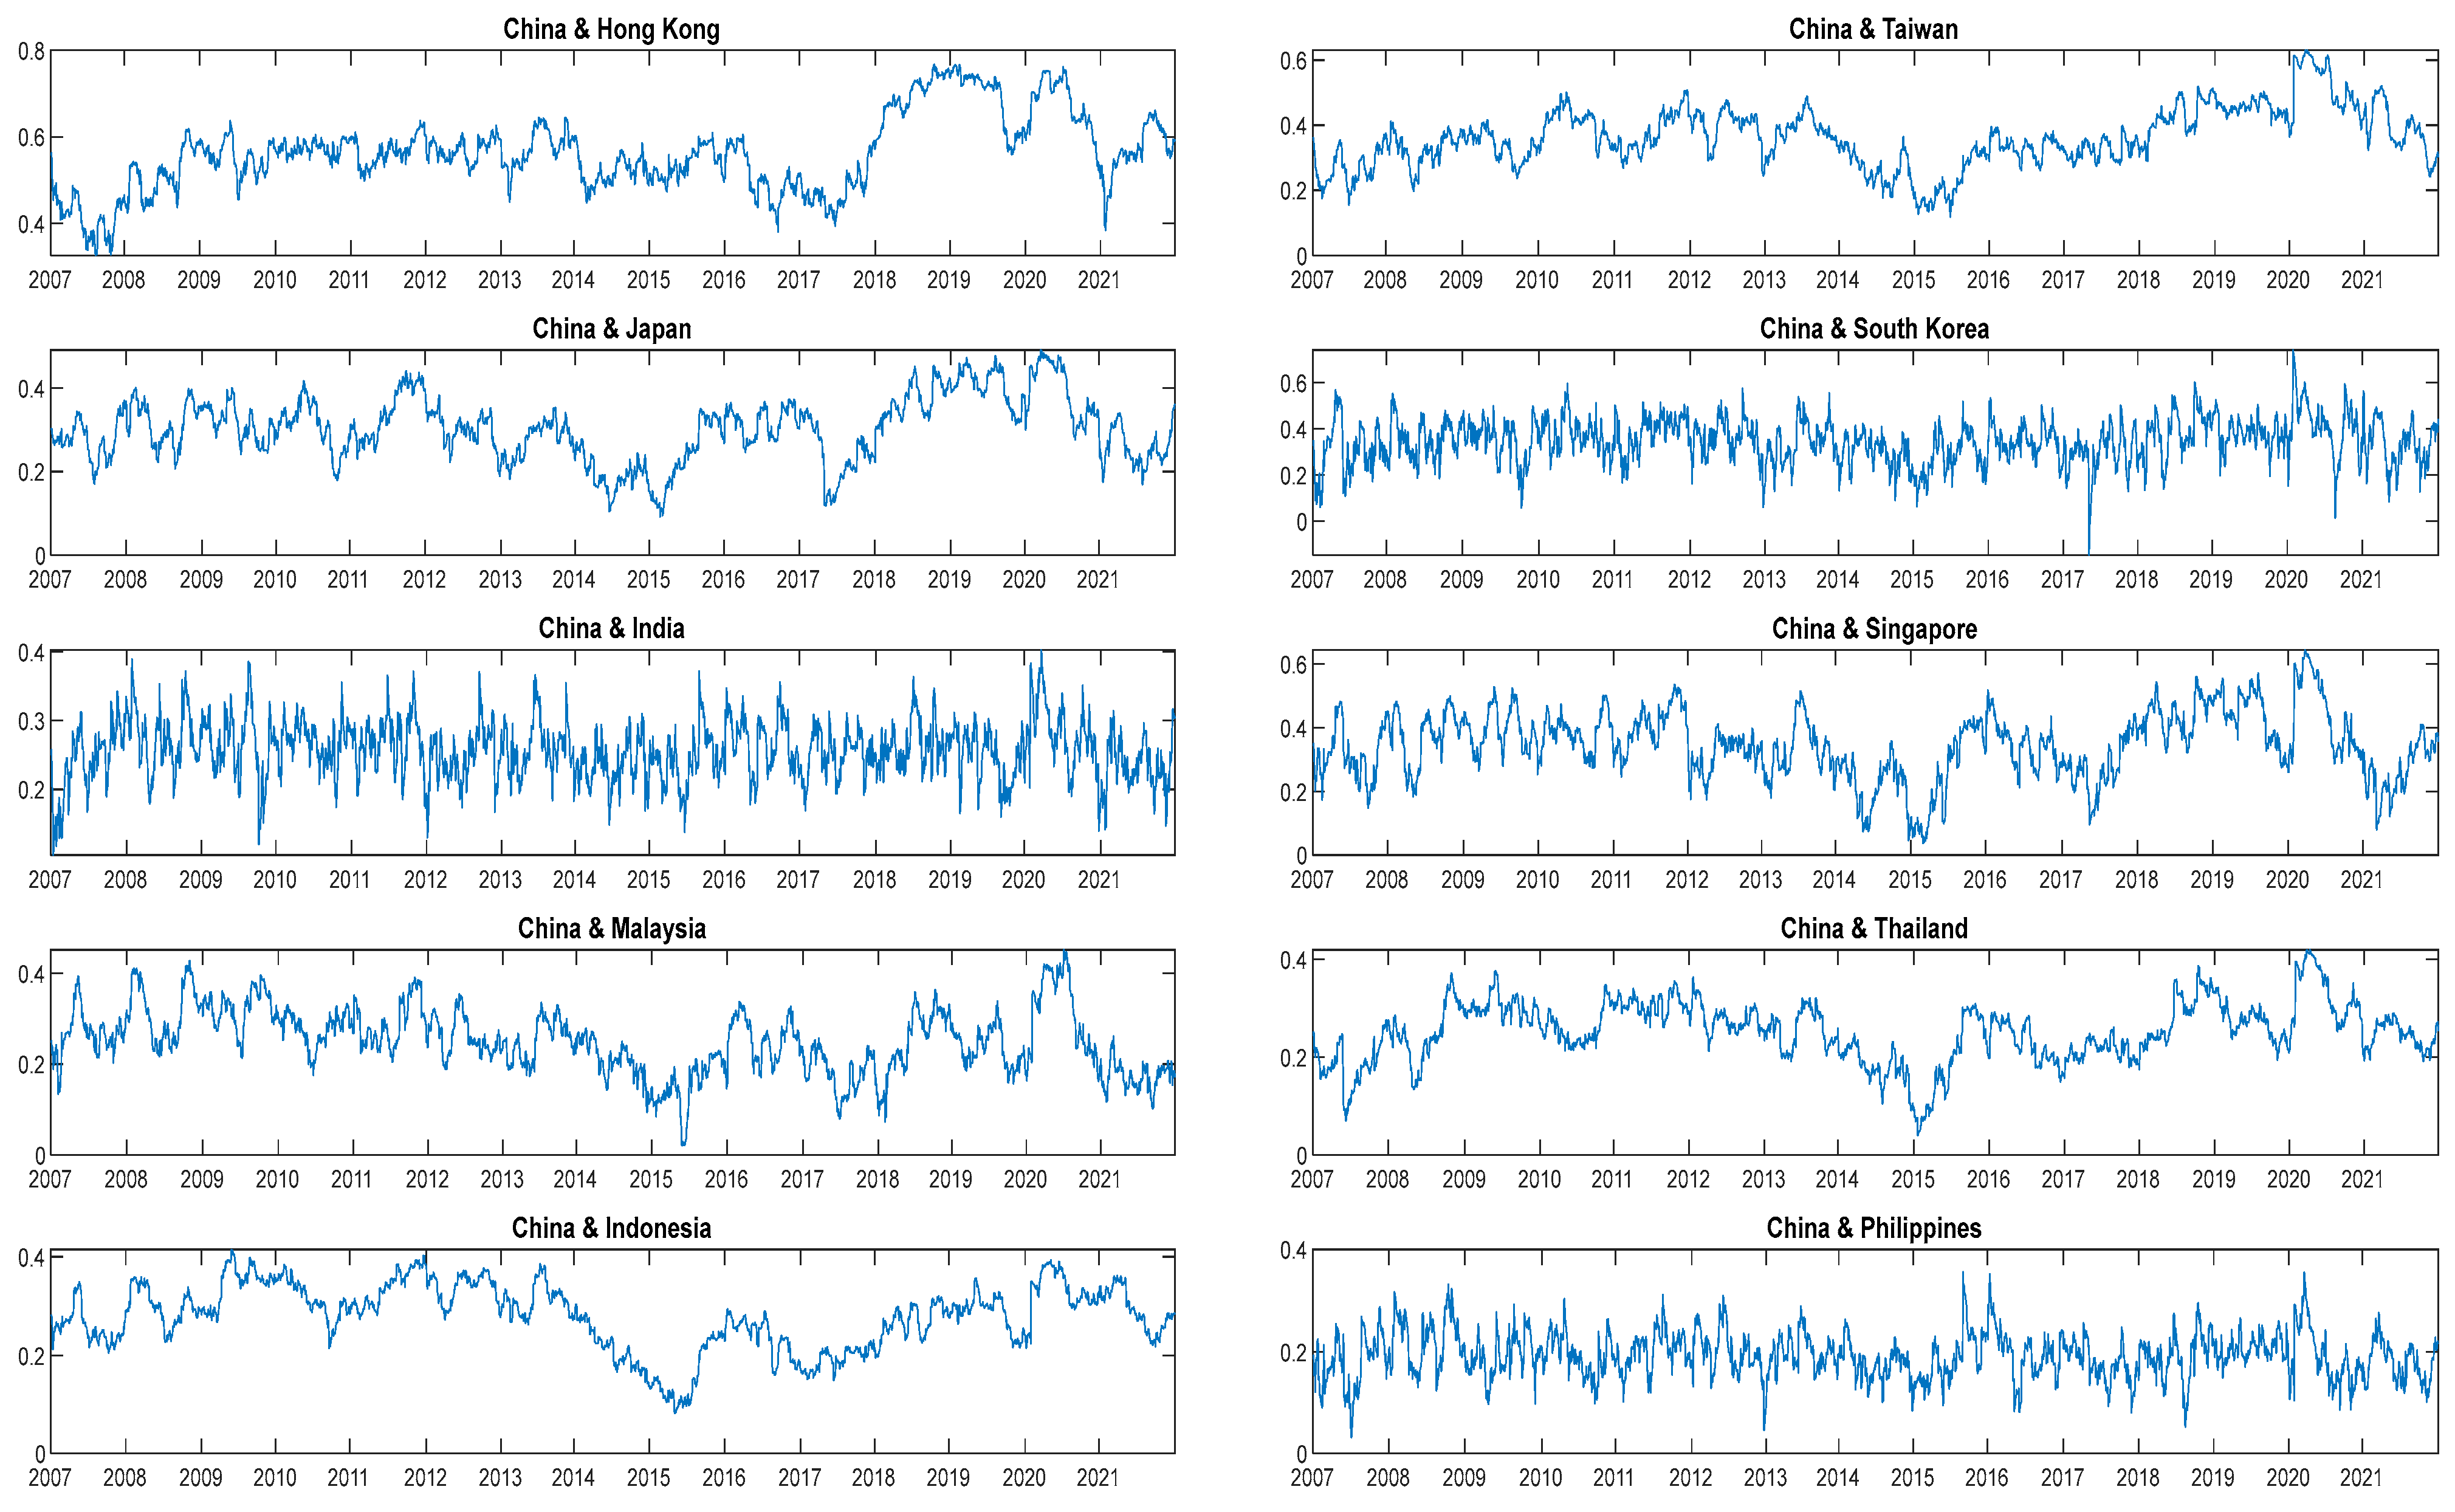
| 4 | Different copula models have different sensitivities to the tails, and, in order to make the dynamic dependence comparable, the DCC-T copula model is used uniformly for the calculation. |
| 5 | VaR represents the expected value without spillovers from other stock markets, that is, its own risk value. Therefore, the VaR calculation result of other Asian stock markets for the Chinese stock market is unanimously −2.6971. |
| 6 | Because of space limitations, this paper only lists some main results and focuses on the lower-tail risk between stock markets. |
References
- Abuzayed, Bana, Elie Bouri, Nedal Al-Fayoumi, and Naji Jalkh. 2021. Systemic risk spillover across global and country stock markets during the COVID-19 pandemic. Economic Analysis Policy 71: 180–97. [Google Scholar] [CrossRef]
- Adrian, Tobias, and Markus K. Brunnermeier. 2011. CoVaR. National Bureau of Economic Research Working Paper 17454. Cambridge: National Bureau of Economic Research. [Google Scholar]
- Adrian, Tobias, and Markus K. Brunnermeier. 2016. CoVaR. The American Economic Review 106: 1705. [Google Scholar] [CrossRef]
- Alishavandi, Abdullah, Mehrzad Minouei, Mirfaiz FallahShams, and Gholamreza Zomorodian. 2023. Proposing a portfolio optimization model based on the GARCH-EVT-Copula combined approach. International Journal of Nonlinear Analysis Applications 14: 197–210. [Google Scholar]
- Allen, David E., Abhay K. Singh, and Robert J. Powell. 2013. EVT and tail-risk modelling: Evidence from market indices and volatility series. The North American Journal of Economics Finance 26: 355–69. [Google Scholar] [CrossRef]
- Aloui, Riadh, Sami Ben Jabeur, and Salma Mefteh-Wali. 2022. Tail-risk spillovers from China to G7 stock market returns during the COVID-19 outbreak: A market and sectoral analysis. Research in International Business Finance 62: 101709. [Google Scholar] [CrossRef] [PubMed]
- Balkema, August A., and Laurens De Haan. 1974. Residual life time at great age. The Annals of Probability 2: 792–804. [Google Scholar] [CrossRef]
- Belaid, Fateh, Amine Ben Amar, Stéphane Goutte, and Khaled Guesmi. 2023. Emerging and advanced economies markets behaviour during the COVID-19 crisis era. International Journal of Finance Economics 28: 1563–81. [Google Scholar] [CrossRef]
- Caporale, Guglielmo Maria, Luis A. Gil-Alana, and Kefe You. 2022. Stock market linkages between the Asean countries, China and the US: A fractional integration/cointegration approach. Emerging Markets Finance Trade 58: 1502–14. [Google Scholar] [CrossRef]
- Chavez-Demoulin, Valerie, Anthony C. Davison, and Alexander J. McNeil. 2005. Estimating value-at-risk: A point process approach. Quantitative Finance 5: 227–34. [Google Scholar] [CrossRef]
- Cheng, Yangnan, Jianxu Liu, and Songsak Sriboonchitta. 2021. Risk spillovers between China and other BRICS countries during COVID-19 pandemic: A CoVaR-copula approach. Journal of Physics: Conference Series 1978: 012043. [Google Scholar] [CrossRef]
- Chopra, Monika, and Chhavi Mehta. 2022. Is the COVID-19 pandemic more contagious for the Asian stock markets? A comparison with the Asian financial, the US subprime and the Eurozone debt crisis. Journal of Asian Economics 79: 101450. [Google Scholar] [CrossRef] [PubMed]
- Du, Jiangze, Xizhuo Chen, Jincheng Gong, Xiao Lin, and Kin Keung Lai. 2023. Analysis of stock markets risk spillover with copula models under the background of Chinese financial opening. International Journal of Finance Economics 28: 3997–4019. [Google Scholar] [CrossRef]
- DuMouchel, William H. 1983. Estimating the stable index α in order to measure tail thickness: A critique. The Annals of Statistics 11: 1019–31. [Google Scholar] [CrossRef]
- Ellis, Scott, Satish Sharma, and Janusz Brzeszczyński. 2022. Systemic risk measures and regulatory challenges. Journal of Financial Stability 61: 100960. [Google Scholar] [CrossRef]
- Engle, Robert. 2002. Dynamic conditional correlation: A simple class of multivariate generalized autoregressive conditional heteroskedasticity models. Journal of Business Economic Statistics 20: 339–50. [Google Scholar] [CrossRef]
- Fang, Yi, Zhongbo Jing, Yukun Shi, and Yang Zhao. 2021. Financial spillovers and spillbacks: New evidence from China and G7 countries. Economic Modelling 94: 184–200. [Google Scholar] [CrossRef]
- Girardi, Giulio, and A. Tolga Ergün. 2013. Systemic risk measurement: Multivariate GARCH estimation of CoVaR. Journal of Banking Finance 37: 3169–80. [Google Scholar] [CrossRef]
- Hanif, Waqas, Walid Mensi, Mohammad Alomari, and Jorge Miguel Andraz. 2023. Downside and upside risk spillovers between precious metals and currency markets: Evidence from before and during the COVID-19 crisis. Resources Policy 81: 103350. [Google Scholar] [CrossRef]
- Jiang, Cuixia, Yuqian Li, Qifa Xu, and Yezheng Liu. 2021. Measuring risk spillovers from multiple developed stock markets to China: A vine-copula-GARCH-MIDAS model. International Review of Economics Finance 75: 386–98. [Google Scholar] [CrossRef]
- Jin, Xiaoye. 2018. Downside and upside risk spillovers from China to Asian stock markets: A CoVaR-copula approach. Finance Research Letters 25: 202–12. [Google Scholar] [CrossRef]
- Karadag, Tugay, and Gulhayat Golbasi Simsek. 2023. A Time-Varying Copula Approach to Investigate the Dependence Structures of BRICS Stock Markets Before and After COVID-19. Emerging Markets Finance Trade 59: 1475–86. [Google Scholar] [CrossRef]
- Karamti, Chiraz, and Olfa Belhassine. 2022. COVID-19 pandemic waves and global financial markets: Evidence from wavelet coherence analysis. Finance Research Letters 45: 102136. [Google Scholar] [CrossRef]
- Li, Chen, Huanhuan Zheng, and Yunbo Liu. 2022. The hybrid regulatory regime in turbulent times: The role of the state in China’s stock market crisis in 2015–2016. Regulation Governance 16: 392–408. [Google Scholar] [CrossRef]
- Liu, Jianing, Yuanyuan Man, and Xiuliang Dong. 2023a. Tail dependence and risk spillover effects between China’s carbon market and energy markets. International Review of Economics Finance 84: 553–67. [Google Scholar] [CrossRef]
- Liu, Kerry. 2020. The effects of the China–US trade war during 2018–2019 on the Chinese economy: An initial assessment. Economic Political Studies 8: 462–81. [Google Scholar] [CrossRef]
- Liu, Xueyong, Zhihua Chen, Zhensong Chen, and Yinhong Yao. 2022. The time-varying spillover effect of China’s stock market during the COVID-19 pandemic. Physica A: Statistical Mechanics Its Applications 603: 127821. [Google Scholar] [CrossRef] [PubMed]
- Liu, Zhifeng, Peng-Fei Dai, Toan LD Huynh, Tingting Zhang, and Guoqing Zhang. 2023b. Industries’ heterogeneous reactions during the COVID-19 outbreak: Evidence from Chinese stock markets. Journal of International Financial Management Accounting 34: 243–78. [Google Scholar] [CrossRef]
- Mishra, Pabitra Kumar, and Santosh Kumar Mishra. 2021. COVID-19 pandemic and stock market reaction: Empirical insights from 15 Asian countries. Transnational Corporations Review 13: 139–55. [Google Scholar] [CrossRef]
- Mo, Bin, Juan Meng, and Guannan Wang. 2023. Risk Dependence and Risk Spillovers Effect from Crude Oil on the Chinese Stock Market and Gold Market: Implications on Portfolio Management. Energies 16: 2141. [Google Scholar] [CrossRef]
- Okou, Gueï Cyrille, and Amine Amar. 2023. Modeling Contagion of Financial Markets: A GARCH-EVT Copula Approach. Engineering Proceedings 39: 70. [Google Scholar]
- Patton, Andrew J. 2006. Modelling asymmetric exchange rate dependence. International Economic Review 47: 527–56. [Google Scholar] [CrossRef]
- Pickands, James. 1975. Statistical inference using extreme order statistics. The Annals of Statistics 3: 119–31. [Google Scholar]
- Ren, Yinghua, Wanru Zhao, Wanhai You, and Huiming Zhu. 2022. Multiscale features of extreme risk spillover networks among global stock markets. The North American Journal of Economics Finance 62: 101754. [Google Scholar] [CrossRef]
- Sklar, Abe. 1959. Fonctions de Répartition à n Dimensions et Leurs Marges. Publications de l’Institut Statistique de l’Université de Paris 8: 229–31. [Google Scholar]
- Sun, Guanglin, Xiaoyang Yao, Jianfeng Li, and Tongyu Lu. 2023. Risk linkages between China’s stock market and APEC stock markets under China’s market liberalization. Finance Research Letters 52: 103586. [Google Scholar] [CrossRef]
- Tan, Xiaoyu, Shiqun Ma, Xuetong Wang, Chao Feng, and Lijin Xiang. 2022. The impact of the COVID-19 pandemic on the global dynamic spillover of financial market risk. Frontiers in Public Health 10: 963620. [Google Scholar] [CrossRef]
- Usman, Muhammad, Zaghum Umar, Mariya Gubareva, and Dang Khoa Tran. 2023. Spillovers from stock markets to currency markets: Evidence from Copula-CoVar with time-varying higher moments. Applied Economics 55: 6091–114. [Google Scholar] [CrossRef]
- Vogiatzoglou, Manthos. 2010. Dynamic Copula Toolbox. Available online: http://www.mathworks.com (accessed on 5 March 2022).
- Wang, Bo, and Yang Xiao. 2023. Risk spillovers from China’s and the US stock markets during high-volatility periods: Evidence from East Asianstock markets. International Review of Financial Analysis 86: 102538. [Google Scholar] [CrossRef]
- Wang, Dong, Ping Li, and Lixin Huang. 2022a. Time-frequency volatility spillovers between major international financial markets during the COVID-19 pandemic. Finance Research Letters 46: 102244. [Google Scholar] [CrossRef] [PubMed]
- Wang, Liang, and Tingjia Xu. 2022. Bidirectional risk spillovers between exchange rate of emerging market countries and international crude oil price–based on time-varing copula-CoVaR. Computational Economics 59: 383–414. [Google Scholar] [CrossRef]
- Wang, Xinru, Maria H. Kim, and Sandy Suardi. 2022b. Herding and China’s market-wide circuit breaker. Journal of Banking Finance 141: 106533. [Google Scholar] [CrossRef]
- Wang, Zong-Run, Xiao-Hong Chen, Yan-Bo Jin, and Yan-Ju Zhou. 2010. Estimating risk of foreign exchange portfolio: Using VaR and CVaR based on GARCH–EVT-Copula model. Physica A: Statistical Mechanics its Applications 389: 4918–28. [Google Scholar] [CrossRef]
- Wu, Fei, Zhiwei Zhang, Dayong Zhang, and Qiang Ji. 2021. Identifying systemically important financial institutions in China: New evidence from a dynamic copula-CoVaR approach. Annals of Operations Research 330: 119–53. [Google Scholar] [CrossRef]
- Xiao, Yang. 2020. The risk spillovers from the Chinese stock market to major East Asian stock markets: A MSGARCH-EVT-copula approach. International Review of Economics Finance 65: 173–86. [Google Scholar] [CrossRef]
- Xu, Qifa, Bei Jin, and Cuixia Jiang. 2021. Measuring systemic risk of the Chinese banking industry: A wavelet-based quantile regression approach. The North American Journal of Economics Finance 55: 101354. [Google Scholar] [CrossRef]
- Yadav, Miklesh Prasad, Sudhi Sharma, and Indira Bhardwaj. 2023. Volatility spillover between Chinese stock market and selected emerging economies: A dynamic conditional correlation and portfolio optimization perspective. Asia-Pacific Financial Markets 30: 427–44. [Google Scholar] [CrossRef]
- Yao, Can-Zhong, and Min-Jian Li. 2023. GARCH-MIDAS-GAS-copula model for CoVaR and risk spillover in stock markets. The North American Journal of Economics Finance 66: 101910. [Google Scholar] [CrossRef]
- Yao, Yinhong, Jingyu Li, and Wei Chen. 2024. Multiscale extreme risk spillovers among the Chinese mainland, Hong Kong, and London stock markets: Comparing the impacts of three Stock Connect programs. International Review of Economics Finance 89: 1217–33. [Google Scholar] [CrossRef]
- Yilanci, Veli, and Ugur Korkut Pata. 2023. COVID-19, stock prices, exchange rates and sovereign bonds: A wavelet-based analysis for Brazil and India. International Journal of Emerging Markets 18: 4968–86. [Google Scholar] [CrossRef]
- Zaidi, Syeda Hina, and Ramona Rupeika-Apoga. 2021. Liquidity synchronization, its determinants and outcomes under economic growth volatility: Evidence from emerging Asian economies. Risks 9: 43. [Google Scholar] [CrossRef]
- Zhang, Xiaoming, Tong Zhang, and Chien-Chiang Lee. 2022. The path of financial risk spillover in the stock market based on the R-vine-Copula model. Physica A: Statistical Mechanics its Applications 600: 127470. [Google Scholar] [CrossRef]
- Zhao, Jing, Luansong Cui, Weiguo Liu, and Qiwen Zhang. 2023. Extreme risk spillover effects of international oil prices on the Chinese stock market: A GARCH-EVT-Copula-CoVaR approach. Resources Policy 86: 104142. [Google Scholar] [CrossRef]
- Zhong, Yi, and Jiapeng Liu. 2021. Correlations and volatility spillovers between China and Southeast Asian stock markets. The Quarterly Review of Economics Finance 81: 57–69. [Google Scholar] [CrossRef]
- Zhou, Dong-hai, Xiao-xing Liu, Chun Tang, and Guang-yi Yang. 2023. Time-varying risk spillovers in Chinese stock market–New evidence from high-frequency data. The North American Journal of Economics Finance 64: 101870. [Google Scholar] [CrossRef]
- Zhu, Chen. 2022. The contribution of shadow banking risk spillover to the commercial banks in China: Based on the DCC-BEKK-MVGARCH-Time-Varying CoVaR Model. Electronic Commerce Research 23: 2153–81. [Google Scholar] [CrossRef]
- Zuo, Jingjing, Baoyin Qiu, Guoyiming Zhu, and Guangyong Lei. 2023. Local speculative culture and stock price crash risk. Research in International Business Finance 64: 101851. [Google Scholar] [CrossRef]


| Mean | Max | Min | SD | Skewness | Kurtosis | Jarque–Bera | Q (20) | Q2 (20) | ARCH (20) | |
|---|---|---|---|---|---|---|---|---|---|---|
| China | 0.0245 | 8.9309 | −9.6952 | 1.7557 | −0.5194 | 6.8901 | 2389.859 *** | 48.1407 *** | 1613.1 *** | 490.6073 *** |
| Hong Kong | 0.0041 | 13.4068 | −13.582 | 1.5362 | −0.0734 | 11.9814 | 11,884.4645 *** | 40.4111 *** | 4020.4 *** | 984.0395 *** |
| Taiwan | 0.0234 | 6.5246 | −9.1898 | 1.1951 | −0.5938 | 8.5784 | 4807.5102 *** | 63.0925 *** | 1686.5 *** | 518.094 *** |
| Japan | 0.0147 | 13.2346 | −12.7154 | 1.5561 | −0.5664 | 11.5293 | 10,626.679 *** | 50.2902 *** | 3795.5 *** | 878.0004 *** |
| South Korea | 0.0215 | 11.2844 | −11.172 | 1.2906 | −0.5848 | 12.647 | 13,877.7495 *** | 33.4104 ** | 3760.9 *** | 897.7375 *** |
| India | 0.0414 | 15.99 | −14.1017 | 1.466 | −0.3205 | 15.6961 | 23,237.1053 *** | 60.0673 *** | 1809.7 *** | 506.9752 *** |
| Singapore | 0.0009 | 8.8659 | −10.628 | 1.1515 | −0.3154 | 13.0023 | 14761.1008 *** | 40.133 *** | 3790.4 *** | 900.9655 *** |
| Malaysia | 0.0093 | 6.6263 | −9.9785 | 0.7983 | −0.7541 | 15.6559 | 23,500.4608 *** | 44.6039 *** | 588.3 *** | 276.4585 *** |
| Thailand | 0.0274 | 7.6531 | −11.4871 | 1.2536 | −1.1348 | 15.3527 | 22,530.4176 *** | 90.1281 *** | 2105.6 *** | 641.9362 *** |
| Indonesia | 0.0375 | 9.7042 | −11.306 | 1.3469 | −0.5082 | 11.4056 | 10,218.3681 *** | 52.9503 *** | 1924.2 *** | 601.404 *** |
| Philippines | 0.0259 | 9.3653 | −14.3224 | 1.374 | −1.0326 | 14.805 | 20,544.1125 *** | 72.9788 *** | 950.0 *** | 395.0907 *** |
| China | HK | Taiwan | Japan | SK | India | Singapore | Malaysia | Thailand | Indonesia | Philippines | |
|---|---|---|---|---|---|---|---|---|---|---|---|
| ADF | −58.0998 *** | −60.9688 *** | −57.6113 *** | −60.6196 *** | −59.0452 *** | −56.4758 *** | −59.0382 *** | −55.2963 *** | −57.9864 *** | −53.9687 *** | −55.3225 *** |
| PP | −58.1134 *** | −61.0541 *** | −57.6576 *** | −60.7685 *** | −59.0956 *** | −56.4843 *** | −59.1131 *** | −55.4702 *** | −58.1201 *** | −53.9002 *** | −55.2828 *** |
| ω | α | β | γ | υ | λ | Q2 (20) | ARCH (20) | |||
|---|---|---|---|---|---|---|---|---|---|---|
| China | 0.0396 ** | 0.0018 | 0.0102 ** | 0.0577 *** | 0.9415 *** | - | 5.2309 *** | −0.0557 *** | 26.0676 | 26.2258 |
| (0.019) | (0.016) | (0.004) | (0.009) | (0.009) | (0.449) | (0.019) | [0.1636] | [0.1585] | ||
| Hong Kong | 0.0123 | −0.0061 | 0.0262 *** | 0.0241 *** | 0.9222 *** | 0.0791 *** | 7.1126 *** | −0.0831 *** | 22.3854 | 23.2104 |
| (0.018) | (0.014) | (0.009) | (0.007) | (0.014) | (0.019) | (0.829) | (0.020) | [0.3200] | [0.2786] | |
| Taiwan | 0.0355 ** | 0.0169 | 0.0159 * | 0.0150 * | 0.9287 *** | 0.0817 ** | 5.5818 *** | −0.1252 *** | 12.8785 | 12.4395 |
| (0.015) | (0.019) | (0.009) | (0.009) | (0.028) | (0.032) | (0.529) | (0.022) | [0.8825] | [0.9001] | |
| Japan | 0.0290 | −0.0334 * | 0.0761 *** | 0.0277 ** | 0.8485 *** | 0.1798 *** | 6.4476 *** | −0.0907 *** | 9.3406 | 9.4787 |
| (0.020) | (0.018) | (0.017) | (0.012) | (0.020) | (0.033) | (0.733) | (0.022) | [0.9786] | [0.9767] | |
| South Korea | 0.0156 | −0.0148 | 0.0220 ** | 0.0290 *** | 0.9027 *** | 0.1038 *** | 5.9915 *** | −0.1376 *** | 14.9509 | 14.9554 |
| (0.014) | (0.018) | (0.009) | (0.010) | (0.023) | (0.032) | (0.605) | (0.021) | [0.7792] | [0.7790] | |
| India | 0.0412 ** | 0.0576 *** | 0.0264 *** | 0.0172 ** | 0.8971 *** | 0.1438 *** | 6.1881 *** | −0.0682 *** | 18.1630 | 17.2615 |
| (0.016) | (0.017) | (0.005) | (0.007) | (0.012) | (0.023) | (0.641) | (0.025) | [0.5767] | [0.6359] | |
| Singapore | 0.0101 | −0.0085 | 0.0089 *** | 0.0239 *** | 0.9233 *** | 0.0893 *** | 6.6428 *** | −0.0697 *** | 20.9474 | 21.7568 |
| (0.013) | (0.013) | (0.003) | (0.009) | (0.012) | (0.015) | (0.711) | (0.024) | [0.4002] | [0.3539] | |
| Malaysia | 0.0048 | 0.0440 ** | 0.0071 *** | 0.0555 *** | 0.9019 *** | 0.0679 *** | 5.4710 *** | −0.0874 *** | 10.9969 | 10.7983 |
| (0.010) | (0.018) | (0.002) | (0.014) | (0.018) | (0.018) | (0.499) | (0.023) | [0.9463] | [0.9513] | |
| Thailand | 0.0366 ** | 0.0143 | 0.0119 *** | 0.0577 *** | 0.8979 *** | 0.0839 *** | 5.3787 *** | −0.0765 *** | 13.6191 | 13.1968 |
| (0.014) | (0.019) | (0.004) | (0.010) | (0.013) | (0.020) | (0.492) | (0.023) | [0.8493] | [0.8688] | |
| Indonesia | 0.0305 * | −0.0097 | 0.0290 ** | 0.0472 *** | 0.8836 *** | 0.1146 *** | 4.8478 *** | −0.1302 *** | 7.7680 | 8.2169 |
| (0.017) | (0.010) | (0.014) | (0.016) | (0.032) | (0.033) | (0.399) | (0.023) | [0.9933] | [0.9903] | |
| Philippines | 0.0186 | 0.0373 ** | 0.0771 *** | 0.0480 *** | 0.8429 *** | 0.1263 *** | 5.9507 *** | −0.0751 *** | 10.6846 | 10.5426 |
| (0.021) | (0.018) | (0.021) | (0.016) | (0.029) | (0.029) | (0.613) | (0.025) | [0.9540] | [0.9572] |
| China | HK | Taiwan | Japan | SK | India | Singapore | Malaysia | Thailand | Indonesia | Philippines | |
|---|---|---|---|---|---|---|---|---|---|---|---|
| statistics | 0.8 | −0.1602 | 0.0298 | 0.4324 | −0.5969 | −0.9755 | 0.17 | 1.0462 | −0.9846 | 0.2626 | −0.5092 |
| p-values | 0.4237 | 0.8728 | 0.9762 | 0.6654 | 0.5506 | 0.3293 | 0.865 | 0.2955 | 0.3248 | 0.7928 | 0.6106 |
| Lower Tail | Upper Tail | KS p-Value | |||||
|---|---|---|---|---|---|---|---|
| China | −1.1925 | 0.1197 | 0.6378 | 1.1901 | 0.0084 | 0.5358 | 0.7914 |
| Hong Kong | −1.2798 | 0.0355 | 0.5904 | 1.2120 | −0.0397 | 0.5493 | 0.7733 |
| Taiwan | −1.2394 | 0.0974 | 0.6759 | 1.1681 | 0.0052 | 0.4698 | 0.7131 |
| Japan | −1.2722 | 0.0564 | 0.6328 | 1.2193 | −0.0444 | 0.4925 | 0.8831 |
| South Korea | −1.2369 | −0.0314 | 0.7724 | 1.1922 | −0.0734 | 0.5045 | 0.8388 |
| India | −1.2243 | 0.0897 | 0.6050 | 1.1901 | 0.1395 | 0.4512 | 0.7500 |
| Singapore | −1.2500 | 0.0496 | 0.6090 | 1.2047 | 0.0754 | 0.4689 | 0.8242 |
| Malaysia | −1.1972 | 0.0813 | 0.6533 | 1.1808 | 0.0679 | 0.5022 | 0.8792 |
| Thailand | −1.2115 | 0.0831 | 0.6657 | 1.1747 | −0.0032 | 0.5323 | 0.7641 |
| Indonesia | −1.1939 | 0.1370 | 0.6264 | 1.1410 | 0.1056 | 0.4782 | 0.7291 |
| Philippines | −1.2140 | 0.1766 | 0.5261 | 1.1819 | 0.0826 | 0.5275 | 0.7498 |
| T | Clayton | SJC | DCC-Gaussian | DCC-T | TVP-Clayton | TVP-SJC | |
|---|---|---|---|---|---|---|---|
| Hong Kong | −1356.6493 | −1145.8794 | −1323.1527 | −1412.3080 | −1421.0471 | −1199.7068 | −1368.6927 |
| Taiwan | −497.5774 | −459.4803 | −511.2854 | −510.6142 | −533.6454 | −486.7947 | −533.2840 |
| Japan | −343.3495 | −310.6624 | −340.6391 | −353.8943 | −360.4527 | −326.2321 | −358.0471 |
| South Korea | −485.0022 | −459.8002 | −494.4181 | −496.8128 | −516.2737 | −479.8628 | −511.6025 |
| India | −238.0040 | −206.9195 | −241.7906 | −236.0555 | −241.6525 | −204.0055 | −246.1028 |
| Singapore | −473.1127 | −456.4884 | −492.1070 | −495.1291 | −513.6206 | −481.4896 | −496.2846 |
| Malaysia | −231.8815 | −213.3022 | −238.3358 | −238.8721 | −248.1335 | −211.3077 | −238.7798 |
| Thailand | −245.9778 | −213.0603 | −245.3992 | −230.6017 | −255.7786 | −209.8041 | −246.8518 |
| Indonesia | −295.9596 | −277.5796 | −302.8352 | −291.5680 | −308.3636 | −278.0434 | −303.5722 |
| Philippines | −86.7413 | −86.4480 | −93.5557 | −96.8564 | −111.4114 | −101.8417 | −118.6742 |
| Kendall | ||||
|---|---|---|---|---|
| Hong Kong | 19.4103 *** | 0.0136 *** | 0.9842 *** | 0.5628 |
| (6.138) | (0.004) | (0.005) | [0.0875] | |
| Taiwan | 11.6043 *** | 0.0125 * | 0.9814 *** | 0.3627 |
| (2.719) | (0.007) | (0.013) | [0.0911] | |
| Japan | 19.7869 *** | 0.0111 | 0.9810 *** | 0.3036 |
| (5.943) | (0.009) | (0.023) | [0.0771] | |
| South Korea | 12.1023 *** | 0.0416 *** | 0.8864 *** | 0.3479 |
| (2.677) | (0.012) | (0.041) | [0.0957] | |
| India | 20.0587 *** | 0.0173 ** | 0.9055 *** | 0.2570 |
| (6.331) | (0.008) | (0.047) | [0.0423] | |
| Singapore | 12.2519 *** | 0.0214 *** | 0.9642 *** | 0.3474 |
| (2.986) | (0.006) | (0.012) | [0.1070] | |
| Malaysia | 16.3026 *** | 0.0127 * | 0.9737 *** | 0.2515 |
| (5.462) | (0.007) | (0.021) | [0.0721] | |
| Thailand | 10.1254 *** | 0.0089 ** | 0.9806 *** | 0.2519 |
| (2.139) | (0.004) | (0.011) | [0.0619] | |
| Indonesia | 13.0804 *** | 0.0072 * | 0.9872 *** | 0.2802 |
| (3.202) | (0.004) | (0.010) | [0.0666] | |
| Philippines | 12.7293 *** | 0.0157 ** | 0.9216 *** | 0.1929 |
| (3.080) | (0.008) | (0.042) | [0.0454] |
| VaR | CoVaR | ΔCoVaR | %CoVaR | |
|---|---|---|---|---|
| China→Hong Kong | −2.2496 | −3.3292 | −1.4907 | 0.6905 |
| China→Taiwan | −1.7702 | −2.5811 | −0.9461 | 0.5607 |
| China→Japan | −2.3101 | −3.0182 | −0.8315 | 0.3809 |
| China→South Korea | −1.8661 | −2.663 | −0.937 | 0.5326 |
| China→India | −2.0497 | −2.6738 | −0.6998 | 0.3735 |
| China→Singapore | −1.6345 | −2.4445 | −0.9408 | 0.5971 |
| China→Malaysia | −1.1983 | −1.8486 | −0.6978 | 0.5986 |
| China→Thailand | −1.8268 | −2.4434 | −0.6876 | 0.4122 |
| China→Indonesia | −2.0045 | −2.6846 | −0.7719 | 0.4086 |
| China→Philippines | −2.0454 | −2.536 | −0.5353 | 0.2679 |
| Hong Kong→China | −2.6971 | −3.4671 | −1.2735 | 0.5107 |
| Taiwan→China | −2.6971 | −3.1318 | −0.6545 | 0.2651 |
| Japan→China | −2.6971 | −3.2991 | −0.722 | 0.2875 |
| South Korea→China | −2.6971 | −3.1786 | −0.681 | 0.2688 |
| India→China | −2.6971 | −3.1452 | −0.5426 | 0.2074 |
| Singapore→China | −2.6971 | −3.0704 | −0.6106 | 0.2336 |
| Malaysia→China | −2.6971 | −2.8881 | −0.3195 | 0.1222 |
| Thailand→China | −2.6971 | −3.117 | −0.4877 | 0.1866 |
| Indonesia→China | −2.6971 | −3.195 | −0.5842 | 0.2235 |
| Philippines→China | −2.6971 | −3.0665 | −0.4117 | 0.1633 |
Disclaimer/Publisher’s Note: The statements, opinions and data contained in all publications are solely those of the individual author(s) and contributor(s) and not of MDPI and/or the editor(s). MDPI and/or the editor(s) disclaim responsibility for any injury to people or property resulting from any ideas, methods, instructions or products referred to in the content. |
© 2024 by the authors. Licensee MDPI, Basel, Switzerland. This article is an open access article distributed under the terms and conditions of the Creative Commons Attribution (CC BY) license (https://creativecommons.org/licenses/by/4.0/).
Share and Cite
Zhao, M.; Park, H. Bidirectional Risk Spillovers between Chinese and Asian Stock Markets: A Dynamic Copula-EVT-CoVaR Approach. J. Risk Financial Manag. 2024, 17, 110. https://doi.org/10.3390/jrfm17030110
Zhao M, Park H. Bidirectional Risk Spillovers between Chinese and Asian Stock Markets: A Dynamic Copula-EVT-CoVaR Approach. Journal of Risk and Financial Management. 2024; 17(3):110. https://doi.org/10.3390/jrfm17030110
Chicago/Turabian StyleZhao, Mingguo, and Hail Park. 2024. "Bidirectional Risk Spillovers between Chinese and Asian Stock Markets: A Dynamic Copula-EVT-CoVaR Approach" Journal of Risk and Financial Management 17, no. 3: 110. https://doi.org/10.3390/jrfm17030110
APA StyleZhao, M., & Park, H. (2024). Bidirectional Risk Spillovers between Chinese and Asian Stock Markets: A Dynamic Copula-EVT-CoVaR Approach. Journal of Risk and Financial Management, 17(3), 110. https://doi.org/10.3390/jrfm17030110