Abstract
This article examines the impact of ownership structure and dividend payouts on idiosyncratic risk and market liquidity using agency, signaling, and bankruptcy theories from an emerging market perspective. The evidence shows that family firms dominate and have concentrated ownership, and dividend payouts are lower among family firms than their counterparts. The idiosyncratic risk is high among firms with higher family ownership concentration. The family ownership concentration and control positively influence the (firm) risk, dividends positively affect the market liquidity, and risk relates negatively to the market liquidity, supporting the entrenchment of the minority shareholders’ proposition that a significant payout leads to a decrease in information asymmetry and a lower level of risk. The study further supports the proposition that information asymmetries are central to elucidating the dynamics of dividend payouts and their effects on firm risk and market liquidity. The evidence confirms that family ownership concentration affects policy decisions, especially ownership control. The paper’s originality lies in factoring ownership concentration when analyzing how payouts affect firm risk and market liquidity from an emerging markets perspective where controlling shareholders enjoy substantial private benefits, whereas minority shareholders have limited protection.
1. Introduction
Dividend policy has implications for investors, managers, creditors, and other stakeholders. The present value model asserts that a firm’s value corresponds to the present value of an infinite stream of dividends received (Gordon 1962). For investors, dividends serve as regular income and impact firm value (Bernstein 1998). Investments may necessitate seeking additional equity or debt capital, potentially mitigating risk (agency costs) through market monitoring (Easterbrook 1984). Firm performance is influenced by the firm’s policy decisions, cash reserves, and risk exposure.
Investors interpret management’s views concerning the firm’s future profitability prospects for a change in dividends (Miller and Modigliani 1961). Dividend payouts influence firms’ risk and stock liquidity. Decreasing the available cash is a way to check agency problems (Jensen 1986); however, it could limit the investment capacity of companies. Though firms can raise debt to meet investment needs, high leverage tends to increase financial risk, bankruptcy risk, and debt-related agency costs. The threat of financial distress because of over-investments may erode firm value (Myers 1977; Parrino and Weisbach 1999), which presents a good reason for operating at conservative financial leverage levels. Conflicts between debt and equity investors contribute to agency problems when there is a risk of default (Jensen and Meckling 1976). Jensen and Meckling (1976) document the shifting of risk between the stakeholders as an agency problem. Creditors have the prior claim on earnings and assets; shareholders have the residual claim. Therefore, equity investors suffer more due to errors in valuing the firm.
Although most studies focus on developed markets, this study explores the impact of ownership structure and dividends on firm risk (idiosyncratic risk) and stock liquidity within an emerging market, namely India. Corporations often have dispersed ownership in developed countries like the USA and the UK. On the contrary, family firms are prevalent in India and South American nations (Faccio and Lang 2002).
Family firms have concentrated ownership (Gomez-Mejia et al. 2001), leading to higher risks of financial distress (Andres et al. 2009). Business risks impact financing decisions, leading to financial distress and bankruptcy (Booth et al. 2001). Mulyani et al. (2016) observed a negative relation between dividend payouts and debt in tackling agency problems within Indonesian family firms.
Past studies show conflicting associations between stock liquidity and dividend policy. In line with the liquidity cost hypothesis (Banerjee et al. 2007), dividend policy is negatively associated with the market liquidity of the stock, confirming the dividend-signaling approach’s prediction (Ali Taher and Al-Shboul 2023; Mazouz et al. 2023). On the contrary, based on the information content of liquidity, stock liquidity positively relates to firm dividend payouts (Jiang et al. 2017; Stereńczak and Kubiak 2022).
Further in-depth studies are required to empirically validate the diverse conceptual issues surrounding dividends influencing emerging market firms’ idiosyncratic risk and stock liquidity. This paper addresses this gap by offering empirical evidence on the effects of ownership structure variations, including family-controlled versus widely-held firms and ownership concentration, and dividend vis à vis non-systematic risk and the liquidity of Indian firms. The study’s findings have broadened the existing literature on how ownership structure and control interact with dividends on a sectoral level, influencing firm risk and liquidity. The article presents evidence from a developing economy with an ownership structure distinct from advanced markets like the USA and the UK (Faccio et al. 2001; Faccio and Lang 2002).
The study includes 4210 firm-year observations from 421 firms listed on the National Stock Exchange of India. The sample comprises around 60% of family-owned firms. In India, family members hold large ownership and are part of the board and management. These unique attributes present great prospects for investigating how family ownership and control influence policy decisions, thereby affecting the risk and liquidity of a firm.
The study shows that family firms have higher idiosyncratic risks and lower market liquidity than widely held firms. It further submits that the alignment of interest between owners and managers enhances firms’ profitability; however, a higher concentration of family ownership tends to elevate risks and diminish firm value. The findings indicate that dividend payouts mitigate firm risk and are associated with a valuation premium. Sectoral evidence shows that firms’ risk and market liquidity differ at the sectoral level. Though the study sample is confined to India, dividend distribution enhances the perception of family-owned businesses in developing economies characterized by high ownership stakes and inadequate corporate governance (Mitton 2004). Additionally, it offers insights into the role of family ownership in the advancement of firms in these economies. The study findings are of significance to academicians and corporate managers.
The remainder of the article proceeds as follows. In Section 2, we discuss the relevant literature and develop the hypotheses. Section 3 explains the sample and data characteristics. Section 4 develops the econometric model, and empirical results are analyzed in Section 5. Section 6 concludes the study.
2. Literature Review and Hypothesis Development
The impact of dividend payouts on firms’ cash position and share price is of considerable importance to corporate managers, investors, and economists seeking to understand the functioning of capital markets. Lintner (1956) is apprehensive about the stability of dividend policy, suggesting that managers are reluctant to alter a firm’s payout policy unless they observe a sustained change in earnings, gradually adapting to the target dividend policy. Walter (1956) documents that the internal rate of return and cost of capital of a firm optimize shareholder capital.
Gordon (1959) documents that in uncertain conditions, dividends hold significance because investors, being risk-averse, favor immediate dividends over uncertain future capital gains. Gordon proposes the bird-in-the-hand argument. The cash-flow uncertainty adversely influences the payouts (Chay and Suh 2009). Gordon (1962) finds that dividend policy is crucial in determining a firm’s valuation, as it posits that the share price is equivalent to the present value of an endless series of dividends. Nevertheless, classical theories face critique for a lack of transparency in investment policies and disregard for external financing considerations.
Dividend payouts influence firms’ risk and liquidity. Reduced free cash checks agency costs (Jensen 1986); however, it may restrict corporations’ investment capabilities. However, firms can raise debt to meet investment needs. Miller and Modigliani (1961) link capital markets and dividend policy and document that in a perfect capital market scenario, where there are no taxes, a fixed investment policy, and no uncertainty, dividends become inconsequential. In this context, companies distribute dividends while strategically timing the issuance of additional shares to secure equity capital for an optimal investment policy. Tradeoff and pecking order theories are two important theories of capital structure explaining how leverage may add value to the firm.
According to the tradeoff theory (Myers and Majluf 1984), a firm might increase its debt level until the marginal benefit of tax advantages from additional debt enhances firm value, surpassing potential costs associated with financial distress. Financial distress relates to the bankruptcy and agency (information asymmetry) costs arising when a firm’s creditworthiness is doubted. Firms prefer a low payout if external financing constraints are high (Cleary 2006). However, the tradeoff theory does not explain why profitable firms maintain low debt levels. Pecking order theory suggests that firms prioritize retained earnings over debt financing. Thus, it explains why profitable firms borrow less and how less profitable firms accumulate debt. Applying tradeoff and pecking order theories, Fama and French (2002) document that financially sound firms exhibit lower levels of financial leverage during heightened investment requirements and maintain conservative long-term dividend payouts.
While pecking order and tradeoff theories theoretically align the interests of shareholders and managers, in practice, it is far from reality. When combined with bankruptcy theory, information asymmetry elucidates how excessive leverage can erode firm value. Researchers offer diverse explanations for dividend payment behavior and its consequences on performance, risk, and stock liquidity.
2.1. The Agency Theory
Agency theory describes the interplay between ownership structure and various policy decisions, such as dividend, financing, and investment decisions. Therefore, ownership structure influences risks through these policy decisions (Rajverma et al. 2019). This paper discusses two types of agency problems, also termed the alignment and entrenchment theories (Wang 2006), (1) owners versus managers conflicts and (2) conflicts between shareholders (majority versus minority).
Type I agency problems (alignment theory) discuss information asymmetry between owners and managers, which is common in firms with dispersed ownership (Jensen and Meckling 1976). Berle and Means (1991) discuss the separation of ownership and control issues. However, these conflicts are lower in family firms as control remains within the family (Burkart et al. 2003), and managers are more likely to overinvest when firms have high free cash flow (Richardson 2006). Dividend payments reduce the excess cash available for investment (Jensen 1986), hence checking the owner-manager agency issues (Rozeff 1982). Other probable ways of means of lowering these conflicts accompanying surplus free cash flow involve more debt (Jensen 1986), strong external auditing (Griffin et al. 2010), and higher institutional ownership (Karpavicius and Yu 2012). Institutional investors, including foreign ones, are subject to a higher degree of information asymmetry and exert pressure on managers to distribute excess cash as dividends to mitigate agency problems (Baba 2009; Jensen 1986). External fundraising from financial markets brings in market monitoring (Easterbrook and Fischel 1984); thus, external borrowing lessens the problem of over-investment.
Type II agency problems (entrancement theory) depict the expropriation of minority shareholders by majority shareholders having a controlling stake. The entrenchment theory underlines the agency issues between the family (owner-manager) and other shareholders (Ho and Kang 2013). Controlling families enjoy increased access and privilege, enabling them to potentially exploit a firm’s value to the disadvantage of minority shareholders (Milosevic et al. 2015). Demsetz and Lehn (1985) mention that when owners are managers, it benefits firms in mitigating agency problems (Type I) but gives rise to the expropriation of minority shareholders (Type II).
Family participation in business is widespread, exhibiting diverse characteristics across nations (Mulyani et al. 2016). Family promoters have contributed immensely to the advancement of the Indian economy. Some well-known family groups are Tata, Birla, Reliance, Bajaj, Dabur, and Godrej, among many others. Family business houses own and control multiple and distinct legal firms, directly or indirectly, and the extent of family ownership varies in each firm (Singh and Gaur 2009). Families are keen on passing the control to the next generation (Anderson et al. 2003).
Founders and family members typically hold key executive roles and wield influence over strategies in family firms. Their significant shareholdings incentivize them to monitor firm performance, fostering greater interest alignments and enabling them to undertake calculated risks (Geeta and Prasanna 2016). Alternatively, due to reputational concerns and an inherent desire to protect resources, family members refrain from risk-taking (Anderson and Reeb 2003). Paligorova (2010) finds that an increase in family ownership is correlated with a decline in the level of risks. Ownership and control alignment helps in quicker and better decision-making, reducing unnecessary costs, enhancing profitability, and reducing risks. Close monitoring by family members helps alleviate revenue leaks (Balasubramanian and Anand 2013). On the contrary, Nguyen (2011) documents that ownership positively correlates with firm-specific (non-systematic) risk. Family firms have low diversification, leading to elevated market and firm risks (Shleifer and Vishny 1997).
Thus, the optimal risk level results from the tradeoff between the benefits and costs associated with high ownership concentration. In summary, family firms possess an edge over widely held firms because of quick decisions, greater synergy, and stability.
Hypothesis 1a:
Family firms have higher firm risk compared to widely held firms.
Hypothesis 1b:
Family ownership and firm risk are positively related.
The bankruptcy and uncertainty theory focuses on the risk, which may affect a firm’s financing decisions. Generally, family firms have undiversified portfolios with excessive risk (Shleifer and Vishny 1997), and a rational investor is less likely to invest in firms with high risk. Therefore, the liquidity of risky stocks is low. Liquidity refers to how easily an asset or security can be traded in the market without significantly impacting its price.
Hypothesis 2:
Stocks of family-controlled firms are less liquid.
2.2. The Signalling and Bankruptcy Theories
Signaling theory examines how the market reacts to dividend announcements. Investors view dividend changes as indicators of changes in the firm’s future prospects (Miller and Modigliani 1961). Managers are reluctant to cut dividends because it adversely impacts the stock prices, and they increase payouts only when they are confident about the enhanced profitability of the firm (Lintner 1956).
Signaling theory (Bhattacharya 1979) refers to the market reaction to dividend announcements. The signaling theory posits that information indicating reduced risk holds greater significance. A dividend increase typically signals superior health and better prospects for a firm. Goddard et al. (2006) support signaling theory and acclaim that firms announce a higher payout to signal superior inside information and better future earnings.
Another interpretation of why firms distribute dividends is the free cash flow hypothesis (Jensen 1986), which posits dividends as a strategy to alleviate the agency costs associated with excess cash flows (owners-managers problem). Dividend payouts decrease available free cash flow, thereby limiting over-investment opportunities (Black 1996).
The bankruptcy theory centers on business risk, as financing decisions may be affected if a company fails to fulfill its financial obligations. The equity’s cost for a leveraged firm exceeds that of an unleveraged firm with comparable business risk (Modigliani and Miller 1958). According to tradeoff theory, leverage contributes to risk level. Andres (2008) documents that family firms seek to reduce their leverage because of high levels of financial distress (risk).
Dividend signaling generally offers insights into a firm’s valuation and health, reflecting risk factors associated with asymmetric information. A high dividend or dividend increase typically signal better health and superior prospects for the firm. As insiders, managers have better information compared to outside investors. Investors may react positively to any increase in dividend payments. Grullon et al. (2002) relate dividend payout changes with firm maturity. Mature firms have limited investment opportunities, high profitability, and high free cash flows. They document that firms witnessing dividend increases observe a marked decrease in market risk and vice versa.
Drawing from signaling and bankruptcy theories, we anticipate a negative correlation between risk and dividend payout.
Hypothesis 3:
Dividend and firm risk are negatively related.
Hypothesis 4:
Dividend and stock liquidity are positively related.
2.3. Sectoral Differentiation
Firm policy differs sectorally, as do the firms’ profitability, risk, and market liquidity. Generally, when profitability is low and business risks are high, a company favors lower debt levels. Manufacturing and construction firms have substantial investments in tangible assets, whereas service sector firms have more intangible assets and higher employee costs. Service firms’ profits flow mainly from intangible assets. However, firms with high investments in intangible assets are more risky. Physical assets serve as collaterals for debt financing (Scott 1977); thus, investment in tangible assets lowers idiosyncratic risk. Intangible assets are also associated with low debt ratios (Myers 2001).
Levered firms have a higher equity cost than unlevered firms with similar business risks (Modigliani and Miller 1958). Under conditions of uncertainty, dividend policy is relevant because investors are risk-averters, and as such, they prefer near dividend payouts over uncertain capital gain in the future (Gordon 1959). Gordon (1959) presents the bird-in-the-hand argument, suggesting a preference for near-term dividends over uncertain capital gains.
Hypothesis 5:
Firm risk differs at the sectoral level.
Hypothesis 6:
Stock liquidity differs at the sectoral level.
3. Sample and Data Characteristics
The study explores the impact of ownership structure and dividend on idiosyncratic risks and stock liquidity of National Stock Exchange (NSE) listed firms between 2006 and 2017, drawing data from the Centre for Monitoring Indian Economy (CMIE). The sample excludes non-financial and non-dividend-paying firms. Non-dividend-paying refers to companies that have not distributed dividends for three or more consecutive years. The study excludes stocks (firms) with no significant yearly trading. The sample firms consist of 421 firms.
We construct several groups based on family ownership concentration and management control. Family firms (FAMILY) are defined as those with at least 5% equity ownership held by a family, either individually or collectively. In contrast, widely held firms encompass the remaining ownership structure (WIDE) (Villalonga and Amit 2006). FAMILY comprises 250 firms (60%), and 171 are widely held firms. Family-controlled firms (FAMCON) represent those with a minimum of 20% family ownership (Faccio and Lang 2002; Kusnadi 2011) and comprise 165 firms (39%). CORPCON and INSCON are firms with corporate and institutional ownership concentrations of at least 30%, respectively. CORPCON includes 222 (53%) firms, and 34 (8%) belong to INSCON.
The study also differentiates firms based on industry. Sectoral classification is carried out as per CMIE industry classification. Construction and construction material (CONS) consist of 54 firms; chemical and chemical products (CHEM) comprise 82 firms; consumer goods and food and agro-based products (DUR) consist of 47 firms; machinery and transport equipment (MACH) consist of 81 firms and services (SERV) comprise 77 firms. The remaining 80 firms (OTH) include mining, electricity, textiles, metal and metal products, miscellaneous manufacturing, and other diversified industry sectors. Table A1 provides a summary table detailing the sectoral classification of sample firms based on ownership and industry.
4. Methodology and Econometric Model
This section elaborates on the methodology and econometric model employed to analyze how ownership structure and dividends affect idiosyncratic risk and stock liquidity among the sampled firms.
4.1. Firm Risk and Market Liquidity
The risk model uses firm-specific risk (FirmRisk) or non-systematic or idiosyncratic risk as a dependent variable. Stock return volatility quantifies the overall (total) risk of a company (Nguyen 2011). We calculate a firm’s total risk as the standard deviation of its weekly returns (at least 50). The systematic risk (market risk) of a firm is calculated using the standard deviation of weekly market return (Nifty-50) and BETA (a measure of volatility used to calculate the expected return of stocks relative to market return). Residual risk represents the idiosyncratic (non-systematic or firm-specific) risk (Ferreira and Laux 2007). Firm-specific risk measures the risk associated with investing sizable wealth in a single organization (Geeta and Prasanna 2016). The study uses weekly stock returns to calculate a firm’s total risk (annualized), and a minimum of 50 weekly data are used.
Stock liquidity (LIQ) is calculated using the illiquidity measure given by Amihud (2002). We select two firms from each combination of ownership control (3) and sectors (5) based on market capitalization subject to positive earnings and dividend payout. Assuming that dividends are declared in the fourth quarter of a financial year, daily data are drawn for these 30 firms for the January–March quarter from FY13 through FY17. We calculate weekly firm-specific risk using daily stock returns, nifty-50 returns, and market Beta.
The Breusch–Pagan Lagrange Multiplier and Hausman-specific tests help choose the most efficient estimator for panel data analysis. The p-value of the Breusch–Pagan and Hausman tests was significant (<0.0001). Diagnostic tests confirm that the fixed effects (FE) model is more efficient and suitable at the aggregate or group level. However, to address the autocorrelation and heteroscedasticity problems (significant with FEM estimates), we employ a weighted least squares model for panel data analyses. The specific models (in subsections) offer comprehensive explanations of the dependent variables and control parameters incorporated within the framework. Table 1 outlines the definitions of the variables used.

Table 1.
Variables definition.
4.1.1. Risk Model
The bankruptcy theory states that risk affects a firm’s financing decisions. On the other hand, the tradeoff theory discusses the equilibrium between the advantages and drawbacks of debt financing. Healthy and profitable firms are less inclined to share potential profits with new investors and prefer new debt issuance compared to equity dilution (Koch and Shenoy 1999).
The risk model also comprises the debt–equity ratio (DE), operating risk (RISK), systematic risk (BETA), quick ratio (QR) measuring liquidity, firm valuation measured by Tobin’s Q (TQ), wages (WAGE), free cash flow to firm (FCFF), and firm size (SIZE) as control parameters. A company selects optimal debt levels by weighing the tax benefits gained from additional debt against the potential costs associated with financial distress, as suggested by the tradeoff theory (Myers 1984). RISK captures the volatility of firms’ earnings. Bathala and Rao (1995) reveal that earnings volatility is a prime indicator of firm performance. Since profitable and healthy firms entail low risks, BETA captures the firm’s systematic risk. QR captures a firm’s short-term liquidity (Francis and Stokes 1986). Tobin’s Q (TQ) and return on assets (ROA) measure the firm value and profitability. FCFF and SIZE are included to capture a firm’s free cash flow and size effect. Maturity theory recommends that as firm size increases, profitability tends to increase, but investment opportunities decline, leading to enhanced free cash flow (DeAngelo et al. 2006; Fama and French 2001). Large firms tend to have greater diversification and are thus less susceptible to bankruptcy risks (Titman and Wessels 1988). WAGE (ratio of wages to sales) captures the employee cost pressure on FirmRisk.
Family dummy (FAMILY) and ownership concentration (FAM) are included to assess its impact on FirmRisk.
R1
R2
Sectoral dummy variables are incorporated to explore potential variations in firm-specific risk (FirmRisk) across sectors.
R3
where FirmRisk indicates the firm-specific risk. DIV and DE represent dividend payout and financial leverage. Operating risk, systematic risk, and quick ratio are represented by RISK, BETA, and QR, respectively. Tobin’s Q (TQ), return on assets (ROA), and free cash flow to the firm (FCFF) indicate valuation, profitability, and excess cash. Salary and wages-to-sales ratio and firm size are indicated by WAGE and SIZE. Family and FAM represent family dummy and family ownership concentration, respectively. SECTOR (dummy matrix) represents specific sectors. Table 1 describes each variable.
4.1.2. Liquidity Model
The liquidity model examines the impact of ownership structure and dividend over stock liquidity (LIQ). Ownership control dummies and dividend yield (DIVYLD) capture the two aspects. In the liquidity model, BETA and FirmRisk are included to capture systematic and non-systematic risks of a firm, respectively. Theoretically, liquidity and risk are negatively related. Stoll (1978) suggests that illiquidity (reciprocal of liquidity) positively links to risk as a risk-averse trader sets a higher bid-ask spread for risky stocks. Copeland and Galai (1983) argue that liquidity decreases with an increase in stock volatility. As discussed, profitable and healthy firms have low risks. Price-to-earnings (PE) and market-to-book (MTB) ratios capture a firm’s profitability and valuation. The return on stocks decreases with an increase in stock volatility (Constantinides and Scholes 1980), therefore leading to lower liquidity. Sector dummies are included to examine if liquidity varies sectorally.
where LIQ indicates the trading liquidity of stock. DIVYLD represents dividend yield. BETA and FirmRisk specify systematic and non-systematic risks, respectively. PE and MTB denote share value as a multiple of earnings and book value, respectively. CONTROL and SECTOR are dummy matrices symbolizing management control and sectors, respectively. Table 1 defines each variable.
5. Results and Discussion
5.1. Summary Statistics
Table 2 presents descriptive statistics of the principal variables in the risk model for aggregate, WIDE (widely held), FAMILY (family), and FAMCON (family-controlled) firms using 2006 to 2017 yearly data. The mean idiosyncratic risks (FirmRisk) are 37.97%, 34.42%, 40.42%, and 41.62% for aggregate, WIDE, FAMILY, and FAMCON firms, respectively. The mean dividend payouts are 15.60%, 17.74%, 14.14%, and 12.58% for the four groups. These results confirm that family firms have higher firm-specific risks and low dividend payout vis à vis WIDE firms, consistent with agency theory, supporting Hypotheses 1a and 3.
Table 2.
Variables: descriptive statistics.
This table offers descriptive statistics for important parameters. FirmRisk indicates the idiosyncratic risks. DIV and DE represent dividend payout and financial leverage (debt–equity ratio). Operating risk, systematic risk, and quick ratio are represented by RISK, BETA, and QR, respectively. Tobin’s Q (TQ), return on assets (ROA), and free cash flow to the firm (FCFF) indicate the valuation, profitability, and excess cash. Salary and wages-to-sales ratio and the firm size are indicated by WAGE and SIZE. Table 1 explains each variable.
The average debt–equity ratios are 66.93%, 55.22%, 74.94%, and 69.49% for aggregate, WIDE, FAMILY, and FAMCON firms. This evidence suggests that family firms have lower payouts but elevated financial leverage than widely held firms, confirming the expropriation of minority shareholders. Market risk (BETA) and Firm Liquidity (QR) are higher for family firms than widely held firms.
The mean firm value measured by Tobin’s Q (TQ) is 2.52, 3.06, 2.16, and 1.96 for aggregate, WIDE, FAMILY, and FAMCON firms, suggesting that higher information asymmetry (expropriation of minority shareholders) erodes the value of a firm. As expected, the WIDE firms’ average size is higher than family firms, demonstrating ownership diffusion and economic value in addition to maturity.
5.2. An Overview of Trend
Figure 1 shows that the dividend payout increased during the study period for all sample groups. These results support Lintner’s (Lintner 1956) arguments wherein management is reluctant to decrease dividends because of the negative impact on stock prices. However, the increase in dividend payouts is lower in family firms, suggesting a quick decision-making process to cut losses and expropriation of minority shareholders, respectively.
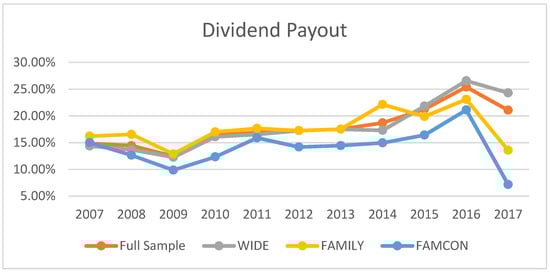
Figure 1.
Dividend payout.
In India, dividend payouts are generally decided by the availability of profits and liquidity (Das 2017). The decrease in payouts in 2009 is largely attributable to the subprime crisis of 2007–08. The dip in 2017 is even more pronounced due to the macroeconomic policy shock (demonetization in 2016) that led to a considerable decline in the long-term target dividend payout (Bhat et al. 2021).
This graph provides the yearly weighted dividend payout for sample firms for full sample firms, WIDE firms, FAMILY firms, and FAMCON firms.
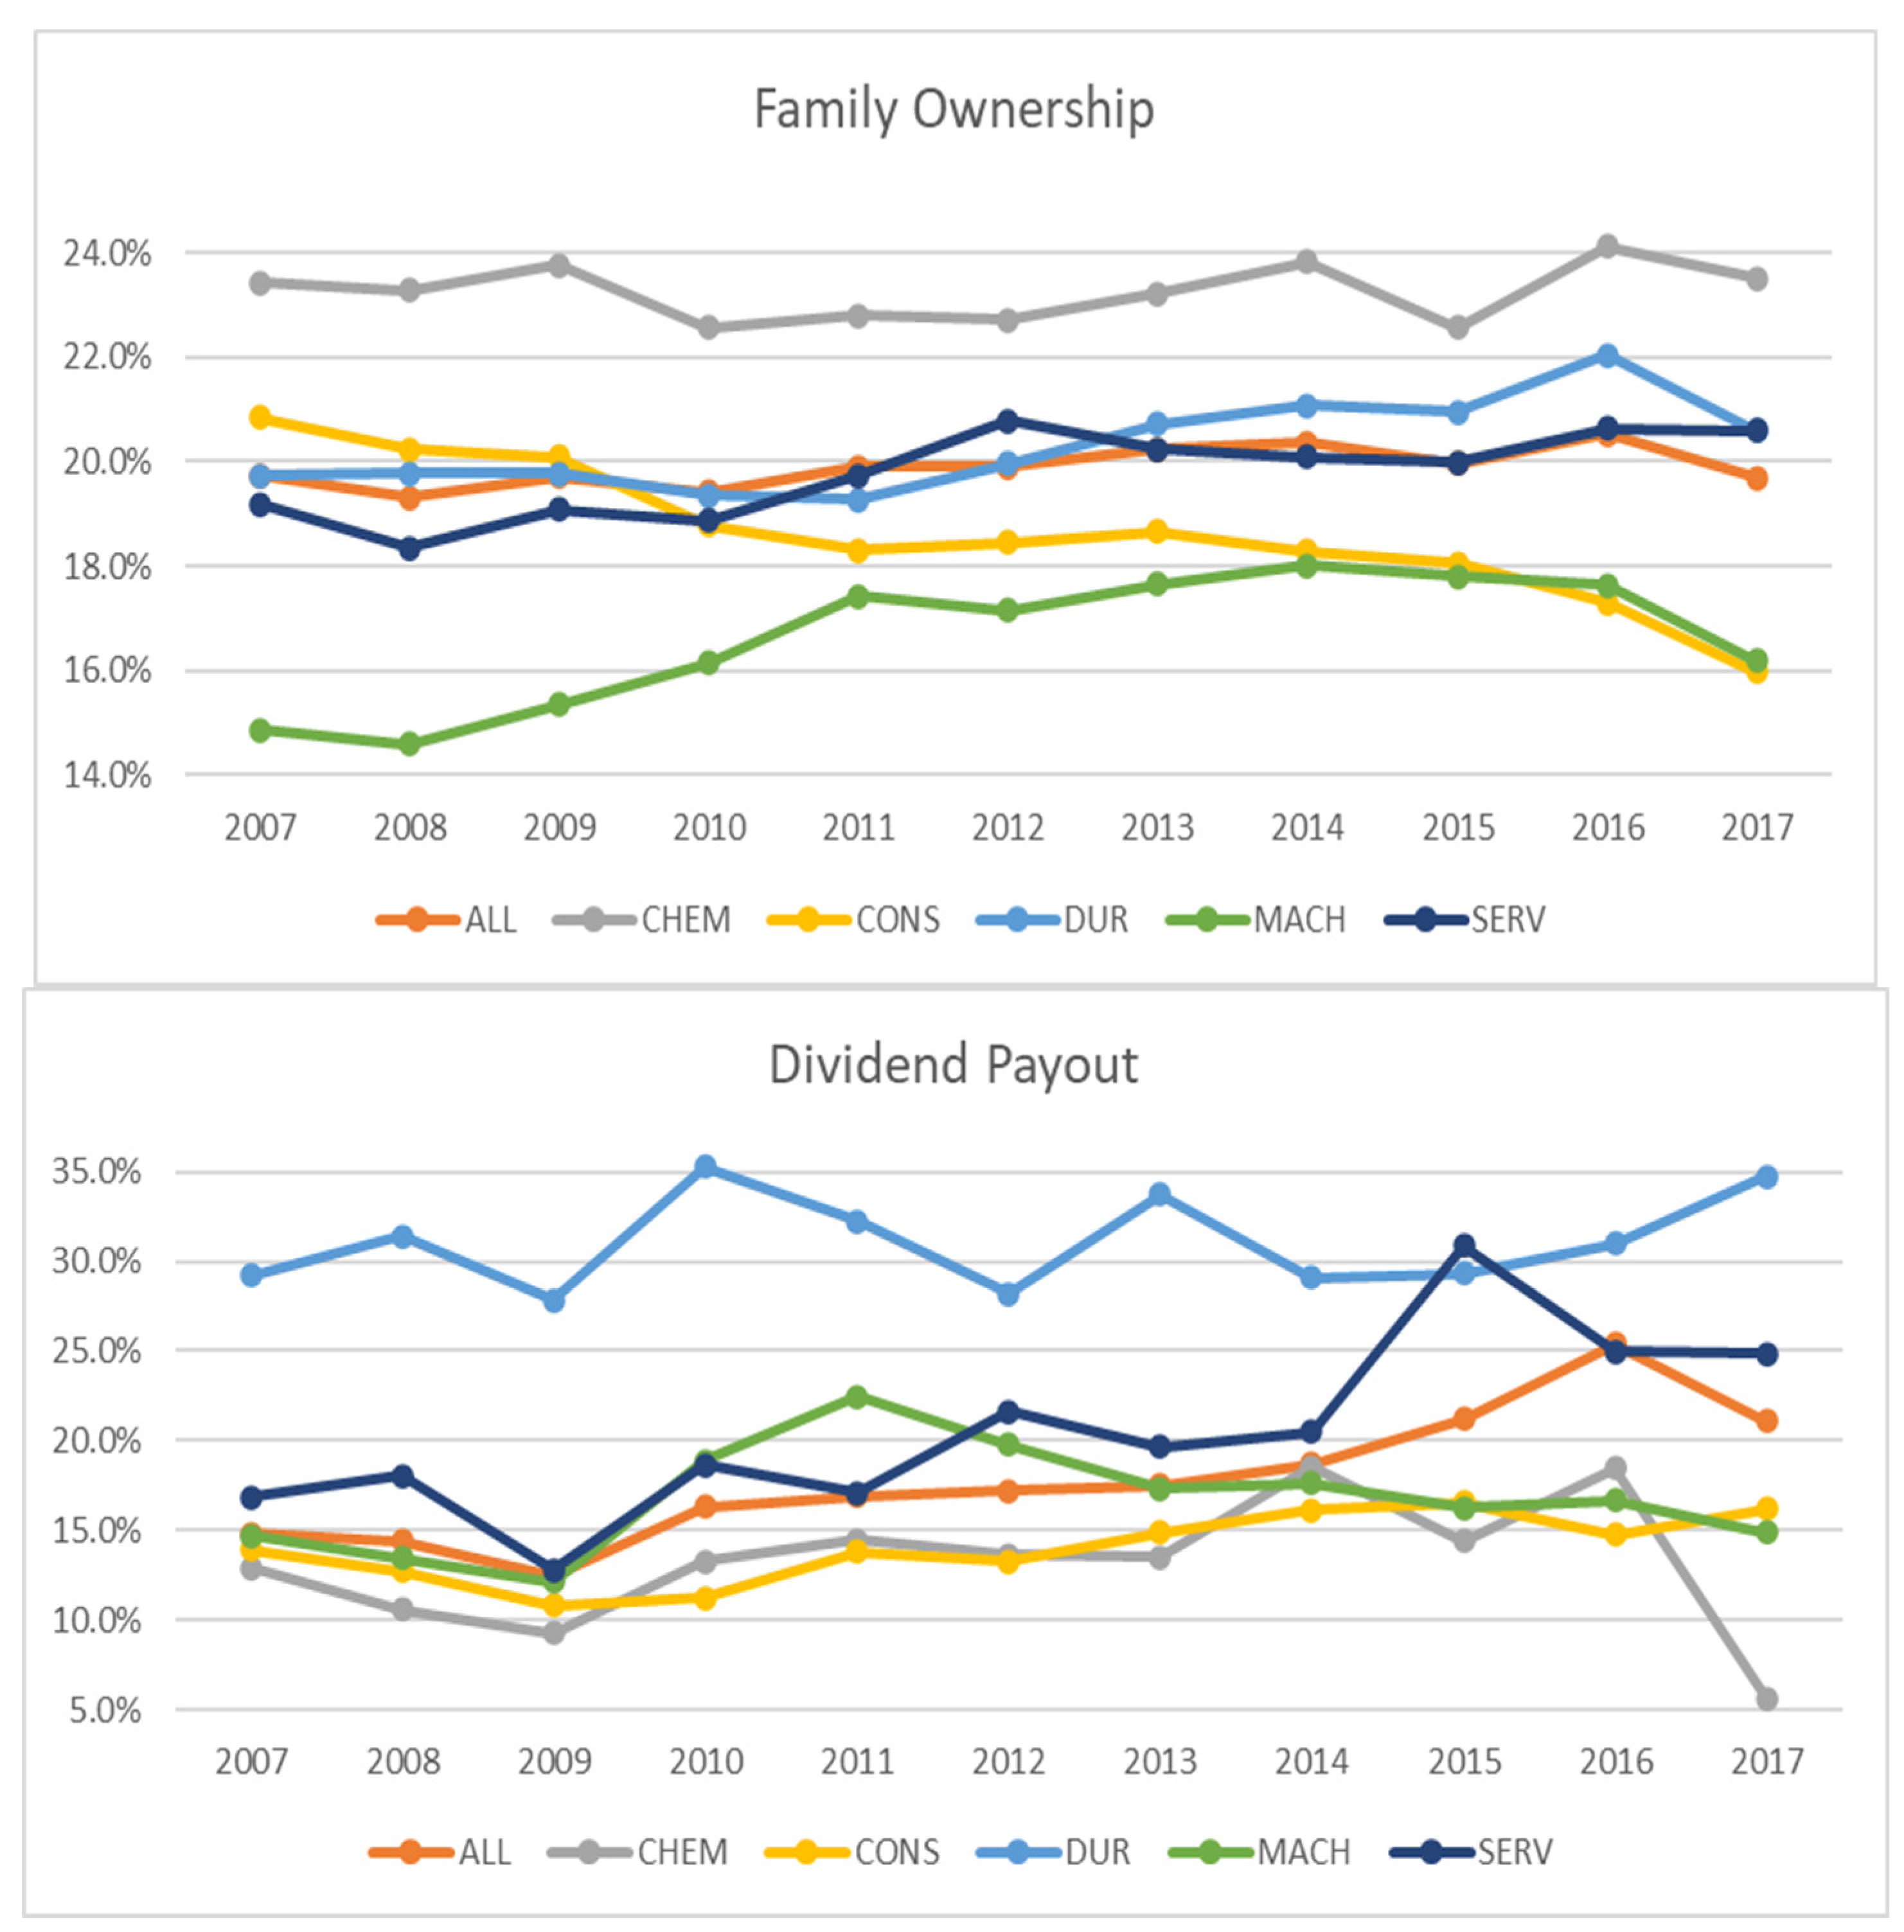
This graph shows the average family ownership concentration and weighted average dividend payout for sample firms at the sectoral level yearly.
Figure 2 shows that the average family ownership is highest among chemical sector firms, followed by consumer durables and services firms. Construction firms show a decline in family ownership concentration from 2007 through 2017. Similar to Figure 1, the weighted average dividend payout increased during the study period for the sample firms on a sectoral basis.
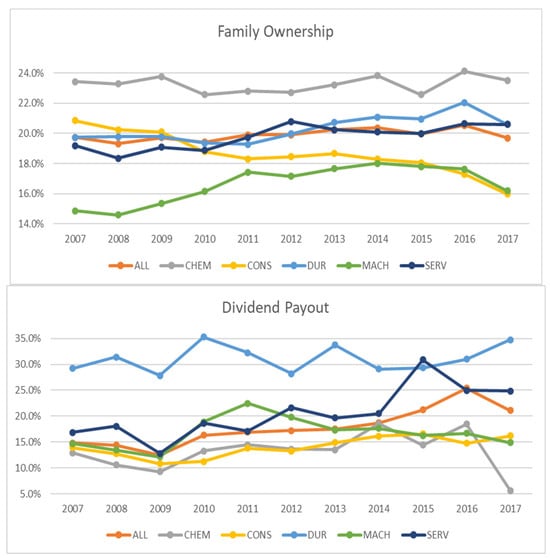
Figure 2.
Sectoral ownership structure and dividend payout.
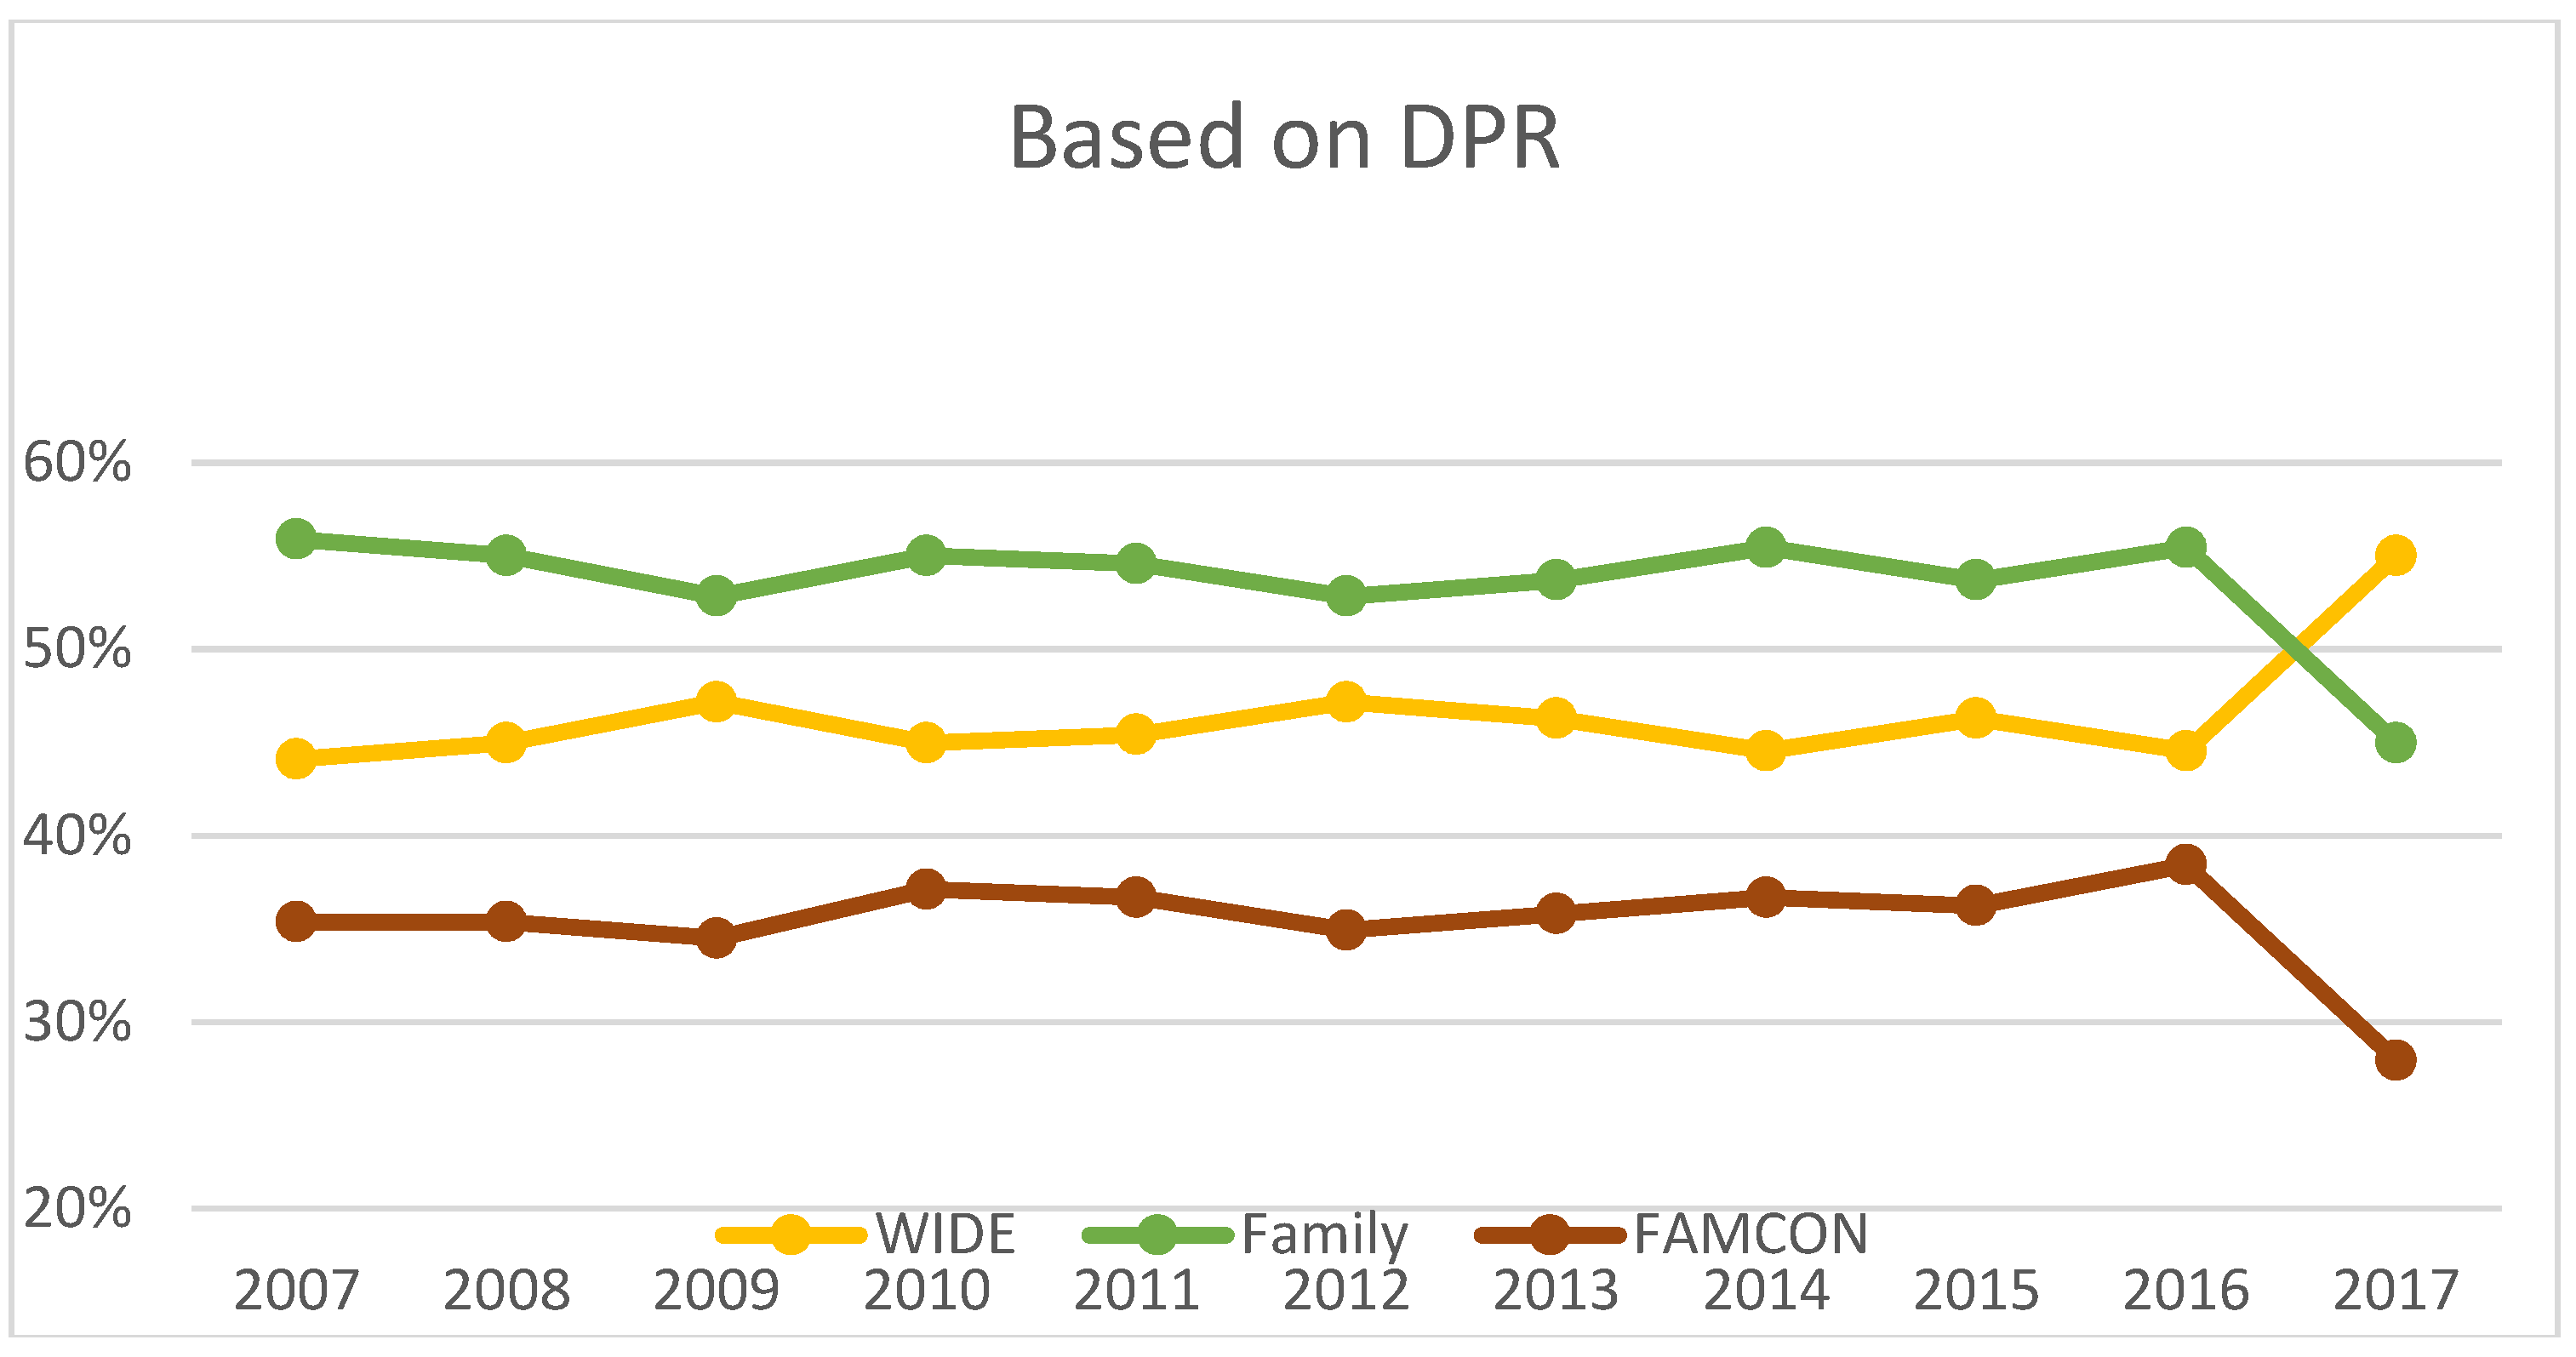
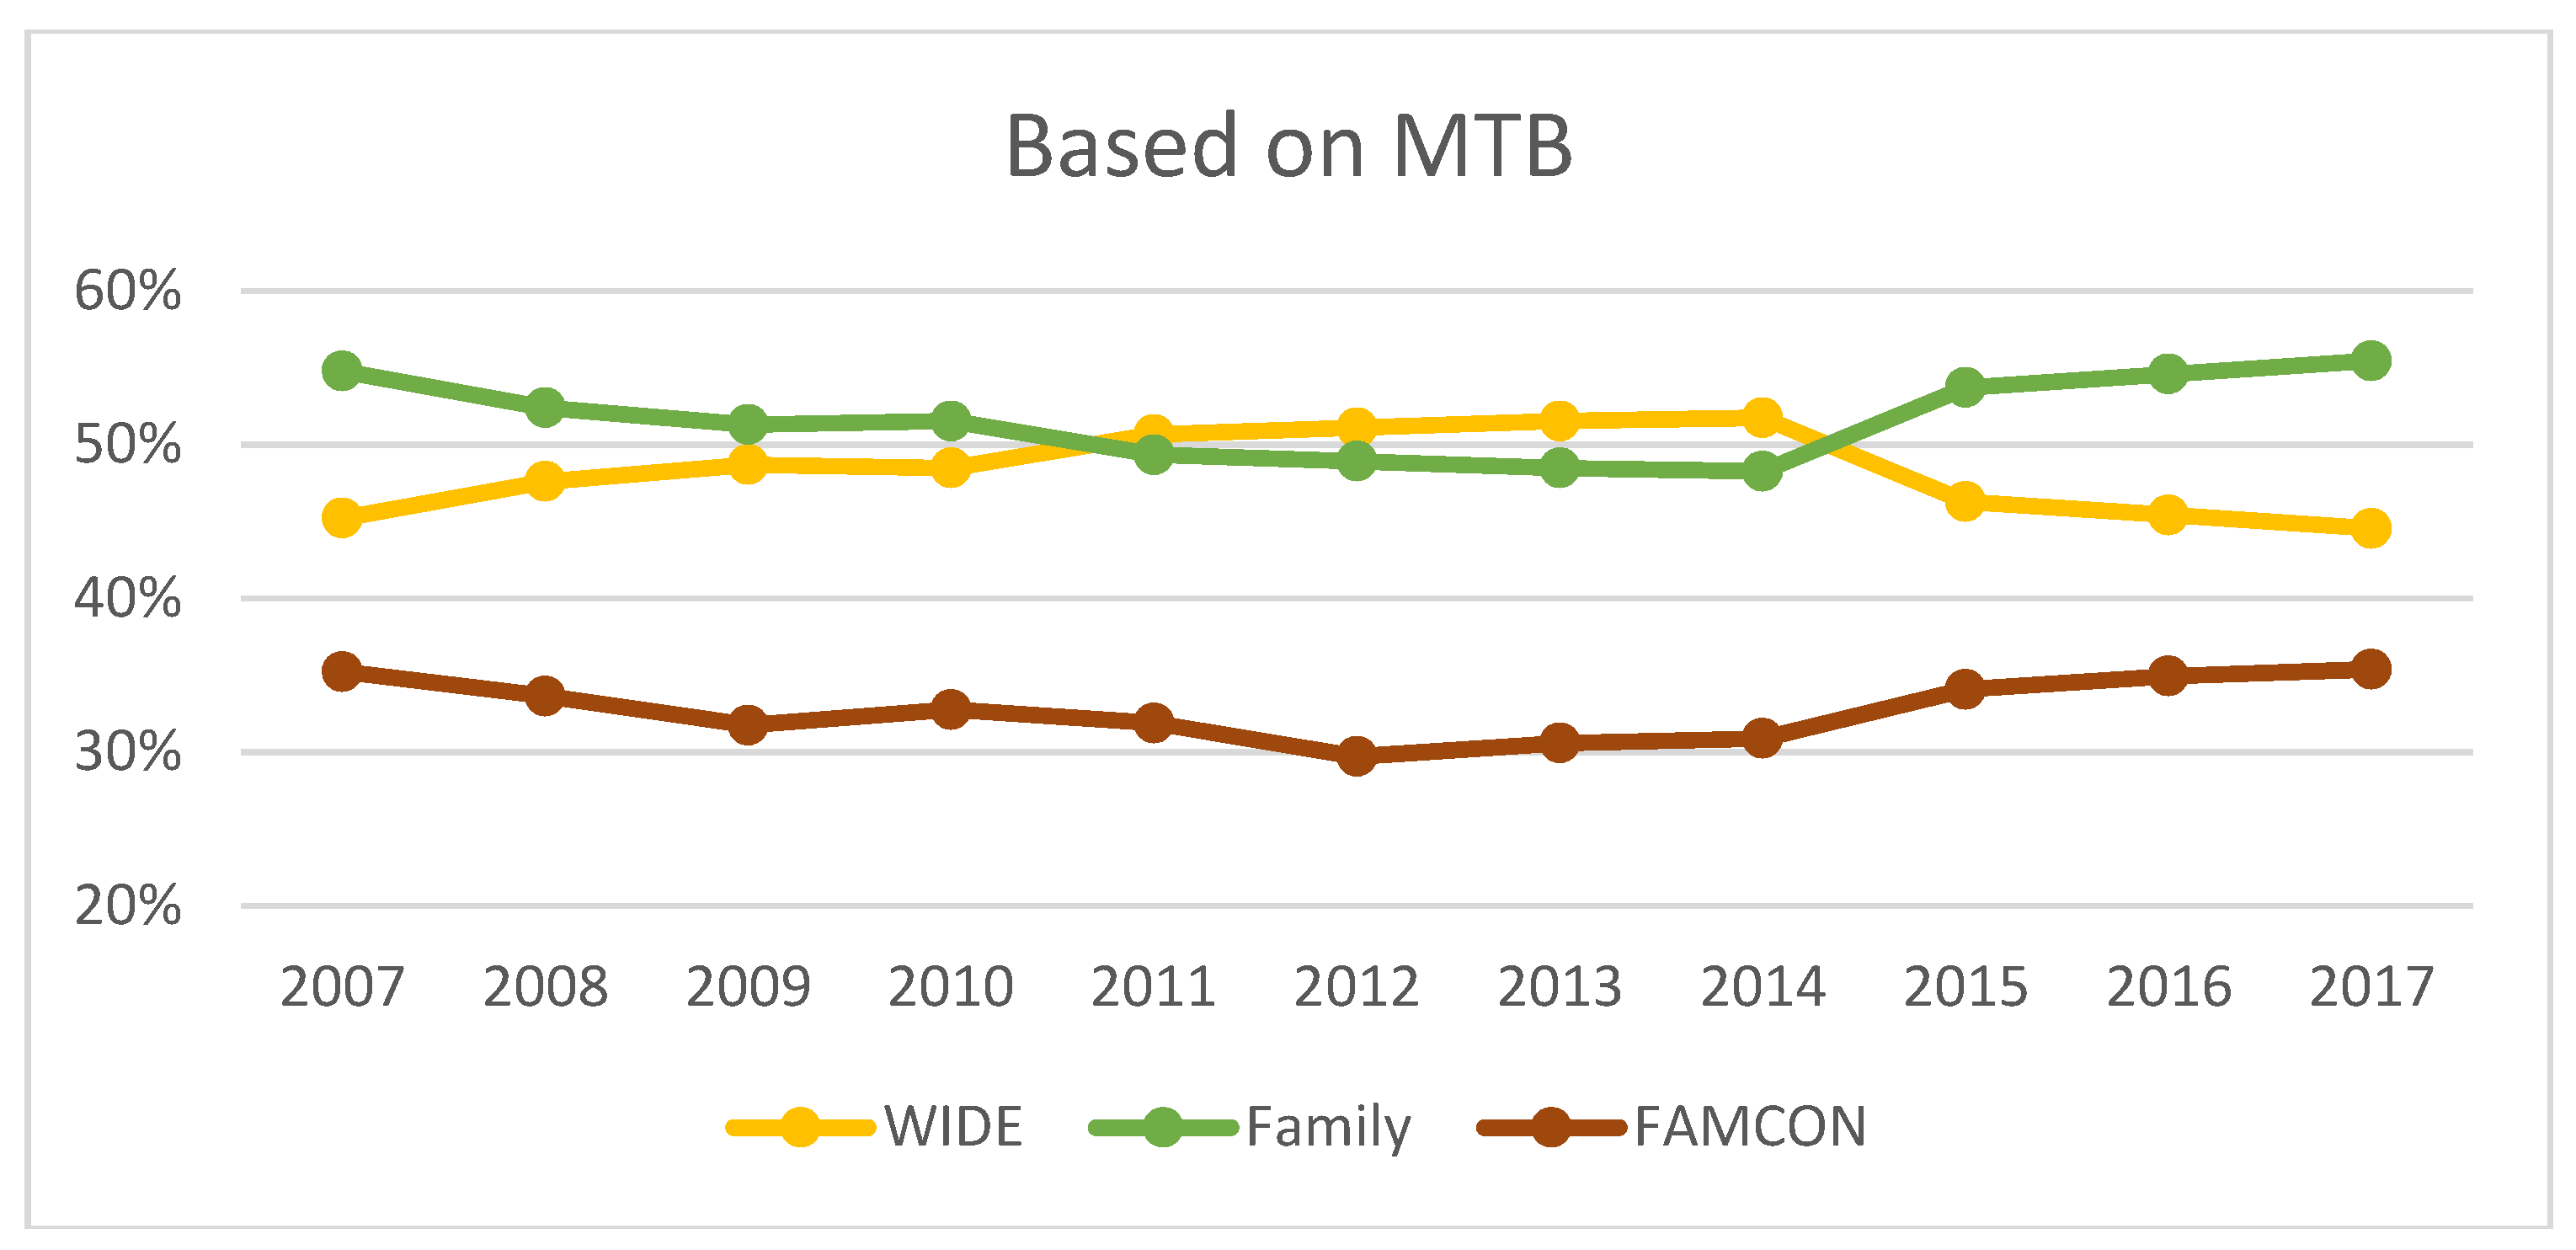
The chart (Figure 3) shows that widely held (family) firms have a higher (lower) composition than the aggregate level composition in both scenarios, confirming that widely held firms have higher dividend payout and are more valuable.
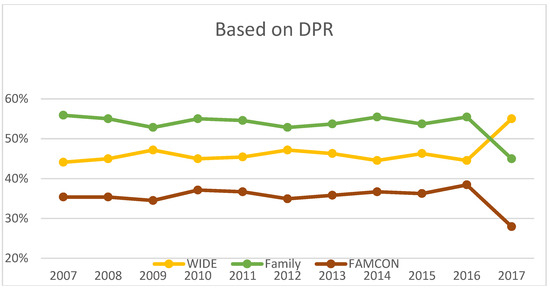
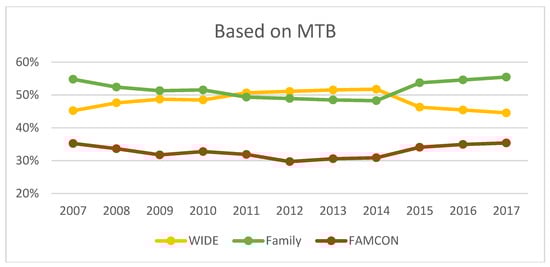
Figure 3.
Firm composition of upper median.
This graph provides the yearly percentage firm composition of the upper median for WIDE, FAMILY, and FAMCON firms based on dividend payout and market-to-book value ratios.
5.3. Analysis of Variance: Firm Risk
Table 3 provides a one-way ANOVA of idiosyncratic risks for sample firms based on management control and sectors. It shows that firm-specific risks significantly differ for control factors and at the sectoral level. The Bonferroni Comparison (Panel A) shows that the non-systematic risks of family-controlled firms differ from those of corporate- and institutionally controlled firms. However, the non-systematic risks of corporate-controlled and institutionally controlled firms are not significantly different (p = 71%). Similarly, Panel B shows that the idiosyncratic risks of the service sector firms differ from those of chemicals, consumer durables, and machinery. For all other sectoral combinations, the non-systematic risks are not significantly different. This evidence is consistent with Hypothesis 5, which suggests that FirmRisk differs at the sectoral level.
Table 3.
Analysis of Variance: one-way.
This table provides a variance of analysis (ANOVA) of non-systematic risks of sample firms, which are part of five sectors. FAMCON, CORPCON, and INSCON represent firms controlled by family, corporate, and institutional investors. CHEM, CONS, DUR, MACH, and SERV symbolize the chemical, construction, consumer durables, machinery, and services sectors.
Table 4 provides two-way ANOVA estimates of firm-specific risk by categorizing firms based on management control (Factor 1) and sector (Factor 2). The table shows that both the factors (control and sector) are significant. However, jointly, both factors are not significant at a 5% significance level.
Table 4.
Analysis of Variance: two-way.
This table provides a two-way variance of analysis (ANOVA) of non-systematic risks of sample firms belonging to five sectors (chemical, construction, consumer durables, machinery, and services). FAMCON, CORPCON, and INSCON represent firms controlled by family, corporate, and institutional investors.
5.4. Empirical Findings
This section presents regression findings that outline how ownership structure and dividend payout affect firm risk and stock liquidity for the Indian firms sampled in the study.
Table 5 presents the panel regression estimates for the risk models (Equations (1)–(3)). The results uncover that dividends negatively influence firm-specific risk, and levered firms have higher risk levels, consistent with our Hypothesis 3.
Table 5.
Ownership structure, dividend, and FirmRisk.
This table provides the panel regression estimates for risk models (R1, R2, and R3) for the sample firms at the aggregate level.
The results align with uncertainty and signaling theories, indicating a preference for dividends over uncertain capital gains and suggesting that a high dividend signals a firm’s robust health, characterized by low risk. As expected, other risks, including leverage (DE), operating risks (RISK), and systematic risks (BETA), positively contribute to the level of idiosyncratic risks. The firm value measured by Tobin’s Q (TQ) and the firm’s size negatively influences the FirmRisk, consistent with the proposition that healthy and larger firms entail low risk. Wage pressure (WAGE), measured by the proportion of net sales, shows a negative negation with firm-specific risk.
Family dummy and family ownership concentration positively influence firm risks, which supports Hypothesis 1a and Hypothesis 1b. The results show that service sector firms positively associate with FirmRisk at the sectoral level, though coefficients of other sector dummies are not significant. The positive relation of the service sector firms with risk supports Hypothesis 5.
Table 6 provides the regression estimates of the liquidity model (Equation (4)) for the sample firms. The results reveal that stocks with high dividend yield have high trading liquidity and support Hypothesis 4, similar to findings documented for China-listed firms (Jiang et al. 2017) and Warsaw Stock Exchange-listed firms (Stereńczak and Kubiak 2022). The negative influence of family control (dummy) is consistent with Hypothesis 2, which shows that stocks of family firms have lower trading liquidity as they are more risky. Sectoral dummies show that stock liquidity negatively affects construction, consumer durables, and machinery firms; however, service sector stocks have higher liquidity. This evidence is consistent with our Hypothesis 6.
Table 6.
Ownership structure, dividend, and liquidity.
This table presents the panel regression estimates for the liquidity model (Equation (4)) for the sample firms.
5.5. Robustness Test
For the robustness test, the study examined how ownership structure and dividend payout affect firm-specific risk by analyzing panel data spanning the fiscal years 2010 to 2012 at the aggregate level. The estimation offered consistent results (Table A2).
6. Conclusions
The study utilizes panel estimation to explore how dividend payouts impact firm risk and stock liquidity in a setting dominated by family-owned firms. Family involvement in businesses represents a distinctive characteristic of these firms (Chua et al. 1999). Family owners have longer investment horizons than other investor groups. Family firms, which are common worldwide, exhibit the characteristics of concentrated ownership and are under-diversified. The study analyzes 4210 firm-year data from 2006 to 2017 to explore how ownership structure and dividend payout influence idiosyncratic risk and market liquidity, drawing on agency, signaling, and bankruptcy theories.
The findings suggest that in emerging markets such as India, information asymmetries significantly influence the dynamics of dividend payouts and their effects on firm risk and liquidity. The evidence proves that family ownership (and control) affects policy decisions. The evidence shows that dividend payments signal superior health and better earnings prospects for a firm. This evidence supports the signaling theory and Rozeff’s (1982) and Jensen’s (1986) findings. Further, the evidence shows that reduced risk (better health) positively contributes to corporate performance. It supports bankruptcy theory. Sectoral evidence supports our hypotheses and shows that it (sector) influences firms’ idiosyncratic risks and market liquidity.
This study adds significant value to the current body of literature. As scholars persist in investigating the severity of agency problems, our assessments illuminate this issue by examining the influential role of ownership structure and dividends, particularly among emerging market firms. Policymakers could use the findings to support efforts to enhance firm performance, particularly for family-owned businesses. By adopting improved payout distribution and financing strategies, managers can mitigate information asymmetry, enhancing firm performance and shareholders’ wealth. In family-controlled firms, owners are the managers. The positive relation between family dummy and family ownership concentration with firm risk highlights how information asymmetry contributes to increased risk levels. The negative influence of dividends over risks confirms that dividend payments tend to reduce information asymmetry. Since risk negatively influences the market liquidity of a firm, corporate managers should increase payouts to enhance the trading liquidity of a stock.
7. Future Research
Subsequent studies could thoroughly examine firms within specific sectors while examining the role of dividends concerning corporate performance. Further, the study sample can be segregated into value stocks (high capital gains) and dividend stocks (high dividend yield) to study the impact. Additionally, family firms are concerned with governance and succession. Field research might add value and provide insights into the operation of family firms.
Funding
This research received no external funding. The open access publication (CC BY license) charge was funded by the affiliating institution.
Data Availability Statement
The supporting data for the findings of this study can be obtained from the corresponding author upon request.
Conflicts of Interest
The author declares no conflicts of interest.
Appendix A
Table A1.
Composition: sectoral and ownership type.
Table A1.
Composition: sectoral and ownership type.
| Sector | Notation | All Firms | FAMCON | CORPCON | INSCON |
|---|---|---|---|---|---|
| Construction | CONS | 54 | 19 | 33 | 2 |
| Chemicals | CHEM | 82 | 35 | 43 | 4 |
| Consumer Durables | DUR | 47 | 17 | 27 | 3 |
| Machinery and Transport Equipment | MACH | 81 | 31 | 43 | 7 |
| Services | SERV | 77 | 31 | 34 | 12 |
| Others | OTH | 80 | 32 | 42 | 6 |
| Grand Total | 421 | 165 | 222 | 34 |
This table outlines the sectoral makeup and management control based on the ownership concentration of the sampled firms.
Table A2.
Time robustness—firm risk.
Table A2.
Time robustness—firm risk.
| Coefficient | Standard Error | t-Ratio | p-Value | |
|---|---|---|---|---|
| Intercept | 41.7104 *** | 1.6269 | 25.6377 | <0.0001 |
| DIV | −9.4831 *** | 1.9536 | −4.8543 | <0.0001 |
| DE | 3.2683 *** | 0.3810 | 8.5774 | <0.0001 |
| RISK | 0.6301 *** | 0.0992 | 6.3516 | <0.0001 |
| BETA | 7.5919 *** | 0.8949 | 8.4838 | <0.0001 |
| QR | 0.9399 *** | 0.1875 | 5.0132 | <0.0001 |
| TQ | −0.0359 *** | 0.0560 | −0.6410 | 0.5216 |
| ROA | −5.1239 | 2.7772 | −1.8450 | 0.0653 |
| FCFF | −1.3872 * | 1.1880 | −1.1676 | 0.2432 |
| WAGE | 1.7179 | 1.8926 | 0.9077 | 0.3642 |
| SIZE | −2.4492 *** | 0.1445 | −16.9490 | <0.0001 |
| FAMILY | 1.0608 ** | 0.4656 | 2.2782 | 0.0229 |
| Adjusted R2 | 47.71% | |||
| F-test | F(11, 1251) = 105.6725 | |||
| p-value | 8.9 × 10−170 | |||
| Firms | 421 | |||
| Observations | 1263 |
***, **, * indicate statistical significance at 1%, 5%, and 10%.
This table offers the panel regression estimates for the risk model (R1) for the sample firms at the aggregate level for the financial year 2010–2012.
where FirmRisk indicates the firm-specific risk. DIV and DE represent the dividend payout and financial leverage. Operating risk, systematic risk, and quick ratio are represented by RISK, BETA, and QR, respectively. Tobin’s Q (TQ), return on assets (ROA), and free cash flow to the firm (FCFF) indicate valuation, profitability, and excess cash. Salary and wages-to-sales ratio and firm size are indicated by WAGE and SIZE. Family dummy characterizes family firms. Table 1 describes each variable.
References
- Ali Taher, Fatima N., and Mohammad Al-Shboul. 2023. Dividend Policy, Its Asymmetric Behavior and Stock Liquidity. Journal of Economic Studies 50: 578–600. [Google Scholar] [CrossRef]
- Amihud, Yakov. 2002. Illiquidity and Stock Returns: Cross-Section and Time-Series Effects. Journal of Financial Markets 5: 31–56. [Google Scholar] [CrossRef]
- Anderson, Ronald C., and David M. Reeb. 2003. Founding-Family Ownership, Corporate Diversification, and Firm Leverage. The Journal of Law and Economics 46: 653–84. [Google Scholar] [CrossRef]
- Anderson, Ronald C., Sattar A. Mansi, and David M. Reeb. 2003. Founding Family Ownership and the Agency Cost of Debt. Journal of Financial Economics 68: 263–85. [Google Scholar] [CrossRef]
- Andres, Christian. 2008. Large Shareholders and Firm Performance—An Empirical Examination of Founding-Family Ownership. Journal of Corporate Finance 14: 431–45. [Google Scholar] [CrossRef]
- Andres, Christian, André Betzer, Marc Goergen, and Luc Renneboog. 2009. Dividend Policy of German Firms: A Panel Data Analysis of Partial Adjustment Models. Journal of Empirical Finance 16: 175–87. [Google Scholar] [CrossRef]
- Baba, Naohiko. 2009. Increased Presence of Foreign Investors and Dividend Policy of Japanese Firms. Pacific-Basin Finance Journal 17: 163–74. [Google Scholar] [CrossRef]
- Balasubramanian, Bala N., and R. Anand. 2013. Ownership Trends in Corporate India 2001–2011: Evidence and Implications. IIM Bangalore Research Paper 419. [Google Scholar] [CrossRef]
- Banerjee, Suman, Vladimir A. Gatchev, and Paul A. Spindt. 2007. Stock Market Liquidity and Firm Dividend Policy. Journal of Financial and Quantitative Analysis 42: 369–97. [Google Scholar] [CrossRef]
- Bathala, Chenchuramaiah T., and Ramesh P. Rao. 1995. The Determinants of Board Composition: An Agency Theory Perspective. Managerial and Decision Economics 16: 59–69. [Google Scholar] [CrossRef]
- Berle, Adolf Augustus, and Gardiner Gardiner Coit Means. 1991. The Modern Corporation and Private Property. Piscataway: Transaction Publishers. [Google Scholar]
- Bernstein, Peter L. 1998. The Hidden Risks in Low Payouts. Journal of Portfolio Management 25: 1. [Google Scholar] [CrossRef]
- Bhat, Ramesh, I. M. Pandey, and Samveg Patel. 2021. Dividend Behaviour of Indian Companies Post Macroeconomic Policy Shock. Economic and Political Weekly 56: 38–43. [Google Scholar]
- Bhattacharya, Sudipto. 1979. Imperfect Information, Dividend Policy, and “the Bird in the Hand” Fallacy. The Bell Journal of Economics 10: 259–70. [Google Scholar] [CrossRef]
- Black, Fischer. 1996. The Dividend Puzzle. Journal of Portfolio Management 23: 8–12. [Google Scholar] [CrossRef]
- Booth, Laurence, Varouj Aivazian, Asli Demirguc-Kunt, and Vojislav Maksimovic. 2001. Capital Structures in Developing Countries. The Journal of Finance 56: 87–130. [Google Scholar] [CrossRef]
- Brennan, Michael J., Tarun Chordia, and Avanidhar Subrahmanyam. 1998. Alternative Factor Specifications, Security Characteristics, and the Cross-Section of Expected Stock Returns. Journal of Financial Economics 49: 345–73. [Google Scholar] [CrossRef]
- Burkart, Mike, Fausto Panunzi, and Andrei Shleifer. 2003. Family Firms. The Journal of Finance 58: 2167–2201. [Google Scholar] [CrossRef]
- Chay, Jong-Bom, and Jungwon Suh. 2009. Payout Policy and Cash-Flow Uncertainty. Journal of Financial Economics 93: 88–107. [Google Scholar] [CrossRef]
- Chen, Carl R., and Thomas L. Steiner. 1999. Managerial Ownership and Agency Conflicts: A Nonlinear Simultaneous Equation Analysis of Managerial Ownership, Risk Taking, Debt Policy, and Dividend Policy. Financial Review 34: 119–36. [Google Scholar] [CrossRef]
- Chua, Jess H., James J. Chrisman, and Pramodita Sharma. 1999. Defining the Family Business by Behavior. Entrepreneurship Theory and Practice 23: 19–39. [Google Scholar] [CrossRef]
- Cleary, Sean. 2006. International Corporate Investment and the Relationships between Financial Constraint Measures. Journal of Banking & Finance 30: 1559–80. [Google Scholar]
- Constantinides, George M., and Myron S. Scholes. 1980. Optimal Liquidation of Assets in the Presence of Personal Taxes: Implications for Asset Pricing. The Journal of Finance 35: 439–49. [Google Scholar] [CrossRef]
- Copeland, Thomas E., and Dan Galai. 1983. Information Effects on the Bid-ask Spread. The Journal of Finance 38: 1457–69. [Google Scholar]
- Das, Santanu. 2017. Firm Characteristics and Dividend Policy in India. Transnational Corporations Review 9: 190–200. [Google Scholar] [CrossRef]
- DeAngelo, Harry, Linda DeAngelo, and René M. Stulz. 2006. Dividend Policy and the Earned/Contributed Capital Mix: A Test of the Life-Cycle Theory. Journal of Financial Economics 81: 227–54. [Google Scholar] [CrossRef]
- Demsetz, Harold, and Kenneth Lehn. 1985. The Structure of Corporate Ownership: Causes and Consequences. Journal of Political Economy 93: 1155–77. [Google Scholar] [CrossRef]
- Denis, David J., and Igor Osobov. 2008. Why Do Firms Pay Dividends? International Evidence on the Determinants of Dividend Policy. Journal of Financial Economics 89: 62–82. [Google Scholar] [CrossRef]
- Easterbrook, Frank H. 1984. Two Agency-Cost Explanations of Dividends. The American Economic Review 74: 650–59. [Google Scholar]
- Easterbrook, Frank H., and Daniel R. Fischel. 1984. Mandatory Disclosure and the Protection of Investors. Virginia Law Review 70: 669–715. [Google Scholar] [CrossRef]
- Eddy, Albert, and Bruce Seifert. 1988. Firm Size and Dividend Announcements. Journal of Financial Research 11: 295–302. [Google Scholar] [CrossRef]
- Faccio, Mara, and Larry H. P. Lang. 2002. The Ultimate Ownership of Western European Corporations. Journal of Financial Economics 65: 365–95. [Google Scholar] [CrossRef]
- Faccio, Mara, Larry H. P. Lang, and Leslie Young. 2001. Dividends and Expropriation. American Economic Review 91: 54–78. [Google Scholar] [CrossRef]
- Fama, Eugene F., and Kenneth R. French. 2001. Disappearing Dividends: Changing Firm Characteristics or Lower Propensity to Pay? Journal of Financial Economics 60: 3–43. [Google Scholar] [CrossRef]
- Fama, Eugene F., and Kenneth R. French. 2002. Testing trade-off and pecking order predictions about dividends and debt. Review of Financial Studies, 1–33. [Google Scholar] [CrossRef]
- Ferreira, Miguel A., and Paul A. Laux. 2007. Corporate Governance, Idiosyncratic Risk, and Information Flow. The Journal of Finance 62: 951–89. [Google Scholar] [CrossRef]
- Francis, Jere R., and Donald J. Stokes. 1986. Audit Prices, Product Differentiation, and Scale Economies: Further Evidence from the Australian Market. Journal of Accounting Research 24: 383. [Google Scholar] [CrossRef]
- Geeta, Ramanathan, and Krishna Prasanna. 2016. Impact of Family Ownership on Idiosyncratic Risk. International Journal of Corporate Governance 7: 325–52. [Google Scholar] [CrossRef]
- Goddard, John, David G. McMillan, and John O. S. Wilson. 2006. Dividend Smoothing vs Dividend Signalling: Evidence from UK Firms. Managerial Finance 32: 493–504. [Google Scholar] [CrossRef]
- Gombola, Michael J., and J. Edward Ketz. 1983. A Note on Cash Flow and Classification Patterns of Financial Ratios. Accounting Review 58: 105–14. [Google Scholar]
- Gomez-Mejia, Luis R., Manuel Nunez-Nickel, and Isabel Gutierrez. 2001. The Role of Family Ties in Agency Contracts. Academy of Management Journal 44: 81–95. [Google Scholar] [CrossRef]
- Gordon, Myron J. 1959. Dividends, Earnings, and Stock Prices. The Review of Economics and Statistics 41: 99–105. [Google Scholar] [CrossRef]
- Gordon, Myron J. 1962. The Investment, Financing and Valuation of the Corporation. Homewood: Richard D. Irwin. Inc. [Google Scholar]
- Griffin, Paul A., David H. Lont, and Yuan Sun. 2010. Agency Problems and Audit Fees: Further Tests of the Free Cash Flow Hypothesis. Accounting & Finance 50: 321–50. [Google Scholar]
- Grullon, Gustavo, Roni Michaely, and Bhaskaran Swaminathan. 2002. Are Dividend Changes a Sign of Firm Maturity? The Journal of Business 75: 387–424. [Google Scholar] [CrossRef]
- Ho, Joanna L., and Fei Kang. 2013. Auditor Choice and Audit Fees in Family Firms: Evidence from the S&P 1500. Auditing: A Journal of Practice & Theory 32: 71–93. [Google Scholar]
- Jensen, Gerald R., Donald P. Solberg, and Thomas S. Zorn. 1992. Simultaneous Determination of Insider Ownership, Debt, and Dividend Policies. Journal of Financial and Quantitative Analysis 27: 247–63. [Google Scholar] [CrossRef]
- Jensen, Michael C. 1986. Agency Costs of Free Cash Flow, Corporate Finance, and Takeovers. The American Economic Review 76: 323–29. [Google Scholar]
- Jensen, Michael C., and William H. Meckling. 1976. Theory of the Firm: Managerial Behavior, Agency Costs and Ownership Structure. Journal of Financial Economics 3: 305–60. [Google Scholar] [CrossRef]
- Jiang, Fuxiu, Yunbiao Ma, and Beibei Shi. 2017. Stock Liquidity and Dividend Payouts. Journal of Corporate Finance 42: 295–314. [Google Scholar] [CrossRef]
- Karpavicius, Sigitas, and Fan Yu. 2012. A Test of the Free Cash Flow Hypothesis: The Impact of Increased Institutional Holdings on Firm Characteristics. Social Science Research Network (SSRN). Available online: http://dx.doi.org/10.2139/ssrn.2318657 (accessed on 15 April 2024). [CrossRef]
- Koch, Paul D., and Catherine Shenoy. 1999. The Information Content of Dividend and Capital Structure Policies. Financial Management 28: 16–35. [Google Scholar] [CrossRef]
- Kusnadi, Yuanto. 2011. Do Corporate Governance Mechanisms Matter for Cash Holdings and Firm Value? Pacific-Basin Finance Journal 19: 554–70. [Google Scholar] [CrossRef]
- Lindenberg, Eric B., and Stephen A. Ross. 1981. Tobin’s q Ratio and Industrial Organization. Journal of Business 54: 1–32. [Google Scholar] [CrossRef]
- Lintner, John. 1956. Distribution of Incomes of Corporations among Dividends, Retained Earnings, and Taxes. The American Economic Review 46: 97–113. [Google Scholar]
- Mazouz, Khelifa, Yuliang Wu, Rabab Ebrahim, and Abhijit Sharma. 2023. Dividend Policy, Systematic Liquidity Risk, and the Cost of Equity Capital. Review of Quantitative Finance and Accounting 60: 839–76. [Google Scholar] [CrossRef]
- Miller, Merton H., and Franco Modigliani. 1961. Dividend Policy, Growth, and the Valuation of Shares. The Journal of Business 34: 411–33. [Google Scholar] [CrossRef]
- Milosevic, Darko, Shleifer Andrei, and Robert W. Vishny. 2015. A Survey of Corporate Governance. The Journal of Finance 52: 737–83. [Google Scholar]
- Mitton, Todd. 2004. Corporate Governance and Dividend Policy in Emerging Markets. Emerging Markets Review 5: 409–26. [Google Scholar] [CrossRef]
- Modigliani, Franco, and Merton H. Miller. 1958. The Cost of Capital, Corporation Finance and the Theory of Investment. The American Economic Review 48: 261–97. [Google Scholar]
- Mulyani, Evy, Harminder Singh, and Sagarika Mishra. 2016. Dividends, Leverage, and Family Ownership in the Emerging Indonesian Market. Journal of International Financial Markets, Institutions and Money 43: 16–29. [Google Scholar] [CrossRef]
- Myers, Melissa, and Frank Bacon. 2002. The determinants of corporate dividend policy. Academy of Accounting and Financial Studies 7: 105. [Google Scholar]
- Myers, Stewart C. 1977. Determinants of Corporate Borrowing. Journal of Financial Economics 5: 147–75. [Google Scholar] [CrossRef]
- Myers, Stewart C. 1984. Capital Structure Puzzle. Cambridge: National Bureau of Economic Research. [Google Scholar]
- Myers, Stewart C. 2001. Capital Structure. Journal of Economic Perspectives 15: 81–102. [Google Scholar] [CrossRef]
- Myers, Stewart C., and Nicholas S. Majluf. 1984. Corporate Financing and Investment Decisions When Firms Have Information That Investors Do Not Have. Journal of Financial Economics 13: 187–221. [Google Scholar] [CrossRef]
- Nguyen, Pascal. 2011. Corporate Governance and Risk-Taking: Evidence from Japanese Firms. Pacific-Basin Finance Journal 19: 278–97. [Google Scholar] [CrossRef]
- Paligorova, Teodora. 2010. Corporate Risk Taking and Ownership Structure. Bank of Canada Working Paper. Ottawa: Bank of Canada. [Google Scholar]
- Parrino, Robert, and Michael S. Weisbach. 1999. Measuring Investment Distortions Arising from Stockholder–Bondholder Conflicts. Journal of Financial Economics 53: 3–42. [Google Scholar] [CrossRef]
- Rajverma, Abhinav Kumar, Arun Kumar Misra, Sabyasachi Mohapatra, and Abhijeet Chandra. 2019. Impact of Ownership Structure and Dividend on Firm Performance and Firm Risk. Managerial Finance 45: 1041–61. [Google Scholar] [CrossRef]
- Richardson, Scott. 2006. Over-Investment of Free Cash Flow. Review of Accounting Studies 11: 159–89. [Google Scholar] [CrossRef]
- Rozeff, Michael S. 1982. Growth, Beta and Agency Costs as Determinants of Dividend Payout Ratios. Journal of Financial Research 5: 249–59. [Google Scholar] [CrossRef]
- Scott, James H. 1977. Bankruptcy, Secured Debt, and Optimal Capital Structure. The Journal of Finance 32: 1–19. [Google Scholar] [CrossRef]
- Setia-Atmaja, Lukas, George A. Tanewski, and Michael Skully. 2009. The Role of Dividends, Debt and Board Structure in the Governance of Family Controlled Firms. Journal of Business Finance & Accounting 36: 863–98. [Google Scholar]
- Shleifer, Andrei, and Robert. W. Vishny. 1997. A Survey of Corporate Governance. The Journal of Finance 52: 737–83. [Google Scholar] [CrossRef]
- Singh, Deeksha A., and Ajai S. Gaur. 2009. Business Group Affiliation, Firm Governance, and Firm Performance: Evidence from China and India. Corporate Governance: An International Review 17: 411–25. [Google Scholar] [CrossRef]
- Stereńczak, Szymon, and Jarosław Kubiak. 2022. Dividend Policy and Stock Liquidity: Lessons from Central and Eastern Europe. Research in International Business and Finance 62: 101727. [Google Scholar] [CrossRef]
- Stoll, Hans R. 1978. The Pricing of Security Dealer Services: An Empirical Study of NASDAQ Stocks. The Journal of Finance 33: 1153–72. [Google Scholar] [CrossRef]
- Titman, Sheridan, and Roberto Wessels. 1988. The Determinants of Capital Structure Choice. The Journal of Finance 43: 1–19. [Google Scholar] [CrossRef]
- Villalonga, Belen, and Raphael Amit. 2006. How Do Family Ownership, Control and Management Affect Firm Value? Journal of Financial Economics 80: 385–417. [Google Scholar] [CrossRef]
- Walter, James E. 1956. Dividend Policies and Common Stock Prices. The Journal of Finance 11: 29–41. [Google Scholar] [CrossRef]
- Wang, Dechun. 2006. Founding Family Ownership and Earnings Quality. Journal of Accounting Research 44: 619–56. [Google Scholar] [CrossRef]

Disclaimer/Publisher’s Note: The statements, opinions and data contained in all publications are solely those of the individual author(s) and contributor(s) and not of MDPI and/or the editor(s). MDPI and/or the editor(s) disclaim responsibility for any injury to people or property resulting from any ideas, methods, instructions or products referred to in the content. |
© 2024 by the author. Licensee MDPI, Basel, Switzerland. This article is an open access article distributed under the terms and conditions of the Creative Commons Attribution (CC BY) license (https://creativecommons.org/licenses/by/4.0/).