Article

Sovereign Credit Risk in Saudi Arabia, Morocco and Egypt

Laboratory of Probability and Statistics, Faculty of Business and Economic Sciences, University of Sfax, Sfax 3029, Tunisia
*
Author to whom correspondence should be addressed.
J. Risk Financial Manag. 2024, 17(7), 283; https://doi.org/10.3390/jrfm17070283
Submission received: 11 May 2024 / Revised: 12 June 2024 / Accepted: 19 June 2024 / Published: 5 July 2024
(This article belongs to the Special Issue Emerging Issues in Economics, Finance and Business)

Abstract

:
The purpose of this paper is to assess and predict sovereign credit risk for Egypt, Morroco and Saudi Arabia using credit default swap (CDS) spreads obtained from the DataStream database for the period from 2009 to 2022. Our approach consists of generating the implied default probability and the corresponding credit rating in order to estimate the term structure of the implied default probability using the Nelson–Siegel model. In order to validate the prediction from the probability term structure, we calculate the transition matrices based on the implied rating using the homogeneous Markov model. The main results show that, overall, the probabilities of defaulting in the long term are higher than those in the short term, which implies that the future outlook is more pessimistic given the events that occurred during the study period. Egypt seems to be the country with the most fragile economy, especially after 2009, likely because of the political events that marked the country at that time. The economies of Morocco and Saudi Arabia are more resilient in terms of both default probability and credit rating. These findings can help policymakers develop targeted strategies to mitigate economic risks and enhance stability, and they provide investors with valuable insights for managing long-term investment risks in these countries.
Mathematics Subject Classification:
91G15; 91G20; 91G40; 91G70

1. Introduction

The persistent growth of external debt in the MENA region has raised concerns about the governments’ ability to service their debt. According to World Bank statistics, the total external debt of countries in this region increased from USD 182 billion in 2009 to USD 225 billion in 2014, then reaching USD 350 billion in 2018 and USD 417 billion in 2021. High levels of debt highlight the level of sovereign credit risk, which can be measured using market data such as bond and credit default swap spreads or historical data provided by rating agencies (Hull et al. 2004; Longstaff et al. 2011; Paret and Dufrénot 2015; Rodríguez et al. 2019). The political crisis in most Arab countries in 2011, the COVID-19 health crisis and the war in Ukraine have provided a window of opportunity for researchers to challenge former assumptions about the adequacy of conventional rating and risk assessment methodologies (Piccolo and Shapiro 2022). In fact, previous researchers have shown that CDSs reflect information more precisely than credit rating and are effective in predicting credit risk and that the credit risk measure withdrawn from the CDS spread is more real than the credit risk measure withdrawn from other market data (Jarrow et al. 1997; Zhu 2006; Flannery et al. 2010; Dwyer et al. 2010; International Monetary Fund 2013; Jacobs et al. 2016; Rodríguez et al. 2019; Abid et al. 2020; Abid and Fathi 2023). The implied ratings calculated from CDS spreads are more responsive to market conditions, as ratings published by rating agencies tend to remain relatively stable even during periods of increased risk, such as the COVID-19 pandemic and the war in Ukraine. Additionally, implied ratings better reflect current information than ratings provided by agencies (Blair 2013; Vieira and Bonne 2016).
The objective of this paper is to improve sovereign credit risk assessment tools in the context of global crises and economic uncertainties. First, we measured sovereign credit risk by calculating the market-implied default probability and implied rating from sovereign CDS spreads. A CDS is a derivative product based on a loan granted by the purchaser of the contract to a reference country, and it reacts instantaneously to variations in the credit risk of that country. Next, we estimated the CDS-based implied default probability term structure to measure risk across different investment horizons. Finally, we predicted sovereign credit risk using a CDS-based implied rating transition matrix assessment.
Due to the unavailability of CDS prices for different maturities for all MENA region countries, we focused on three countries with consistent and regular data: Egypt, Saudi Arabia and Morocco. These countries were selected to represent varying levels of economic development and social welfare. Egypt represents a country with significant political turmoil and economic challenges, particularly following the 2011 revolution. This makes it a critical case for studying the impact of political instability on sovereign credit risk. Saudi Arabia is a country with a robust economy largely based on hydrocarbons and significant fiscal reserves. It provides insight into how resource-rich countries manage credit risk and economic stability. Morocco is known for its relative political stability and progressive economic reforms; this country serves as an example of how stable governance and strategic economic policies can influence credit risk. These countries provide a broad spectrum of political and economic contexts. By studying these three countries, we aim to capture a comprehensive picture of how different levels of economic development, social welfare and political stability impact sovereign credit risk in the MENA region. The credit risk of these countries is estimated and forecasted with an emphasis on the impact of global crises. In 2011, Egypt experienced a revolution, leading to political instability since the fall of President Mubarak, which durably weakened the economy until the election of President Abdel-Fattah Al-Sissi in June 2014. The GDP growth rate decreased from 5.14% in 2010 to 1.76% in 2011, remaining around 2% until it increased in 2015, reaching 4.37%. Unlike Egypt, Morocco did not experience a strong revolution in 2011 (Tourabi and Zaki 2011). The country quickly regained political, economic and financial stability. The inflation rate was 1.28% in 2012 compared to 0.99% and 0.9% in 2010 and 2011, respectively, and the GDP growth rate was 3% compared to 3.81% and 5.24%. Then, it increased to 19.04% in 2014, with the inflation rate decreasing to 0.44%. In 2020, Egypt was the first African country affected by the epidemic, recording its first case on 14 February. Egypt managed to cope with the health crisis by continuing a macroeconomic adjustment program deployed by the authorities under the guidance of the IMF, in exchange for a loan of USD 12 billion to cover part of its financing needs. The effects of the program on the Egyptian economy included a decrease in the budget deficit to 7.7% of the GDP from 12.5% in 2015 and an increase in GDP to USD 403 billion at the end of 2020, making it the second largest economy in Africa. Public debt from domestic banks decreased to 89.6% of the GDP in June 2020 from 103.3% in June 2017. Additionally, user fees for the Suez Canal increased to more than USD 7 billion by the end of 2021, compared to an average of USD 5.5 billion since 2014. The first case of COVID-19 in Morocco was recorded on 2 March 2020. A significant slowdown in economic activity was noted during the lockdown, resulting in a 7% reduction in GDP in 2020. To address the health crisis and combat poverty, the government implemented strong emergency measures, including a lump-sum unemployment benefit of 2000 Dirhams per month, subsistence aid of 800 to 1200 Dirhams per month for the most vulnerable households, and deferral of tax and social charges. The cost of these exceptional measures was primarily financed by the Special Pandemic Management Fund, with one-third coming from the state budget and the rest coming from donations from public companies, institutions and the population. The decrease in tax revenue and increased debt, which rose from USD 24 billion in 2009 to USD 65 billion in 2021, jeopardizes the country’s financial situation and solvency. While Egypt and Morocco were in a phase of economic recovery, the war between Russia and Ukraine increased the risk and concerns about the economic balance of these countries. For Egypt, among the consequences of the conflict is a decrease in tourism receipts; in fact, tourists of Russian and Ukrainian origin represent 35% to 40% of tourists who visit Egypt each year. The inflation rate increased from 4.5% in 2021 to 8.5% in 2022 due to the rise in wheat and oil prices, owing to Ukraine and Russia representing on average 50% of the purchases of the General Authority for Supply Commodities (GASC) (Badr and El-khadrawi 2016; Boumahdi 2022; Oldenburg et al. 2022). For Morocco, tensions in world food markets caused by the war in Ukraine, combined with climate risk (drought), could compromise the country’s food security. Indeed, there was a fall in the GDP of 0.3% in 2021 due to the contraction of agricultural GDP, in addition to acceleration of the inflation rate, which reached 8%, increasing concern about the level of solvency of the country, which is represented by a higher term structure of the implied default probability. However, the distress in Morocco did not affect relationships with foreign investors. The stock of foreign direct investments rose from USD 10 billion in 2000 to USD 73 billion in 2021 (Thornary et al. 2022a). Thus, inflows from foreign direct investment can cover a significant part of Morocco’s financial needs, which makes its situation non-critical despite unfavorable conditions. The political crisis in 2011, the COVID-19 health crisis and the war in Ukraine have affected the economic situation of Egypt and Morocco; we therefore expect an upward attitude of sovereign credit risk during these periods for these two countries but not to the same degree given that Morocco can limit the harmful consequences via foreign investments. Saudi Arabia is considered a wealthy country, with a budget surplus of USD 36.1 billion in 2021. Its economy is predominantly based on hydrocarbons and religious tourism, with GDP growth closely tied to real oil growth (Thornary et al. 2022b). In recent years, the stabilization of the COVID-19 pandemic and the rise in oil prices—when the average price of a barrel of Brent reached USD 102 in 2022 compared to USD 71 in 2021—contributed to GDP growth rates of 3.24% in 2021 and 7.6% in 2022 (Barry 2022). As a result, the credit risk for Saudi Arabia is expected to be low, and its solvency remains robust in the face of global crises. In fact, the need for this study arises from the increasing complexity and volatility in global financial markets, particularly in the context of the MENA region’s rising external debt and the impacts of major global crises such as political events, the COVID-19 pandemic and the war in Ukraine. Ratings provided by agency ratings and credit risk assessment methods, based on bond and stock prices, often fail to capture the rapid changes and specific risks associated with such unprecedented events (Abid et al. 2020; Abid and Fathi 2023). This study addresses this gap by employing advanced models to assess and predict sovereign credit risk, providing a more nuanced and dynamic understanding of how the credit risk of different economies, especially those of the MENA region, respond to economic instability and geopolitical tensions. By focusing on Egypt, Morocco and Saudi Arabia, this research highlights the varied economic structures and resilience levels within the region, offering critical insights for policymakers and investors. These insights are essential for developing targeted strategies to mitigate risks, enhance economic stability and inform investment decisions, thereby contributing to more robust and resilient financial systems in the face of ongoing global challenges.
The remainder of this paper is structured as follows: Section 2 reviews previous research on sovereign credit risk assessment. Section 3 presents the data and methodology, combining theoretical and empirical approaches to address sovereign credit risk, sovereign implied default probability and sovereign implied credit rating simultaneously. Section 4 interprets the results of sovereign credit risk measurement and prediction. The final section concludes the paper.

2. Previous Research

Credit risk is the risk that a borrower defaults on their debt obligations. Studying this risk is crucial for financial stability, guiding investment decisions and informing risk management strategies. Credit risk assessments can be performed by estimating default probability, which can be estimated using either historical data from rating agencies or market data, such as stock prices, bond prices or CDS spreads (Merton 1974; Jarrow 2001; Hull et al. 2004). According to Annaert and Ceuster (2000), default probabilities based on ratings from agencies may not accurately reflect the true level of risk. Studies by Flannery et al. (2010), Cizel (2013), Jacobs et al. (2016), Rodríguez et al. (2019), Abid et al. (2020) and Abid and Fathi (2023) indicate that CDS spreads provide more precise information than credit ratings. Furthermore, Dwyer et al. (2010) demonstrated that CDS spreads are more effective in predicting credit risk, with default probabilities derived from CDS spreads being more realistic than those based on other financial data. In addition, Augustin et al. (2022) showed a close relation between CDS quotations and credit risk; also, price and quantity fluctuations of sovereign default insurance are explained by sovereign credit risk. Therefore, in this article, we use the Hull (2014) model to calculate sovereign implied default probabilities from sovereign CDS spreads.
There are two types of ratings: those provided by rating agencies like Moody’s, Standard & Poor’s and Fitch and implied ratings generated by models such as Thomson Reuters StarMine. These models function similarly to rating agencies by issuing a letter grade, called an implied rating, based on the default probability of the rated country or company. The variation in ratings between an agency and an implied rating model stems from differences in credit risk evaluation. To align with default probability, ratings should be adjusted over time to reflect changes in risk levels. Flannery et al. (2010) demonstrated that, during the financial crisis, ratings provided by agency ratings failed to reflect the true risk levels and remained unchanged despite increased risk. Hilscher and Wilson (2017) showed that, although ratings are related to systematic risk, they are not optimal predictors of default probability, highlighting the need for additional indicators like CDS spreads. Annaert and Ceuster (2000) noted that rating models assume the same credit spreads within the same class, which is inconsistent with market data. Hung et al. (2017) found that rating agencies might delay rating adjustments, increasing information asymmetry. Blair (2013) showed that implied ratings reflect information more accurately than agency ratings. Therefore, this paper uses implied ratings based on CDSs and the Thomson Reuters StarMine model to determine the implied ratings for the selected MENA countries.
In sovereign credit risk management, it is crucial to understand the relationship between sovereign credit risk, lending horizon and sovereign rating. This relationship can be elucidated by examining the term structure of credit risk and the transition matrix of ratings. The term structure of CDS-based implied default probability provides an accurate means to study the relationship between default probability and debt contract maturity. Moreover, a CDS-based implied rating transition matrix indicates the probability of a country migrating from one rating to another over a given period. The implied default probability term structure and the implied transition matrix are essential concepts in managing sovereign credit risk; they serve as major indicators for borrowers to manage credit risk and make informed loan decisions.
In this study, we assess the sovereign implied default probability term structure using the Nelson and Siegel (1987) model, as recommended by Baranovski et al. (2009), Hua (2015), Caldeira et al. (2016) and Liu (2017). This model is a convenient and parsimonious exponential components framework that can replicate various yield curve shapes. Additionally, we predict credit risk by estimating the implied rating transition matrix using the homogeneous Markovian model. This model is widely recognized for its ability to capture probabilistic transitions between different credit states over time (Abid et al. 2020). Jarrow et al. (1997) pioneered the use of the Markov chain model to represent these transition probabilities on a finite state space corresponding to various rating classes. Since their work, the Markov chain model has become highly popular for estimating rating transition matrices and has been adopted by numerous researchers, including Jones (2005), Frydman and Schuermann (2008), Lando (2010), Engelmann and Ermakov (2011), Malik and Thomas (2012), Gavalas and Syriopoulos (2014), Blümke (2018) and Abid et al. (2020).
In summary, the literature highlights the effectiveness of CDSs in providing timely and accurate sovereign credit risk assessments. Additionally, the term structure of CDS-based implied default probability and transition matrices of CDS-based implied ratings offer valuable insights into credit risk assessment and forecasting.

3. Data Description and Methodology

3.1. Data Description
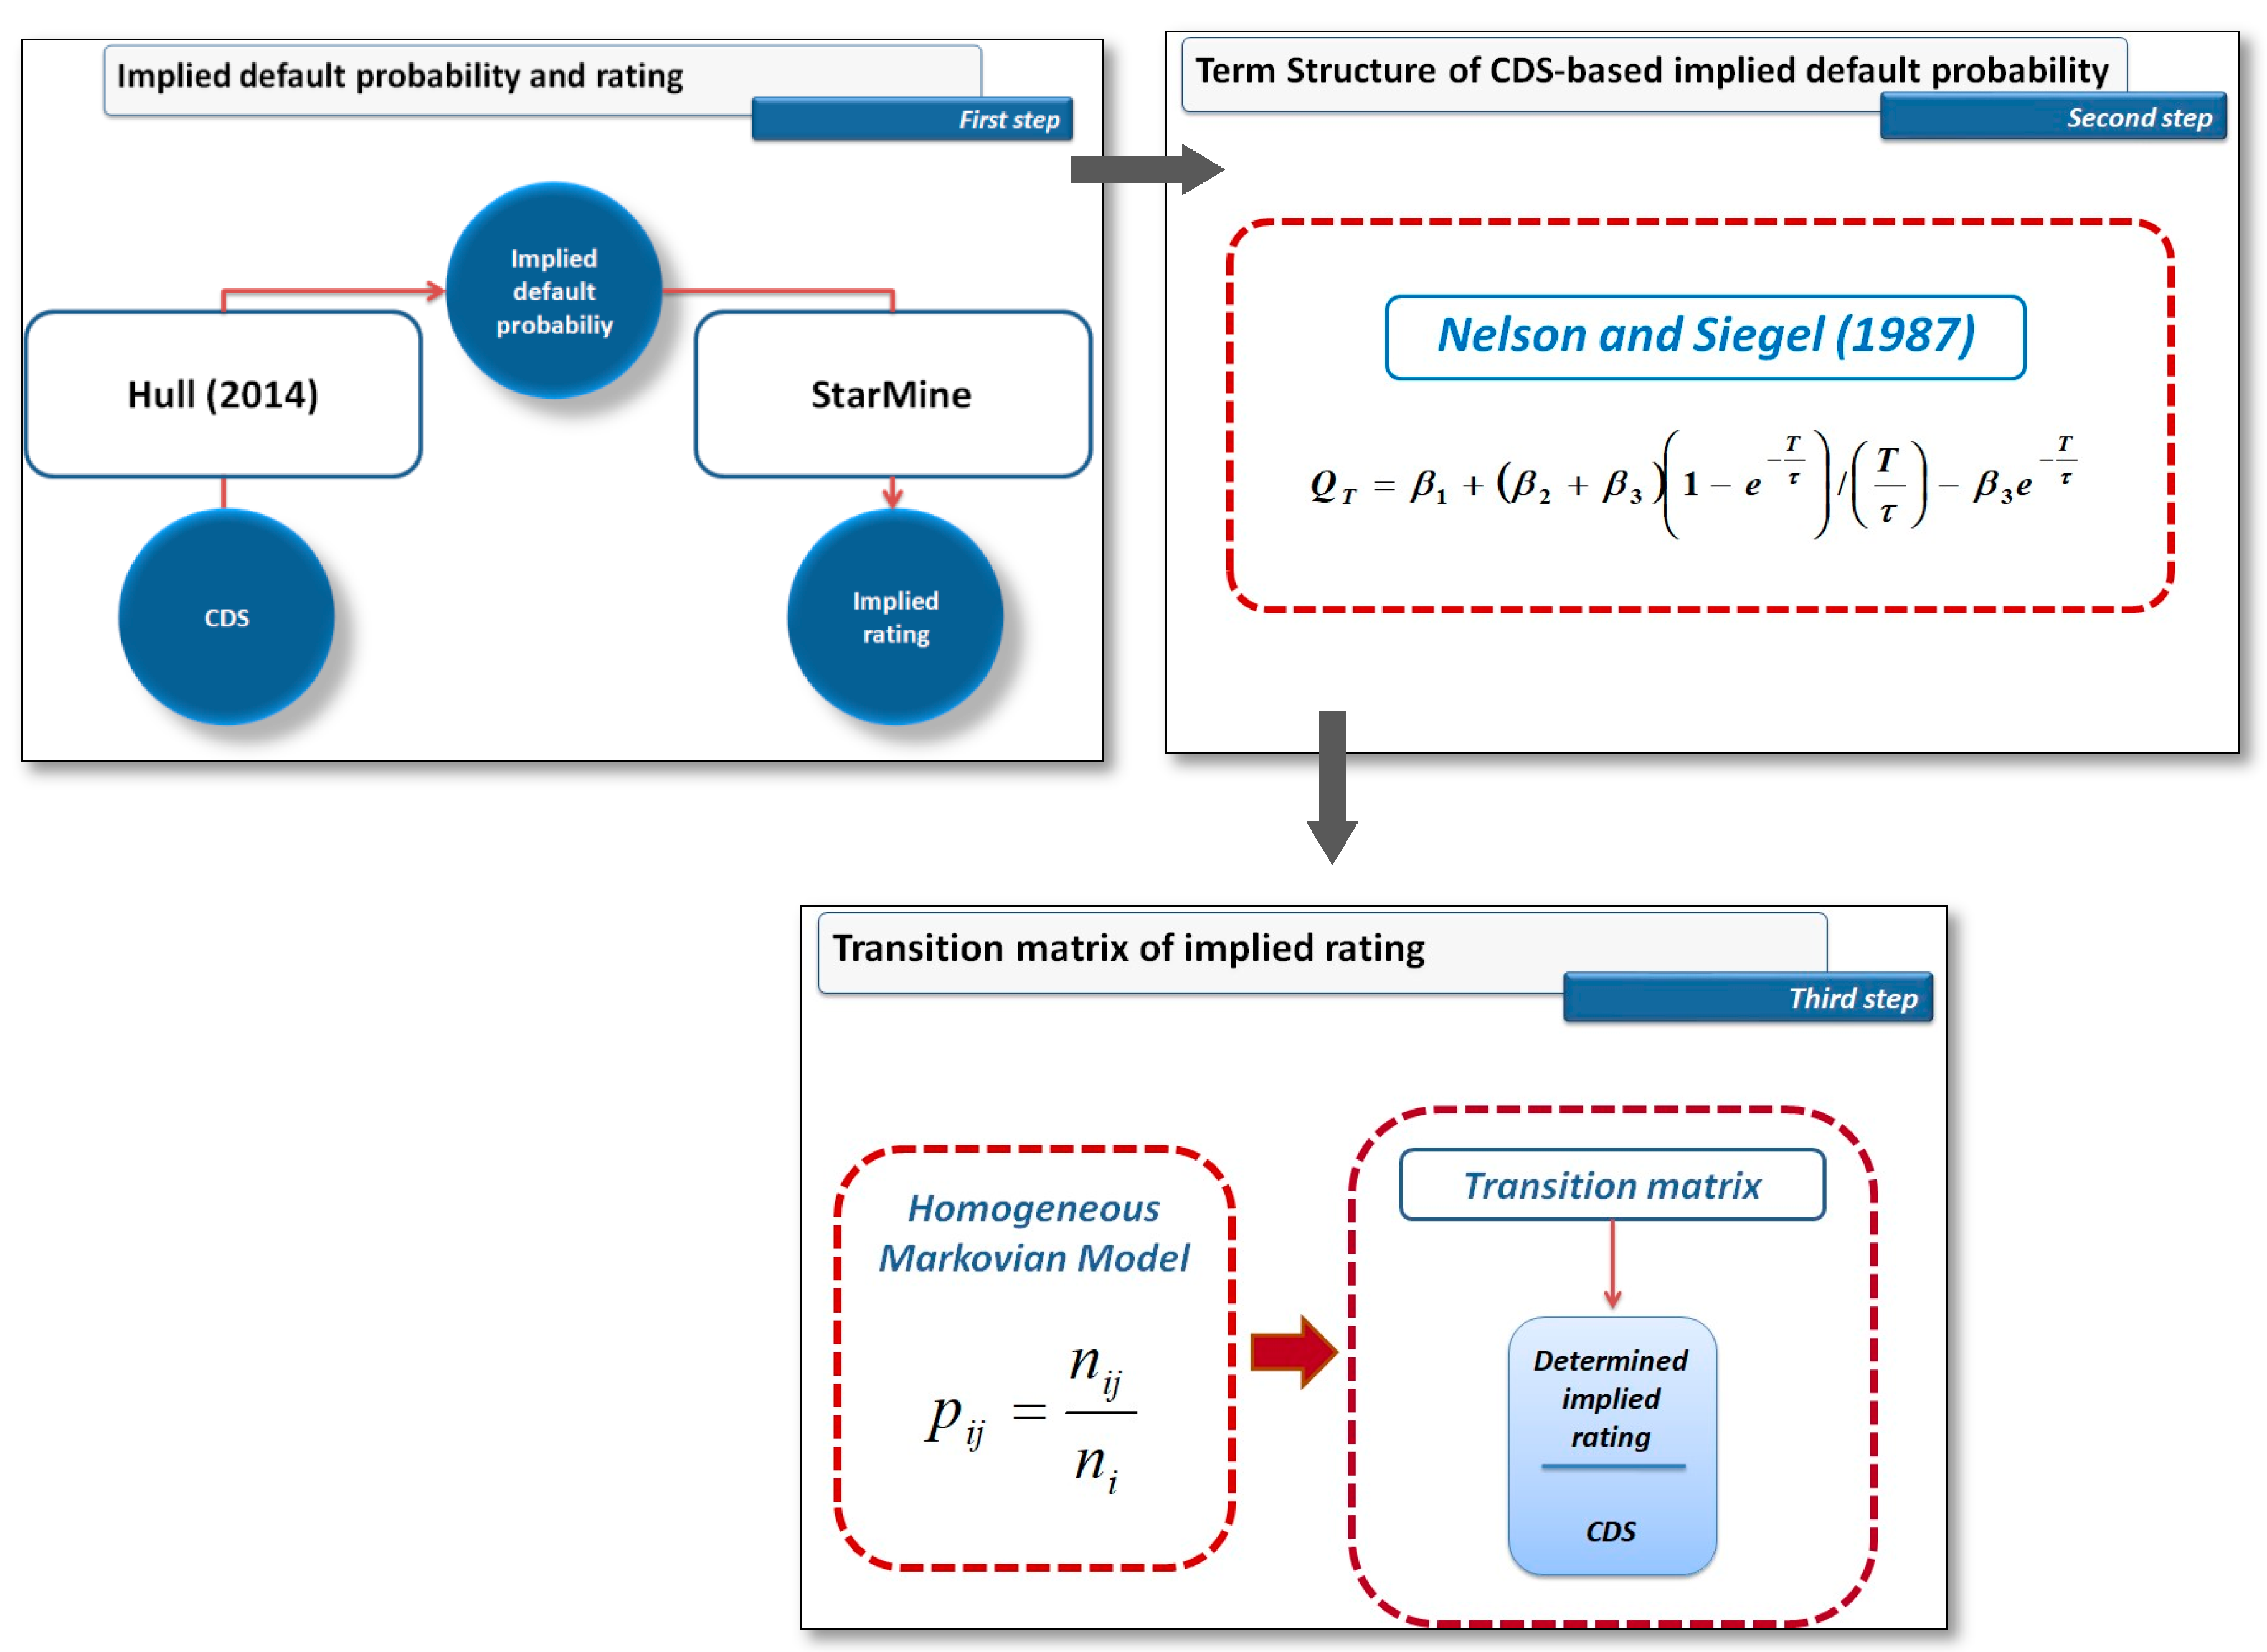
To measure and predict sovereign credit risk, we used daily CDS spreads with maturities of 6 months and 1, 2, 3, 4, 5, 7, 10, 20 and 30 years. Data are provided for three MENA countries: Egypt, Morocco and Saudi Arabia. These countries were selected based on the availability of CDS contracts with these maturities. The data were obtained from the DataStream database. Table 1 presents the descriptive statistics of the CDS spreads for the three countries. We observed that the CDS spread increases with maturity, indicating that longer maturities correspond to higher credit risk. In line with the evolution of the CDS spread, the standard deviation increases for Morocco and Saudi Arabia, suggesting that CDS contracts with longer maturities exhibit greater dispersion in quotations compared to those with shorter maturities. Conversely, in Egypt, the standard deviation generally decreases with increasing maturity, implying lower dispersion for CDS contracts with longer maturities.

3.2. Methodology

The methodology of this paper consisted of three steps. The first step aimed to determine the implied default probability and the implied rating from the observed CDS spreads. In the second step, we estimated the term structure of the CDS-based implied default probability. Finally, the third step involved predicting the level of credit risk by estimating the transition matrix of the CDS-based implied rating. These three steps are illustrated in Figure 1.

3.2.1. CDS-Based Implied Default Probability and Rating

To determine the market-implied default probability, we began with the Hull and White (2000) model, which calculates the CDS spread by considering the default risk of the reference entity and the possibility of the default event occurring at any time. This model allows us to express the implied default probability. The CDS spread is given by Equation (1).
s i = k = 1 i q k t k 1 t k 1 R A i ( t ) R v ( t ) d t k = 1 i q k t k 1 t k u ( t ) + e ( t ) d t + u ( t i ) 1 k = 1 i q k ( t k t k 1 )
where q is the risk-neutral default probability, R is the expected recovery rate on the reference obligation in a risk-neutral world, u ( t ) is the present value of payments at the rate of 1 dollar per year on payment dates between time zero and time t , e ( t ) is the present value of an accrual payment at time t equal to t t , where t is the payment date immediately preceding time t , v t is the present value of 1 dollar received at time t and A t is the accrued interest on the reference obligation at time t as a percentage of the face value. From Equation (1), q i can be iteratively evaluated. It should be noted that δ k = t k t k 1 , α k = t k 1 t k 1 R v ( t ) d t , β k i = t k 1 t k A i ( t ) R v ( t ) d t and γ k = t k 1 t k u ( t ) + e ( t ) d t .
The default probability is written as
q i = s i u ( t i ) + k = 1 i 1 q k s i γ k s i u ( t i ) δ k α k + β k , i α i β i , i s i γ i + s i u ( t i ) δ i
Once the implied probabilities of defaulting for different maturities are determined, the implied default probability with a one-year maturity is used to assign ratings to the studied countries. Specifically, based on the annual average probability of defaulting, an annual rating is assigned using the classification defined by the Thomson Reuters StarMine Sovereign Risk model. This model estimates the probability that a sovereign government defaults on its debt, considering macroeconomic, market-based and political risk data to generate a comprehensive picture of sovereign risk and identify a rating. The rating classes and their corresponding default probability intervals are presented in Table 2.

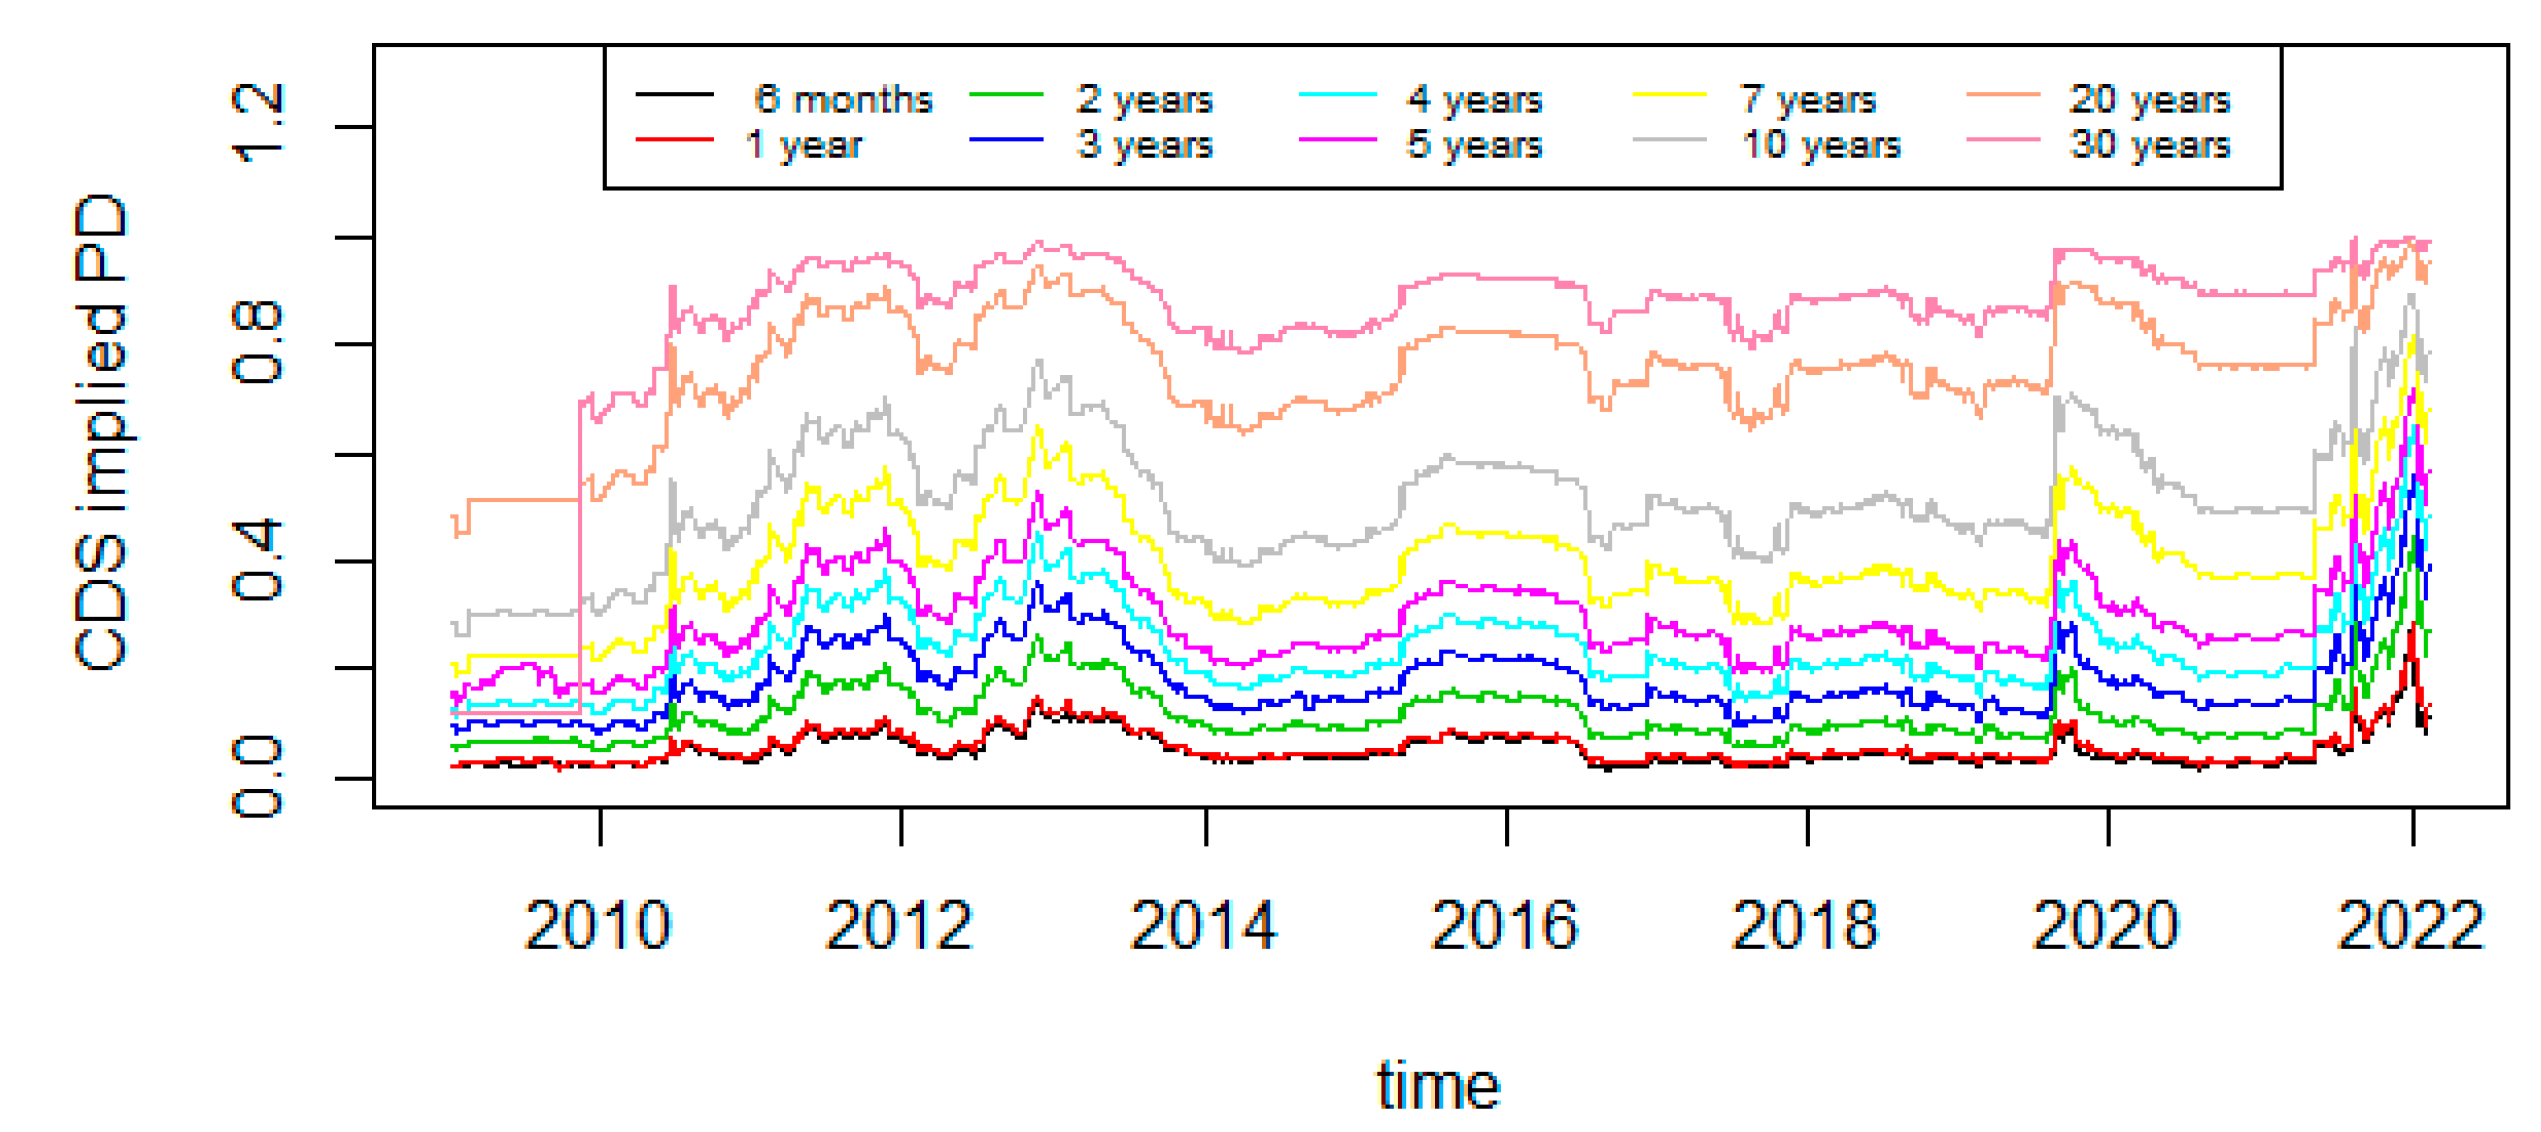
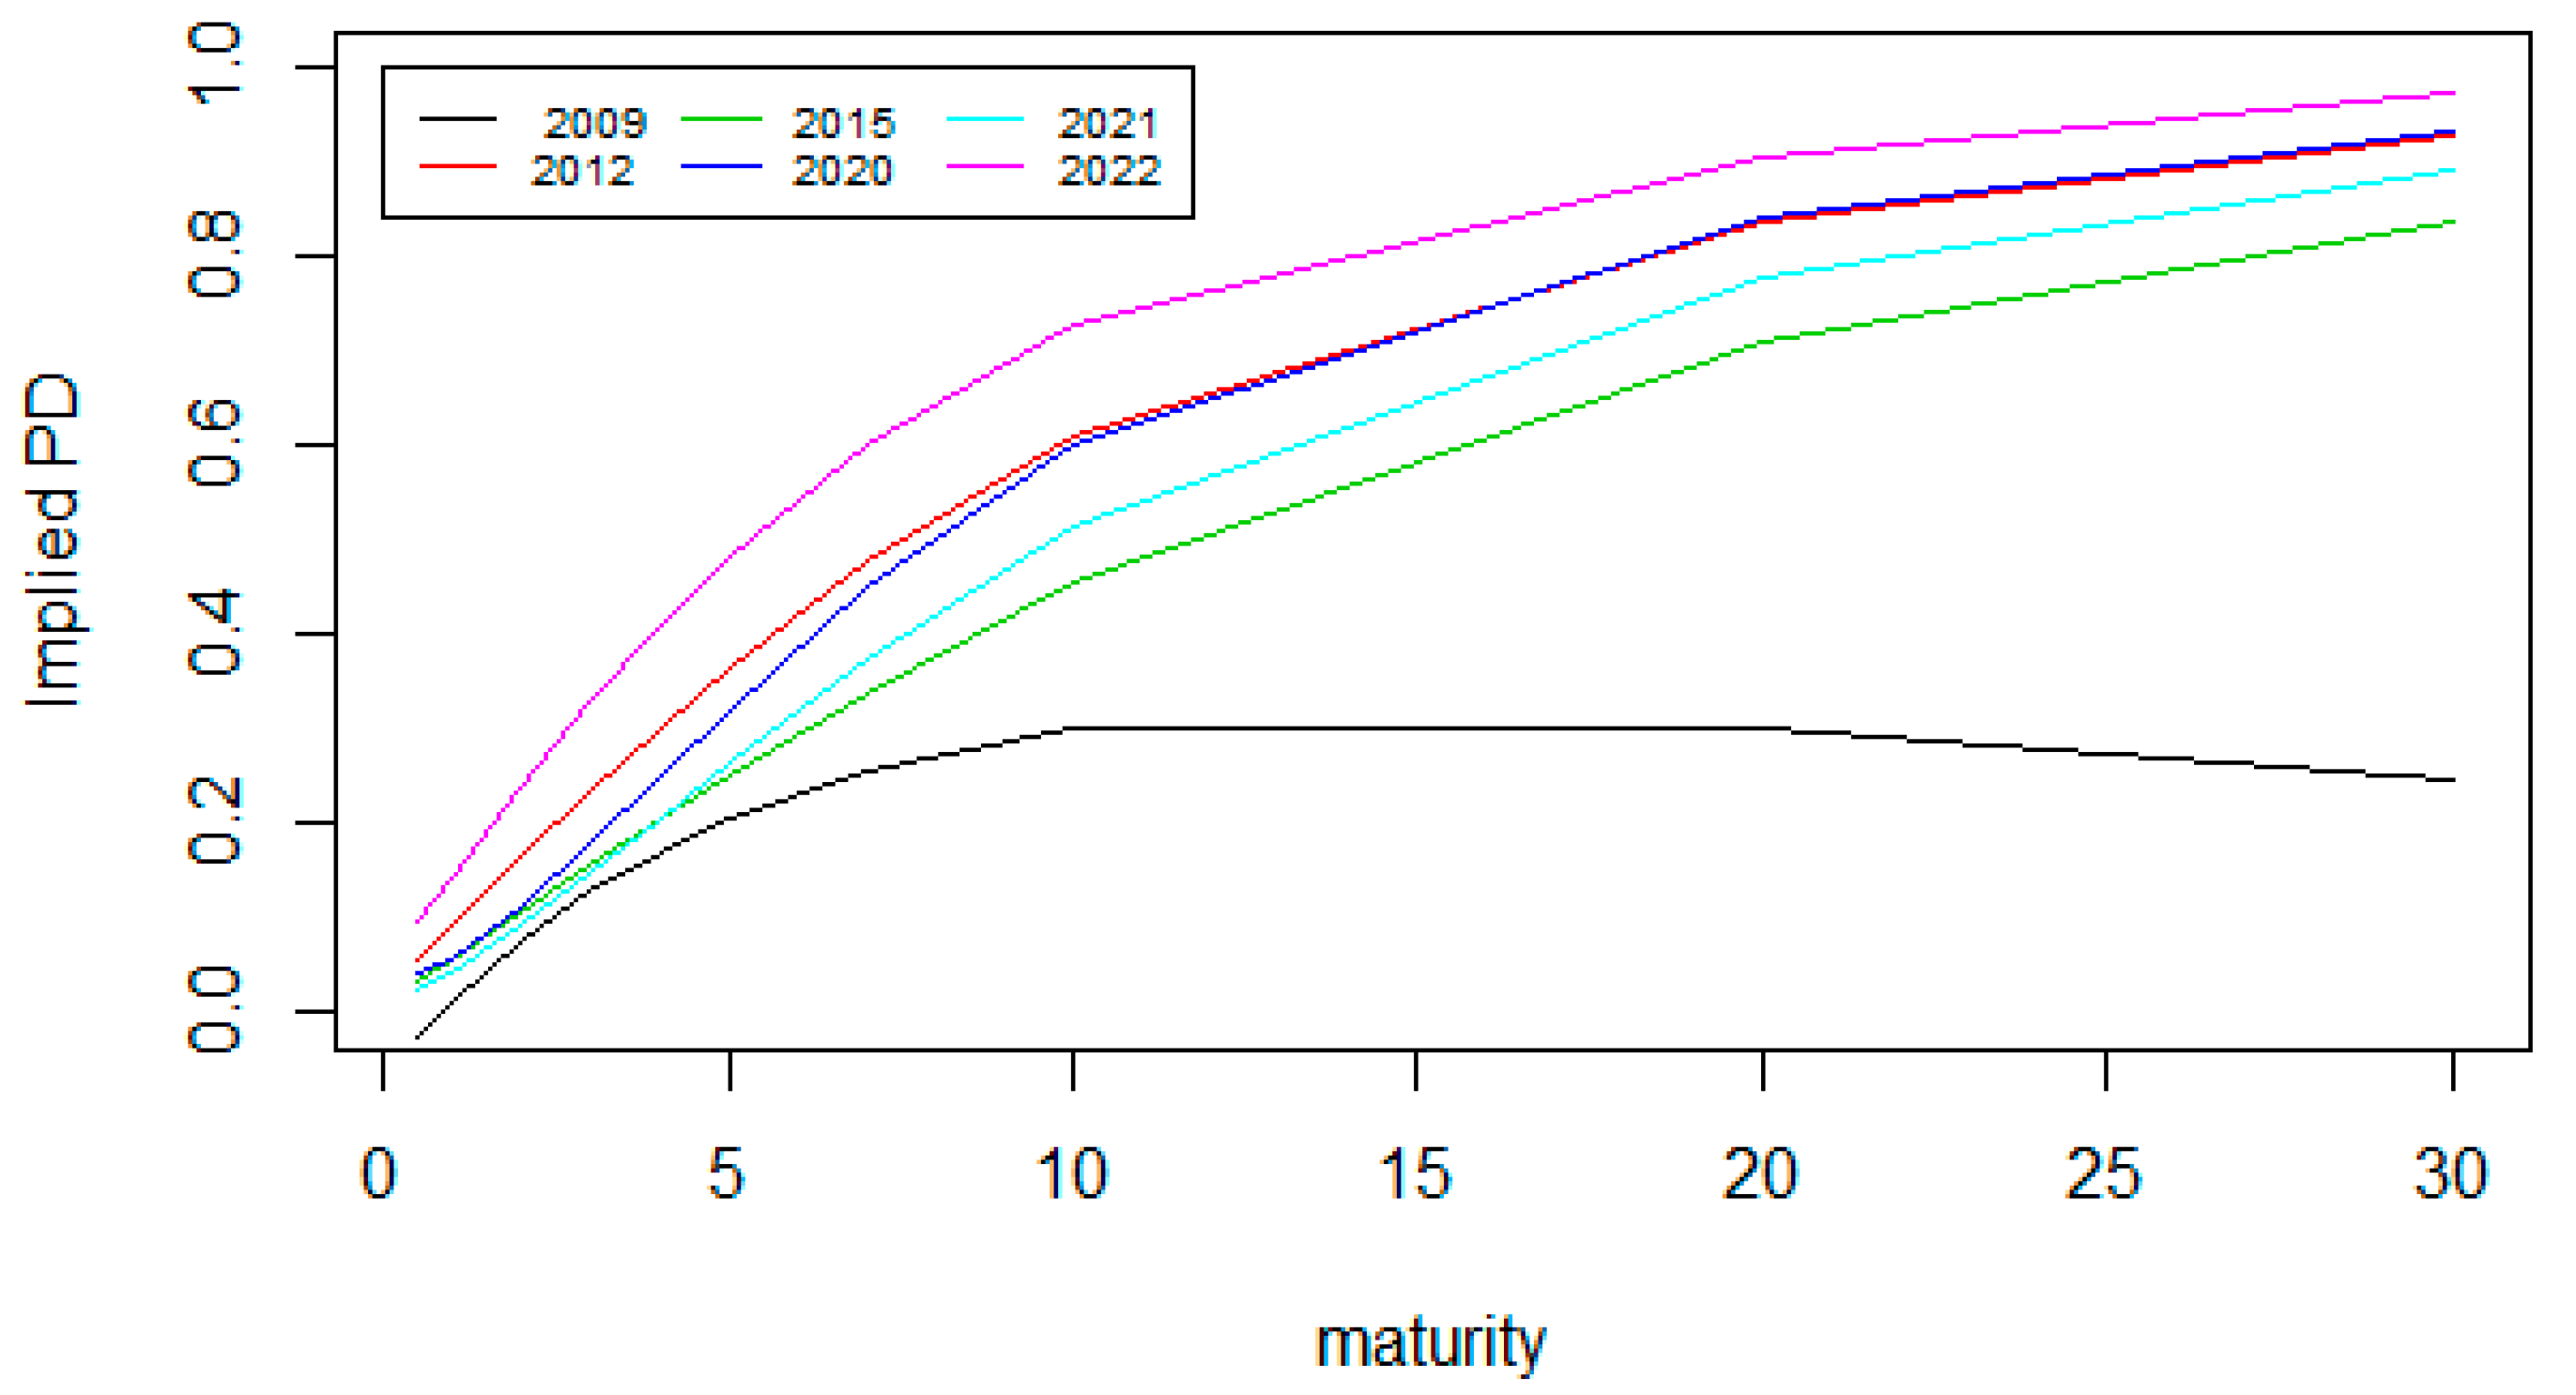
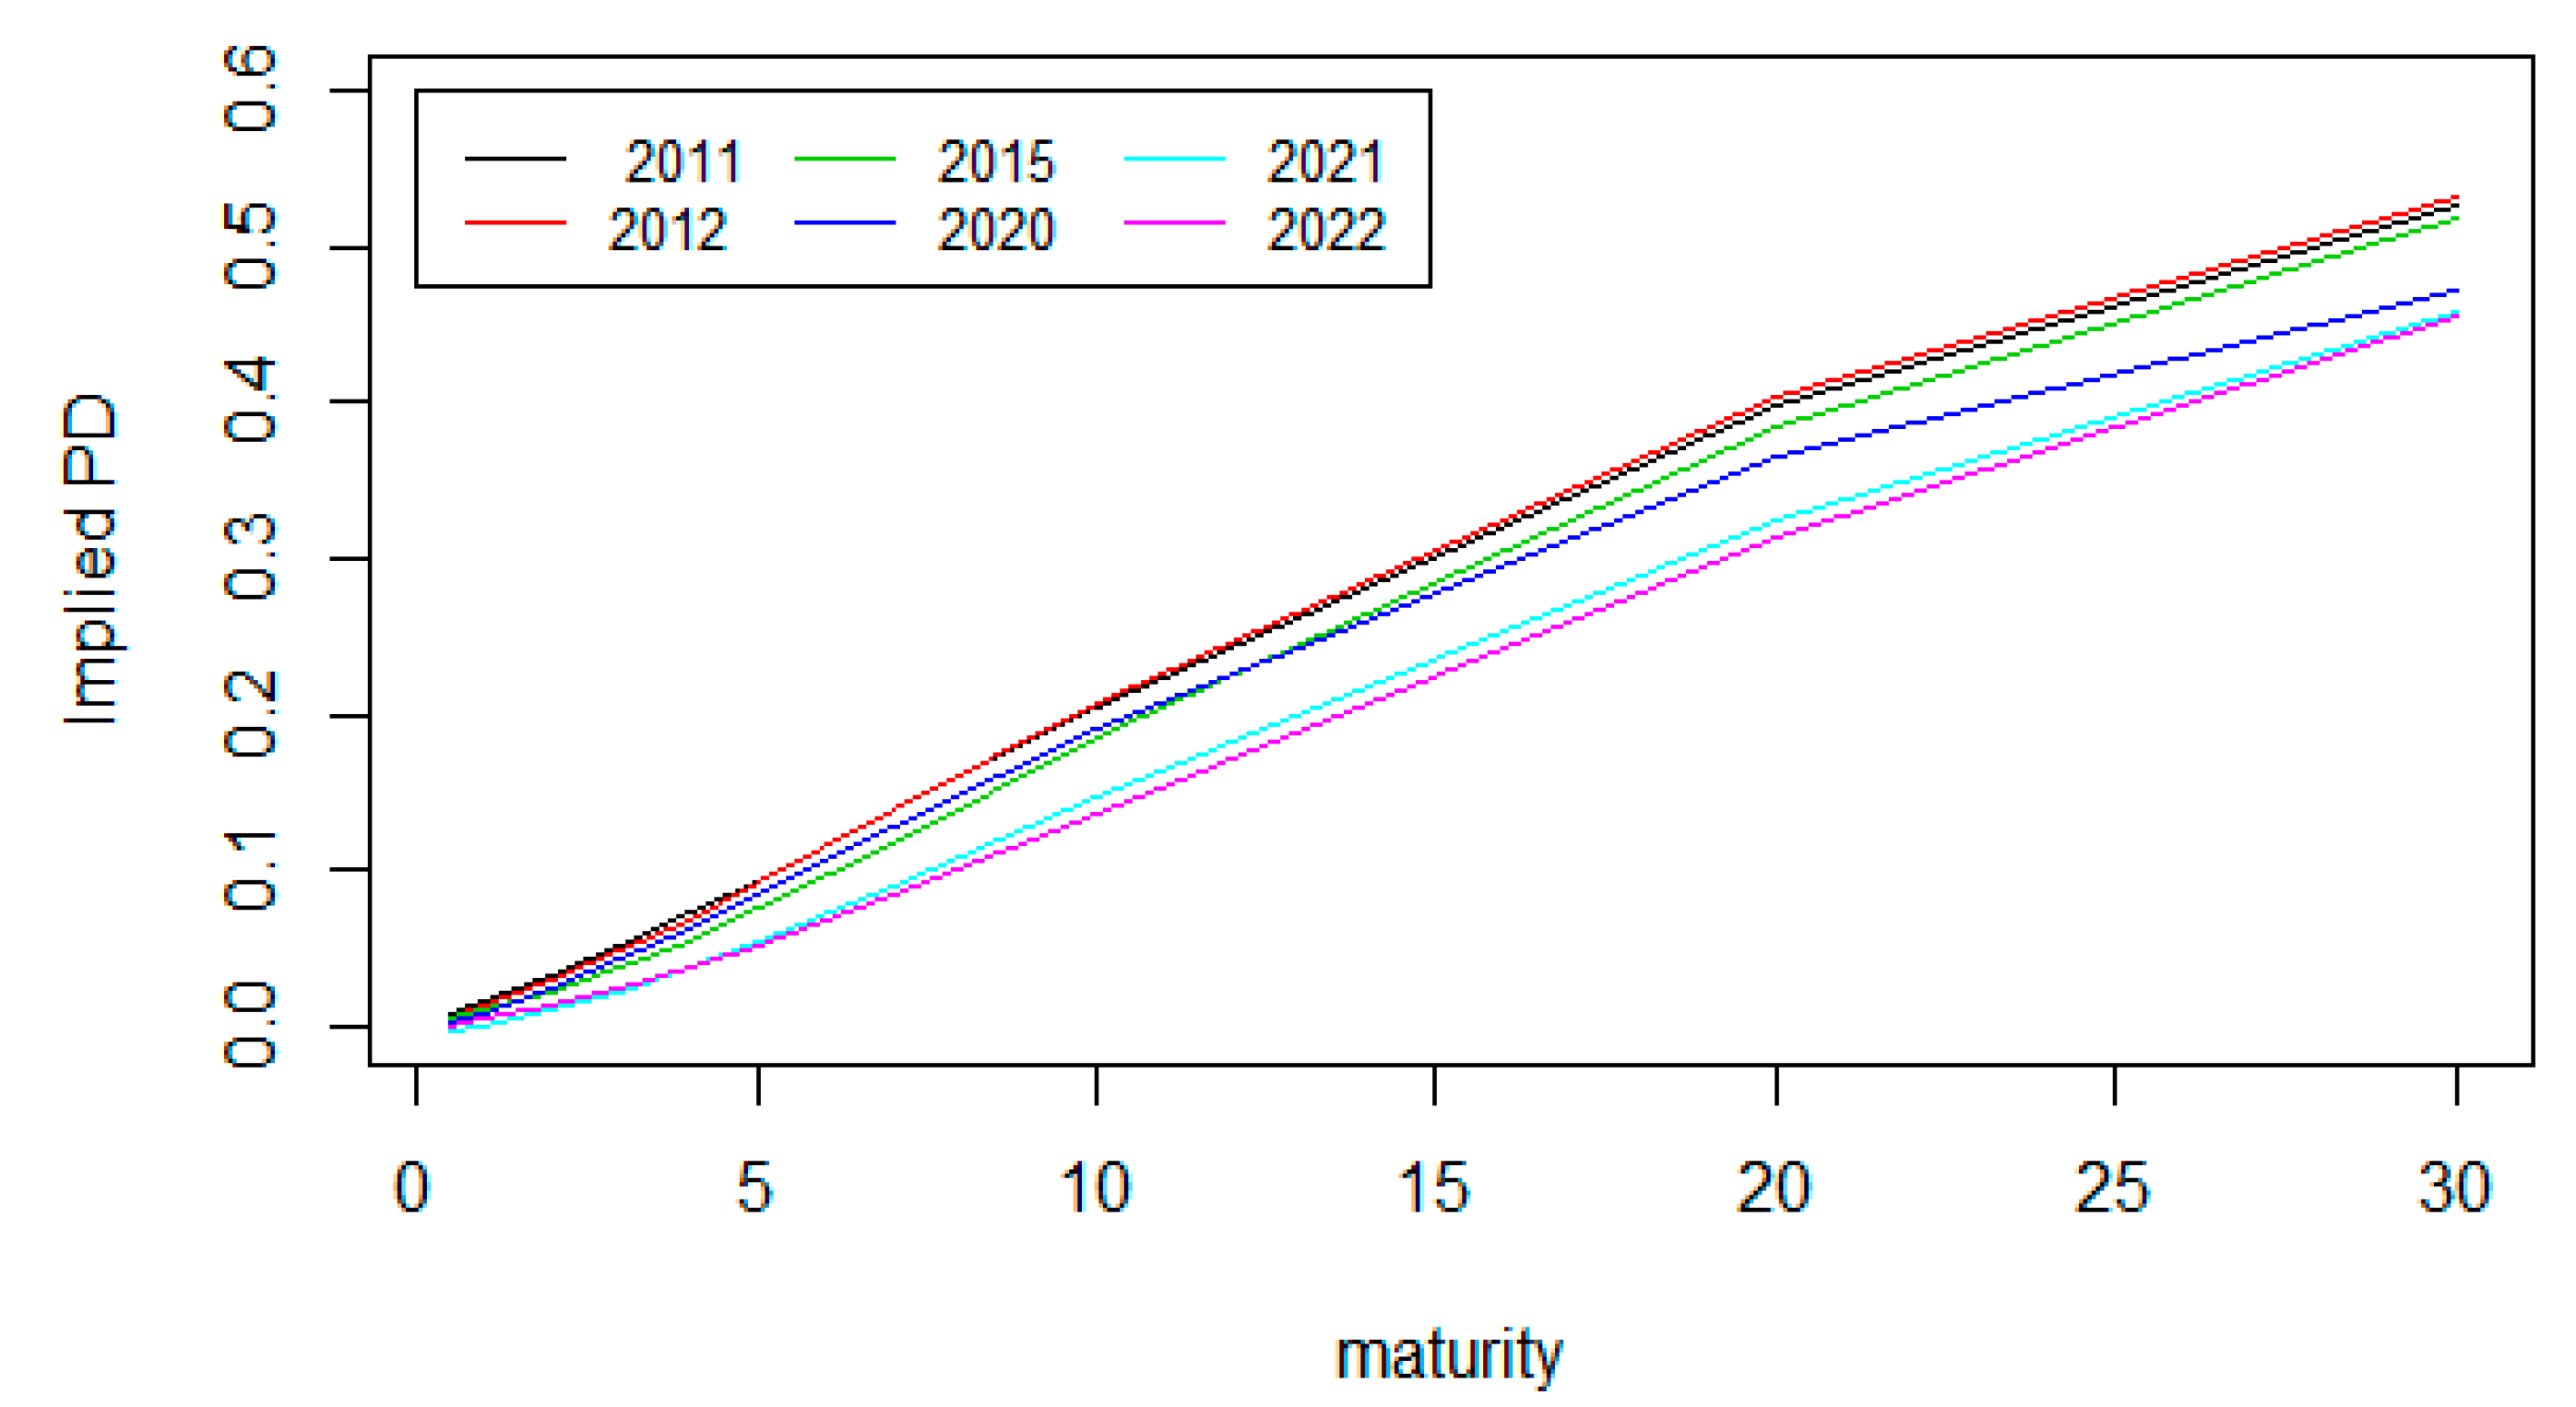
3.2.2. Term Structure of CDS-Based Implied Default Probability

The CDS-based default probability was employed to analyze the credit risk of MENA countries in discrete time. We utilized the Nelson and Siegel (1987) model to estimate the term structure of implied default probabilities.
As delineated by Abid et al. (2020), the forward market-implied default probability for maturity T, following the Nelson and Siegel (1987) model, is
q T = β 1 + β 2 e T τ + T τ β 3 e T τ
The function of the corresponding term structure is
Q T = β 1 + β 2 + β 3 1 e T τ / T τ β 3 e T τ
Diebold and Li (2006) reformulated the Nelson and Siegel (1987) equation so that parameters (β1, β2 and β3) can be easily interpreted, so the forward default probability is given by
q t ( T ) = β 1 t + β 2 t e λ t T + β 3 t λ t e λ t T
The function of the corresponding term structure is
Q t ( T ) = β 1 t + β 2 t 1 e λ t T λ t T + β 3 t 1 e λ t T λ t T e λ t T
Parameters β1t, β2t and β3t can be considered factors of level, slope and curvature, respectively. λt is a scale parameter or decreasing parameter of market-implied default probability, which has a significant effect on the slope and curvature components. For a very high value of λ, the component of the slope decreases slowly, and the component of the curvature reaches its maximum afterward. To estimate parameters of the model by means of the OLS method, we fixed λt to reduce the model to a linear regression model, as is recommended by Nelson and Siegel (1987), Diebold and Li (2006) and Annaert et al. (2013). The λt selected parameter must correspond to the best estimation market-implied default probabilities and to the maturity for which the value of the component of β3t is the highest. By referring to Muvingi and Kwinjo (2014), the estimation of parameters β1t, β2t and β3t by means of the OLS method can be realized by considering Equation (7).
Q t ( T ) = X t β t + ε t
where Qt(T) is a vector of market-implied default probabilities at time t corresponding to n maturities collected in vector T. βt is a vector of parameters β1t, β2t and β3t. Xt is a vector of the components of parameters β1t, β2t and β3t. εt is a vector of error terms at time t for n estimates of the market-implied default probabilities. Vector Xt is the vector of the independent variables that explain the dependent variables of vector Qt(T).
X t = 1 1 e λ t T 1 λ t T 1 1 e λ t T 1 λ t T 1 e λ t T 1 1 1 e λ t T 2 λ t T 2 1 e λ t T 2 λ t T 2 e λ t T 2 1 1 e λ t T n λ t T n 1 e λ t T n λ t T n e λ t T n
The parameters estimated through the OLS method are given by Equation (9).
β ^ O L S = X T X 1 X T Q
where β ^ O L S is the vector parameters of dimension k, X = v X 1 X 2 X k 1 is constituted by vector v and the independent variables, v is a vector of n dimensions and contains ones and X is a vector of nk dimensions. The estimated vector of market-implied default probabilities can be obtained from the estimated vector of parameters β ^ O L S .
Q ^ = X β ^ O L S

3.2.3. Transition Matrix of CDS-Based Implied Rating

To forecaste sovereign credit risk levels, we employed the homogeneous Markov model in discrete time to estimate the rating transition matrix. This matrix, as investigated in our study, delineates the dynamics of sovereign risk by indicating transition probabilities between different classes of CDS-based implied ratings. We calculated the implied rating transition matrices for Egypt, Morocco and Saudi Arabia on the basis of their CDS-based implied rating history determined in the first step of our research. A discrete time Markov chain is a stochastic process that forms a series of random variables X1, X2, …, Xn, which are the country’s implied ratings in our case, with the results x1, x2, …, xn. A property of the Markov chain in discrete time is that the future implied rating at a particular time depends only on the current implied rating:
Pr ( X n + 1 = x n + 1 / X 1 = x 1 , X 2 = x 2 , , X n = x n ) = Pr ( X n + 1 = x n + 1 / X n = x n )
N is the number of possible implied ratings, M is the transition matrix of the one-year individual implied rating, and Pij is the probability that the company may have an implied rating j in (t + 1), with the knowledge that it has the implied rating i in t with ∆t = 1 year.
M = P 11 P 12 P 1 N P 21 P 22 P 2 N P N 1 P 2 N P N N
p i j = n i j n i
where n i j is the number of times the company changes from implied rating i to implied rating j during the study period and n i is the number of times the company is implicitly rated i during the study period. Given that j = 1 N p i j = 1 for i = 1, 2, …, N and P i j 0 i, j = 1, 2, …, N.
A Markov chain is homogeneous if it is possible to deduce the transition probabilities at horizon h(Ph) with the simple knowledge of one-year transition probabilities (p). Therefore, we have
p h = p h
A homogeneous Markov chain is stationary if, over the long run, no matter the starting state, the proportion of time the chain spends in a particular state is approximately the same for all states. The state probability distribution is an invariant and permanent distribution in the long term.
To assess the implied rating transition matrix, the bootstrap maximum likelihood method was applied. We followed the process of Christensen et al. (2004). First, we applied the bootstrap technique to an annual implied rating sequence. The number of bootstrap samples was 100. Then, we used the MLE method on every sample bootstrap separately, and the corresponding estimated transition probability is given by
p ^ i j = k = 0 N 1 n i j ( Δ t k ) k = 0 N 1 n i ( t k )
where nij(∆tk) is the number of times the company changes from implied rating i to implied rating j during the ∆tk time interval and ni(∆tk) is the number of times the company would have implied rating i during the ∆tk interval.
Finally, the estimated transition probability from implied rating i to implied rating j ( p ^ i j ) is the average of ( p ^ i j ) of the bootstrap samples. The log likelihood of the transition matrix estimation is given by Equation (16).
L L H = i j log ( p ^ i j )
The standard error of the transition probability estimation is
S E i j = p ^ i j n i j

4. Results Analysis

4.1. Implied Default Probability and Implied Rating Results

Figure 2, Figure 3 and Figure 4 illustrate the evolution of sovereign default probabilities over time across various maturities for Egypt, Morocco and Saudi Arabia, respectively. These probabilities were derived from observed CDS spreads for corresponding maturities, employing the Hull (2014) model. It is evident that the CDS-based implied default probability rose as maturity increased, signifying elevated credit risk for longer maturities.
For each year of the studied period, the average implied default probability was used to determine the implied rating of the MENA countries according to the classification defined by the Thomson Reuters StarMine Sovereign Risk model. So, for each country, we obtained a sequence of CDS-based implied ratings, given in Table 3.
To display credit rating evolution during the period of research of these three countries, as shown in Figure 5, numbers from 1 to 8 were assigned to the rating categories, as shown in Table 4.
Table 4 and Figure 5 show that Egypt suffers from the highest credit risk, as it belongs to the subinvestment grade class since its credit rating is BB and below, and it reached the worst class, CCC, in 2022, which makes its situation worrying. This lies in contrast to Saudi Arabia, which belongs to the investment class with a rating of BBB and above, implying a high level of solvency for this country, reaching class AA in 2021 and A in 2022. For Morocco, the credit rating at the start of the years of study seems low, but after 2017, it improved and reached class A in 2020, which implies an improvement in the level of solvency of this country in the last decade due to the development of the country in all areas. The sequences of determined CDS-implied rating were then used to predict the level of credit risk of the selected countries by estimating the transition matrix for different horizons.

4.2. Term Structure Results

The estimated parameters ( β ^ 1 t , β ^ 2 t and β ^ 3 t ), through the OLS method, and the fixed value of λ t , for each estimation date (t), for the three MENA countries are summarized in Table 5, Table 6 and Table 7. We noticed that the estimated parameters are significant at the 1% risk level. Moreover, we noticed that the β ^ 2 t coefficient for Egypt, in absolute value, is strictly greater than that of other countries at each estimation date. As a result, the slope of the term structure curve for Egypt is expected to be greater than those of Morocco and Saudi Arabia.
The term structures of the CDS-implied default probability estimated by the Nelson and Siegel (1987) model are shown in Figure 6, Figure 7 and Figure 8 for Egypt, Morocco and Saudi Arabia, respectively.
Figure 6 displays Egypt’s implied default probability term structures for various dates spanning from 2009 to 2022. Across each year of estimation, the term structure consistently exhibits an upward curve, suggesting that long-term default risk holds more significance than short-term risk. However, the level of risk fluctuates from year to year. It undergoes temporal variations, at times increasing and at other times decreasing, yet consistently retaining its importance and criticality. The depicted figure highlights a notable surge in credit risk in 2012 across all maturities compared to 2009. This increase aligns with the period of political instability stemming from the revolution in 2011 until the restoration of political stability in 2014. This instability serves to elucidate the subsequent relative decline in the term structure of the implied default probability in 2015. In 2020, the term structure increases, and we notice a return to the level of risk seen in 2012. For maturities less than 10 years, the probability of defaulting is slightly lower than that of 2012. But beyond 10 years of maturity, the curves coincide, and the same level of credit risk is estimated in the long term. The high level of credit risk in 2020 reflects the impact of COVID-19’s propagation. Egypt was able to cope with the health crisis by pursuing a macroeconomic adjustment program deployed by the authorities under the guidance of the IMF, and it was able to improve the economic and financial situation that explains the decrease in the risk of insolvency represented by a decrease in the term structure of the CDS-implied probability of defaulting in 2021. The war between Russia and Ukraine increased the risk and concerns about the country’s economic balance (decrease in tourism receipts, rise in wheat and oil prices…), and for this, we found a significant increase in 2022 of the term structure of the default probability, which exceeded 40% for a maturity of 5 years. Despite Egypt’s critical economic and financial situation, rating agencies have maintained their sovereign rating for Egypt at B (Badr and El-khadrawi 2016; Boumahdi 2022; Oldenburg et al. 2022). According to our determined rating based on CDSs, Egypt in 2022 was rated CCC, which conformed well to its overall situation. The difference between the ratings is due to differences in the estimation of credit risk. The default probabilities estimated by a real-world model are generally smaller than those of a risk-neutral model, like our model, because the latter considers all the risks that exist in the market through the risk premium required by investors against the risk they assume.
Unlike Egypt, the political conflict in Morocco in 2011 did not result in lasting detrimental effects. This accounts for the decline in the probability of defaulting from 2012, as evidenced by lower term structures until 2020. However, the elevated level of credit risk in 2021 reflects the impact of the COVID-19 pandemic in Morocco. The expenses associated with the extraordinary measures implemented to mitigate the adverse effects of the health crisis have worsened the country’s financial situation and heightened the sovereign risk of insolvency across all investment horizons. This explains the increase in the term structure of the implied probability of defaulting in 2021. In 2022, the term structure of the implied default probability persists in its upward trajectory due to threats impacting the country’s food security stemming from climate risks and the conflict in Ukraine. Nevertheless, Morocco is progressively drawing foreign investors, and the revenue generated is directed toward mitigating the budget deficit. This enables the country to alleviate the impacts of crises, enhance its economy and mitigate its credit risk. Consequently, we observed that the term structures of implied default probability in Morocco are somewhat responsive to crises, experiencing fluctuations both upward and downward, albeit within a narrower range compared to Egypt.
Figure 8 illustrates that the probability of defaulting diminishes over time across all maturities. Saudi Arabia enjoys political, economic and financial stability, and its solvency level remains impervious to global crises such as the health crisis in 2020 and the conflict in Ukraine in 2022. This resilience can be attributed to the fact that the Saudi economy is predominantly reliant on hydrocarbons and religious tourism. GDP growth in Saudi Arabia is intricately tied to the growth of real oil production, as noted by Thornary et al. (2022a, 2022b).

4.3. Rating Transition Matrix Results

The one-year implied rating transition matrices for Egypt, Morocco and Saudi Arabia, estimated using the homogeneous Markov model, along with confidence intervals and standard errors for each transition probability, are presented in Table 8, Table 9 and Table 10.
According to these tables, the transition probabilities fall within the corresponding confidence intervals with low standard errors of estimation at a 95% confidence level. Notably, after one year, Egypt, which had a CDS-based implied rating of CCC in 2022, has a probability of 0.684 of improving to B, a probability of 0.1663 of improving to BB and a probability of 0.148 of remaining in the same rating class. Thus, Egypt’s situation remains critical. In contrast, Morocco and Saudi Arabia, rated BBB and A, respectively, in 2022, are expected to maintain high levels of solvency after one year. Morocco has a probability of 0.458 of remaining at the same rating, a probability of 0.235 of downgrading to BB and a probability of 0.305 of upgrading to A. For Saudi Arabia, the rating could increase to AA, remain at A or downgrade to BBB with probabilities of 0.025, 0.430 and 0.543, respectively.
The 10, 20 and 30-year transition matrices, made by multiplying the one-year transition matrix by itself 10, 20 and 30 times, are shown in Table 11, Table 12 and Table 13.
These tables show that, for the three studied MENA countries, the transition probability from one rating class to another remains almost constant over the 10, 20 and 30-year horizons. This indicates that the Markov chain of the CDS-based implied ratings is time invariant, and the distribution of state probabilities is in a steady state in the long term. Additionally, the probability of being in a given rating class over the long term for 10, 20 and 30 years does not depend on the initial state. Whatever the initial state, the chain converges to the invariant probability. Therefore, the chain of CDS-based implied ratings is ergodic.

5. Conclusions and Creditworthiness Implications

Measuring and forecasting the sovereign credit risk of the MENA countries in periods of global crises is the main objective of this article. We focused on three selected countries: Egypt, Morocco and Saudi Arabia, which represent varying levels of development and social welfare.
The probability of defaulting, a robust measure of credit risk, was estimated based on the CDS price using the Hull (2014) model. This probability was then used to identify the implied ratings of these countries using the Thomson Reuters StarMine Sovereign Risk model. The results indicate that the CDS-based implied default probability increases with maturity, suggesting higher credit risk for longer maturities. Among the observed CDS-based implied ratings, Egypt was identified as the riskiest country, whereas Saudi Arabia is the most solvent. To measure credit risk for different horizons, the term structure of the probability of defaulting was modeled using the Nelson and Siegel (1987) model. For each year of estimation, the term structure shows a rising curve, indicating that Egypt, Morocco, and Saudi Arabia are more insolvent in the long term than in the short term. This implies that lenders face additional risk when lending to these countries at longer maturities. Furthermore, the slope of the term structure for the CDS-based implied default probability is steeper for Egypt than those for Morocco and Saudi Arabia, especially during years of crisis.
The term structure varies across different years. For Egypt and Morocco, it sometimes trends upwards and sometimes downwards, indicating fluctuations in the level of sovereign credit risk. The upward trend in risk is attributable to the 2011 revolution, the COVID-19 health crisis and the war in Ukraine. These crises have had a more significant impact on Egypt’s solvency, leading to higher probabilities of defaulting. In contrast, Morocco managed these crises better through increased foreign investments, which covered a significant portion of its financing needs, thus making its situation less critical than Egypt’s. Saudi Arabia’s sovereign credit risk has been decreasing year by year, as shown by the downward trend in the term structure of the CDS-based implied default probability. Its level of solvency remains largely unaffected by global crises, primarily due to rising oil prices. The term structure estimation results confirm the implied rating determination results by providing consistent levels of sovereign credit risk for the selected MENA countries across each studied year. These results also align with the evolution of economic and financial indicators such as GDP growth, inflation rate, budget deficit, debt, foreign investments and oil prices, as provided by the World Bank. Finally, to predict the sovereign credit risk level, the transition matrices of the CDS-based implied rating were estimated. After one year, the sovereign credit risk level remains almost unchanged for the three countries. Specifically, Egypt continues to face high risk, despite potential rating improvements, and remains in lower rating classes, limiting its access to the debt market. Morocco has an opportunity to improve its rating, which could attract more foreign investment. Saudi Arabia maintains its high level of solvency, indicating the sustainability of its financial stability. In conclusion, this paper identifies Egypt as the most fragile economy among the studied MENA countries, particularly after 2009. The higher default probabilities in Egypt can be largely attributed to significant political events, such as the 2011 revolution and the subsequent period of instability. These events led to economic disruptions, decreased investor confidence and increased borrowing costs. Furthermore, ongoing political instability has hindered economic reforms and growth, exacerbating the country’s credit risk profile. (El-Bassiouny and Letmathe 2020; Maher and Zhao 2021). Morocco and Saudi Arabia have shown greater resilience in default probability and credit rating compared to Egypt, maintaining significant stability despite economic challenges. This resilience stems from the implementation of robust economic policies and structural reforms aimed at diversifying their economies and enhancing fiscal stability. Saudi Arabia aims to reduce oil dependence and develop sectors like tourism and technology, and Morocco focuses on industrialization, agriculture and renewable energy, leading to more robust economic structures. Their relatively stable political environments contribute to consistent economic policies and investor confidence, mitigating risks associated with political turmoil. Effective fiscal management, including prudent public debt management and sustainable fiscal balances, supports their economic stability, with Saudi Arabia’s substantial foreign reserves and Morocco’s cautious debt practices being key examples. Strong international relations and strategic alliances bolster economic stability, as Saudi Arabia’s pivotal role in global energy markets and Morocco’s trade agreements with the European Union enhance their economic resilience (Ben Hassen 2022; Lazrak 2023).
These findings have significant implications for policymakers and investors. For policymakers, understanding the varying risk profiles and the factors contributing to economic fragility can guide the development of more targeted economic and political strategies to mitigate risk and enhance stability. For investors, the insights into the term structures of default probabilities provide valuable information for making informed investment decisions, particularly in managing portfolio risks associated with long-term investments in these countries. Additionally, the use of advanced models such as the Nelson–Siegel model and the homogeneous Markov model underscores the importance of employing sophisticated analytical tools in credit risk assessments, which can contribute to more accurate and reliable predictions in the context of global economic uncertainties.

Author Contributions

Data curation, A.A.; Formal analysis, A.A.; Investigation, A.A.; Methodology, A.A. and F.A.; Software, A.A.; Supervision, F.A.; Validation, F.A.; Writing—original draft preparation, A.A. All authors have read and agreed to the published version of the manuscript.

Funding

This research received no external funding.

Data Availability Statement

Data are available from the sources cited.

Conflicts of Interest

The authors declare no conflicts of interest.

References

  1. Abid, Amira, and Abid Fathi. 2023. A methodology to estimate the optimal debt ratio when asset returns, and default probability follow stochastic processes. Journal of Industrial and Management Optimization 19: 7735–52. [Google Scholar] [CrossRef]
  2. Abid, Amira, Abid Fathi, and Kaffel Bilel. 2020. CDS-based implied probability of default estimation. The Journal of Risk Finance, ahead-of-print. [Google Scholar] [CrossRef]
  3. Annaert, Jan, Anouk G. P. Claes, Mark J. K. De Ceuster, and Hairui Zhang. 2013. Estimating the spot rate curve using the Nelson-Siegel model: A ridge regression approach. International Review of Economics and Finance 27: 482–96. [Google Scholar] [CrossRef]
  4. Annaert, Jan, and Marc Ceuster. 2000. Modelling European Credit Spreads, 3rd ed. Prinsstraat: Universiteit Antwerpen. [Google Scholar]
  5. Augustin, Patrick, Valeri Sokolovski, Marti G. Subrahmanyam, and Davide Tomio. 2022. How sovereign is sovereign credit risk? Global prices, local quantities. Journal of Monetary Economics 131: 92–111. [Google Scholar] [CrossRef]
  6. Badr, Osama M., and Ahmed F. El-khadrawi. 2016. Macroeconomic Variables, Government Effectiveness and Sovereign Credit Rating: A Case of Egypt. Applied Economics and Finance 3: 29–36. [Google Scholar] [CrossRef]
  7. Baranovski, Alexander, Carsten von Lieres und Wilkau, and André Wilch. 2009. New Recipes for Estimating Default Intensities. Discussion Paper 2009-004, Eurobanking SFB 649. Berlin: Humboldt University of Berlin, Collaborative Research Center 649. [Google Scholar]
  8. Barry, Ibrahim. 2022. Arabie saoudite-situation économique et financière en 2022. Riyad: Ambassade de France en Arabie Saudite—Service économique de Riyad. [Google Scholar]
  9. Ben Hassen, T. 2022. The GCC Economies in the Wake of COVID-19: Toward Post-Oil Sustainable Knowledge-Based Economies? Sustainability 14: 11251. [Google Scholar] [CrossRef]
  10. Blair, David. 2013. Counterparty Credit Risk. In Financial Derivatives. Working Paper. Hoboken: John Wiley & Sons, Inc. [Google Scholar] [CrossRef]
  11. Blümke, Oliver. 2018. A Markov Chain Approximation of Transition Matrices with Applications to Credit Ratings. SSRN Electronic Journal. Available online: https://ssrn.com/abstract=3124116 (accessed on 10 May 2024). [CrossRef]
  12. Boumahdi, Mohamed Amine. 2022. Fiche Pays Egypte; Paris: Ministère de l’Economie des Finaces et de la Souvraineté Industrielle et Numérique, Service Economique du Caire, Direction Générale du Trésort.
  13. Caldeira, João F., Guilherme V. Moura, André AP Santos, and Fabricio Tourrucôo. 2016. Forecasting the yield curve with the Arbitrage-Free dynamic Nelson–Siegel model: Brazilian evidence. EconomiA 17: 221–37. [Google Scholar] [CrossRef]
  14. Christensen, Jens H. E., Ernst Hansen, and David Lando. 2004. Confidence sets for continuous-time rating transition probabilities. Journal of Banking and Finance 28: 2575–602. [Google Scholar] [CrossRef]
  15. Cizel, Janko. 2013. Are credit rating announcements contagious? Evidence on the transmission of information across industries in credit default swap markets. The Journal of Fixed Income 23: 27–60. [Google Scholar] [CrossRef]
  16. Diebold, Francis X., and Canlin Li. 2006. Forecasting the term structure of government bond yields. Journal of Econometrics 130: 337–64. [Google Scholar] [CrossRef]
  17. Dwyer, Douglas, Zan Li, Shisheng Qu, Heather Russell, and Jing Zhang. 2010. CDS-Implied EDF TM credit measures and Fair-Value spreads. Moody’s Analytics, 1–43. [Google Scholar] [CrossRef]
  18. El-Bassiouny, Dina, and Peter Letmathe. 2020. Political instability and corporate social responsibility: The case of Egypt. Social Responsibility Journal 16: 745–67. [Google Scholar] [CrossRef]
  19. Engelmann, Bernd, and Konstantin Ermakov. 2011. Transition matrices: Properties and estimation methods. In The Basel II Risk Parameters: Estimation, Validation, Stress Testing-with Applications to Loan Risk Management. Berlin/Heidelberg: Springer, pp. 103–16. [Google Scholar]
  20. Flannery, Mark J., Joel F. Houston, and Frank Partnoy. 2010. Credit default swap spreads as viable substitutes for credit ratings. University of Pennsylvania Law Review 158: 2085–123. [Google Scholar]
  21. Frydman, Halina, and Til Schuermann. 2008. Credit rating dynamics and Markov mixture models. Journal of Banking and Finance 32: 1062–75. [Google Scholar] [CrossRef]
  22. Gavalas, Dimitris, and Theodore Syriopoulos. 2014. Bank credit risk management and rating migration analysis on the business cycle. International Journal of Financial Studies 2: 122–43. [Google Scholar] [CrossRef]
  23. Hilscher, Jens, and Mungo Wilson. 2017. Credit ratings and credit risk: Is one measure enough? Management Science 63: 3414–37. [Google Scholar] [CrossRef]
  24. Hua, Jian. 2015. Term structure modeling and forecasting using the Nelson-Siegel model. In Handbook of Financial Econometrics and Statistics. Greer: Springer, pp. 1093–103. [Google Scholar]
  25. Hull, John C. 2014. Options, Futures and Other Derivatives, Pearson. London: Pearson. [Google Scholar]
  26. Hull, John C., and Alan White. 2000. Valuing credit default swaps I: No counterparty default risk. The Journal of Derivatives 8: 29–40. [Google Scholar] [CrossRef]
  27. Hull, John C., Mirela Predescu, and Alan White. 2004. The relationship between credit default swap spreads, bond yields, and credit rating announcements. Journal of Banking and Finance 28: 2789–811. [Google Scholar] [CrossRef]
  28. Hung, Chi-Hsiou, Banerjee Anuarg, and Meng Qingrui. 2017. Corporate financing and anticipated credit rating changes. Review of Quantitative Finance and Accounting 48: 893–915. [Google Scholar] [CrossRef]
  29. International Monetary Fund. 2013. Chapter 2: A New Look at the Role of Sovereign Credit Default Swaps. Global Financial Stability Report. Washington, DC: IMF, pp. 57–92. [Google Scholar]
  30. Jacobs, Michael, Jr., Ahmet K. Karagozoglu, and Dina Naples Layish. 2016. Credit risk signals in CDS market vs agency ratings. The Journal of Risk Finance 17: 194–217. [Google Scholar] [CrossRef]
  31. Jarrow, Robert A. 2001. Default parameter estimation using market prices. Financial Analysts Journal 57: 75–92. [Google Scholar] [CrossRef]
  32. Jarrow, Robert A., David Lando, and Stuart M. Turnbull. 1997. A Markov model for the term structure of credit risk spreads. Review of Financial Studies 10: 481–523. [Google Scholar] [CrossRef]
  33. Jones, Matthew T. 2005. Estimating Markov Transition Matrices Using Proportions Data: An Application to Credit Risk. IMF Working Paper. pp. 1–27. Available online: https://ssrn.com/abstract=888088 (accessed on 10 May 2024). [CrossRef]
  34. Lando, David. 2010. Rating transition matrices. In Encyclopedia of Quantitative Finance. Hoboken: John Wiley and Sons. [Google Scholar]
  35. Lazrak, Mohammed. 2023. Moroccan-African Religious Diplomacy: Prospects and Challenges. International Journal of Religious and Cultural Studies 5: 75–86. [Google Scholar] [CrossRef]
  36. Liu, Lily Y. 2017. Estimating Loss Given Default from CDS under Weak Identification. Risk and Policy Analysis Unit Paper RPA 17-1, Federal Reserve Bank of Boston. Available online: https://ssrn.com/abstract=3033354 (accessed on 10 May 2024).
  37. Longstaff, Francis A., Lasse H. Pedersen Jun Pan, and Kenneth J. Singleton. 2011. How Sovereign Is Sovereign Credit Risk? American Economic Journal: Macroeconomics 3: 75–103. [Google Scholar] [CrossRef]
  38. Maher, Mohamed, and Yanzhi Zhao. 2021. Do Political Instability and Military Expenditure Undermine Economic Growth in Egypt? Evidence from the ARDL Approach. Defence and Peace Economics 33: 956–79. [Google Scholar] [CrossRef]
  39. Malik, Madhur, and Lyn C. Thomas. 2012. Transition matrix models of consumer credit ratings. International Journal of Forecasting 28: 261–72. [Google Scholar] [CrossRef]
  40. Merton, Robert C. 1974. On the pricing of corporate debt: The risk structure of interest rates. The Journal of Finance 29: 449–70. [Google Scholar]
  41. Muvingi, Jacob, and Takudza Kwinjo. 2014. Estimation of term structures using Nelson- Siegel and Nelson-Siegel-Svensson: A case of a Zimbabwean bank. Journal of Applied Finance and Banking 4: 155–90. [Google Scholar]
  42. Nelson, Charles R., and Andrew F. Siegel. 1987. Parsimonious modeling of yield curves. The Journal of Business 60: 473–89. [Google Scholar] [CrossRef]
  43. Oldenburg, Michel, Anais Boitiere, Sarah Jiquel, Mohamed Amin Boumahdi, and Antoine Cosson. 2022. La Lettre Economique d’Egypte. Caire: Ambassade de France en Republique Arabe d’Egypte—Service économique du Caire. [Google Scholar]
  44. Paret, Anne Charlotte, and Gilles Dufrénot. 2015. Sovereign Default in Emerging Market Countries: A Transition Model Allowing for Heterogeneity. Amundi Asset Management Working Paper, WP-049-2015. Paris: Amundi Asset Management. [Google Scholar]
  45. Piccolo, Alessio, and Joel Shapiro. 2022. Credit Ratings and Market Information. The Review of Financial Studies 35: 4425–73. [Google Scholar] [CrossRef]
  46. Rodríguez, Ivan M., Krishnan Dandapani, and Edward R. Lawrence. 2019. Measuring sovereign risk: Are CDS spreads better than sovereign credit ratings? Financial Management 48: 229–56. [Google Scholar] [CrossRef]
  47. Thornary, Baptiste, Anne Sophie Fèvre, Adriana Meyer, Victor Lequillerier, Sabrina El Kasmi, Laetitia Morin, and Thomas Laboureau. 2022a. Direction de l’évaluation des études et de la prospective—Fiche Maroc. Maisons-Alfort: Bpifrance. [Google Scholar]
  48. Thornary, Baptiste, Anne Sophie Fèvre, Adriana Meyer, Victor Lequillerier, Sabrina El Kasmi, Laetitia Morin, and Thomas Laboureau. 2022b. Direction de l’évaluation des études et de la prospective—Fiche pays Arabi Saudite. Maisons-Alfort: Bpifrance. [Google Scholar]
  49. Tourabi, Abdellah, and Lamia Zaki. 2011. Maroc: Une révolution royale? Mouvements 2: 98–103. Available online: https://www.cairn.info/revue-mouvements-2011-2-page-98.htm (accessed on 10 May 2024).
  50. Vieira, Maria, and George Bonne. 2016. Starmine Sovereign Risk Model. Refinitiv, RE105787/12-19. Available online: https://solutions.refinitiv.com/StarMineNAsia-Whitepapers (accessed on 10 May 2024).
  51. Zhu, Haibin. 2006. An Empirical Comparison of Credit Spreads between the Bond Market and the Credit Default Swap Market. Journal of Financial Services Research 29: 211–35. [Google Scholar] [CrossRef]
Figure 1. Methodology to assess and predict credit risk using Hull (2014), StarMine, Nelson and Siegel (1987) and Homogeneous Markovian models.
Jrfm 17 00283 g001
Figure 2. Evolution of CDS-based implied default probability for different maturities of Egypt from 20 August 2009 to 6 September 2022.
Jrfm 17 00283 g002
Figure 3. Evolution of the CDS-based implied default probability for different maturities of Morocco from 1 January 2009 to 6 September 2022.
Jrfm 17 00283 g003
Figure 4. Evolution of CDS-based implied default probability for different maturities of Saudi Arabia from 15 February 2011 to 6 September 2022.
Jrfm 17 00283 g004
Figure 5. CDS-based implied rating evolution of Egypt, Morocco and Saudi Arabia.
Jrfm 17 00283 g005
Figure 6. Nelson–Siegel term structure of the CDS-based implied default probability of Egypt in 2009, 2012, 2015, 2020, 2021 and 2022.
Jrfm 17 00283 g006
Figure 7. Nelson–Siegel term structure of the CDS-based implied default probability of Morocco in 2009, 2012, 2015, 2020, 2021 and 2022.
Jrfm 17 00283 g007
Figure 8. Nelson–Siegel term structure of the CDS-based implied default probability of Saudi Arabia in 2011, 2012, 2015, 2020, 2021 and 2022.
Jrfm 17 00283 g008
Table 1. Descriptive statistics of CDS spread series of different maturities for studied MENA countries.
Egypt
Maturity0.5123457102030
Min809014716717516217517617525
Mean264.3298.8345.8375.2394.9413.6430.6440.5447.9440.3
Max1608.81458.51390.11309.61492.81458.51390.11309.61290.01284.4
Sd170.2483177.1297176.8832172.1435168.1435164.1476161.9315157.1423153.7284175.2815
Morocco
Maturity0.5123457102030
Min0.779.9027.9943.4461.6279.8298.55104.299.7193.45
Mean81.0594.37116.12133.45151.01165.38179.50189.8197.03199.68
Max259.14265.00276.58304.54327.72335.00335.00339.4353.23361.41
Sd48.3105149.0654750.0577652.2445453.4414854.2038253.3055554.6964756.1072156.69838
Saudi Arabia
Maturity0.5123457102030
Min1.030.3411.1615.6628.7443.3061.3177.3881.4976.3
Mean29.6635.0846.2759.1574.4289.92111.94126.76140.11146.2
Max184.79188.61196.79206.42218.29232.39253.67265.42277.61286.7
Sd28.8063130.5674131.7334232.1485632.6751133.5703932.518931.8255234.1913135.4292
Table 2. Mapping of StarMine Sovereign Risk probability of defaulting to letter grades.
If the One-Year PD (%) Is Greater ThanAnd the One-Year PD (%) Is Less Than or Equal toThen the Rating Is
0.000%0.123%AAA
0.123%0.332%AA
0.332%0.851%A
0.851%1.879%BBB
1.879%4.107%BB
4.107%12.052%B
12.052%20.973%CCC
20.973%100.0%CC
Source: Refinitiv/StarMine Sovereign Risk model by StarMine research team. RE105787/12-19.
Table 3. Determined CDS-based implied rating.
YearsEgyptMoroccoSaudi Arabia
2009BBBB-
2010BBBBB-
2011BBBBBB
2012BBBBBB
2013BBBAA
2014BBBAA
2015BBBBBB
2016BBBBBB
2017BBBBBAA
2018BBBBBA
2019BBBBA
2020BABBB
2021BBBBBAA
2022CCCBBBA
Table 4. CDS-based implied ratings and assigned numerical coding.
Rating Code12345678
CDS-based implied ratingAAAAAABBBBBBCCCCC
Table 5. Estimated parameters of the Nelson–Siegel model for Egypt.
Date β ^ 1
(p-Value)
β ^ 2
(p-Value)
β ^ 3
(p-Value)
λ
20090.01646
(0.9459)
−0.08428
(0.6952)
1.12635
(0.0885)
0.1379506
20121.111116
(1.22 × 10⁻¹²) *
−1.087499
(2.08 × 10⁻¹²) *
−0.705117
(1.79 × 10−7) *
0.3260436
20151.130770
(9.05 × 10⁻¹³) *
−1.124164
(4.57 × 10⁻¹³) *
−0.642330
(7.22 × 10−8) *
0.1992737
20201.114850
(9.26 × 10⁻¹⁵) *
−1.081379
(3.36 × 10⁻¹⁴) *
−1.095824
(1.22 × 10−10) *
0.3985108
20211.122746
(5.96 × 10⁻¹³) *
−1.116183
(7.06 × 10⁻¹³) *
−0.950938
(9.33 × 10−9) *
0.298877
20221.100861
(9.88 × 10⁻¹³) *
−1.045899
(6.55 × 10⁻¹²) *
−0.688646
(4.26 × 10−7) *
0.4483072
Note: * Denotes a 1% level of significance.
Table 6. Estimated parameters of the Nelson–Siegel model for Morocco.
Date β ^ 1
(p-Value)
β ^ 2
(p-Value)
β ^ 3
(p-Value)
λ
20091.03071
(1.39 × 10⁻¹⁰) *
−1.02755
(6.27 × 10⁻¹¹) *
−0.45770
(1.08 × 10−5) *
0.1195632
20121.081930
(1.94 × 10⁻¹²) *
−1.078795
(9.02 × 10⁻¹³) *
−0.768440
(2.79 × 10−8) *
0.1887807
20150.93849
(5.07 × 10⁻¹¹) *
−0.92918
(2.25 × 10⁻¹¹) *
−0.58453
(1.11 × 10−6) *
0.1630265
20200.92524
(5.84 × 10⁻¹¹) *
−0.91462
(2.68 × 10⁻¹¹) *
−0.60202
(1.09 × 10−6) *
0.1707952
20210.95609
(1.27 × 10⁻¹¹) *
−0.95872
(5.10 × 10⁻¹²) *
−0.75129
(4.37 × 10−8) *
0.1494588
20221.01311
(1.90 × 10⁻¹¹) *
−1.01986
(7.44 × 10⁻¹²) *
−0.69407
(1.68 × 10−7) *
0.1494588
Note: * Denotes a 1% level of significance.
Table 7. Estimated parameters of the Nelson–Siegel model for Saudi Arabia.
Date β ^ 1
(p-Value)
β ^ 2
(p-Value)
β ^ 3
(p-Value)
λ
20110.898359
(9.37 × 10⁻¹²) *
−0.897360
(3.91 × 10⁻¹²) *
−0.708039
(2.44 × 10−8) *
0.1379506
20120.866858
(8.90 × 10⁻¹²) *
−0.863565
(3.74 × 10⁻¹²) *
−0.718352
(2.12 × 10−8) *
0.1494588
20150.881929
(3.40 × 10⁻¹) *
−0.879378
(1.42 × 10⁻¹²) *
−0.812071
(3.91 × 10−9) *
0.1494588
20200.74595
(4.64 × 10⁻¹⁰) *
−0.74943
(1.87 × 10⁻¹⁰) *
−0.62122
(1.33 × 10−6) *
0.1630265
20210.86406
(8.33 × 10⁻¹⁰) *
−0.87079
(3.37 × 10⁻¹⁰) *
−0.79250
(5.67 × 10−7) *
0.1280884
20220.98457
(1.83 × 10⁻¹⁰) *
−0.98722
(8.68 × 10⁻¹¹) *
−0.88249
(7.82 × 10−8) *
0.1055055
Note: * Denotes a 1% level of significance.
Table 8. One-year transition matrix of CDS-based implied ratings estimated by the discrete time homogeneous Markov model for Egypt in 2022.
Implied RatingBBBCCC
BB0.3113525
(0.02560048 *)
(0.2692434 **)
(0.3534615 ***)
0.4971895
(0.03173144 *)
(0.4449959 **)
(0.5493831 ***)
0.1914580
(0.02351212 *)
(0.1527840 **)
(0.2301320 ***)
B0.2542111
(0.01719046 *)
(0.2259354 **)
(0.2824869 ***)
0.7457889
(0.01719046 *)
(0.7175131 **)
(0.7740646 ***)
2.069027 × 10−315
(0.00000000 *)
(2.069027 × 10−315 **)
(2.069027 × 10−315 ***)
CCC0.1663335
(0.02734657 *)
(0.1213524 **)
(0.2113146 ***)
0.6847605
(0.04000309 *)
(0.6189613 **)
(0.7505597 ***)
0.1489060
(0.02146092 *)
(0.1136059 **)
(0.1842061 ***)
Notes: Level of confidence: 95%; * standard error; ** lower end of the confidence interval; *** upper end of the confidence interval.
Table 9. One-year transition matrix of CDS-based implied ratings estimated by the discrete time homogeneous Markov model for Morocco in 2022.
Implied RatingABBBBB
A0.10587950
(0.02691508 *)
(0.06160814 **)
(0.15015086 ***)
0.8181818
(0.03942772 *)
(0.7533290 **)
(0.8830347 ***)
0.07593868
(0.02188393 *)
(0.03994281 **)
(0.1119345 ***)
BBB0.30579660
(0.02320965 *)
(0.26762012 **)
(0.34397308 ***)
0.4585097
(0.02922030 *)
(0.4104466 **)
(0.5065728 ***)
0.23569367
(0.02123178 *)
(0.20077050 **)
(0.2706168 ***)
BB0.05717599
(0.01549908 *)
(0.03168227 **)
(0.08266971 ***)
0.2966108
(0.02808647 *)
(0.2504127 **)
(0.3428089 ***)
0.64621323
(0.02753047 *)
(0.60092963 **)
(0.6914968 ***)
Notes: Level of confidence: 95%; * standard error; ** lower end of the confidence interval; *** upper end of the confidence interval.
Table 10. One-year transition matrix of CDS-based implied ratings estimated by the discrete time homogeneous Markov model for Saudi Arabia in 2022.
Implied RatingAAABBB
AA0.21647619
(0.02456264 *)
(0.176074249 **)
(0.25687813 ***)
0.57869048
(0.02901252 *)
(0.530969134 **)
(0.62641182 ***)
0.2048333
(0.02519096 *)
(0.1633979 **)
(0.2462688 ***)
A0.02525253
(0.01313296 *)
(0.003650722 **)
(0.04685433 ***)
0.43083213
(0.02797203 *)
(0.384822233 **)
(0.47684203 ***)
0.5439153
(0.02992910 *)
(0.4946864 **)
(0.5931443 ***)
BBB0.61758521
(0.02618239 *)
(0.574519002 **)
(0.66065141 ***)
0.02538071
(0.01313296 *)
(0.003778907 **)
(0.04698251 ***)
0.3570341
(0.02412102 *)
(0.3173585 **)
(0.3967096 ***)
Notes: Level of confidence: 95%; * standard error; ** lower end of the confidence interval; *** upper end of the confidence interval.
Table 11. Transition matrix of 10, 20 and 30 years of CDS-based implied ratings estimated by the discrete time homogeneous Markov model for Egypt in 2022.
Implied RatingBBBCCC
BB0.2640805 *
0.2640806 **
0.2640806 ***
0.6765132 *
0.6765132 **
0.6765132 ***
0.05940630 *
0.05940629 **
0.05940629 ***
B0.2640806 *
0.2640806 **
0.2640806 ***
0.6765132 *
0.6765132 **
0.6765132 ***
0.05940628 *
0.05940629 **
0.05940629 ***
CCC0.2640805 *
0.2640806 **
0.2640806 ***
0.6765132 *
0.6765132 **
0.6765132 ***
0.05940628 *
0.05940629 **
0.05940629 ***
Notes: * 10 years; ** 20 years; *** 30 years.
Table 12. Transition matrix of 10, 20 and 30 years of CDS-based implied ratings estimated by the discrete time homogeneous Markov model for Morocco in 2022.
Implied RatingABBBBB
A0.1606010 *
0.1450128 **
0.1310481 ***
0.4097178 *
0.3700540 *
0.3344178 ***
0.2906625 *
0.2629896 **
0.237664 ***
BBB0.1688395 *
0.1525207 **
0.1378330 ***
0.4308033 *
0.3892133 **
0.3517321 ***
0.3059074 *
0.2766059 **
0.249969 ***
BB0.1721708 *
0.1557422 **
0.1407444 ***
0.4394966 *
0.3974342 **
0.3591617 ***
0.3129858 *
0.2824490 **
0.255249 ***
Notes: * 10 years; ** 20 years; *** 30 years.
Table 13. Transition matrix of 10, 20 and 30 years of CDS-based implied ratings estimated by the discrete time homogeneous Markov model for Saudi Arabia in 2022.
Implied RatingAAABBB
AA0.3032896 *
0.3033764 **
0.3033764 ***
0.3250668 *
0.3250228 **
0.3250227 ***
0.3716434 *
0.3716005 **
0.3716005 ***
A0.3034091 *
0.3033764 **
0.3033764 ***
0.3249418 *
0.3250228 **
0.3250227 ***
0.3716489 *
0.3716005 **
0.3716005 ***
BBB0.3034187 *
0.3033764 **
0.3033764 ***
0.3250579 *
0.3250228 **
0.3250227 ***
0.3715233 *
0.3716005 **
0.3716005 ***
Notes: * 10 years; ** 20 years; *** 30 years.
Disclaimer/Publisher’s Note: The statements, opinions and data contained in all publications are solely those of the individual author(s) and contributor(s) and not of MDPI and/or the editor(s). MDPI and/or the editor(s) disclaim responsibility for any injury to people or property resulting from any ideas, methods, instructions or products referred to in the content.

