Article

Patterns in the Chaos: The Moving Hurst Indicator and Its Role in Indian Market Volatility

1
Department of Computer Science Engineering, School of Technology, Pandit Deendayal Energy University, Gandhinagar 382426, India
2
Department of Mathematics, School of Technology, Pandit Deendayal Energy University, Gandhinagar 382426, India
3
Department of Information and Communication Technology, School of Technology, Pandit Deendayal Energy University, Gandhinagar 382426, India
*
Authors to whom correspondence should be addressed.
J. Risk Financial Manag. 2024, 17(9), 390; https://doi.org/10.3390/jrfm17090390
Submission received: 12 July 2024 / Revised: 22 August 2024 / Accepted: 28 August 2024 / Published: 3 September 2024

Abstract

:
Estimating the impact of volatility in financial markets is challenging due to complex dynamics, including random fluctuations involving white noise and trend components involving brown noise. In this study, we explore the potential of leveraging the chaotic properties of time series data for improved accuracy. Specifically, we introduce a novel trading strategy based on a technical indicator, Moving Hurst (MH). MH utilizes the Hurst exponent which characterizes the chaotic properties of time series. We hypothesize and then prove empirically that MH outperforms traditional indicators like Moving Averages (MA) in analyzing Indian equity indices and capturing profitable trading opportunities while mitigating the impact of volatility.

1. Introduction

Forecasting volatility in financial markets presents complex challenges, requiring a nuanced understanding of both sudden fluctuations and long-term trends. In our study, we delve into fractal analysis, a technique that identifies recurring patterns in financial data, to explore its potential for market prediction. Our approach is guided by the Hurst exponent, a measure that aligns with the Fractal Market Hypothesis Peters (1994), indicating that changes in a time series’ fractal dimension can significantly impact investor and trader behavior.
This modeling strategy is particularly persuasive as it addresses the question, “How do chaos and fractals hold the key to market mysteries?” By leveraging fractal analysis, we provide insights that can enhance the understanding of market dynamics, especially in highly volatile conditions like the current Indian markets. In times when market momentum and fund managers’ analysis about continued momentum appear to contradict each other, incorporating fractals into market analysis becomes surprisingly insightful and essential. This approach allows investors and analysts to better navigate the complexities of market trends, whether they are fluctuating or impulsive. The study of impulsive market trends through fractal analysis presents an intriguing area for future research, potentially revealing new patterns and predictive models. Ultimately, this leads to more informed decision-making which also will encourage more trend research while having some sort of fractals as a parameter to judge by.
We propose and evaluate a novel technical indicator, the Moving Hurst (MH), which derives from the fractal analysis of time series data. Our research examines whether MH can outperform traditional indicators like MA, potentially yielding higher profits or mitigating losses more effectively. The goal is to demonstrate the efficacy of MH in pinpointing profitable trading opportunities and to evaluate its utility in enhancing decision-making within volatile markets.
This paper is organized as follows: Section 2 reviews related literature in depth. Section 3 outlines our methodology, beginning with the mathematical underpinnings of the Hurst exponent in Section 3.1, followed by the proposed data inference approach in Section 3.2. Section 4 presents the evaluation metric used to analyze the data in Section 4.1, with Section 4.2 offering real-world test cases from a selection of NIFTY-50 stocks. The data utilized in this study consist of fundamental price information obtained through the ‘yfinance’ API in Python. This API provides a pre-processed dataset that includes daily closing prices for the selected stocks, facilitating ease of implementation. In Section 5, we summarize our conclusions and insights gained from this study. Finally, Section 6 discusses future research directions and the broader implications of our findings.

2. Literature Survey

Forecasting volatility holds significant importance for investors, policymakers, and risk managers as they navigate the dynamic terrain of financial markets, especially within vast economies such as India. Utilizing fractal analysis, with the Hurst exponent serving as a pivotal measure, presents a promising avenue for refining the accuracy of volatility predictions by capturing the inherent patterns and structures within market dynamics. This literature review synthesizes extant research on volatility forecasting the equity markets through fractal analysis, leveraging the Hurst exponent.
The Hurst exponent, an essential metric in fractal analysis, quantifies the long-term memory and persistence exhibited by time series data. In financial contexts, a Hurst exponent surpassing 0.5 signifies the existence of long-range dependence, implying that previous trends are prone to persisting into subsequent periods. This characteristic renders the Hurst exponent a valuable asset for encapsulating the fractal intricacies of market dynamics and enhancing the precision of volatility forecasting methodologies. The research in Fernández-Martínez (2017) indicates that the self-similarity index may function as an indicator of the shift from random efficient market activity to herd behavior. It reveals that as the self-similarity index increases, so does the average price change, suggesting enhanced performance of the associated stock. The use of rescaled range analysis and the Hurst exponent to study long-term memory in financial time series data has been documented in Couillard and Davison (2005). The authors propose a statistical significance test for the Hurst exponent and apply it to real financial data sets, finding no evidence of long-term memory in some financial returns. They suggest that Brownian motion can be a suitable model for price dynamics in certain cases. The research undertaken by Cho and Lee (2022) presents a novel model merging fractal concepts with deep learning techniques to enhance the precision of stock price index forecasts. This study underscores the significance of comprehending multifractality and long-range dependence within time-series data to achieve more accurate predictions in the financial domain. Matthieu Garcin’s article (2017) presents an innovative technique employing variational calculus to smooth raw time series data, enabling the estimation of time-dependent Hurst exponents. This method is specifically employed in forecasting foreign exchange rates, demonstrating encouraging outcomes for Hurst exponents surpassing 0.5, albeit less noteworthy results for values below 0.5. Tzouras et al. (2015) presents a model incorporating the Hurst exponent for modeling financial time series, exhibiting enhanced efficacy in capturing the long-memory characteristics of financial data compared to conventional methods. A rolling window analysis was performed by Vogl (2023) to examine the dynamics of time-varying Hurst exponents. The results demonstrated a complete invalidation of the efficient markets hypothesis (EMH). The study outlined the reasoning behind momentum crashes and the potential for crisis predictions. Additionally, multifractal and power-law analyses were utilized to assess Hurst exponents, alongside the proposal of a nonlinear dynamics analysis framework. The research Horta et al. (2014) investigates the influence of the 2008 and 2010 financial crises on global stock markets by analyzing Hurst exponents. Findings indicate a heightened correlation in memory attributes during crises, with markets transitioning towards long-term memory and persistence during the Subprime crisis, while moving towards efficiency during the European debt crisis. This insight can aid investors in comprehending market dynamics during crises, facilitating more informed decision-making.
Multiple empirical inquiries have delved into forecasting volatility within equity markets employing fractal analysis, centering on the Hurst exponent. These investigations have scrutinized diverse market indices, individual stock performances, and temporal spans to elucidate the nexus between the Hurst exponent and volatility dynamics. The collective findings consistently indicate a positive correlation between elevated Hurst exponent values and heightened persistence in volatility, thereby underscoring the predictive efficacy inherent in fractal analysis methodologies. Bianchi and Pianese (2018) studied the increasing empirical evidence that undermines the belief in stock markets’ efficiency, leading to a rethinking of market dynamics. Two functions are developed to create indicators offering timely market efficiency insights. These tools are applied to analyze four key stock indexes across the world. Grech and Pamuła’s research (2008) delves into the intrinsic fractal characteristics of the Warsaw Stock Exchange Index (WIG) and their correlation with market downturns. Through computation of the local time-dependent Hurst exponent, the authors discern patterns indicative of impending market disruptions or crashes. They define criteria based on the behavior of the local Hurst exponent, serving as indicators for the probability of a market crash. Another application of the Hurst exponent in the fractal analysis in the Russian stock market has been reported in Laktyunkin and Potapov (2020). The research by Eom et al. (2008) empirically examined the link between efficiency and predictability in financial data, utilizing the Hurst exponent for efficiency and hit rate for prediction. Data from 60 global market indexes were analyzed, employing the Hurst exponent to measure efficiency and hit rate for future price change prediction. Selvaratnam and Kirley (2006) introduced an enhanced evolutionary artificial neural networks model using fractal analysis based on Hurst exponent. Australian Stock Exchange data results show that Hurst exponent configured models outperform basic EANN models in trading profit. In the work by Zournatzidou and Floros (2023), the volatility of indices and estimate of the Hurst parameter using data from five international markets: VIX (CBOE), VXN (CBOE Nasdaq 100), VXD (DJIA), VHSI (HSI), and KSVKOSPI (KOSPI) has been explored. The analysis period is from January 2001 to December 2021 and incorporates various market phases, such as booms and crashes. The studies Bal et al. (2021); Barunik and Kristoufek (2010); Bui and Ślepaczuk (2022); Gursakal et al. (2009); Qadan and Shuval (2022); Qadan et al. (2024); Gomez-Aguila et al. (2022); Yim et al. (2014) elucidate the use of Hurst exponent in the context of stock market analysis.
Various methodological strategies for estimating the Hurst exponent exhibit diversity, encompassing prevalent techniques such as R/S analysis, detrended fluctuation analysis (DFA), and wavelet-based methods. Researchers utilize these methodologies to gauge the fractal attributes present within market data and evaluate their repercussions on volatility forecasting. The selection of a specific approach hinges upon factors such as the inherent characteristics of the data, the objectives of the research, and computational constraints. The study by Domino (2011) examines the local properties of share price evolution for 126 significant companies traded on the Warsaw Stock Exchange from 1991 to 2008, focusing on daily financial returns. The analysis employs local Detrended Fluctuation Analysis (DFA) to derive the Hurst exponent (diffusion coefficient) and identify negative correlations indicative of changes in long-term trends. The study reveals insights into the local properties of share price evolution, suggesting the potential effectiveness of employing local DFA and the Hurst exponent in investment strategies. The exploration Fernández-Martínez et al. (2014) delves into methodologies employed in empirical finance to evaluate market efficiency, highlighting the significance of precise estimation of the Hurst exponent in comprehending financial markets and stock returns. The article by Qian and Rasheed (2004) examines how the Hurst exponent serves as a statistical measure for categorizing time series data. It distinguishes between random series ( H = 0.5 ) and reinforcing trends ( H > 0.5 ). Experiments using backpropagation Neural Networks demonstrate that series with higher Hurst exponents offer more accurate predictions, highlighting the Hurst exponent’s role as a predictor in financial time series analysis. The article Sánchez-Granero et al. (2012) introduces three new algorithms based on fractal dimension to estimate the Hurst exponent of financial time series. These algorithms are tested for accuracy using Monte Carlo simulations, showing superior performance compared to classical methods, especially for short series. The changing efficiency of 15 Middle East and North African (MENA) stock markets using a rolling window technique and generalized Hurst exponent analysis of daily data over six years, from January 2007 to December 2012 are studied in Sensoy (2013). Results show varying levels of long-range dependence over time, with the Arab Spring negatively impacting market efficiency. The Efficient Market Hypothesis Fama (1970) stated that markets are efficient in the sense that the current stock prices reflect completely all currently known information that could anticipate the future market, i.e., there is no information hidden that could be used to predict future market development. There came an Inefficient Market Hypothesis Shleifer (2000) stating that some anomalies in market development have been found that cannot be explained as being caused by efficient markets. Reported by Peters (1994) supporting the previous argument which had not been published then, represented a new framework for modeling the conflicting randomness and deterministic characteristic of capital markets. We move forward with this statement and try to concertize it throughout the length of our research.
In summary, the Hurst exponent proves to be a valuable asset for forecasting volatility within the stock markets across the world through fractal analysis. By encapsulating the enduring memory and persistence of market dynamics, the Hurst exponent provides insights that can guide investment decisions, inform risk management strategies, and shape policy interventions. Future research endeavors could delve into advanced methodologies for estimating the Hurst exponent, scrutinize the influence of exogenous factors on volatility dynamics, and craft resilient forecasting models by integrating fractal analysis techniques.
The novelty of the present work lies in the fact that our work implements the fractal analysis to the Indian Stock market but to other stock markets across the globe. Also, the proposition of the superiority of the MH indicator over the MA indicator is a unique attribute of our work. Our work also contains the validation of our obtained results using hypothesis testing and concludes the higher profits in MH set-up compared to MA set-up.

3. Method

3.1. Hurst Exponent

Hurst exponent Hurst (1951) is the measure that estimates the chaotic nature of time series. It uses the rescaled range analysis (R/S analysis) which involves calculating the range of partial sums of deviations of segments within a time series from their respective means. These ranges are then normalized by dividing them by the standard deviations of their corresponding segments Peters (1994). The working mechanism for this process is displayed in Figure 1.
Let the time series be of length N, which is subdivided into 2 k equal subintervals so that the total length can be represented as N = n 2 k , where n is the number of sub-time periods. The following algorithm demonstrates the working mechanism of rescaled range analysis to achieve the Hurst exponent for a given time series.
  • Step 1: Find the mean x mean over all the sub-periods.
  • Step 2: Construct a new series, Z r = x r x mean , for r = 1 to n .
  • Step 3: Construct another series Y m of cumulative deviations from step 2.
  • Step 4: Calculate R n = max { Y i } min { Y i } , for all i = 1 to n .
  • Step 5: Calculate standard deviation σ = ( x x mean ) 2 n = Z r 2 n of the original elements of each sub-period.
  • Step 6: Calculate the rescaled range R n S n for all subperiods of fixed length n.
  • Step 7: Repeat steps 1 to 6 iteratively for each length of sub-period.
Evaluating the following expectation to estimate the Hurst exponent
E R n S n = C n H as n
where C is the asymptotic constant, n is the considered time span and H is the Hurst exponent.
Geometrically, the slope of the plot of log R n S n versus log ( n ) for each range, gives the Hurst exponent.

3.2. Proposed Scheme

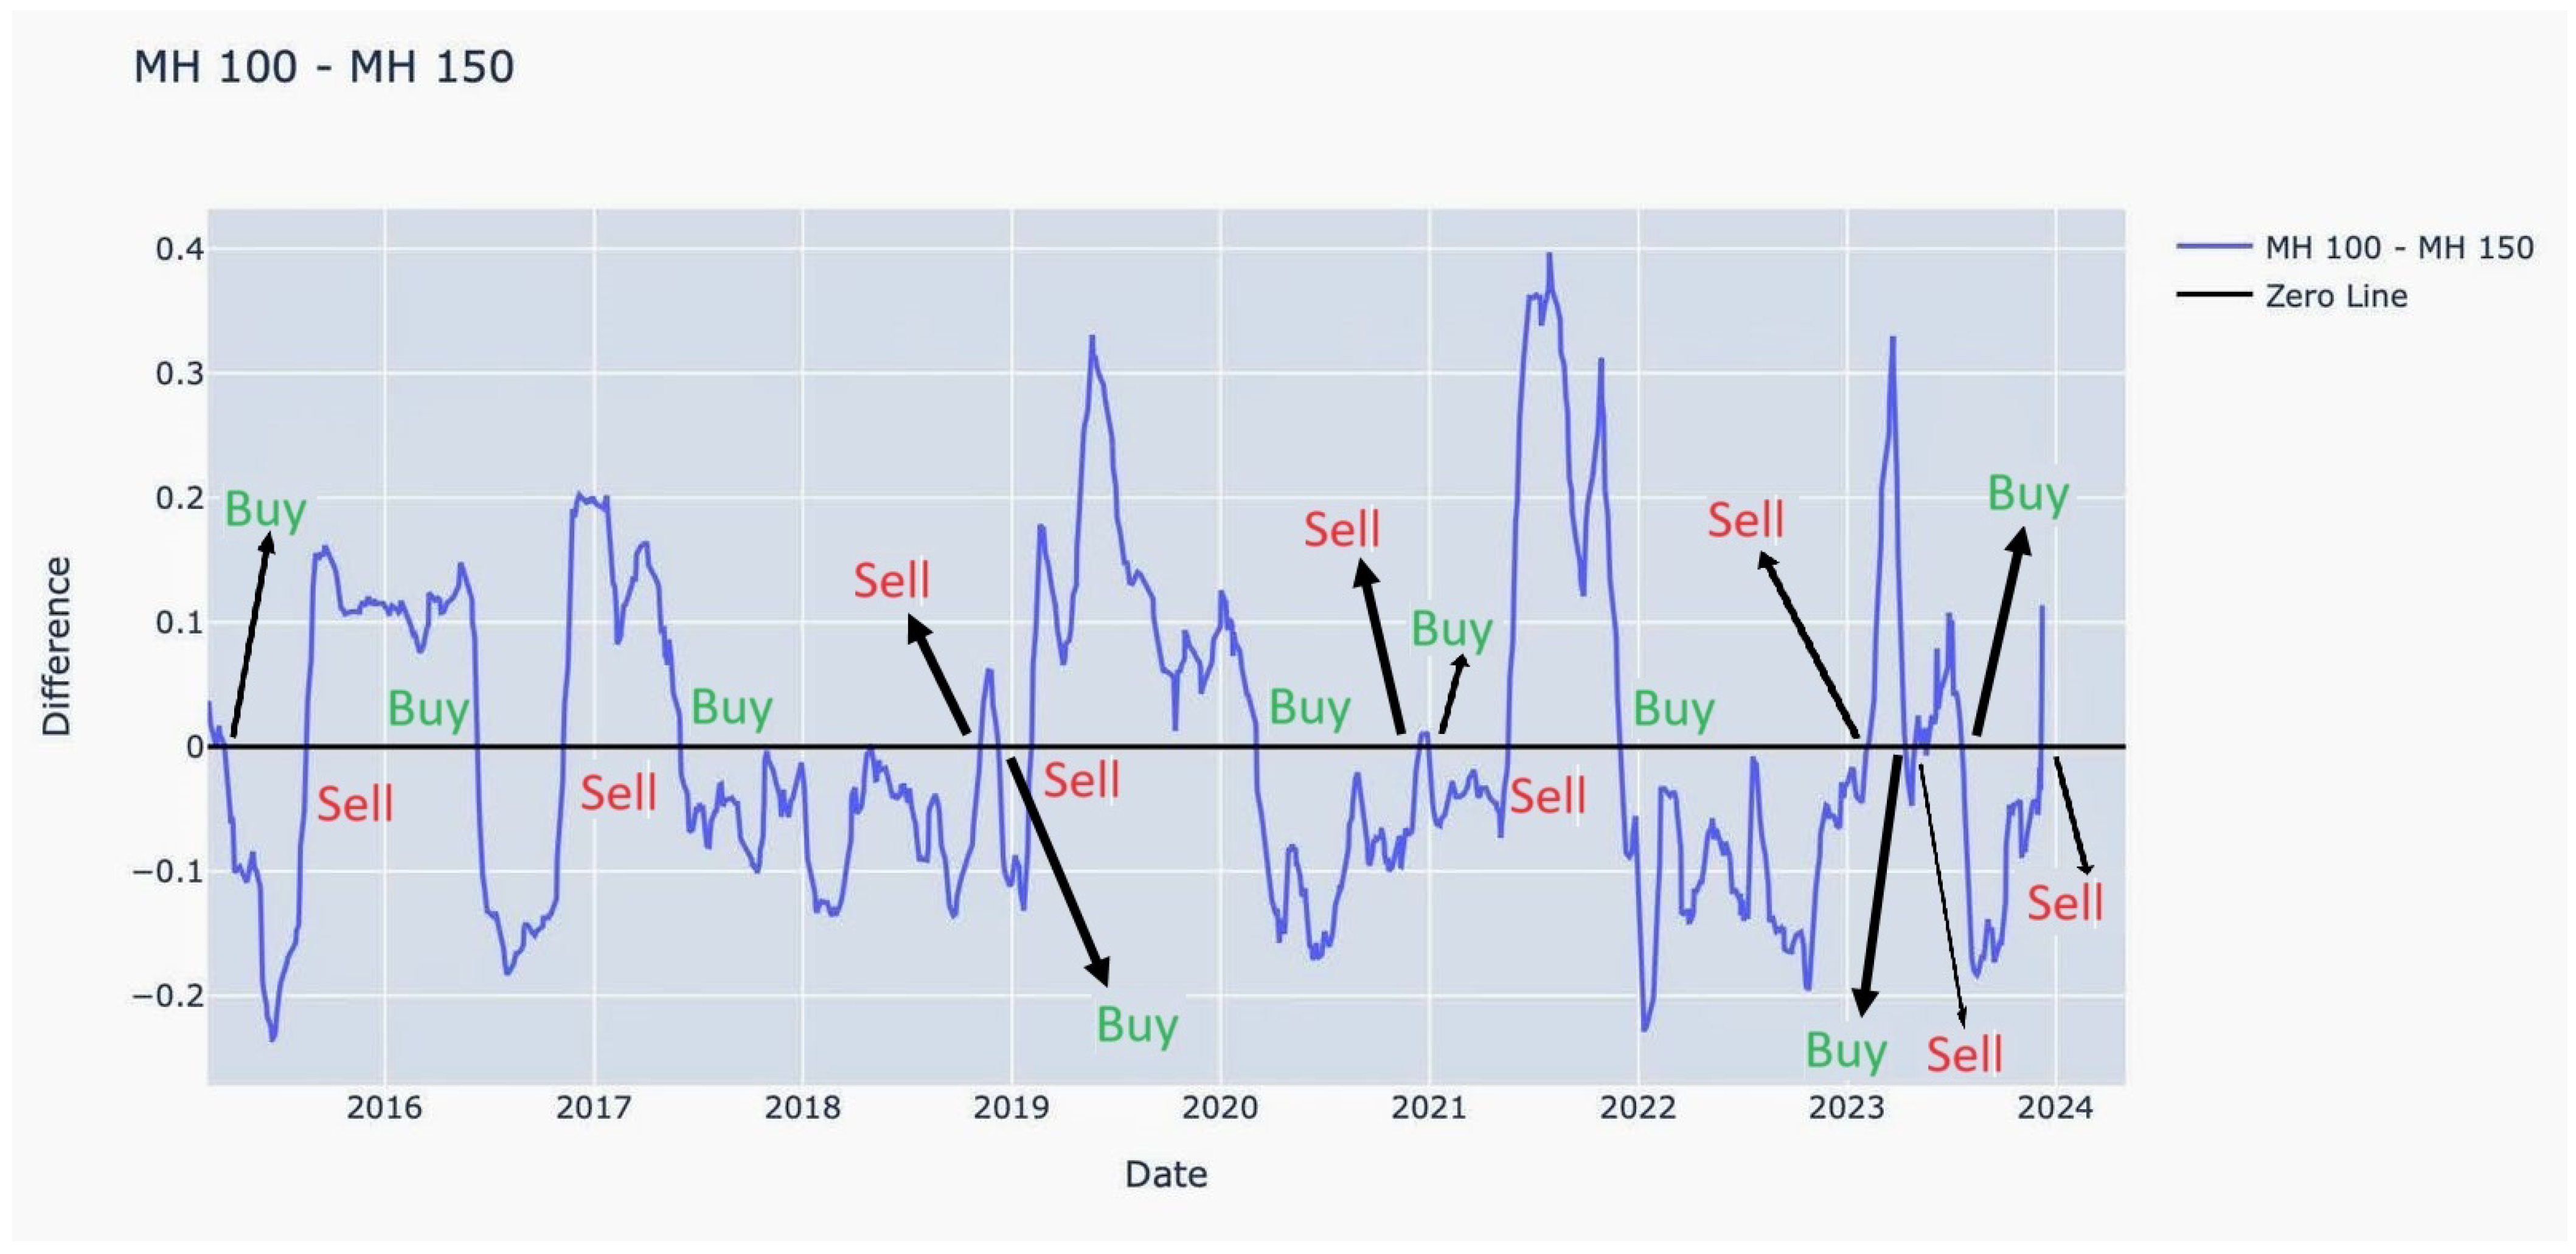
Our proposed method of performing strategies is rather straightforward. The idea of our non-linear method is similar to the mechanism of MA. However, instead of moving averages computed from daily values of time series in a given box size, we used moving Hurst exponents computed from the fractal dimension of daily returns in a given box size, similar to what was implemented in Kroha and Skoula (2018). We implement 2 windows of 100 days and 150 days, so as to observe their MH crossings at the zero line, such that
  • If ( H 100 H 150 ) n > 0 and ( H 100 H 150 ) n + 1 < 0 , then the signal is BUY.
  • If ( H 100 H 150 ) n < 0 and ( H 100 H 150 ) n + 1 > 0 , then the signal is SELL.
When H 100 crosses downward through H 150 , it indicates a potential buying opportunity, suggesting reduced chaos. Conversely, when H 100 crosses upward through H 150 , it may signal a selling opportunity, indicating increased chaos (see Figure 2). Further, we implement a basic MA strategy with the same window sizes, i.e., 100 and 150. Then, we compare returns evaluated based on the metric that is defined in Section 4.1. Our intention is to comparatively perform better in MH returns than MA returns, proving to be a replacement in certain ensemble strategies where MA is being used traditionally.

4. Results, Implementation and Validation

4.1. Evaluation Metric

The evaluation metric allows traders to quickly compare trading strategies among themselves or with some benchmark strategy. There are so many performance metrics that can be applied in practice. These performance metrics are typically based on different mathematical aspects of a trading system’s performance. In the experimental study conducted here, a simple evaluation metric is used to compare the performance of the conventional Moving Average (MA) strategy with the proposed Moving Hurst (MH) strategy.
  • Consider a unit quantity of security under consideration for every buy or sell trade signal. The time duration for evaluation is one year. The number of buy and sell signals generated by strategies may differ in numbers.
  • Separate queues for buy and sell trade signals.
  • Starting with the first buy/sell signal find the complementary (sell/buy) signal and count the corresponding profit or loss.
  • Keep finding pairs of complementary trades until the end of buy or sell trade signal queues.
  • If there are any buy or sell trade signals that will not find their complementary trade signals after exhausting queues they are to be discarded in evaluation. In real practice, they can be carried forward to the next evaluation period using the sliding window method.
This is illustrated through the following Table 1 for five months.

4.2. Approach and Testing

4.2.1. Strategy Implementation

The strategy was applied to 50 stocks from the NIFTY-50 index on the National Stock Exchange of India (NSEI). In most cases, its performance aligned with expectations when compared to the traditional Moving Average (MA). The strategy was developed and implemented using Python. Although both the Moving Hurst (MH) and MA indicators can become unreliable during periods of sudden and extreme market fluctuations, the MH indicator appears to offer better containment of volatility. This potentially leads to reduced losses or increased profits when market conditions are erratic. To assess the strategy, 10 years of historical price data were analyzed. The results were examined across three selected stocks, which are described below.

4.2.2. Results

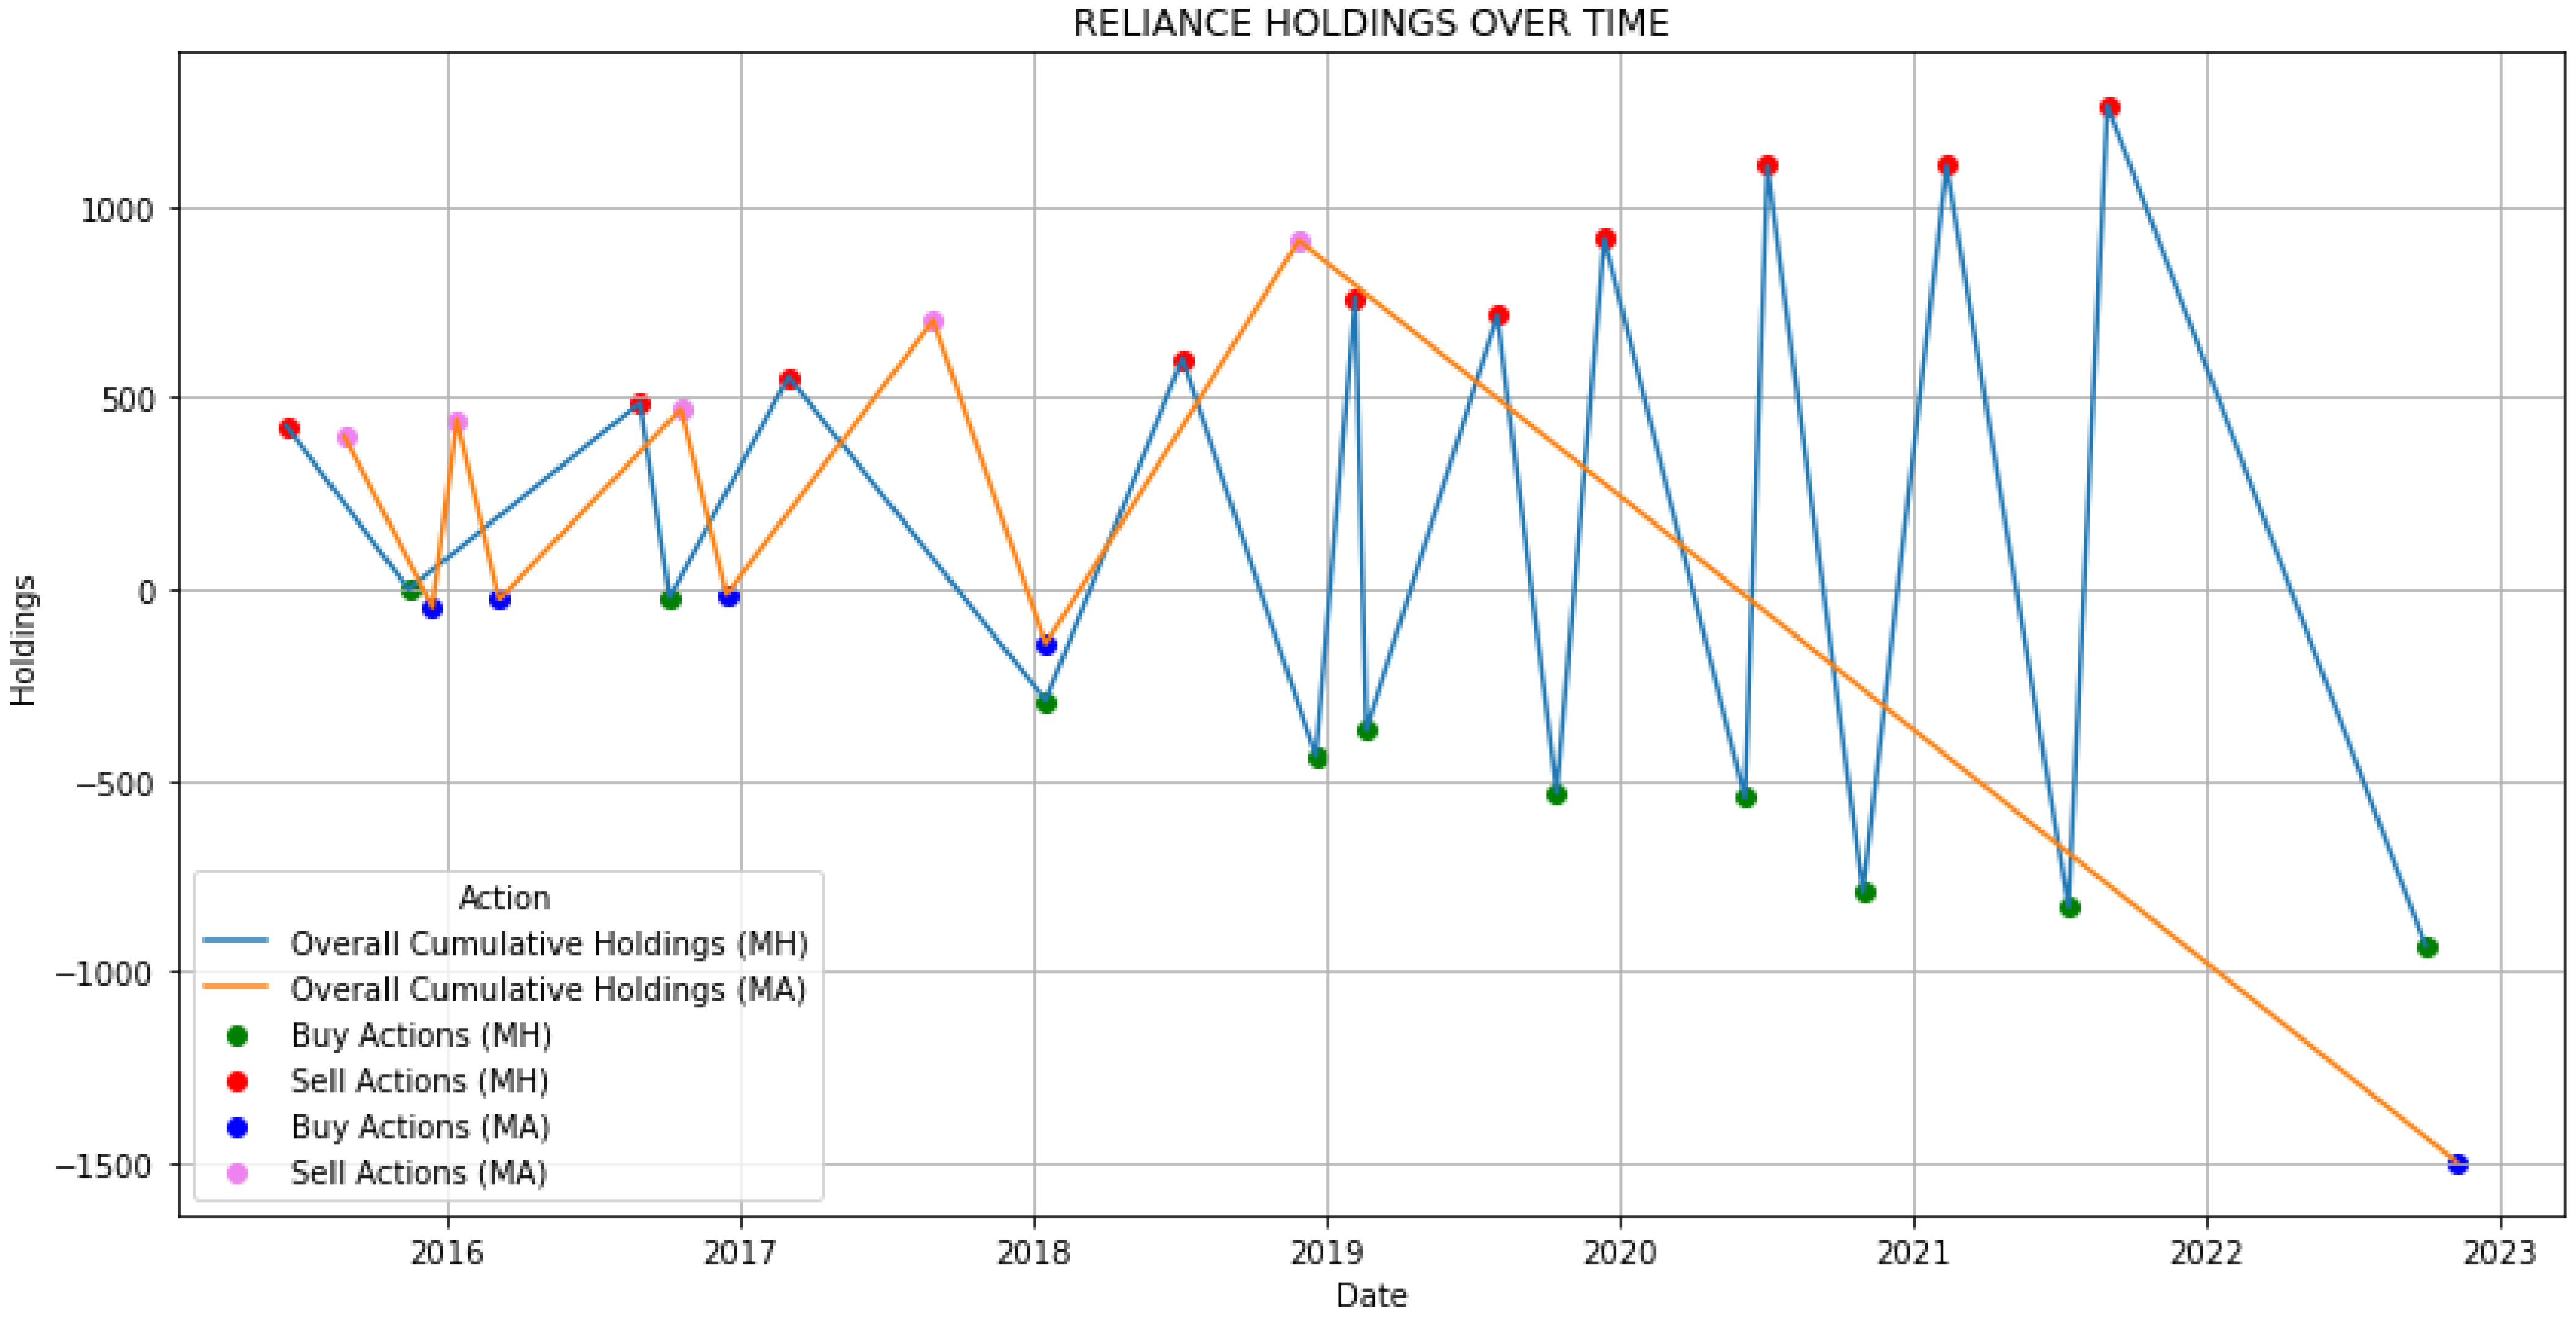
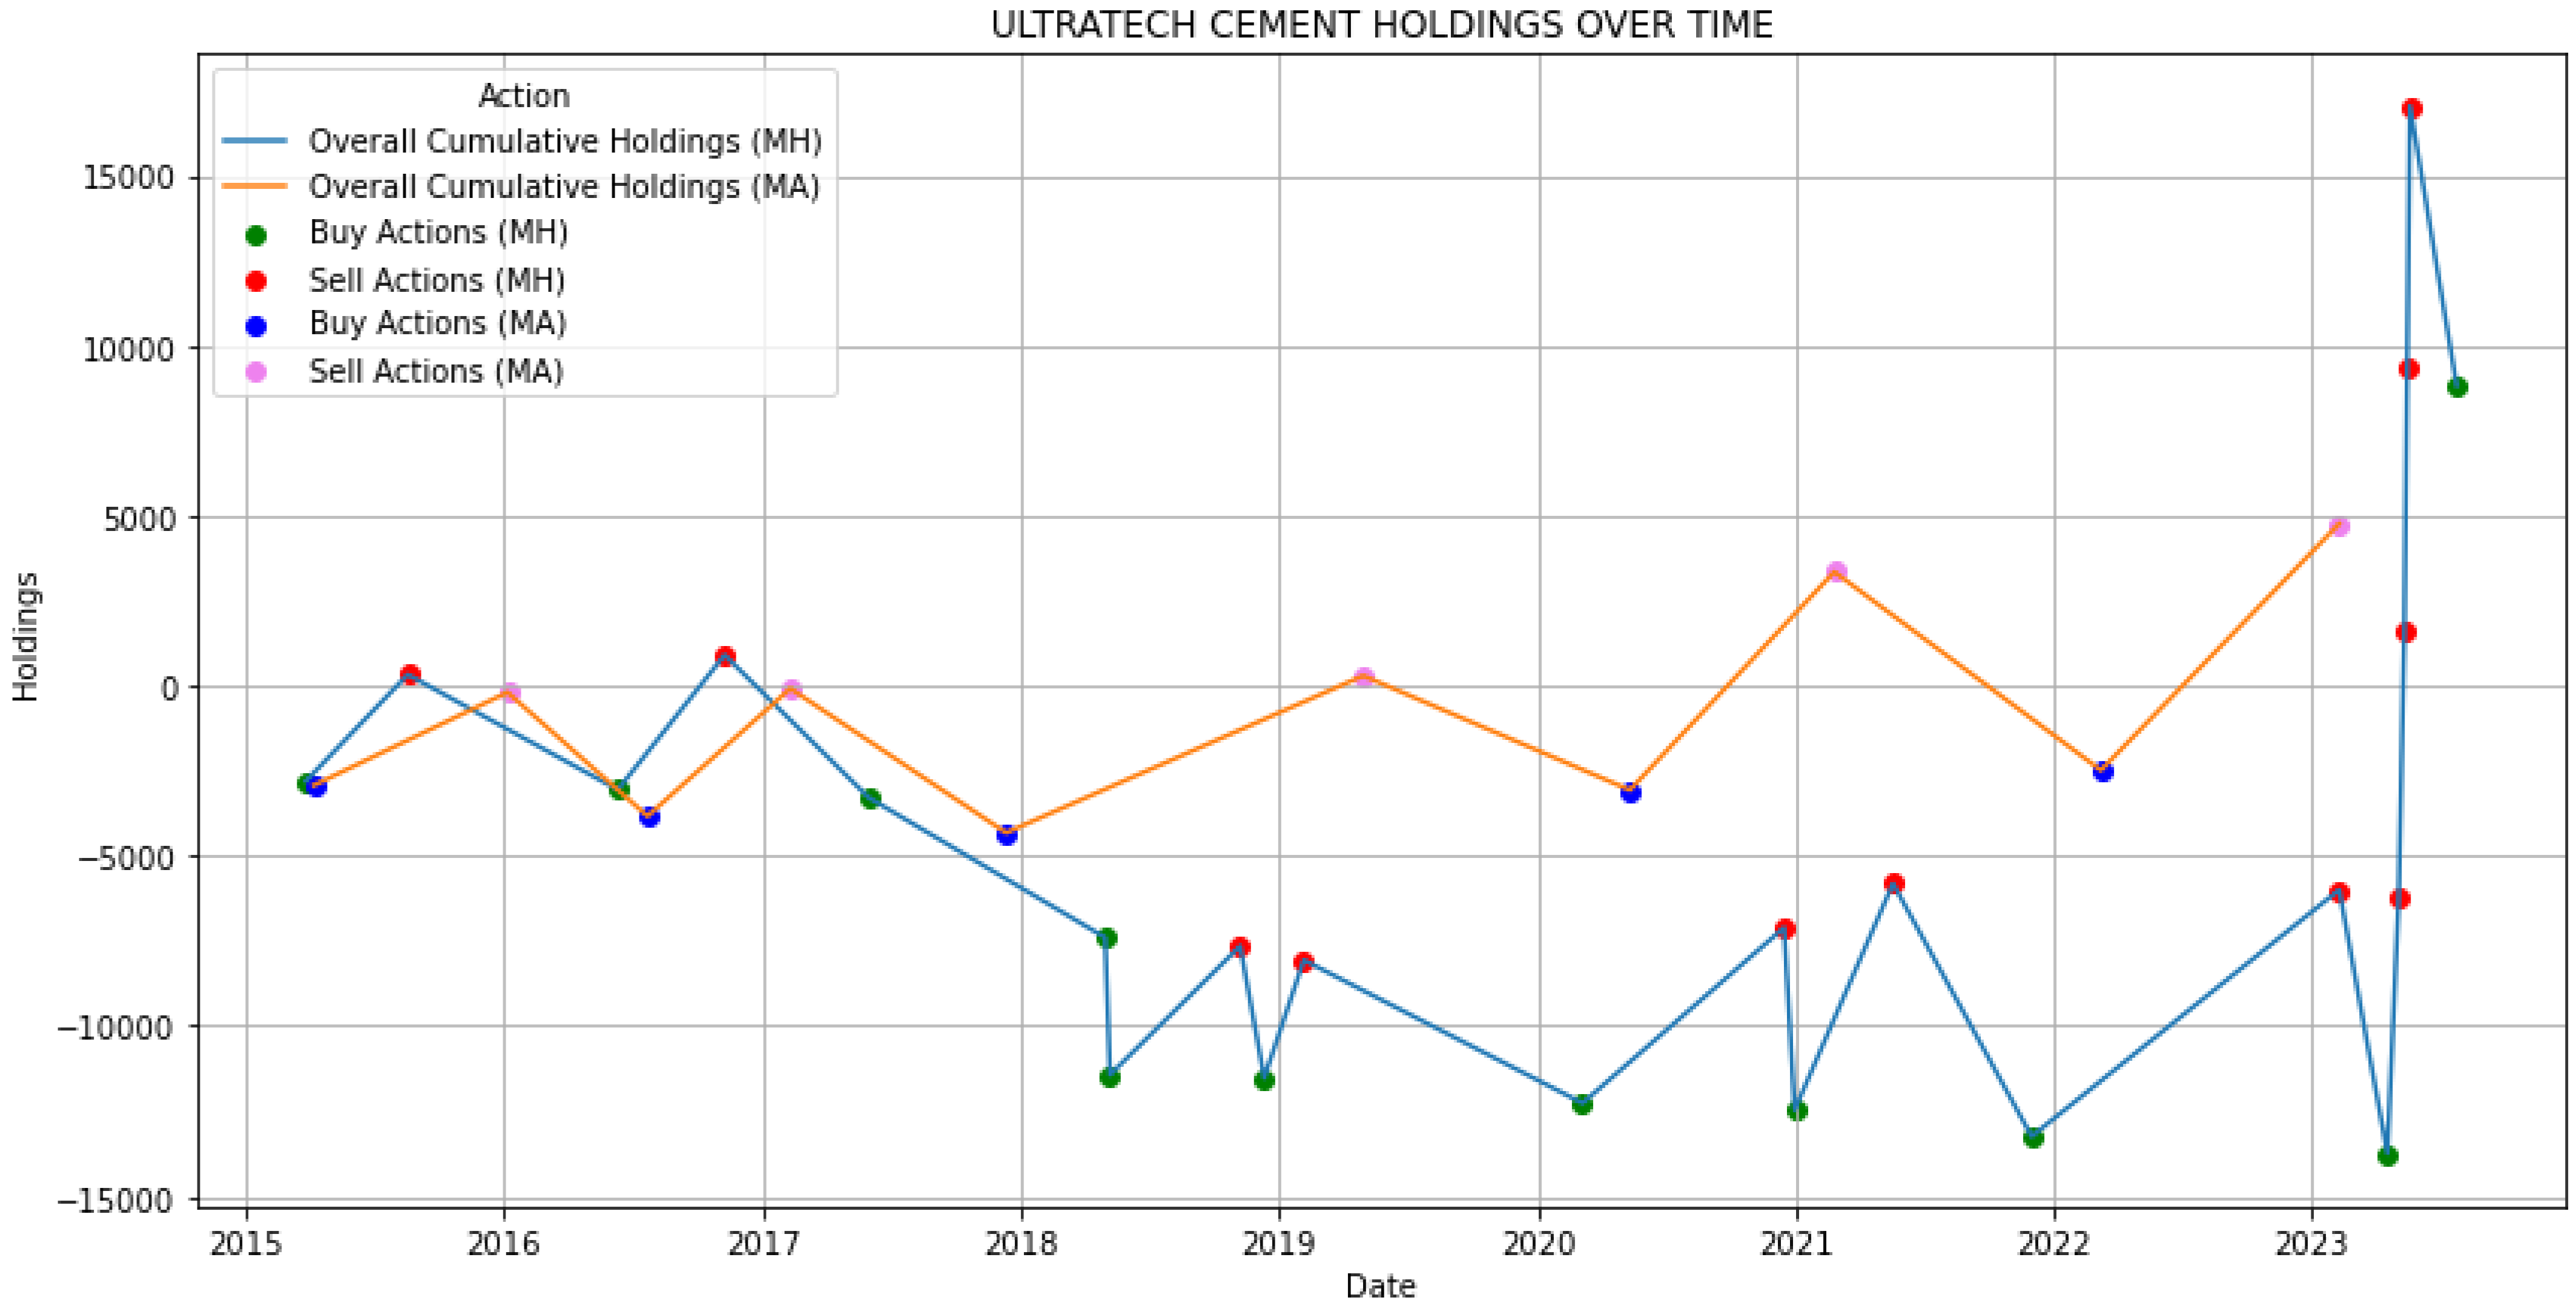
We compared the outcomes of the Moving Hurst (MH) strategy against the MA strategy for three selected stocks: Cipla Pharmaceutical Yahoo Finance (2024a) (see Table 2 and Figure 3), Reliance Industries Yahoo Finance (2024b) (see Table 3 and Figure 4), and UltraTech Cement Yahoo Finance (2024c) (see Table 4 and Figure 5).
Objective: Maximizing profit
Table 2. Number of generated signals for Cipla Yahoo Finance (2024a): MH vs. MA.
StrategyBuy SignalsSell SignalsNet Result (units)
MH1614+296
MA54+25
Objective: Minimizing loss
Table 3. Number of generated signals for Reliance Industries Yahoo Finance (2024b): MH vs. MA.
StrategyBuy SignalsSell SignalsNet Result (units)
MH1013−929
MA56−1498
Objective: Maximizing profit
Table 4. Numberof generated signals for Ultratech Cement Yahoo Finance (2024c): MH vs. MA.
StrategyBuy SignalsSell SignalsNet Result (units)
MH1113+8824
MA65+4763
Figure 3. Plot of Cipla’s holdings over time.
Jrfm 17 00390 g003
Figure 4. Plot of Reliance’s holdings over time.
Jrfm 17 00390 g004
NOTE: The graphs 3, 4 and 5 focus solely on the signals described in Section 4.1 and their performance as measured by the selected metric.
Figure 5. Plot of Ultratech Cement’s holdings over time.
Jrfm 17 00390 g005

4.3. Validation via Hypothesis Testing

Given the fluctuating differences in profits between using moving Hurst (MH) and moving average (MA), we applied paired t-test statistics to test our hypothesis that MH produces higher profits than MA. This analysis utilized the time series of profits generated by MH and the corresponding time series of profits generated by MA across all the stocks examined in this study.
We propose the following hypotheses:
  • H 0 (Null hypothesis): μ M H = μ M A ,
  • H 1 (Alternate hypothesis): μ M H > μ M A ,
where μ M H and μ M A are means of moving Hurst and moving averages, respectively.
The hypothesis testing has been achieved using Matlab software and the results are displayed through Table 5. The inbuilt function “ttest” has been used for the implementation of a paired t-test.
In all three stocks under consideration, we conducted a paired t-test to evaluate the performance difference between the Moving Hurst (MH) and Moving Average (MA) indicators. The null hypothesis ( H 0 ) assumed no significant difference in the mean returns generated by MH and MA, while the alternate hypothesis ( H 1 ) asserted that MH yields higher returns. The calculated t-statistics for each stock showed that the p-values were consistently below the 0.05 threshold, leading to the rejection of ( H 0 ) at the 5% significance level. This statistical evidence supports the superiority of MH over MA with a 95% confidence interval.
For investors in the Indian financial markets, these test results imply that the MH indicator is statistically more effective at generating profitable trading signals than the traditional MA. The rejection of the null hypothesis suggests that investors using MH are likely to achieve better returns, particularly in environments characterized by significant volatility, thus offering a more reliable tool for market analysis and decision-making.

5. Conclusions

The results of our study suggest that the Moving Hurst (MH) indicator offers a valuable approach to forecasting and managing volatility in Indian equity markets. Our analysis shows that MH provides a more effective means of capturing profitable trading opportunities compared to traditional indicators like Moving Averages (MA). It also shows how MH is a less lagging indicator than MA. For not consecutive buy/sell signals, an argument is made that for a current buy/sell, there might be a sell/buy indicator in the past or the future which was not included in the moving window frame. By incorporating the principles of chaos theory and fractal analysis, this new indicator presents a unique perspective for market analysis. Our analysis shows that MH provides a more effective means of capturing profitable trading opportunities compared to traditional indicators like Moving Averages(MA). By incorporating the principles of chaos theory and fractal analysis, this new indicator presents a unique perspective for market analysis.

6. Future Work

Exploring composite models that combine the MH indicator with other technical indicators or even replace some like MA could yield more robust and nuanced market insights. This approach could pave the way for improved volatility forecasting and trend identification strategies, catering to different trading styles and risk profiles. Future work should also consider investigating the impact of various external factors—such as macroeconomic trends, policy changes, and geopolitical events—on the performance of the MH indicator. Furthermore, exploring the optimal threshold of market variance for this strategy presents an exciting opportunity for future research. By studying this aspect, we can enhance our understanding of the strategy’s effectiveness across different market conditions. This analysis could reveal valuable insights into the strategy’s performance and reliability, potentially uncovering new ways to optimize it for various levels of market volatility.

Author Contributions

Conceptualization, P.S. and A.R.; methodology, P.S., A.R. and J.S.; software, P.S.; validation, P.S. and J.S.; formal analysis, A.R. and J.S.; investigation, P.S., A.R. and J.S.; resources, A.R. and J.S.; data curation, P.S., A.R. and J.S.; writing—original draft preparation, P.S. and A.R.; writing—review and editing, P.S., A.R. and J.S.; visualization, P.S., A.R. and J.S.; supervision, A.R. and J.S.; project administration, A.R. All authors have read and agreed to the published version of the manuscript.

Funding

This research received no external funding.

Data Availability Statement

No new data were created or analyzed in this study. Data sharing is not applicable to this article.

Conflicts of Interest

The authors declare no conflicts of interest.

References

  1. Bal, Anirban, Debayan Ganguly, and Kingshuk Chatterjee. 2021. Stationarity and self-similarity determination of time series data using hurst exponent and r/s ration analysis. In Emerging Technologies in Data Mining and Information Security: Proceedings of IEMIS 2020. New York: Springer, vol. 2, pp. 601–612. [Google Scholar]
  2. Barunik, Jozef, and Ladislav Kristoufek. 2010. On hurst exponent estimation under heavy-tailed distributions. Physica A: Statistical Mechanics and Its Applications 389: 3844–55. [Google Scholar] [CrossRef]
  3. Bianchi, Sergio, and Augusto Pianese. 2018. Time-varying hurst–hölder exponents and the dynamics of (in) efficiency in stock markets. Chaos Solitons & Fractals 109: 64–75. [Google Scholar]
  4. Bui, Quynh, and Robert Ślepaczuk. 2022. Applying hurst exponent in pair trading strategies on nasdaq 100 index. Physica A: Statistical Mechanics and Its Applications 592: 126784. [Google Scholar] [CrossRef]
  5. Cho, Poongjin, and Minhyuk Lee. 2022. Forecasting the volatility of the stock index with deep learning using asymmetric hurst exponents. Fractal and Fractional 6: 394. [Google Scholar] [CrossRef]
  6. Couillard, Michel, and Matt Davison. 2005. A comment on measuring the hurst exponent of financial time series. Physica A: Statistical Mechanics and Its Applications 348: 404–18. [Google Scholar] [CrossRef]
  7. Domino, Krzysztof. 2011. The use of the hurst exponent to predict changes in trends on the warsaw stock exchange. Physica A: Statistical Mechanics and Its Applications 390: 98–109. [Google Scholar] [CrossRef]
  8. Eom, Cheoljun, Sunghoon Choi, Gabjin Oh, and Woo-Sung Jung. 2008. Hurst exponent and prediction based on weak-form efficient market hypothesis of stock markets. Physica A: Statistical Mechanics and its Applications 387: 4630–36. [Google Scholar] [CrossRef]
  9. Fama, Eugene F. 1970. Efficient capital markets: A review of theory and empirical work. The Journal of Finance 25: 383–417. [Google Scholar] [CrossRef]
  10. Fernández-Martínez, Sánchez-Granero, Muñoz Torrecillas, and Bill McKelvey. 2017. A comparison of three hurst exponent approaches to predict nascent bubbles in s&p500 stocks. Fractals 25: 1750006. [Google Scholar]
  11. Fernández-Martínez, Sánchez-Granero, Trinidad Segovia, and Román-Sánchez. 2014. An accurate algorithm to calculate the Hurst exponent of self-similar processes. Physics Letters A 378: 2355–62. [Google Scholar] [CrossRef]
  12. Garcin, Matthieu. 2017. Estimation of time-dependent hurst exponents with variational smoothing and application to forecasting foreign exchange rates. Physica A: Statistical Mechanics and Its Applications 483: 462–79. [Google Scholar] [CrossRef]
  13. Gomez-Aguila, A., J. E. Trinidad-Segovia, and M. A. Sanchez-Granero. 2022. Improvement in Hurst exponent estimation and its application to financial markets. Financial Innovation 8: 86. [Google Scholar] [CrossRef]
  14. Grech, Dariusz, and Grzegorz Pamuła. 2008. The local hurst exponent of the financial time series in the vicinity of crashes on the polish stock exchange market. Physica A: Statistical Mechanics and Its Applications 387: 4299–308. [Google Scholar] [CrossRef]
  15. Gursakal, Necmi, Zehra Berna Aydin, Sevda Gursakal, and Selim Tuzunturk. 2009. Hurst exponent analysis in Turkish stock market. International Journal of Sustainable Economy 1: 255–69. [Google Scholar] [CrossRef]
  16. Horta, Paulo, Sérgio Lagoa, and Luis Martins. 2014. The impact of the 2008 and 2010 financial crises on the hurst exponents of international stock markets: Implications for efficiency and contagion. International Review of Financial Analysis 35: 140–53. [Google Scholar] [CrossRef]
  17. Hurst, Harold Edwin. 1951. Long-term storage capacity of reservoirs. Transactions of the American Society of Civil Engineers 116: 770–99. [Google Scholar] [CrossRef]
  18. Kroha, Petr, and Miroslav Skoula. 2018. Hurst exponent and trading signals derived from market time series. Paper presented at the 20th International Conference on Enterprise Information Systems (ICEIS 2018), Funchal, Madeira, Portugal, March 21–24. [Google Scholar]
  19. Laktyunkin, Alexander, and Alexander A. Potapov. 2020. The hurst exponent application in the fractal analysis of the Russian stock market. In Advances in Artificial Systems for Medicine and Education II 2. New York: Springer, pp. 459–71. [Google Scholar]
  20. Peters, Edgar E. 1994. Fractal Market Analysis: Applying Chaos Theory to Investment and Economics. New York: John Wiley & Sons. [Google Scholar]
  21. Qadan, Mahmoud, and Kerem Shuval. 2022. Variance risk and the idiosyncratic volatility puzzle. Finance Research Letters 45: 102176. [Google Scholar] [CrossRef]
  22. Qadan, Mahmoud, Or David, Iyad Snunu, and Kerem Shuval. 2024. The vix’s term structure of individual active stocks. Finance Research Letters 61: 105036. [Google Scholar] [CrossRef]
  23. Qian, Bo, and Khaled Rasheed. 2004. Hurst exponent and financial market predictability. In IASTED Conference on Financial Engineering and Applications. Cambridge: IASTED International Conference, pp. 203–209. [Google Scholar]
  24. Sánchez-Granero, M. J., M. Fernández-Martínez, and J. E. Trinidad-Segovia. 2012. Introducing fractal dimension algorithms to calculate the Hurst exponent of financial time series. The European Physical Journal B 85: 86. [Google Scholar] [CrossRef]
  25. Selvaratnam, Somesh, and Michael Kirley. 2006. Predicting stock market time series using evolutionary artificial neural networks with hurst exponent input windows. In Australasian Joint Conference on Artificial Intelligence. New York: Springer, pp. 617–26. [Google Scholar]
  26. Sensoy, Ahmet. 2013. Generalized hurst exponent approach to efficiency in mena markets. Physica A: Statistical Mechanics and Its Applications 392: 5019–26. [Google Scholar] [CrossRef]
  27. Shleifer, Andrei. 2000. Inefficient Markets: An Introduction to behavioral Finance. Oxford: Oxford University Press UK. [Google Scholar]
  28. Tzouras, Spilios, Christoforos Anagnostopoulos, and Emma McCoy. 2015. Financial time series modeling using the hurst exponent. Physica A: Statistical Mechanics and Its Applications 425: 50–68. [Google Scholar] [CrossRef]
  29. Vogl, Markus. 2023. Hurst exponent dynamics of s&p 500 returns: Implications for market efficiency, long memory, multifractality and financial crises predictability by application of a nonlinear dynamics analysis framework. Chaos, Solitons & Fractals 166: 112884. [Google Scholar]
  30. Yahoo Finance. 2024a. Historical Prices for Cipla Pharmaceutical. New York: Yahoo Finance. [Google Scholar]
  31. Yahoo Finance. 2024b. Historical Prices for Reliance Industries. New York: Yahoo Finance. [Google Scholar]
  32. Yahoo Finance. 2024c. Historical Prices for Ultratech Cement. New York: Yahoo Finance. [Google Scholar]
  33. Yim, Kyubin, Gabjin Oh, and Seunghwan Kim. 2014. An analysis of the financial crisis in the kospi market using hurst exponents. Physica A: Statistical Mechanics and Its Applications 410: 327–34. [Google Scholar] [CrossRef]
  34. Zournatzidou, Georgia, and Christos Floros. 2023. Hurst exponent analysis: Evidence from volatility indices and the volatility of volatility indices. Journal of Risk and Financial Management 16: 272. [Google Scholar] [CrossRef]
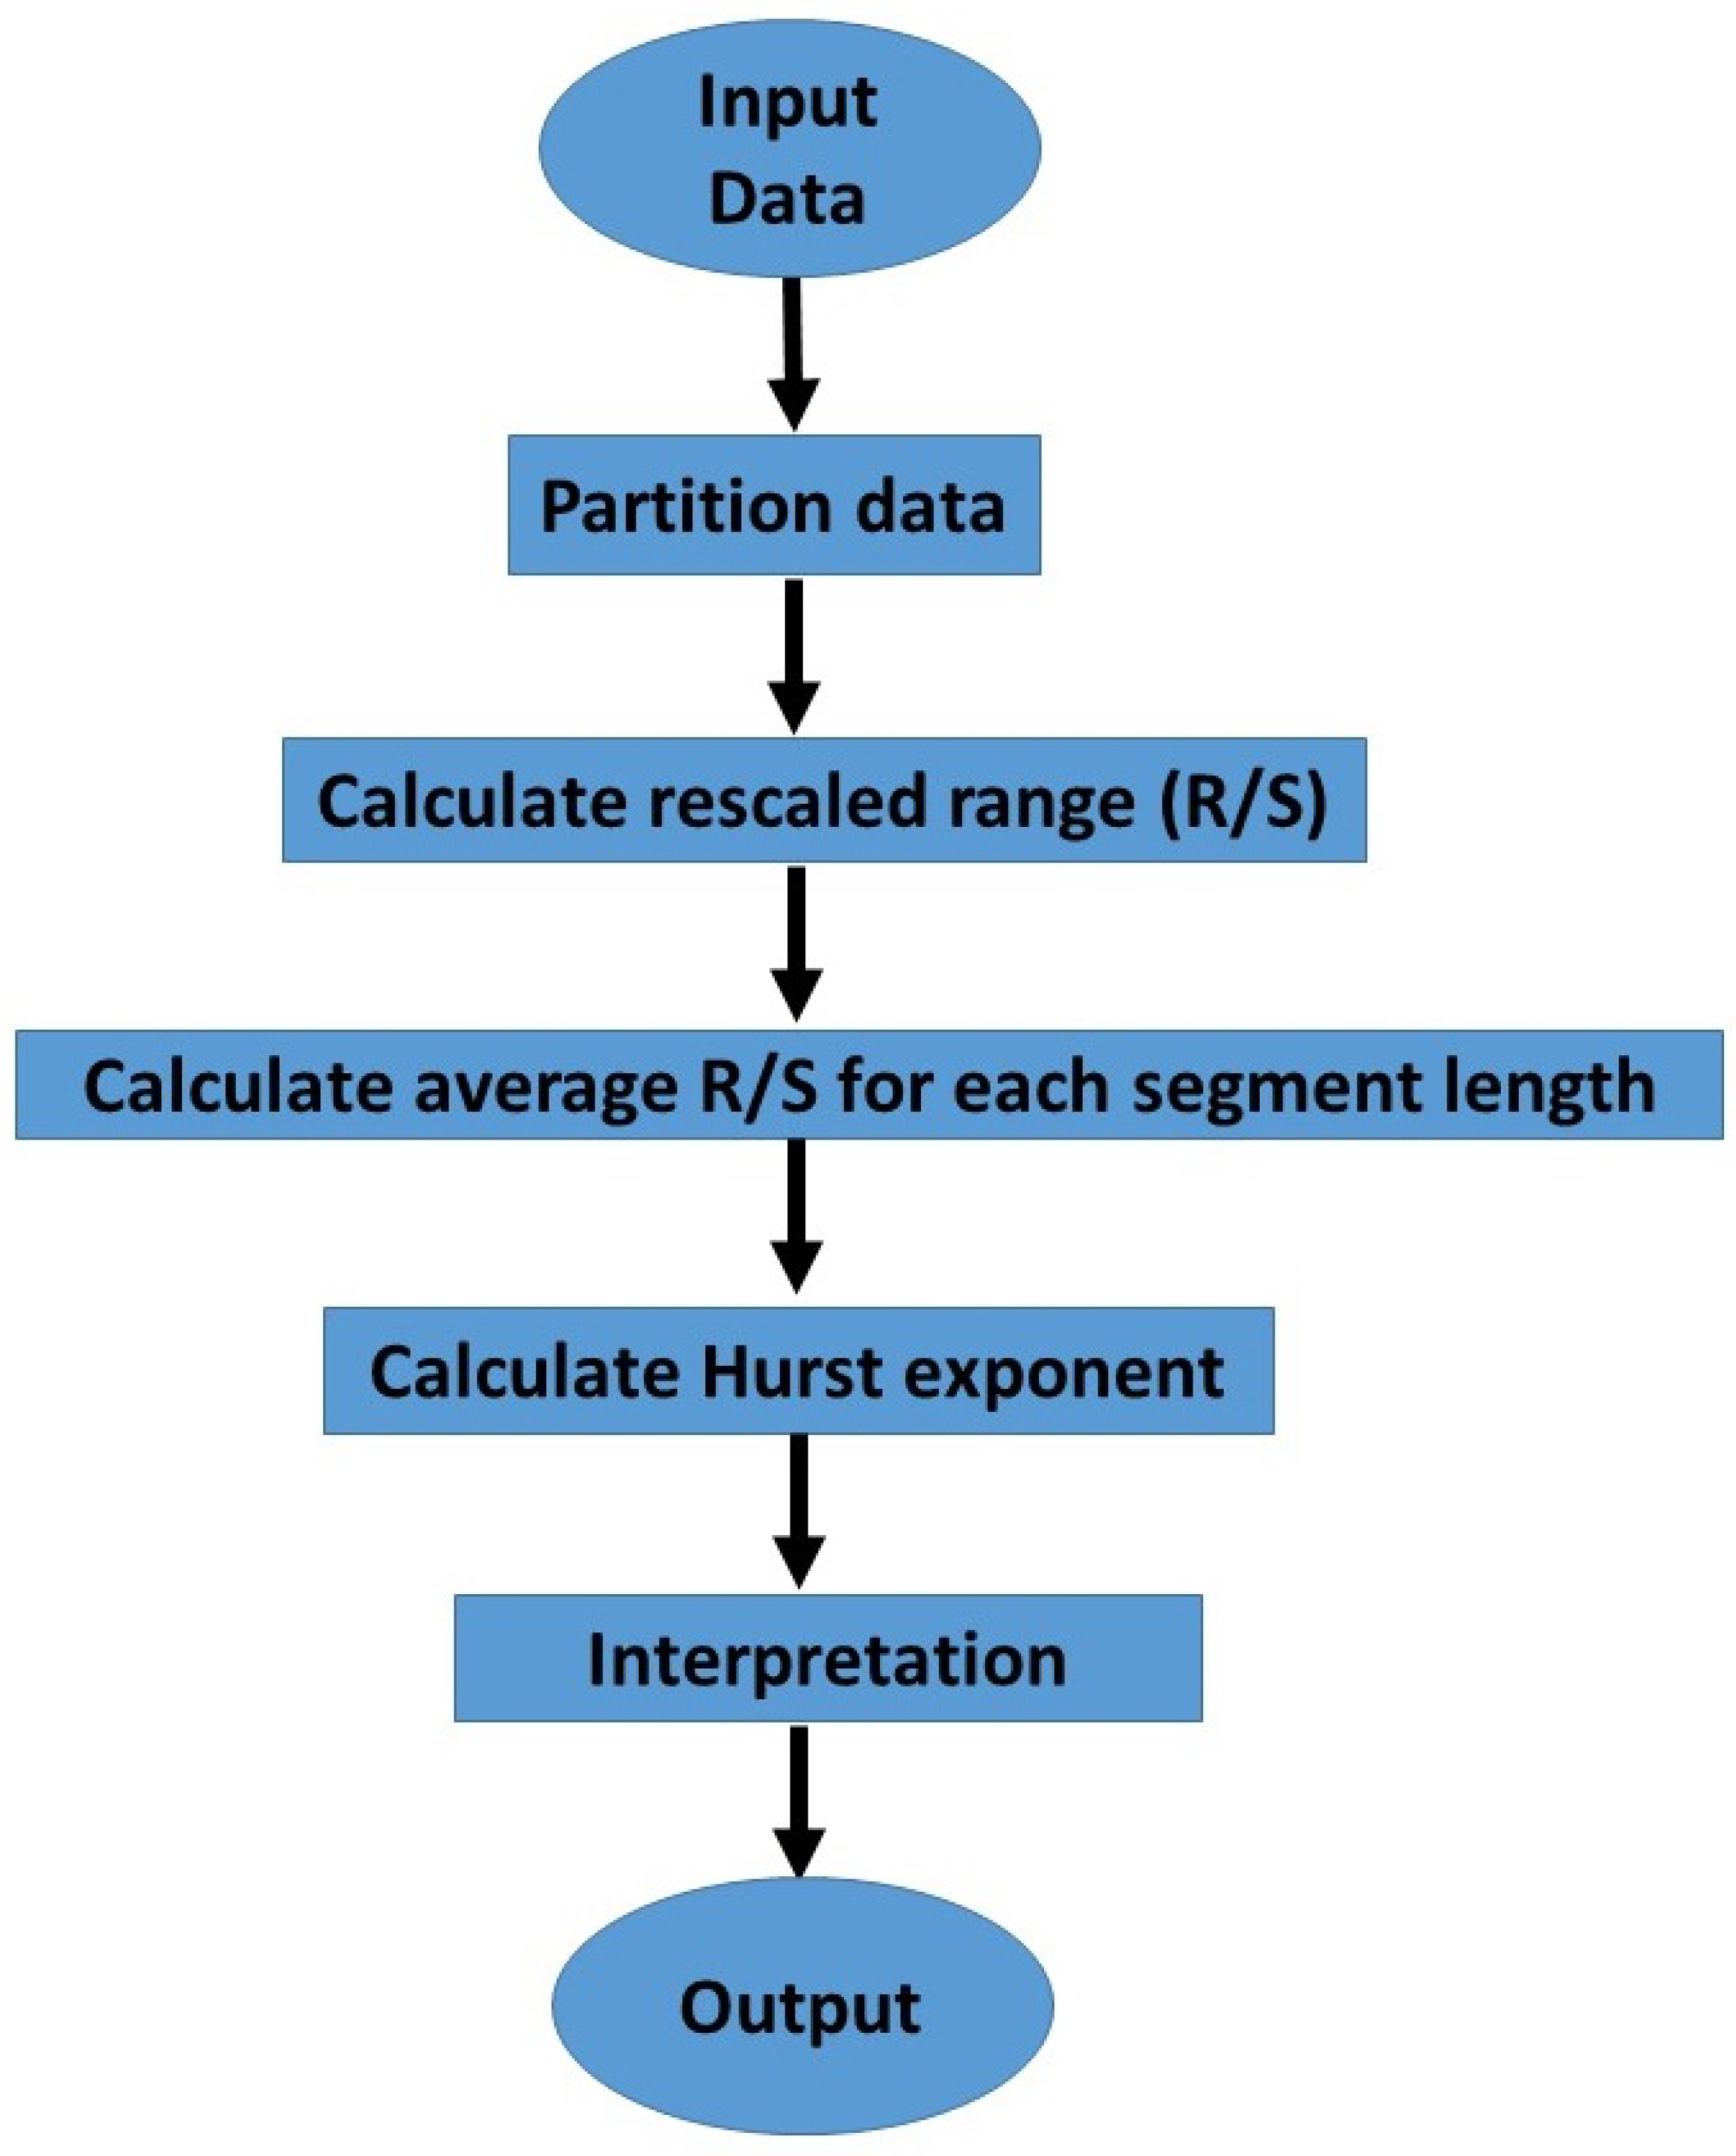
Figure 1. Flowchart of the process.
Jrfm 17 00390 g001
Figure 2. Plot of M H 100 M H 150 over time.
Jrfm 17 00390 g002
Table 1. Evaluation metric for generated signal queues.
Buy Signal QueueSell Signal QueuePairProfit/Loss
Buy Sr. No.DateBuy SignalSell Sr. No.DateSell Signal
B101-01-20150S102-02-20159(B1, S1)9
B215-01-20155S203-03-20162(B2, S2)7
B320-02-20157S316-03-20161(B3, S3)4
B415-04-20164S418-03-20160(S4, B4)−4
B504-05-20165S508-04-20161(S5, B5)−4
B614-05-20161S629-04-20162(S6, B6)1
B719-05-20163S730-05-20165(B7, S7)2
B823-05-20165 Unpaired
Total Profit/Loss 15
Table 5. Results of hypothesis testing.
Stockdf α p Valueh ValueNull Hypothesis ( H 0 )Alternate Hypothesis ( H 1 )
Cipla Pharmaceutical380.010.00061RejectedAccepted
Reliance Industries330.050.03021RejectedAccepted
UltraTech Cement340.030.02081RejectedAccepted
Disclaimer/Publisher’s Note: The statements, opinions and data contained in all publications are solely those of the individual author(s) and contributor(s) and not of MDPI and/or the editor(s). MDPI and/or the editor(s) disclaim responsibility for any injury to people or property resulting from any ideas, methods, instructions or products referred to in the content.