Abstract
This research aims to explore market mavericks by redefining sales velocity and profit surge in today’s dynamic business environment in emerging economies. The study focuses on the interplay between Sales Excellence (SE), Sales Capability (SC), Market Alignment (MA), Strategic Responsiveness (SR), and Dynamic Sales Management (DSM). Data from 180 companies (2021–2023), provided by financial leaders, were analyzed using SPSS (23.0) and AMOS (23.0) software. The analysis employed exploratory factor analysis (EFA), reliability analysis, and confirmatory factor analysis (CFA). The results highlight the critical role of these factors in shaping market mavericks and their significant impact on sales and profits in emerging economies. Specifically, SE enhances sales and profits when supported by effective strategies, SC drives organizational change by aligning service quality with SE, and MA drives sales velocity and profit surges through accurate forecasting. SR positively influences sales results by aligning sales with corporate strategy, while DSM is critical for motivating salespeople and shows strong links to SC and SR for successful adaptation in a dynamic business environment. The study reveals the interdependence of these factors and emphasizes the need for seamless integration and coordination to drive effective organizational change. These findings have significant implications for corporations seeking to improve their sales strategies and achieve sustainable growth in a rapidly evolving marketplace in emerging economies. This research explores market mavericks, redefines sales velocity and profit surge, and provides valuable insights into the critical factors shaping market mavericks and their impact on sales and profits. It offers guidance for organizations seeking sustainable growth.
Keywords:
sales; profit; market mavericks; business environment; finance-accounting; emerging economies JEL Codes:
F65; G32; M41; D24; C58
1. Introduction
In today’s dynamic and rapidly evolving business environment, achieving optimal sales velocity and profit surge is a significant challenge for companies. This paper examines the relationship between five crucial factors: Sales Excellence (SE), Sales Capability (SC), Market Alignment (MA), Strategic Responsiveness (SR), and Dynamic Sales Management (DSM). The focus is on how these factors impact market mavericks and their effectiveness in redefining sales velocity and profit surge, particularly in emerging economies. The primary research questions are: how do SE, SC, MA, SR, and DSM affect sales velocity and profit surge in emerging markets, and what is the statistical significance of these factors in shaping sales strategies for market mavericks? This research is motivated by the need for businesses in emerging markets to adapt their sales strategies to the rapidly changing environment. By analyzing these key factors, the study aims to provide actionable insights that can help companies enhance their sales performance and achieve sustained success.
The significance of this study lies in its potential to provide valuable insights for companies operating in emerging markets. For instance, Edwards et al. (2023) highlight how SE, including sales territory management and market analysis, is crucial for sales performance. Singh et al. (2021) and Echchakoui (2016) discuss how customer-oriented salespeople and customer loyalty can impact sales velocity and profit surge. In terms of SC, Koponen et al. (2019) and Park et al. (2023) emphasize the importance of communication, expertise, and creative selling. Xie et al. (2023) point out that detailed information about customer identity and pricing affects profitability, underscoring the role of MA.
Chen et al. (2015) argue that SR, including salespeople’s accountability and alignment with corporate strategy, is essential for promoting new products and redefining sales velocity. This view is supported by Reichstein-Scholz et al. (2021), who stress SR’s importance in a globalized sales environment. Additionally, Datta et al. (2024) and Figueiredo et al. (2023) highlight the need for ongoing improvements in DSM despite its integral role in sales management.
Regarding the maverick market for all factors (SE, SC, MA, SR, and DSM), according to Isherwood and Tassabehji (2016), it is emphasized that innovative companies can use their talents to solve operational problems by making a maverick company successful in the market, and Rothkopf and Pibernik (2016) suggest maverick strategies for companies. In addition, Ho et al. (2014) and Huarng and Yu (2020) emphasize that sales velocity and customer satisfaction have a significant impact on profit growth. According to Yang et al. (2020), surge pricing has long fueled the debate about its advantages and disadvantages in today’s dynamic business environment. Lu et al. (2023) highlight that sales excellence (SE) encompasses aspects such as sales territory management, market analysis, customer satisfaction, sales growth, effective handling of challenging situations, continuous sales improvement, new sales opportunities, and sales support.
The contributions of this study are both theoretical and practical. Theoretically, the study advances the understanding of how SE, SC, MA, SR, and DSM impact sales performance, particularly in emerging markets. It integrates these factors into a cohesive framework, expanding existing theories on sales excellence and market responsiveness. Practically, the research provides actionable insights for business leaders and sales managers, offering recommendations for refining sales strategies, optimizing practices, and adapting to market changes. By addressing these factors, companies can improve their sales management and achieve sustainable financial and managerial success.
The paper is structured as follows: first, a detailed literature review will be presented, followed by a comprehensive methodology section outlining data collection and analysis techniques. The empirical results will then be discussed, culminating in a conclusion that summarizes key insights, implications, and recommendations for future research.
2. Literature Review and Hypotheses Development
This literature review explores how market mavericks redefine sales velocity and profit surges in today’s dynamic business environment. It combines existing research with this study’s variables to offer a comprehensive summary, contributing to hypothesis construction and verification, and provides recommendations on how businesses can adapt to change, redefine sales velocity, and propel towards profit surges in this dynamic milieu. Therefore, according to Cui et al. (2022) on the relationship of factors (SE, SC, MA, SR, and DSM) in market mavericks (Zheng and Pan 2022), through redefining sales velocity and profit surges, consumer reactions to tariffs are highly emphasized, as well as price phenomena, managing the balance between continuity and change (Vilkamo and Keil 2003) in today’s dynamic business environment. With regard to Sales Excellence (SE) and its variables (sales territory management, market analysis, customer satisfaction, effective selling, increasing sales, improving sales skills, identifying new sales opportunities, competitive sales environment, etc.), according to Evangelista and Regis (2019), it is emphasized that the Gaussian model is promising for forecasting company sales. Sharma and Sagar (2023) highlight the key challenges of selling new products in the FMCG sector, which include product innovation, product differentiation, customer perception, and market turbulence. They suggest that focusing organizational efforts on these areas will enable retailers to better address these challenges. Morgan et al. (2024) find that customer involvement has a positive impact on new service development (NSD) performance and that the use of customer relationship management technology also improves NSD performance. In addition, Fergurson et al. (2024) point out that the two-factor measure of customer ownership reveals important aspects of the salesperson customer relationship and provides a method to empirically address customer migration. According to Mullen and Berrill (2015), it is emphasized that international sales are increasing, and the percentage of companies oriented to the local region is decreasing. Kozielski et al. (2017) noted that companies spend millions on training their salespeople. In today’s dynamic business environment, Annunen et al. (2021) stress the importance of improving market analysis, customer satisfaction, and effective sales to achieve higher sales velocity and profit surge.
Regarding Sales Capability (SC) and its variables (clear sales strategy, quality services, sales knowledge of products/services), Sun et al. (2024) emphasize the importance of using sales strategies that consider both company characteristics and customer decisions influenced by costs. Additionally, it is highlighted that the sales strategy should incorporate the opportunities and outcomes that arise from customer service completion by salespeople (Tavakoli et al. 2016) to define sales velocity and profit increase in today’s dynamic business environment. Furthermore, Trentin et al. (2013) emphasize the use of a sales configurator to mitigate the risk of offering an excessive variety of products and customization, which can result in a loss of sales. Wang et al. (2024) emphasize the necessity for companies to publish salary information.
Regarding Market Alignment (MA) and its variables (fulfillment of customer expectations, accurate and reliable sales forecasts, competitive prices in the market), Wacker and Lummus (2002) emphasize that companies can improve their sales forecasts by addressing limitations and gaining a deeper understanding of the managerial side of forecasting from customer expectations. In the context of market mavericks redefining sales velocity and profit surge in today’s dynamic business environment, Xi and Zhang (2023) highlight the importance of companies making informed choices in pricing strategy. Coreynen et al. (2024) emphasize that as companies gradually develop and progress towards the maturity of digital service innovation (DSI), they deal with an increasing degree of complexity, driving their learning needs; therefore, in each cycle of the company, they must unlock opportunities and new challenges of DSI.
Regarding Strategic Responsiveness (SR) and its variables (responsibility of salespeople for customer requests, selling according to business strategy, real selling strategy), Bharadwaj and Shipley (2020) emphasize the significance of effective communication between salespeople and customers for redefining sales velocity and achieving profit surge in today’s dynamic business environment. Edwards et al. (2023) highlight the positive relationship between the creation of an entrepreneurial strategy, corporate readiness, entrepreneurial selling actions (such as creative selling, innovation in selling, and responsiveness to customer requests and questions), and sales performance aligned with the business strategy. Vagtborg (2024) presents a process perspective on the sustainability transition relevant to firms seeking a shift in focus from simple compliance to strategic responsiveness based on adaptability and renewal.
Regarding Dynamic Sales Management (DSM) and its variables (regular research and analysis of sales data, clear sales program, motivation and commitment of salespeople, adaptation of salespeople to changes in market conditions), Corsaro (2022) emphasizes that sales are undergoing an invisible process of change known as sales transformation. Langley and Rieple (2024) point out that the management’s management perceptions should be revised in the dynamic managerial environment of businesses in emerging economies. Moreover, Hou et al. (2024) reveal that consumer honesty significantly affects dynamic decisions. Pereira et al. (2023) highlight the importance of the company determining which demand segments should be improved in the sales program. In today’s dynamic business environment, Zheng et al. (2023) consider sales transformation as an effective management approach to enhance sales performance and increase sales force engagement amidst changing market conditions. The work engagement and motivation of salespeople, as noted by Medhurst and Albrecht (2016), significantly impact sales velocity and profit surge. Lulaj (2021) highlights that large enterprises are competitive over small enterprises in emerging markets. Lulaj and Dragusha (2022) discuss the challenges in business tax payments in developing countries, emphasizing the need for improvements, particularly in light of the COVID-19 pandemic. Furthermore, Dragusha et al. (2023) assert that trade liberalization positively influences economic growth, exports, and imports, driving sales velocity and profit surge in today’s dynamic business environment. The integrated discussions highlight the importance of formulating hypotheses and sub-hypotheses to validate and extend the findings of this study. The collective knowledge gained from various studies by different authors on the factors (SE, SC, MA, SR, and DSM) and their variables strengthens the foundation for hypothesis building. Based on this research, the main hypothesis (H) and its sub-hypotheses (H1–H10) have been developed for the five factors to explore their relationship and evaluate their effect on market mavericks in terms of redefining sales velocity and achieving profit surge in today’s dynamic business environment. These hypotheses aim to provide a new perspective for understanding sales velocity and contribute to the empowerment of businesses through improved sales and increased profits, as elaborated below:
Hypothesis (H).
There is a statistically significant and positive relationship between the factors of SE (Sales Excellence), SC (Sales Capability), MA (Market Alignment), SR (Strategic Responsiveness), and DSM (Dynamic Sales Management) in the context of market mavericks through redefining sales velocity and profit surge in today’s dynamic business environment.
Figure 1 presents the conceptual model that explores how Sales Excellence (SE), Sales Capability (SC), Market Alignment (MA), Strategic Responsiveness (SR), and Dynamic Sales Management (DSM) are interrelated in the context of market mavericks and climate change. The main hypothesis (H) suggests a statistically significant and positive relationship among these factors. Specifically, the sub-hypotheses (H1–10) propose that SE has a positive effect on SC, MA, SR, and DSM; SC has a positive effect on MA, SR, and DSM; MA has a positive effect on SR and DSM; and SR has a positive effect on DSM. In this context, SE refers to efforts to achieve sales excellence, SC focuses on an organization’s ability to adapt its capabilities to market demands, MA involves aligning sales strategies with market expectations, SR highlights the ability to respond to changes in the business environment, and DSM covers dynamic sales management strategies. This analysis is expected to enhance the understanding of market and sales behavior, aiding in the development of effective strategies and improving business performance in a rapidly evolving environment and climate change.
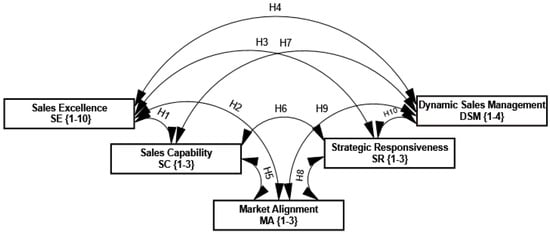
Figure 1.
Conceptual model. Source: prepared by the authors (2023–2024).
3. Materials and Methods
3.1. The Purpose of the Paper
The research focuses on market mavericks in emerging economies through redefining sales velocity and profit surge in today’s dynamic business environment between the factors of SE (Sales Excellence), SC (Sales Capability), MA (Market Alignment), SR (Strategic Responsiveness), and DSM (Dynamic Sales Management). Therefore, the aim is to identify and illustrate the correlations between these factors, providing insights and recommendations for effective practices that influence sales and profit surges in today’s dynamic business environment.
3.2. Data Analysis
To assess the significance of the model and validate the hypotheses, we selected SPSS and AMOS software for their robust capabilities in handling complex statistical analyses, which are crucial for our study’s objectives. These tools were chosen because they provide comprehensive methods for exploring and confirming the underlying structures within the data, ensuring accurate and reliable results. The research process unfolded in four steps: first step (s1), we applied exploratory factor analysis (EFA) to uncover the underlying structure of the data, a method widely recognized for its effectiveness in revealing the dimensionality of complex constructs (Spearman 1927). EFA was necessary to ensure that the constructs in our model were well defined and appropriately measured. Next, in the second step (s2), we conducted a reliability analysis to confirm the consistency and stability of our measurement instruments, following Floyd and Widaman’s (1995) guidelines on the importance of factor analysis in the evaluation of multi-factor questionnaires. This step was essential to ensure that the data collected were reliable and could be used with confidence in further analyses. In the third step (s3), confirmatory factor analysis (CFA) was used to validate the model specification using standardized regression coefficients (β) and correlations (r) to predict indicators from latent factors, along with multiple regression analysis, as recommended by Cohen et al. (2003). CFA was critical to confirm that the data fit the proposed model structure. Finally, in the fourth step (s4), we used covariance, correlation analysis, and model fit indices to test the main hypothesis (H) and its sub-hypotheses (H1–H10), ensuring a comprehensive understanding of the relationships between variables and the reliability of the model’s predictions. This detailed explanation is visually represented in Figure 2.
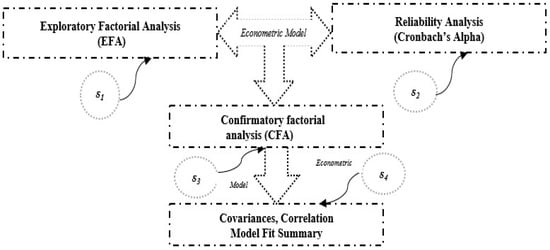
Figure 2.
Econometric model. Source: prepared by the authors (2023–2024).
3.3. Data Collection
The data were collected from 180 companies (manufacturing, service, and commercial) in Kosovo during 2021–2023 using a survey completed by employees in various positions, including workers, financial managers, accountants, directors/owners, internal auditors, and investors/stockholders. The sample was selected to provide a representative overview of different sectors and roles within the business environment in Kosovo, a developing economy. The companies and respondents were selected to explore market challenges and opportunities, particularly in redefining sales velocity and profit growth in today’s dynamic business environment. Participants were informed that their data would be used for research purposes only and would remain confidential to ensure their voluntary and honest participation. The questionnaire was structured using a Likert scale (1—strongly disagree to 5—strongly agree) to accurately capture respondents’ attitudes and perceptions.
Table 1 provides a description of the variables, highlighting the impact of factors such as Sales Excellence (SE), Sales Capability (SC), Market Alignment (MA), Strategic Responsiveness (SR), and Dynamic Sales Management (DSM) related to market mavericks and climate change through redefining sales velocity and profit surge in today’s dynamic business environment. Ten variables were analyzed in the SE factor, three variables in SC, three variables in MA, three variables in SR, and four variables in DSM. Each factor and its variables were thoroughly discussed in the introduction and literature review sections, taking into account the contributions of various authors to the research. In the Results and Discussion sections, the findings for each factor are analyzed and compared with the contributions of other authors.

Table 1.
Clarification and analysis of research variables.
4. Results
As discussed in the Literature Review and Materials and Methods sections, this section presents the results derived from analyzing the five factors—Sales Excellence (SE), Sales Capability (SC), Market Alignment (MA), Strategic Responsiveness (SR), and Dynamic Sales Management (DSM)—as shown below.
Table 2 presents the demographic breakdown of the 180 respondents from various companies who participated in the survey on market mavericks and climate change, focusing on redefining sales velocity and profit surge in today’s dynamic business environment. The respondents are categorized by company type and position. Therefore, the sample includes 35.6% from manufacturing companies, 39.4% from service companies, and 25.0% from commercial companies. In terms of positions, 12.8% were workers, 17.2% were managers, 17.8% were financial managers, 17.2% were accountants, 16.7% were directors/owners, 7.8% were internal auditors, and 10.6% were investors/shareholders.
Table 2.
Descriptive statistics.
Table 3 presents the results of the Principal Component Analysis (PCA) for five key factors (SE, SC, MA, SR, and DSM). All factors have loadings greater than 0.50, indicating their significance. The KMO test and Bartlett’s Sphericity test support the suitability of the data for factor analysis, with KMO values ranging from 0.650 to 0.880 and a significant Bartlett’s test (Sig. = 0.000). Reliability analysis shows Cronbach’s Alpha values between 0.67 and 0.85, indicating data consistency. Each factor’s Eigenvalue indicates that it explains more than 50% of the variance.
Table 3.
Exploratory factor analysis (EFA) and reliability analysis (Cronbach’s Alpha).
Table 4 shows the CFA results for the factors SE, SC, MA, SR, and DSM. All variables show significant effects on their latent variables, with standardized regression weights above 0.5 and p-values below 0.001. Specifically, for SE, SE10 (0.71) and SE5 (0.67) are critical, highlighting the importance of providing resources and effective sales techniques. Then, for SC, SC2 (0.71) and SC3 (0.70) are crucial for ensuring high service quality and thorough product knowledge. MA is best represented by MA2 (0.77), which is essential for accurate sales forecasting. In SR, SR2 (0.68) and SR1 (0.65) are significant, focusing on aligning sales activities with corporate strategy and addressing customer needs. Finally, in DSM, DSM3 (0.74) underscores the importance of salesperson motivation and commitment. The results, supported by a 99.9% confidence interval, underscore the value of strategic resource allocation, effective sales strategies, quality service, accurate forecasting, and motivated salespeople in achieving market success and adapting to dynamic business environments.
Table 4.
Confirmatory factor analysis (CFA).
Table 5 shows the relationships between the SE, SC, MA, SR, and DSM factors. It includes covariance, correlation, and significance values for each pair of factors. The results indicate significant positive relationships: SE and SC (Cov: 0.047, Cor: 0.263, p < 0.010), SE and MA (Cov: 0.057, Cor: 0.310, p < 0.003), SE and SR (Cov: 0.067, Cor: 0.356, p < 0.001), SE and DSM (Cov: 0.057, Cor: 0.341, p < 0.002), SC and MA (Cov: 0.092, Cor: 0.556, p < 0.000), SC and SR (Cov: 0.139, Cor: 0.828, p < 0.000), SC and DSM (Cov: 0.122, Cor: 0.824, p < 0.000), MA and SR (Cov: 0.094, Cor: 0.539, p < 0.000), MA and DSM (Cov: 0.081, Cor: 0.532, p < 0.000), and SR and DSM (Cov: 0.112, Cor: 0.720, p < 0.000). The most significant relationships were observed between SC and SR (83%), SC and DSM (82%), and SR and DSM (72%). These results highlight the critical role of integrating these factors to adapt to a dynamic business environment, emphasizing the need for a strong focus on sales excellence to redefine sales velocity effectively.
Table 5.
Covariances and correlations.
Table 6 presents the results of the FIT model, which aims to identify and evaluate the possible relationships between the variables and factors involved (SE, SC, MA, SR, and DSM) related to market mavericks and climate change through redefining sales velocity and profit surge in today’s dynamic business environment. The model has a chi-squared value (CMIN/χ2) of 264.369 and (χ2/df, 203) and a p-value of 0.002 at the 5% (0.05) level, indicating an excellent fit and a statistically significant model effect. Various model performance indices such as RMR (0.026), GFI (0.890), AGFI (0.850), PGFI (0.654), NFI (0.836), RFI (0.795), IFI (0.956), TLI (0.944), PRATIO (0.802), PNFI (0.671), and PCFI (0.766) collectively indicate a high level of model fit. The RMSEA index of 0.041 also supports a good fit to the data. These results indicate that the model has a good fit and corresponds well to the structure of the available data, highlighting the possibility of the presence of significant relationships and interactions between factors when testing alternative hypotheses.
Table 6.
Model fit summary.
Figure 3 presents the relationship related to market mavericks and climate change through redefining sales velocity and profit surge in today’s dynamic business environment based on the factors (SE, SC, MA, SR, and DSM) and their variables (SE1-10, SC1-3, MA1-3, SR1-3, and DSM1-4). According to the path diagram, the following findings are highlighted: SE (Sales Excellence) <--> SC (Sales Capability): the correlation of 0.263 indicates a positive and moderate relationship between high sales performance and salesperson abilities, suggesting that an improvement in SE has a positive impact on SC. SE <--> MA (Market Alignment): the correlation of 0.310 indicates a positive relationship between high sales performance and the company’s market adaptability, suggesting that changes in SE influence the company’s market adaptability. SE <--> SR (Strategic Responsiveness): the correlation of 0.356 indicates a positive relationship between high sales performance and the company’s strategic ability to respond to market developments, suggesting that changes in SE influence strategic responsiveness. SE <--> DSM (Dynamic Sales Management): the correlation of 0.341 indicates a positive relationship between high sales performance and dynamic sales management, suggesting that changes in SE influence dynamic sales management. SC (Sales Capability) <--> MA (Market Alignment): the correlation of 0.556 indicates a strong relationship between salespeople’s abilities and market adaptability, suggesting that changes in salespeople’s skills significantly affect the company’s suitability in the market. SC <--> SR (Strategic Responsiveness): the correlation 0.828 shows a very strong relationship between salespeople’s capabilities and the company’s strategic ability to respond to market developments, suggesting that salespeople’s capabilities have a substantial impact on the company’s strategic capability the company. SC <--> DSM (Dynamic Sales Management): the correlation 0.824 shows a very strong relationship between salesperson’s skills and dynamic sales management, suggesting that salespeople’s skills have a substantial impact on dynamic sales management. MA (Market Alignment) <--> SR (Strategic Responsiveness): the correlation 0.539 shows a positive relationship between market adaptability and the company’s strategic ability to respond to market developments, suggesting that market adaptability has a positive impact on the strategic ability of the company. MA <--> DSM (Dynamic Sales Management): the correlation of 0.532 indicates a positive relationship between market adaptability and dynamic sales management, suggesting that market adaptability has a positive impact on dynamic sales management. SR (Strategic Responsiveness) <--> DSM (Dynamic Sales Management): the correlation 0.720 shows a strong relationship between strategic capability and dynamic sales management, suggesting that strategic capability has a significant impact on dynamic sales management. Therefore, the results of the path diagram suggest that a focus on training and improving salespeople’s skills, effective interdepartmental collaboration, and deep market knowledge are critical for future corporate strategies to challenge the status quo in a dynamic environment and climate change.
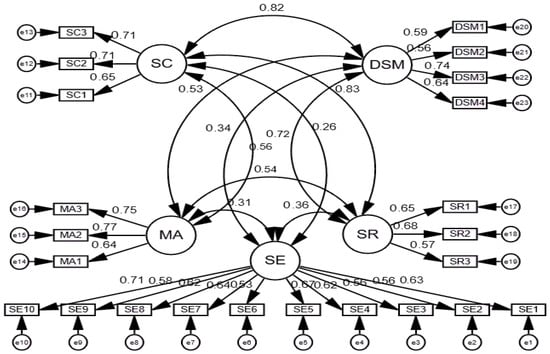
Figure 3.
Path diagram. Note: Sales Excellence (SE), Sales Capability (SC), Market Alignment (MA), Strategic Responsiveness (SR), Dynamic Sales Management (DSM), confirmatory factor analysis (CFA). Source: prepared by the authors (2023–2024).
Table 7 provides strong support for the relationship between SE, SC, MA, SR, and DSM, confirming the hypotheses and demonstrating a good model fit. Each factor (SE, SC, MA, SR, and DSM) is highlighted individually for its strategic importance in shaping market mavericks. The positive and statistically significant associations between these factors emphasize their interdependence. The FIT model and path diagram analysis further confirm the significant relationships that impact sales velocity and profit surge. These findings have significant implications for companies seeking to improve their sales strategies and achieve sustainable growth in a dynamic marketplace and climate change.
Table 7.
Verification of hypotheses.
5. Discussion
This research provides an in-depth analysis of the key factors—Sales Excellence (SE), Sales Capability (SC), Market Alignment (MA), Strategic Responsiveness (SR), and Dynamic Sales Management (DSM)—that drive sales performance in a dynamic business environment. The component matrix–PCA and confirmatory factor analysis (CFA) show that the values for these factors exceed 0.50, indicating their significant contribution to the model. Reliability scores from Cronbach’s Alpha range from 0.73 to 0.85, confirming the robustness and consistency of these factors.
Sales Excellence (SE) is particularly influenced by variables such as SE10 (0.71) and SE5 (0.67), focusing on resource provision and effective selling strategies. Sales Capability (SC) is driven by SC2 (0.71) and SC3 (0.70), highlighting the importance of quality service and product knowledge. Market Alignment (MA) is notably impacted by MA2 (0.77), emphasizing the significance of accurate sales forecasting. Strategic Responsiveness (SR) is shaped by SR2 (0.68) and SR1 (0.65), reflecting alignment with corporate strategy and responsiveness to customer demands. Dynamic Sales Management (DSM) is significantly driven by DSM3 (0.74), which emphasizes the motivation and commitment of salespeople.
The analysis of the correlations between these factors reveals their interconnectedness. For instance, Sales Excellence has a moderate positive correlation with Sales Capability (0.263, p < 0.010), Market Alignment (0.310, p < 0.003), Strategic Responsiveness (0.356, p < 0.001), and Dynamic Sales Management (0.341, p < 0.002). These findings suggest that improvements in Sales Excellence positively affect these other factors, aligning with Ho and Chang (2022) on the role of sales innovations, such as a clear sales strategy and quality services.
Similarly, Tong et al. (2022) emphasize the importance of efficient promotion strategies, which resonate with our results on Sales Capability and Strategic Responsiveness. The need for investment in equipping salespeople with new technological tools and motivation, as stressed by Rayburn et al. (2021), reflects our observed correlations with Sales Excellence and Dynamic Sales Management. Escobar and Alexandrov (2018) support our findings by arguing that well-designed sales territories enhance customer satisfaction and sales performance, corroborating our results on Sales Excellence, Dynamic Sales Management, Strategic Responsiveness, and Market Alignment.
Cheratian et al. (2024) suggest that funding for research and development, production diversification, and employee training can significantly increase sales velocity, aligning with our results on Sales Excellence and Dynamic Sales Management. Peesker et al. (2022) point out that salespeople’s analytical skills have a direct and moderate effect on sales performance, which supports our findings on the influence of Dynamic Sales Management, Market Alignment, Strategic Responsiveness, Sales Capability, and Sales Excellence. Lulaj (2024) underscores the critical role of sales strategies in bridging the gap between expected and actual expense values while navigating the complex interplay between finance, climate change, and sustainable finance in transitional economies. Lulaj et al. (2024c) also note that the impact of the pandemic will continue to affect businesses post-pandemic, necessitating innovative approaches to sustain and enhance sales velocity and profit in today’s dynamic business environment.
The FIT model analysis shows an excellent fit with a chi-squared value of 264.369 (p-value = 0.002) and an RMSEA index of 0.041, confirming the validity of the model. Performance indices such as GFI (0.890) and AGFI (0.850) further support the model’s fit to the data. In conclusion, the study highlights the critical importance of integrating Sales Excellence, Sales Capability, Market Alignment, Strategic Responsiveness, and Dynamic Sales Management to achieve sustainable growth and adapt to a changing business environment. Companies that effectively manage these factors are better positioned to overcome market challenges and capitalize on emerging opportunities.
6. Conclusions and Future Studies
This research explored market mavericks in emerging economies by redefining sales velocity and profit surge within today’s dynamic business environment. It focused on the interplay between key factors: Sales Excellence (SE), Sales Capability (SC), Market Alignment (MA), Strategic Responsiveness (SR), and Dynamic Sales Management (DSM). Extensive data analysis was conducted using SPSS and AMOS software, including exploratory factor analysis (EFA), reliability analysis (Cronbach’s Alpha), and confirmatory factor analysis (CFA). This analysis, performed on a sample of 180 companies in Kosovo from 2021 to 2023, validated these factors and supported the study’s hypotheses. The results underscored the crucial roles of SE, SC, MA, SR, and DSM in shaping market mavericks, with statistical reliability confirming their substantial impact on companies’ sales and profits. The component matrix highlighted these factors with values above 0.50, reinforcing their importance. The fit of the data to the models, validated by the Kaiser–Meyer–Olkin (KMO) test and Bartlett’s Sphericity test, further established the credibility of the study. CFA revealed significant weights for all factors, confirming their critical impact on redefining sales velocity and driving profit surges.
Implications: The findings of the study have significant implications for companies seeking to improve their sales strategies and achieve sustainable growth. Companies should focus on sales excellence by investing in the necessary resources and implementing effective strategies. Improving sales capability is essential, which includes delivering high-quality services and enhancing the expertise of the sales force. Ensuring Market Alignment is critical for accurate and reliable sales forecasting. Strategic Responsiveness requires aligning sales efforts with corporate strategy and ensuring that salespeople are accountable for meeting customer needs. In addition, dynamic sales management is essential to motivate and engage sales teams.
Recommendations: To achieve these goals, companies should adopt several key strategies. They should conduct regular assessments to evaluate and refine sales performance and strategies and invest in comprehensive training programs to improve the skills and knowledge of the sales force. Using advanced analytics will help make informed strategic decisions. In addition, establishing clear lines of communication within teams and across departments is essential. Finally, fostering a motivating work environment will effectively support and engage sales teams.
Future studies: Further research could explore several areas to deepen understanding and provide valuable insights. These include the following: examine specific strategies for improving sales performance and assess the impact of technological advances on sales processes; examine the influence of organizational finance culture on sales strategies and performance; examine the longitudinal impact of identified factors on sales and profitability; and analyze how external factors, such as market changes or regulatory changes, affect these key factors and their effectiveness.
Author Contributions
Conceptualization, E.L.; methodology, E.L. and B.D.; software, E.L. and D.L.; validation, E.L. and B.D.; formal analysis, E.L.; investigation, E.L.; resources, E.L., D.L. and B.D.; data curation, E.L.; writing—original draft preparation, E.L. and B.D.; writing—review and editing, E.L. and D.L.; visualization, E.L.; supervision, E.L.; project administration, E.L.; funding acquisition, B.D. and E.L. All authors have read and agreed to the published version of the manuscript.
Funding
This research received no external funding.
Institutional Review Board Statement
The study was conducted according to the guidelines of the Declaration of Helsinki, and ethical review and approval were waived for this study for the reason that this study was conducted individually and independently by the institution where they work, respecting the anonymity of the interviewer.
Informed Consent Statement
Informed consent was obtained from all subjects involved in the study.
Data Availability Statement
The data used to support and prove the findings of this study are available from the corresponding author upon request.
Conflicts of Interest
The authors declare no conflicts of interest.
References
- Annunen, Petteri, Erno Mustonen, Janne Harkonen, and Harri Haapasalo. 2021. Sales capability creation during new product development—Early involvement of sales. Journal of Business & Industrial Marketing 36: 263–73. [Google Scholar] [CrossRef]
- Bentler, Peter M., and Douglas G. Bonett. 1980. Significance tests and goodness of fit in the analysis of covariance structures. Psychological Bulletin 88: 588–606. [Google Scholar] [CrossRef]
- Bharadwaj, Neeraj, and Garrett M. Shipley. 2020. Salesperson communication effectiveness in a digital sales interaction. Industrial Marketing Management 90: 106–12. [Google Scholar] [CrossRef]
- Bollen, Kenneth A. 1989. Structural Equations with Latent Variables. New York: John Wiley. [Google Scholar] [CrossRef]
- Browne, Michael W., and Robert Cudeck. 1992. Alternative Ways of Assessing Model Fit. Sociological Methods & Research 21: 230–58. [Google Scholar] [CrossRef]
- Chen, Annie, Norman Peng, and Kuang-Peng Hung. 2015. Managing salespeople strategically when promoting new products—Incorporating market orientation into a sales management control framework. Industrial Marketing Management 47: 147–55. [Google Scholar] [CrossRef]
- Cheratian, Iman, Saleh Goltabar, Hassan F. Gholipour, and Mohammad Reza Farzanegan. 2024. Finance and sales growth at the firms level in Iran: Does type of spending matter? Research in International Business and Finance 67: 102142. [Google Scholar] [CrossRef]
- Cohen, Jacob, Patricia Cohen, Stephen G. West, and Leona S. Aiken. 2003. Applied Multiple Regression/Correlation Analysis for the Behavioral Sciences, 3rd ed. Mahwah: Lawrence Erlbaum. [Google Scholar] [CrossRef]
- Conde, Richard, Victor Prybutok, Kenneth Thompson, and Cameron Sumlin. 2024. Inside sales managers’ utilization of cultural controls as part of a sales control portfolio to enhance overall sales performance. Journal of Business & Industrial Marketing 39: 273–87. [Google Scholar] [CrossRef]
- Coreynen, Wim, Paul Matthyssens, Bieke Struyf, and Wim Vanhaverbeke. 2024. Spiraling between learning and alignment toward digital service innovation. Journal of Service Management 35: 306–31. [Google Scholar] [CrossRef]
- Corsaro, Daniela. 2022. Explaining the Sales Transformation through an institutional lens. Journal of Business Research 142: 1106–24. [Google Scholar] [CrossRef]
- Cronbach, Lee J. 1951. Coefficient alpha and the internal structure of tests. Psychometrika 16: 297–334. [Google Scholar] [CrossRef]
- Cronbach, Lee J. 2004. My current thoughts on coefficient alpha and successor procedures. Educational and Psychological Measurement 64: 391–418. [Google Scholar] [CrossRef]
- Cui, Yuanyuan (Gina), Patrick van Esch, Gopal Das, and Shailendra Jain. 2022. Surge price precision and political ideology. Journal of Business Research 143: 214–24. [Google Scholar] [CrossRef]
- Datta, Alotosh, Biswajit Sarkar, Bikash Koli Dey, Isha Sangal, Liu Yang, Shu-Kai S. Fan, Suman Kalyan Sardar, and Lakshmi Thangavelu. 2024. The impact of sales effort on a dual-channel dynamical system under a price-sensitive stochastic demand. Journal of Retailing and Consumer Services 76: 103561. [Google Scholar] [CrossRef]
- Diamantopoulos, Adamantios, and Judy A. Siguaw. 2000. Introducing LISREL. London: Sage Publications. [Google Scholar] [CrossRef]
- Dragusha, Blerta, Besarta Hasaj, Alba Kruja, and Enkeleda Lulaj. 2023. The Impact of Foreign Trade Liberalization on Albania’s Economic Growth: An Econometrical Approach. Journal of Eastern European and Central Asian Research (JEECAR) 10: 189–200. [Google Scholar] [CrossRef]
- Echchakoui, Saïd. 2016. Relationship between sales force reputation and customer behavior: Role of experiential value added by sales force. Journal of Retailing and Consumer Services 28: 54–66. [Google Scholar] [CrossRef]
- Edwards, John, Morgan P. Miles, Steven D’Alessandro, and Mark Frost. 2023. Entrepreneurial strategy-making, corporate entrepreneurship preparedness and entrepreneurial sales actions: Improving B2B sales performance. Journal of Business Research 157: 113586. [Google Scholar] [CrossRef]
- Eisenhauer, Joseph G. 2008. Degrees of Freedom. Teaching Statistics 30: 75–78. [Google Scholar] [CrossRef]
- Escobar, Laura Hervert, and Vassil Alexandrov. 2018. Territorial design optimization for business sales plan. Journal of Computational and Applied Mathematics 340: 501–7. [Google Scholar] [CrossRef]
- Evangelista, Vivian M., and Rommel G. Regis. 2019. Exploring the Suitability of Support Vector Regression and Radial Basis Function Approximation to Forecast Sales of Fortune 500 Companies. Advances in Business and Management Forecasting 13: 3–23. [Google Scholar] [CrossRef]
- Fergurson, J. Ricky, Greg W. Marshall, and Lou E. Pelton. 2024. Toward addressing customer migration: Measuring B2B salespersons’ perceptions of customer ownership. Journal of Business & Industrial Marketing. ahead-of-print. [Google Scholar] [CrossRef]
- Figueiredo, Marco, João J. Ferreira, and Demetris Vrontis. 2023. Perspectives on dynamic capabilities and ambidexterity in born-global companies: Theoretical framing, review and research agenda. Journal of International Management 30: 101099. [Google Scholar] [CrossRef]
- Floyd, Frank J., and Keith F. Widaman. 1995. Factor analysis in the development and refinement of clinical assessment instruments. Psychological Assessment 7: 286–99. [Google Scholar] [CrossRef]
- Giovannetti, Marta, Arun Sharma, Deva Rangarajan, Silvio Cardinali, and Elena Cedrola. 2024. Understanding the enduring shifts in sales strategy and processes caused by the COVID-19 pandemic. Journal of Business & Industrial Marketing 39: 735–56. [Google Scholar] [CrossRef]
- Ho, Edward, Tobias Kowatsch, and Alexander Ilic. 2014. The Sales Velocity Effect on Retailing. Journal of Interactive Marketing 28: 237–56. [Google Scholar] [CrossRef]
- Ho, Shirley J., and Hung-Wei Chang. 2022. Impacts of sharing business on production, sales, and rental markets. International Journal of Production Economics 248: 108478. [Google Scholar] [CrossRef]
- Hou, Hongyu, Feng Wu, and Xin Huang. 2024. Dynamic pricing strategy for content products considering consumer fairness concerns and strategic behavior. Industrial Management & Data Systems. ahead-of-print. [Google Scholar] [CrossRef]
- Hu, Li-tze, and Peter M. Bentler. 1998. Fit indices in covariance structure modeling: Sensitivity to underparameterized model misspecification. Psychological Methods 3: 424–53. [Google Scholar] [CrossRef]
- Huarng, Kun-Huang, and Tiffany Hui-Kuang Yu. 2020. The impact of surge pricing on customer retention. Journal of Business Research 120: 175–80. [Google Scholar] [CrossRef]
- Isherwood, Andrew, and Rana Tassabehji. 2016. A case analysis of managing “Maverick” innovation units. International Journal of Information Management 36: 793–98. [Google Scholar] [CrossRef][Green Version]
- James, Lawrence R., Stanley A. Mulaik, and Jeanne M. Breet. 1982. Causal Analysis: Assumptions, Models, and Data. Beverly Hills: Sage Publications. [Google Scholar]
- Jőreskog, Karl Gustav. 2004. On Chi-Squares for the Independence Model and Fit Measures in LISREL. Available online: https://api.semanticscholar.org/CorpusID:121983408 (accessed on 24 August 2024).
- Joreskog, Karl Gustav, and Dag Sorbom. 1996. LISREL8: User’s Reference Guide. Mooresville: Scientific Software. [Google Scholar]
- Kääriä, Emilia, and Ahm Shamsuzzoha. 2024. Improvement of an order-to-cash business process by deploying lean six sigma tools: A case study. International Journal of Productivity and Performance Management 73: 161–89. [Google Scholar] [CrossRef]
- Kaiser, Henry F. 1970. A second generation little jiffy. Psychometrika 35: 401–15. [Google Scholar] [CrossRef]
- Kaiser, Henry F. 1974. An index of factorial simplicity. Psychometrika 39: 31–36. [Google Scholar] [CrossRef]
- Kaur, Prabhjot, Anupama Prashar, and Jyotsna Bhatnagar. 2024. Creating resource passageways in cross-cultural virtual work teams: A longitudinal field study. Personnel Review 53: 336–52. [Google Scholar] [CrossRef]
- Kline, Rex B. 1998. Principles and Practice of Structural Equation Modeling. New York: The Guilford Press. [Google Scholar]
- Kline, Rex B. 2005. Principles and Practice of Structural Equation Modeling, 2nd ed. New York: Guilford Press. [Google Scholar]
- Koponen, Jonna, Saara Julkunen, and Akiko Asai. 2019. Sales communication competence in international B2B solution selling. Industrial Marketing Management 82: 238–52. [Google Scholar] [CrossRef]
- Kozielski, Robert, Michał Dziekoński, Michał Medowski, Jacek Pogorzelski, and Marcin Ostachowski. 2017. Sales and Distribution Management Metrics. In Mastering Market Analytics. Edited by Robert Kozielski. Leeds: Emerald Publishing Limited, pp. 113–99. [Google Scholar] [CrossRef]
- Langley, Paul, and Alison Rieple. 2024. How managers’ perceptions about dynamic complexity change: Sensemaking catalyzed by shock and surprise. Management Decision 62: 1169–88. [Google Scholar] [CrossRef]
- Lu, Qicheng, Xiangju Meng, Jiaoyue Su, Alan Au Kai Ming, Yongjie Wu, and Chengqi Wang. 2023. TMT functional background heterogeneity and SMEs’ performance: The role of dynamic capabilities and business environment. Journal of Business Research 160: 113807. [Google Scholar] [CrossRef]
- Lulaj, Enkeleda. 2021. Quality and reflecting of financial position: An enterprises model through logistic regression and natural logarithm. Journal of Economic Development, Environment and PeopleVolume 10: 26–50. [Google Scholar] [CrossRef]
- Lulaj, Enkeleda. 2023. A sustainable business profit through customers and its impacts on three key business domains: Technology, innovation, and service (TIS). Business, Management and Economics Engineering 21: 19–47. [Google Scholar] [CrossRef]
- Lulaj, Enkeleda. 2024. Money Talks: A Holistic and Longitudinal View of the Budget Basket in the Face of Climate Change and Sustainable Finance Matters. Ekonomika 103: 91–107. [Google Scholar] [CrossRef]
- Lulaj, Enkeleda, Aishwarya Gopalakrishnan, and Kafayat Kehinde. 2024a. Financing and Investing in Women-led Businesses: Understanding Strategic Profits and Entrepreneurial Expectations by Analysing the Factors that Determine Their Company Success. Periodica Polytechnica Social and Management Sciences. Available online: https://pp.bme.hu/so/article/view/22532 (accessed on 29 August 2024).
- Lulaj, Enkeleda, and Blerta Dragusha. 2022. Incomes, Gaps and Well-Being: An Exploration of Direct Tax Income Statements Before and during COVID-19 Through the Comparability Interval. International Journal of Professional Business Review 7: e0623. [Google Scholar] [CrossRef]
- Lulaj, Enkeleda, and Etem Iseni. 2018. Role of Analysis CVP (Cost-Volume-Profit) as Important Indicator for Planning and Making Decisions in the Business Environment. European Journal of Economics and Business Studies 4: 99–114. [Google Scholar] [CrossRef]
- Lulaj, Enkeleda, Blerta Dragusha, and Eglantina Hysa. 2023. Investigating Accounting Factors through Audited Financial Statements in Businesses toward a Circular Economy: Why a Sustainable Profit through Qualified Staff and Investment in Technology? Administrative Sciences 13: 72. [Google Scholar] [CrossRef]
- Lulaj, Enkeleda, Blerta Dragusha, Eglantina Hysa, and Marian Catalin Voica. 2024b. Synergizing Sustainability and Financial Prosperity: Unraveling the Structure of Business Profit Growth through Consumer-Centric Strategies—The Cases of Kosovo and Albania. International Journal of Financial Studies 12: 35. [Google Scholar] [CrossRef]
- Lulaj, Enkeleda, Mirela Tase, Conceição Gomes, and Lucília Cardoso. 2024c. Navigating Financial Frontiers in the Tourism Economies of Kosovo and Albania during and beyond COVID-19. Journal of Risk and Financial Management 17: 142. [Google Scholar] [CrossRef]
- MacCallum, Robert C., Michael W. Browne, and Hazuki M. Sugawara. 1996. Power analysis and determination of sample size for covariance structure modeling. Psychological Methods 1: 130–49. [Google Scholar] [CrossRef]
- Marsh, Herbert W., and Dennis Hocevar. 1985. Application of Confirmatory Factor Analysis to the Study of Self-Concept: First- and Higher-Order Factor Models and Their Invariance across Groups. Psychological Bulletin 97: 562–82. [Google Scholar] [CrossRef]
- McDonald, Roderick P., and Herbert W. Marsh. 1990. Choosing a Multivariate Model: Noncentrality and Goodness of Fit. Psychological Bulletin 107: 247–55. [Google Scholar] [CrossRef]
- Medhurst, Adrian R., and Simon L. Albrecht. 2016. Salesperson work engagement and flow: A qualitative exploration of their antecedents and relationship. Qualitative Research in Organizations and Management 11: 22–45. [Google Scholar] [CrossRef]
- Mercer, Marlee E. 2024. The impact of flexible work arrangements on an older grieving population. Society and Business Review. ahead-of-print. [Google Scholar] [CrossRef]
- Morgan, Todd, Wesley Friske, Marko Kohtamäki, and Paul Mills. 2024. Customer participation in manufacturing firms’ new service development: The moderating role of CRM technology. Journal of Business & Industrial Marketing 369: 857–70. [Google Scholar] [CrossRef]
- Mulaik, Stanley A. 2009. Factor Scores and Factor Indeterminacy. Foundations of Factor Analysis, 2nd ed. London: Chapman and Hall/CRC, pp. 369–404. [Google Scholar]
- Mulaik, Stanley A., Larry R. James, Judith Van Alstine, Nathan Bennett, Sherri Lind, and C. Dean Stilwell. 1989. Evaluation of goodness-of-fit indices for structural equation models. Psychological Bulletin 105: 430–45. [Google Scholar] [CrossRef]
- Mullen, Cormac, and Jenny Berrill. 2015. Minoritynationals: An empirical analysis of the concentration of geographic sales expansion in MNCs. Multinational Business Review 23: 277–305. [Google Scholar] [CrossRef]
- Nansubuga, Brenda, and Christian Kowalkowski. 2024. Moving to subscriptions: Service growth through business model innovation in consumer and business markets. Journal of Service Management 35: 185–215. [Google Scholar] [CrossRef]
- Park, Hyewon, Won-Moo Hur, and Seongho Kang. 2023. Contribution of sales control in salespeople’s creative selling: Work engagement as a mediator. Journal of Retailing and Consumer Services 75: 103491. [Google Scholar] [CrossRef]
- Peesker, Karen M., Lynette J. Ryals, and Peter D. Kerr. 2024. Toward an understanding of the personal traits needed in a digital selling environment. Journal of Business & Industrial Marketing 39: 1687–703. [Google Scholar] [CrossRef]
- Peesker, Karen M., Peter D. Kerr, Willy Bolander, Lynette J. Ryals, Jonathan A. Lister, and Howard F. Dover. 2022. Hiring for sales success: The emerging importance of salesperson analytical skills. Journal of Business Research 144: 17–30. [Google Scholar] [CrossRef]
- Pereira, Daniel Filipe, José Fernando Oliveira, and Maria Antónia Carravilla. 2023. Design of a sales plan in a hybrid contractual and non-contractual context in a setting of limited capacity: A robust approach. International Journal of Production Economics 260: 108867. [Google Scholar] [CrossRef]
- Rayburn, Steven W., Vishag Badrinarayanan, Sidney T. Anderson, and Aditya Gupta. 2021. Continuous techno-training and business-to-business salesperson success: How boosting techno-efficacy enhances sales effort and performance. Journal of Business Research 133: 66–78. [Google Scholar] [CrossRef]
- Reed, Jonathan H. 2023. Modeling and measuring strategic alignment. Journal of Strategy and Management 16: 654–71. [Google Scholar] [CrossRef]
- Reichstein-Scholz, Harriet, Axèle Giroud, Mo Yamin, and Ulf Andersson. 2021. Sales to centre stage! Determinants of the division in strategic sales decisions within the MNE. International Business Review 30: 101859. [Google Scholar] [CrossRef]
- Rice, John, Nigel Martin, Muhammad Mustafa Raziq, Mumtaz Ali Memon, and Peter Fieger. 2024. Strategic planning, budget monitoring and growth optimism: Evidence from Australian SMEs. European Business Review. ahead-of-print. [Google Scholar] [CrossRef]
- Rothkopf, Alexander, and Richard Pibernik. 2016. Maverick buying: Eliminate, participate, leverage? International Journal of Production Economics 179: 77–89. [Google Scholar] [CrossRef]
- Seker, Sukran. 2024. Evaluation of agile attributes for low-cost carriers to achieve sustainable development using an integrated MCDM approach. Management Decision. ahead-of-print. [Google Scholar] [CrossRef]
- Sharma, Archana, and Mahim Sagar. 2023. Exploring new-product selling challenges in the FMCG sector: A qualitative method approach. Qualitative Market Research 26: 494–533. [Google Scholar] [CrossRef]
- Singh, Ramendra Pratap, Ramendra Singh, and Prashant Mishra. 2021. Does managing customer accounts receivable impact customer relationships, and sales performance? An empirical investigation. Journal of Retailing and Consumer Services 60: 102460. [Google Scholar] [CrossRef]
- Spearman, Charles Edward. 1927. The Abilities of Man. New York: MacMillan. [Google Scholar]
- Steiger, James H. 1980. Statistically-Based Tests for the Number of Common Factors. Paper presented at the Annual Meeting of the Psychometric Society, Iowa City, IA, USA, May 27–29. [Google Scholar]
- Steiger, James H. 1990. Structural Model Evaluation and Modification: An Interval Estimation Approach. Multivariate Behavioral Research 25: 173–80. [Google Scholar] [CrossRef]
- Sun, Mingyao, Chi To Ng, Liu Yang, and Tianhua Zhang. 2024. Optimal after-sales service offering strategy: Additive manufacturing, traditional manufacturing, or hybrid? International Journal of Production Economics 268: 109116. [Google Scholar] [CrossRef]
- Tabachnick, Barbara G., and Linda S. Fidell. 2006. Using Multivariate Statistics, 5th ed. New York: Allyn and Bacon. [Google Scholar]
- Tavakoli, Gholamreza, Majid Feyz Arefi, Omid Heidari, and Masoumeh Mirjafari. 2016. Designing conceptual model of after-sales services, in companies producing the capital goods, with the idea of value co-creation. International Journal of Quality and Service Sciences 8: 122–42. [Google Scholar] [CrossRef]
- Tong, Tingting, Xun Xu, Nina Yan, and Jianjun Xu. 2022. Impact of different platform promotions on online sales and conversion rate: The role of business model and product line length. Decision Support Systems 156: 113746. [Google Scholar] [CrossRef]
- Trentin, Alessio, Elisa Perin, and Cipriano Forza. 2013. Sales configurator capabilities to avoid the product variety paradox: Construct development and validation. Computers in Industry 64: 436–47. [Google Scholar] [CrossRef]
- Vagtborg, Frederik Hejselbjerg. 2024. Corporate Responsiveness and Sustainability Transition: Insights from a Danish–Malaysian Palm Oil Multinational*. In Sustainable and Resilient Global Practices: Advances in Responsiveness and Adaptation (Emerald Studies in Global Strategic Responsiveness). Edited by Torben Juul Andersen. Leeds: Emerald Publishing Limited, pp. 149–91. [Google Scholar] [CrossRef]
- Vilkamo, Tiina, and Thomas Keil. 2003. Strategic technology partnering in high-velocity environments—Lessons from a case study. Technovation 23: 193–204. [Google Scholar] [CrossRef]
- Wacker, John G., and Rhonda R. Lummus. 2002. Sales forecasting for strategic resource planning. International Journal of Operations & Production Management 22: 1014–31. [Google Scholar] [CrossRef]
- Wang, Weiting, Yi Liao, and Jiacan Li. 2024. Delegation and salary information disclosure strategies of customer acquisition and retention. Nankai Business Review International. ahead-of-print. [Google Scholar] [CrossRef]
- Wei, Shaobo, Chengnan Deng, Hua Liu, and Xiayu Chen. 2024. Supply chain concentration and financial performance: The moderating roles of marketing and operational capabilities. Journal of Enterprise Information Management 37: 1161–84. [Google Scholar] [CrossRef]
- West, Richard F., Russell J. Meserve, and Keith E. Stanovich. 2012. Cognitive sophistication does not attenuate the bias blind spot. Journal of Personality and Social Psychology 103: 506–19. [Google Scholar] [CrossRef]
- Xi, Xuan, and Yulin Zhang. 2023. The interplay between marketplace channel addition and pricing strategy in an e-commerce supply chain. International Journal of Production Economics 258: 108807. [Google Scholar] [CrossRef]
- Xie, Huailing, Xiaodong Xu, and Yuan-Teng Hsu. 2023. Does disclosure of customers’ identities benefit a company’s performance in the product market? Evidence from China. Pacific-Basin Finance Journal 82: 102180. [Google Scholar] [CrossRef]
- Yang, Hai, Chaoyi Shao, Hai Wang, and Jieping Y. 2020. Integrated reward scheme and surge pricing in a ridesourcing market. Transportation Research Part B: Methodological 134: 126–42. [Google Scholar] [CrossRef]
- Zhang, Haili, and Michael Song. 2024. Elevating service startup survival through strategic service quality. International Journal of Quality and Service Sciences. ahead-of-print. [Google Scholar] [CrossRef]
- Zheng, Xuyun, and Zheng Pan. 2022. Responding to import surges: Price transmission from international to local soybean markets. International Review of Economics & Finance 82: 584–97. [Google Scholar] [CrossRef]
- Zheng, Yu Hao, Guicheng Shi, Hao Zhong, Matthew Tingchi Liu, and Zixiao Lin. 2023. Motivating strategic front-line employees for innovative sales in the digital transformation era: The mediating role of salesperson learning. Technological Forecasting and Social Change 193: 122593. [Google Scholar] [CrossRef]
Disclaimer/Publisher’s Note: The statements, opinions and data contained in all publications are solely those of the individual author(s) and contributor(s) and not of MDPI and/or the editor(s). MDPI and/or the editor(s) disclaim responsibility for any injury to people or property resulting from any ideas, methods, instructions or products referred to in the content. |
© 2024 by the authors. Licensee MDPI, Basel, Switzerland. This article is an open access article distributed under the terms and conditions of the Creative Commons Attribution (CC BY) license (https://creativecommons.org/licenses/by/4.0/).