Abstract
Countries are confronting climate change using climate-related regulations that require firms and investors to disclose their green strategies and activities. Using the Meta-Analysis Structural Equation Modeling (MASEM) technique, this study evaluates the relationship between climate-related regulations and financial markets. The meta-regression analysis is conducted based on the outcomes of 52 empirical studies screened from 143 relevant articles. The results show the predictive power of the climate-related disclosure (CRD) laws and environmental regulations (ERs) on financial performance across all studies. ERs create mixed impacts on the equity market and support the debt market. Firm value is affected by ERs either negatively or positively. Methodologies and risk-related factors (market, industry, and firm risks) are important in explaining the relationships between ER/CRD and financial performance. The more developed the market, the less the impact of ERs and CRD on the equity market. Considering industry risk is recommended because different industries are exposed to changes in policies differently. The ER/CRD–firm value relationship is affected by all market, industry, and firm risks. The downside effect of mandatory CRD on the equity market suggests that policy makers, firms, and investors should be cautious in passing a new CRD regulation for transformation towards a sustainable economy.
1. Introduction
To confront climate change, governments recommended firms to disclose their green activities. Recently, a few countries have made climate reporting mandatory. New Zealand (2021), France (2021), and Japan (2022) enacted the mandatory climate-related disclosures (CRD) regulation. More countries are considering CRD regulations such as the United States, the United Kingdom, Canada, China, Switzerland, Singapore, and Hong Kong. Although disclosing green activities is not new to firms, making this activity mandatory requires them to re-structure their businesses with more effort and resources to comply with the new regulation. Thus, there is a need to explain how important CRD regulations are to firms and financial markets. By understanding how climate-related regulations affect financial markets, we can clarify whether disclosing firms’ green activities will fulfil their chain of responsibilities in confronting climate change or weaken businesses and economies that do not always sustain high growth rates over time. The findings enhance decisions on CRD (mandatory or not), which is useful for policy makers and firms in protecting the natural environment and sustaining the economy at the same time.
Against this background, we reviewed the impacts of environmental regulations (ERs) and CRD laws on the financial performance of equity, debt, and firm value. We use the Meta-Analysis Structural Equation Modeling (MASEM) technique to conduct the meta-regression analysis based on the outcomes of 52 empirical studies from two dominant databases (the Web of Science core collection and Scopus). The main research objective of our study evaluates the relationship between climate-related regulations and financial performance, thus our study contributes to existing knowledge beyond synthesizing previous findings by identifying new patterns and offering policy recommendations. The novelty of this study is threefold. First, our study adopts the MASEM methodology that outperforms the conventional approach with narrative review to obtain common inferences. We use statistical estimates and findings of previous studies to identify the patterns among the results and other interesting relationships. Therefore, this study performs an accurate and theory-driven quantitative review to verify the magnitude of causal relationships between climate-related regulations on the financial markets from the literature. Second, we confirm the predictive power of the ERs and CRD on financial performance across all studies. Particularly, the downside effect of mandatory CRD on the equity market suggests that policy makers, firms, and investors should be cautious in passing a new CRD regulation for transformation towards a sustainable economy. Third, we examine the effects of methodology (sample size, data frequency, number of countries, and type of statistical analysis) and risk-related factors (market, industry, and firm) on the relationships between ER/CRD and the firms’ financial performance. The findings show strong evidence of the methodology and risk effects on the ER/CRD and firms’ financial performance relationship. For example, the more developed the market, the less the impact of ERs and CRD on the equity market. The ER/CRD–firm value relationship is affected by all market, industry, and firm risks. Our findings suggest that future studies should consider the effects of different risks in evaluating how environmental regulations, especially climate-related reporting laws may create a shock on the financial markets.
2. Literature Review and Hypotheses Development
2.1. Environmental Regulation
As global climate change intensifies and the disasters it causes increase, protecting the environment has become a common concern for governments and all sectors of society. At the High-Level Meeting on Climate and Sustainable Development (2019), the UN Secretary-General António Guterres remarks that: “Climate change is happening now and it affects us all. Every week, new examples of climate-related disasters emerge. No country or community is immune”. Some countries have demonstrated their high level of commitment to climate change through several policies and regulations aimed at addressing climate change, such as the EU Climate Change Adaptation Strategy (2013) and the Strategy for a Clean Planet for All (2018). These regulations and policies exert pressure on companies to adopt climate change-mitigating strategies (Birindelli and Chiappini 2021).
Environmental regulation refers to the means by which the government promulgates laws and regulations relating to environmental protection, or formulates relevant rules and regulations, to encourage enterprises to disclose environmental information and strengthen environmental protection, so that the public, investors and other stakeholders can be aware of how enterprises are fulfilling their environmental responsibilities. While environmental regulation has ecological effects, it also affects the economic behavior of enterprises. The goal of environmental regulation is to achieve long-term harmony between economic development and environmental protection by adjusting the mode of economic development to improve overall social welfare (Javeed et al. 2020).
Scholars have extensively discussed the impact of environmental regulation on financial markets. Some scholars argue that there is a mutually constraining relationship between environmental performance and enterprise development, making it difficult to achieve a win–win situation. For example, Rassier and Earnhart (2010) reveal that non-core environmental expenditures inevitably increase firms’ production costs, crowding out firms’ day-to-day production resources, and environmental regulations that require firms to reduce pollution beyond the maximum efficiency level lead to lower maximum efficiency. Well-designed environmental regulations can induce “innovation offsets”, leading to voluntary over-compliance. The lagged effect of regulatory stringency on financial performance suggests that there may be a lagged effect in the relationship between regulatory stringency and expected future financial performance. With the increase in business risks and the decrease in business performance, the risk expectations of market investors and credit institutions towards enterprises will also increase, leading to a decrease in market investment and credit financing of enterprises (Liu et al. 2018).
Ramiah et al. (2013) examine the impact of 19 environmental regulatory announcements on ASX-listed stocks between 2005 and 2011. The Australian stock market was particularly sensitive to the Carbon Pollution Reduction Scheme (CPRS) announcements, with significant variation across sectors and significant changes in short-term systematic risk across a wider range of sectors. Ramiah et al. (2016) investigate the impact of 75 environmental policy announcements in the UK stock market over the period 2003–2012, with cumulative abnormal returns of 30–40 percent in certain sectors. The authors find that environmental policies cause changes in the systematic risk of firms in both the short and long run.
Liu et al. (2018) review the enactment of China’s new environmental protection law in 2012 as a point in time, and collect relevant data in the first three years and the second three years to analyze the impact of the law on the financing of highly polluting firms. The authors’ results show that the coefficient of pollution regulation is significantly negative in the overinvestment group, indicating that since the new environmental protection law was enacted, highly polluting firms have reduced their overinvestment behavior by 1.3%. Following the enactment of the new Environmental Protection Law, Chinese-listed companies face higher environmental regulatory costs, public pressure and environmental litigation. The financing ability of highly polluting companies has decreased significantly, especially in regions with higher regulatory intensity.
On the other hand, some scholars see no conflict between environmental performance and business development, and that both can be achieved. The literature argued that increased environmental regulation can exert external pressure on firms and create internal incentives for firms to innovate with green technologies. As the output of green innovation increases, it contributes to improved firm performance. (Colombelli et al. 2020) find that stringent environmental regulations can increase the demand for green technologies and create new market niches, and in this framework, firms that are able to generate green technologies are expected to perform better in the stock market.
2.2. Climate-Related Disclosure
With the increasing complexity of climate change, disclosing climate information is becoming more and more important to achieve sustainable development. Internationally, to increase global attention to climate change and promote the low-carbon transformation of enterprises to meet the needs of stakeholders for the potential financial impacts of climate change, the Task Force on Climate-Related Financial Disclosures (TCFD) proposed a framework for disclosing climate-related financial information in June 2017. The TCFD has continuously refined this framework, requiring organizations to quantify the financial impacts of climate risks from a financial perspective, identify corresponding opportunities, and promote organizations to actively respond to climate-related financial risks in the context of climate change and extreme weather events. The overall goal is to encourage organizations to pay attention to ecological environmental protection, mitigate and adapt to climate change, fulfill social responsibilities, and improve governance under sustainable development goals to enhance future health, stability, and transformative development (Bowan and Wiseman 2020). TCFD recommends that preparers of climate-related financial disclosures from organizations provide disclosures of climate-related financial risks in their annual financial disclosure reports. The proposed structure of the TCFD is organized around four thematic areas that represent the core elements of an organization’s operations—governance, strategy, risk management, and metrics and objectives (Amar et al. 2022).
The International Corporate Governance Network (ICGN) points out that environmental disclosure is important for investors to assess the future risk, opportunity and value of a firm (Solomon and Lewis 2002). Therefore, environmental information disclosure has gradually become a new type of effective environmental management tools. Disclosure of environmental information refers to companies that may exhibit certain negative impacts on the environment in their daily production and operations, and companies have a responsibility to disclose relevant information to the public and other stakeholders. Relevant information includes the company’s handling of environmental problems, the implementation of the environmental protection system, and disclosing the occurrence of major environmental problems and their impacts. In terms of the content of environmental accounting information disclosed by companies, not only positive and active information should be included, but also negative and neutral information. Quantitative information related to finance is more informative for external stakeholders (Dhaliwal et al. 2014). The quality of environmental information disclosure not only reflects to a certain extent whether the company has fully fulfilled its environmental responsibilities, but also concerns the personal interests of investors. Through the quality of environmental information disclosed by the enterprise, investors can obtain information related to the environmental risks of the enterprise and incorporate it into their investment decision making. As a result of the physical impacts of climate change or the risks and opportunities of the transition to a low-carbon economy, companies are making strategic decisions about how to respond. For some companies, the risks and opportunities are immediate and easily identifiable; for others, they may be less immediate, present in their wider value chain and less visible (Charkham 1992). Gans and Hintermann (2013) found that voluntary environmental information disclosure is conducive to voluntary emissions reductions, which not only benefits enterprises and shareholders but also contributes to environmental protection. Voluntary emission reductions can reduce future compliance costs and increase firm value. However, some scholars argue that the quality of environmental disclosure has a negative market effect. For example, Shane and Spicer (1983) found that firms’ stock prices declined after firms disclosed corporate environmental information to the public, and Freedman and Jaggi (1982) argued that the quality of environmental disclosure has a negative market effect. Given the risks that climate change may pose to companies, there is a growing call for companies to disclose their exposure to the physical impacts of climate change and the risks of transitioning to a low-carbon economy. Climate-related disclosure will help companies prepare for the impacts of climate change and help investors understand the risks so that they can make more informed investment decisions (Clarkson et al. 2010).
2.3. The Theoretical Model
The previous findings of the effects of ERs and CRD on the firms’ financial performance are not consistent, which requires a literature review to confirm the magnitude and significance of the research outcomes. Figure 1 presents the theoretical model, which consists of four performances regarding the ERs and CRD impacts on economic performance (Porter 1990; Khanna and Damon 1999), social performance (Shu and Tan 2023), environmental performance (Porter 1990; Khanna and Damon 1999; Al-Tuwaijri et al. 2004), and financial performance (Dowell et al. 2000; Rassier and Earnhart 2010; Pham et al. 2020). For example, the ‘Porter hypothesis’ suggests that stricter and more rational policies will encourage firms to innovate and create an ‘innovation dividend’ (Porter 1990). This not only improves environmental performance, but also offsets some of the environmental costs and increases the core technological competitiveness of firms. In the process of technological innovation, firms will be able to increase their productivity, optimize the allocation of resources and increase the supply of new products. The adoption of advanced cleaner production technologies can achieve a win–win situation for both the production and the environment. The positive impact of environmental regulations on green innovation has a certain time lag, i.e., the “crowding out” effect of environmental protection inputs dominates in the initial stage, crowding out investment in technological innovation, and environmental regulations have a negative impact on green productivity. However, in the long run, environmental regulations will stimulate innovation, generate “innovation compensation” and offset “regulatory costs”, thus creating a win–win situation to enhance the economic and environmental performance.
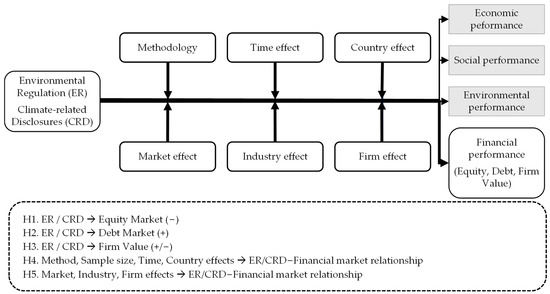
Figure 1.
The theoretical model. Source: Authors’ illustration.
The impacts of new regulations on firms’ economic, social, and environmental performance have a certain time lag (Porter 1990), where financial markets immediately react to new information based on the efficient market hypothesis EMH (Fama 1970). Therefore, we focus on the effects of ERs and CRD on the financial performance of equity, debt, and firm value in our study. The impacts of environmental regulation and climate-related disclosure on the financial markets may be limited by a variety of factors such as methodology and risk-related factors. For example, using a study sample from a developed or developing market determines the significance and magnitude of the relation between a climate-related regulation and financial performance (Horváthová 2010). Industry risks are important because different industries are exposed to different types of risks caused by changes in government policies (Rassier and Earnhart 2010). We adopt a meta-analytic approach to further explore the impact of ER/CRD on financial markets and hypothesize the following relationships:
Hypothesis 1.
ER/CRD creates a negative shock on equity markets.
Hypothesis 2.
ER/CRD promotes debt markets and green finance.
Hypothesis 3.
ER/CRD affects firm value.
Hypothesis 4.
Methodology affects the relationship between ER/CRD and financial markets.
Hypothesis 5.
The market, industry, and firm characteristics impact the relationship between ER/CRD and financial markets.
3. Methodology
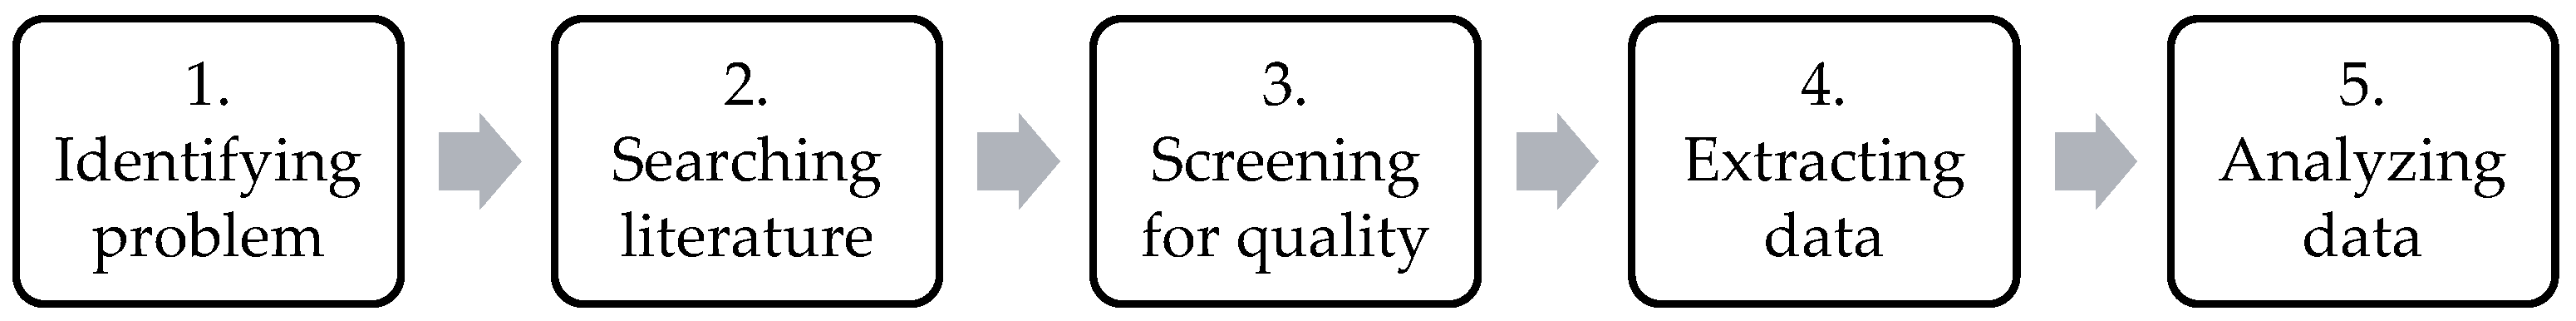
We adopted the correlation-based meta-analysis structural equation modelling (MASEM) technique from (Leong et al. 2023) in our study. The meta-analysis outperforms the conventional approach that is based on narrative review to obtain common inferences (Wu and Du 2012). According to (Paré et al. 2015) and (Templier and Paré 2018), the meta-analysis can test a theory based on the outcomes or relationships from different studies. The meta-analysis allows researchers to use statistical estimates to address measurement issues, sampling errors, inconsistent and insignificant results (Dwivedi et al. 2019). MASEM uses the findings of previous studies to identify the patterns among the results and sources of divergence in these results, as well as other interesting relationships. MASEM can perform an accurate and theory-driven quantitative review without requiring all variables or relationships stated by the theory must be assessed in every study (Dwivedi et al. 2019). Therefore, we use the MASEM approach to verify the magnitude of causal relationships and any inconsistencies in the outcomes of the impact of environment-related or CRD regulations on the financial markets in the previous empirical studies.
Figure 2 illustrates the data collection framework that consists of five stages. Stage 1 identifies the problem based on the literature that formed the theoretical model (see Figure 1) and the five hypotheses. This stage enables us to identify the types of information to be screened from relevant literature in the next stages.
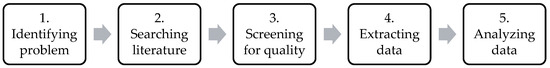
Figure 2.
Data collection framework. Source: Authors’ illustration.
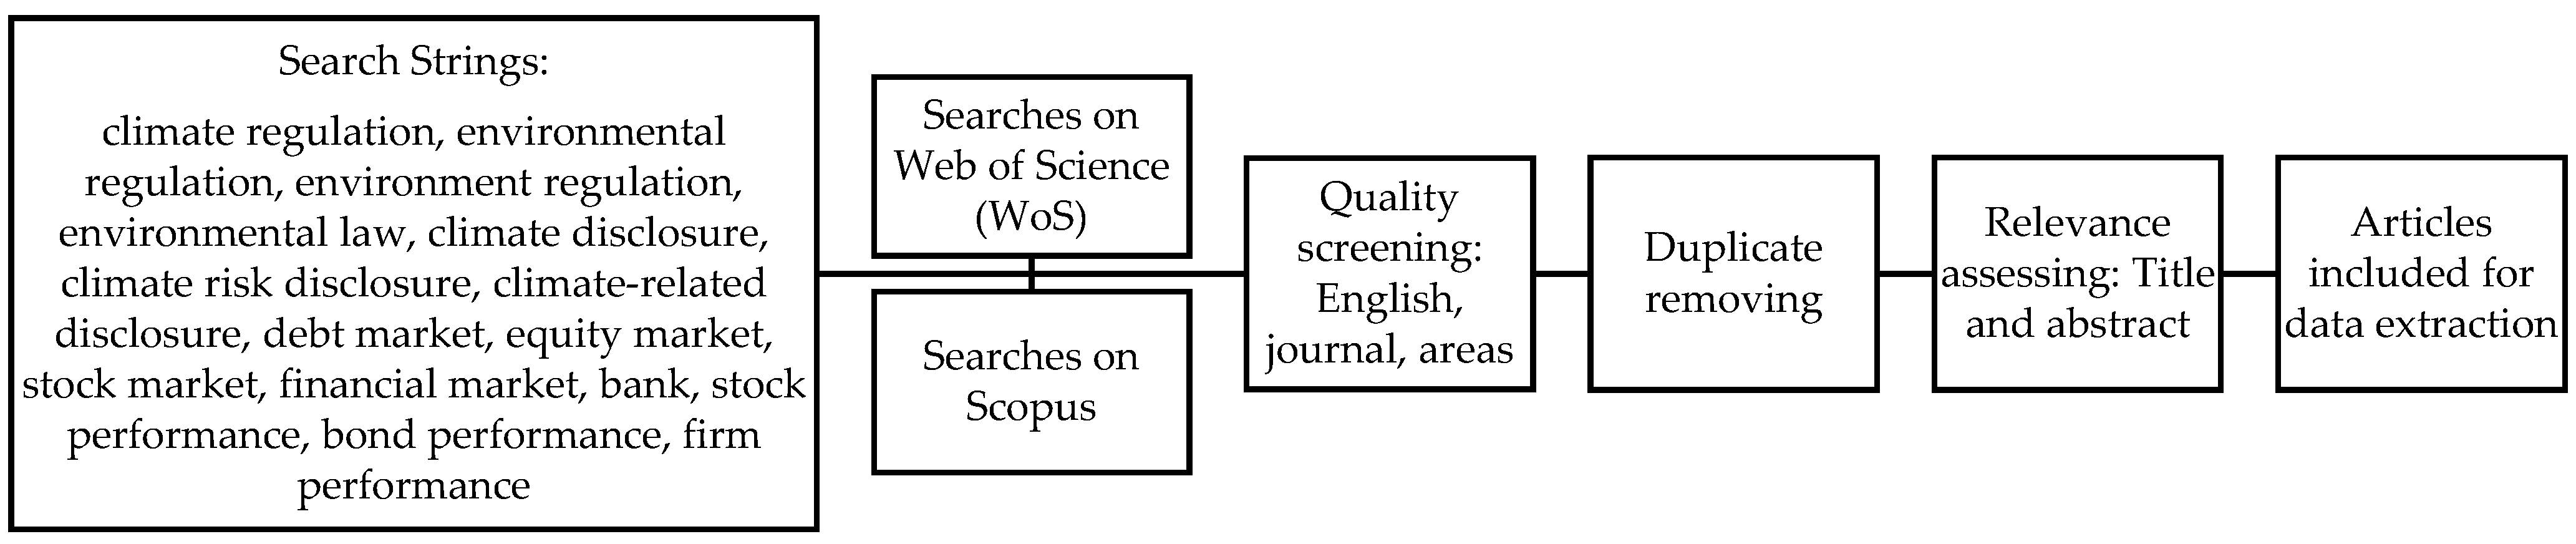
Figure 3 presents how we screen for quality empirical studies that are relevant to our research objectives in Stages 2 and 3. We search for published journal articles to the most recent (October 2023) from two dominant databases: the Web of Science (WoS) core collection and Scopus. A set of keyworks is used as the primary selection criteria to determine which articles should be included in our sample. The keyword combinations and variations are: “climate regulation”, “environmental regulation”, “environment regulation”, “environmental law”, “climate disclosure”, “climate risk disclosure”, or “climate-related disclosure”; and “debt market”, “equity market”, “stock market”, “financial market”, “bank”, “stock performance”, “bond performance”, or “firm performance”. These keywords are most used in referring to environment-related regulations and financial markets. Only peer-reviewed journal articles written in English in the areas of Economics, Environmental studies, Business, Business Finance, and Management are considered.
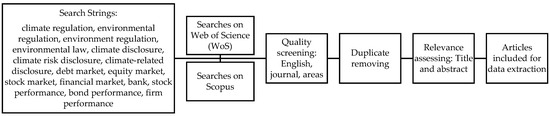
Figure 3.
Empirical study search and quality screening process. Source: Authors’ illustration.
The screening process yielded 271 documents—126 from WoS and 145 from Scopus. After removing 48 duplicates, we obtained 223 articles for the relevance assessing round. Based on the titles and abstracts, 80 unrelated articles were removed, leaving 143 articles for further review. Next, we conducted a thorough review by reading the article contents to include only empirical studies with statistical estimates that can be used for our meta-analysis using the MASEM technique. This context screening process retained 52 articles for data extraction (see Table 1).

Table 1.
List of articles used for meta-analysis.
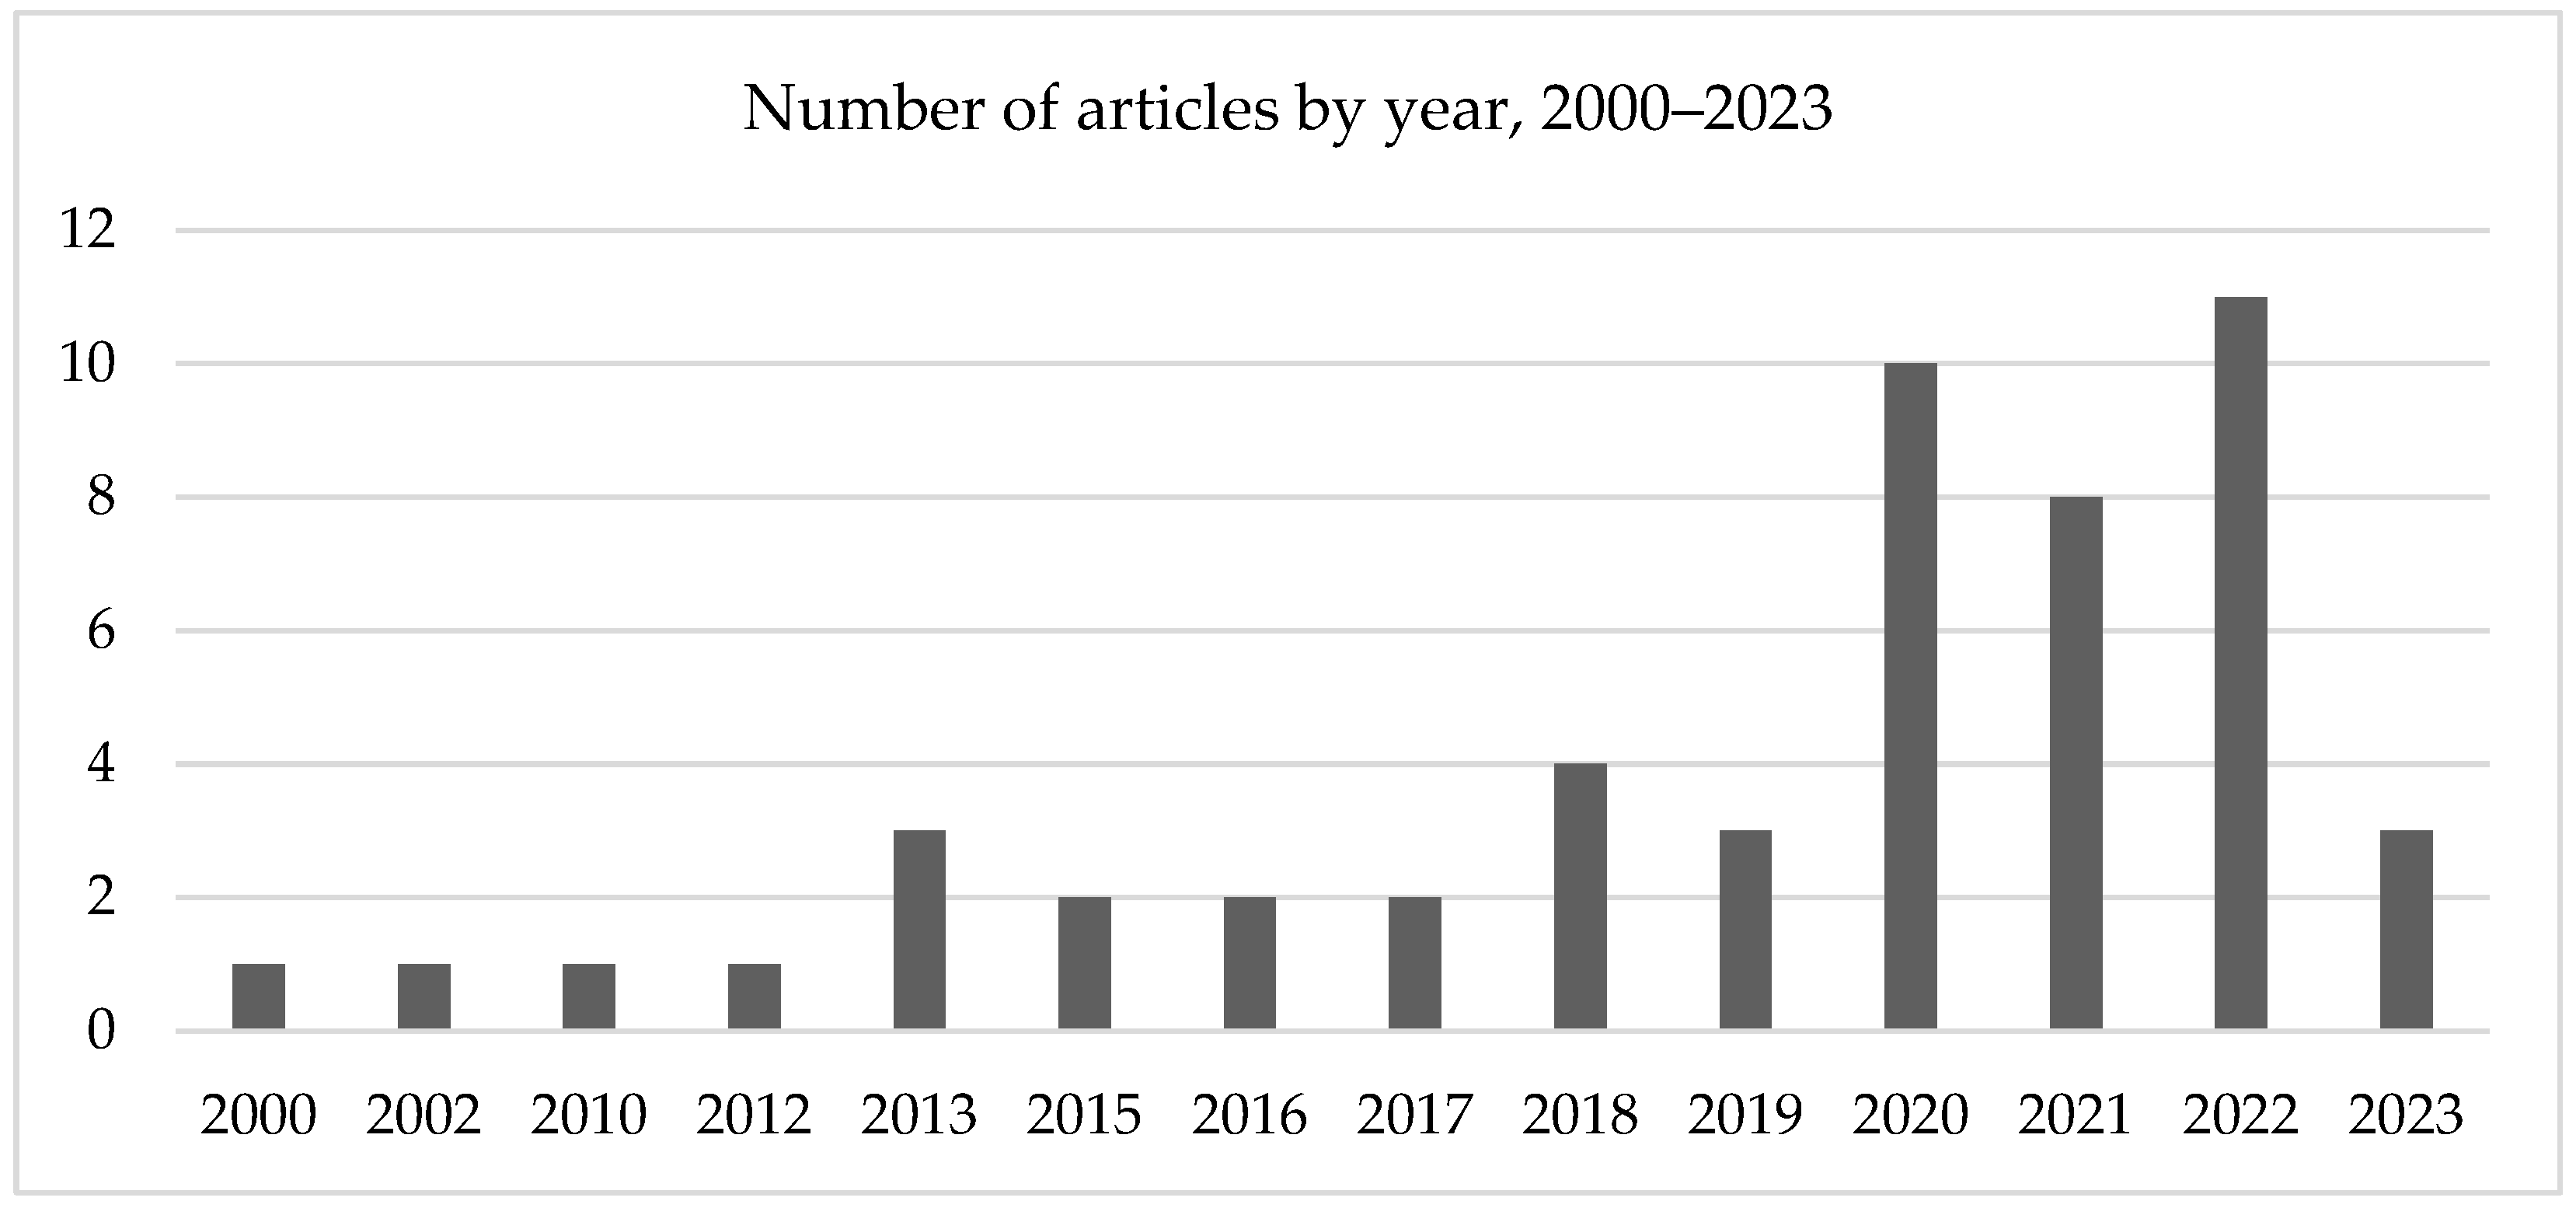
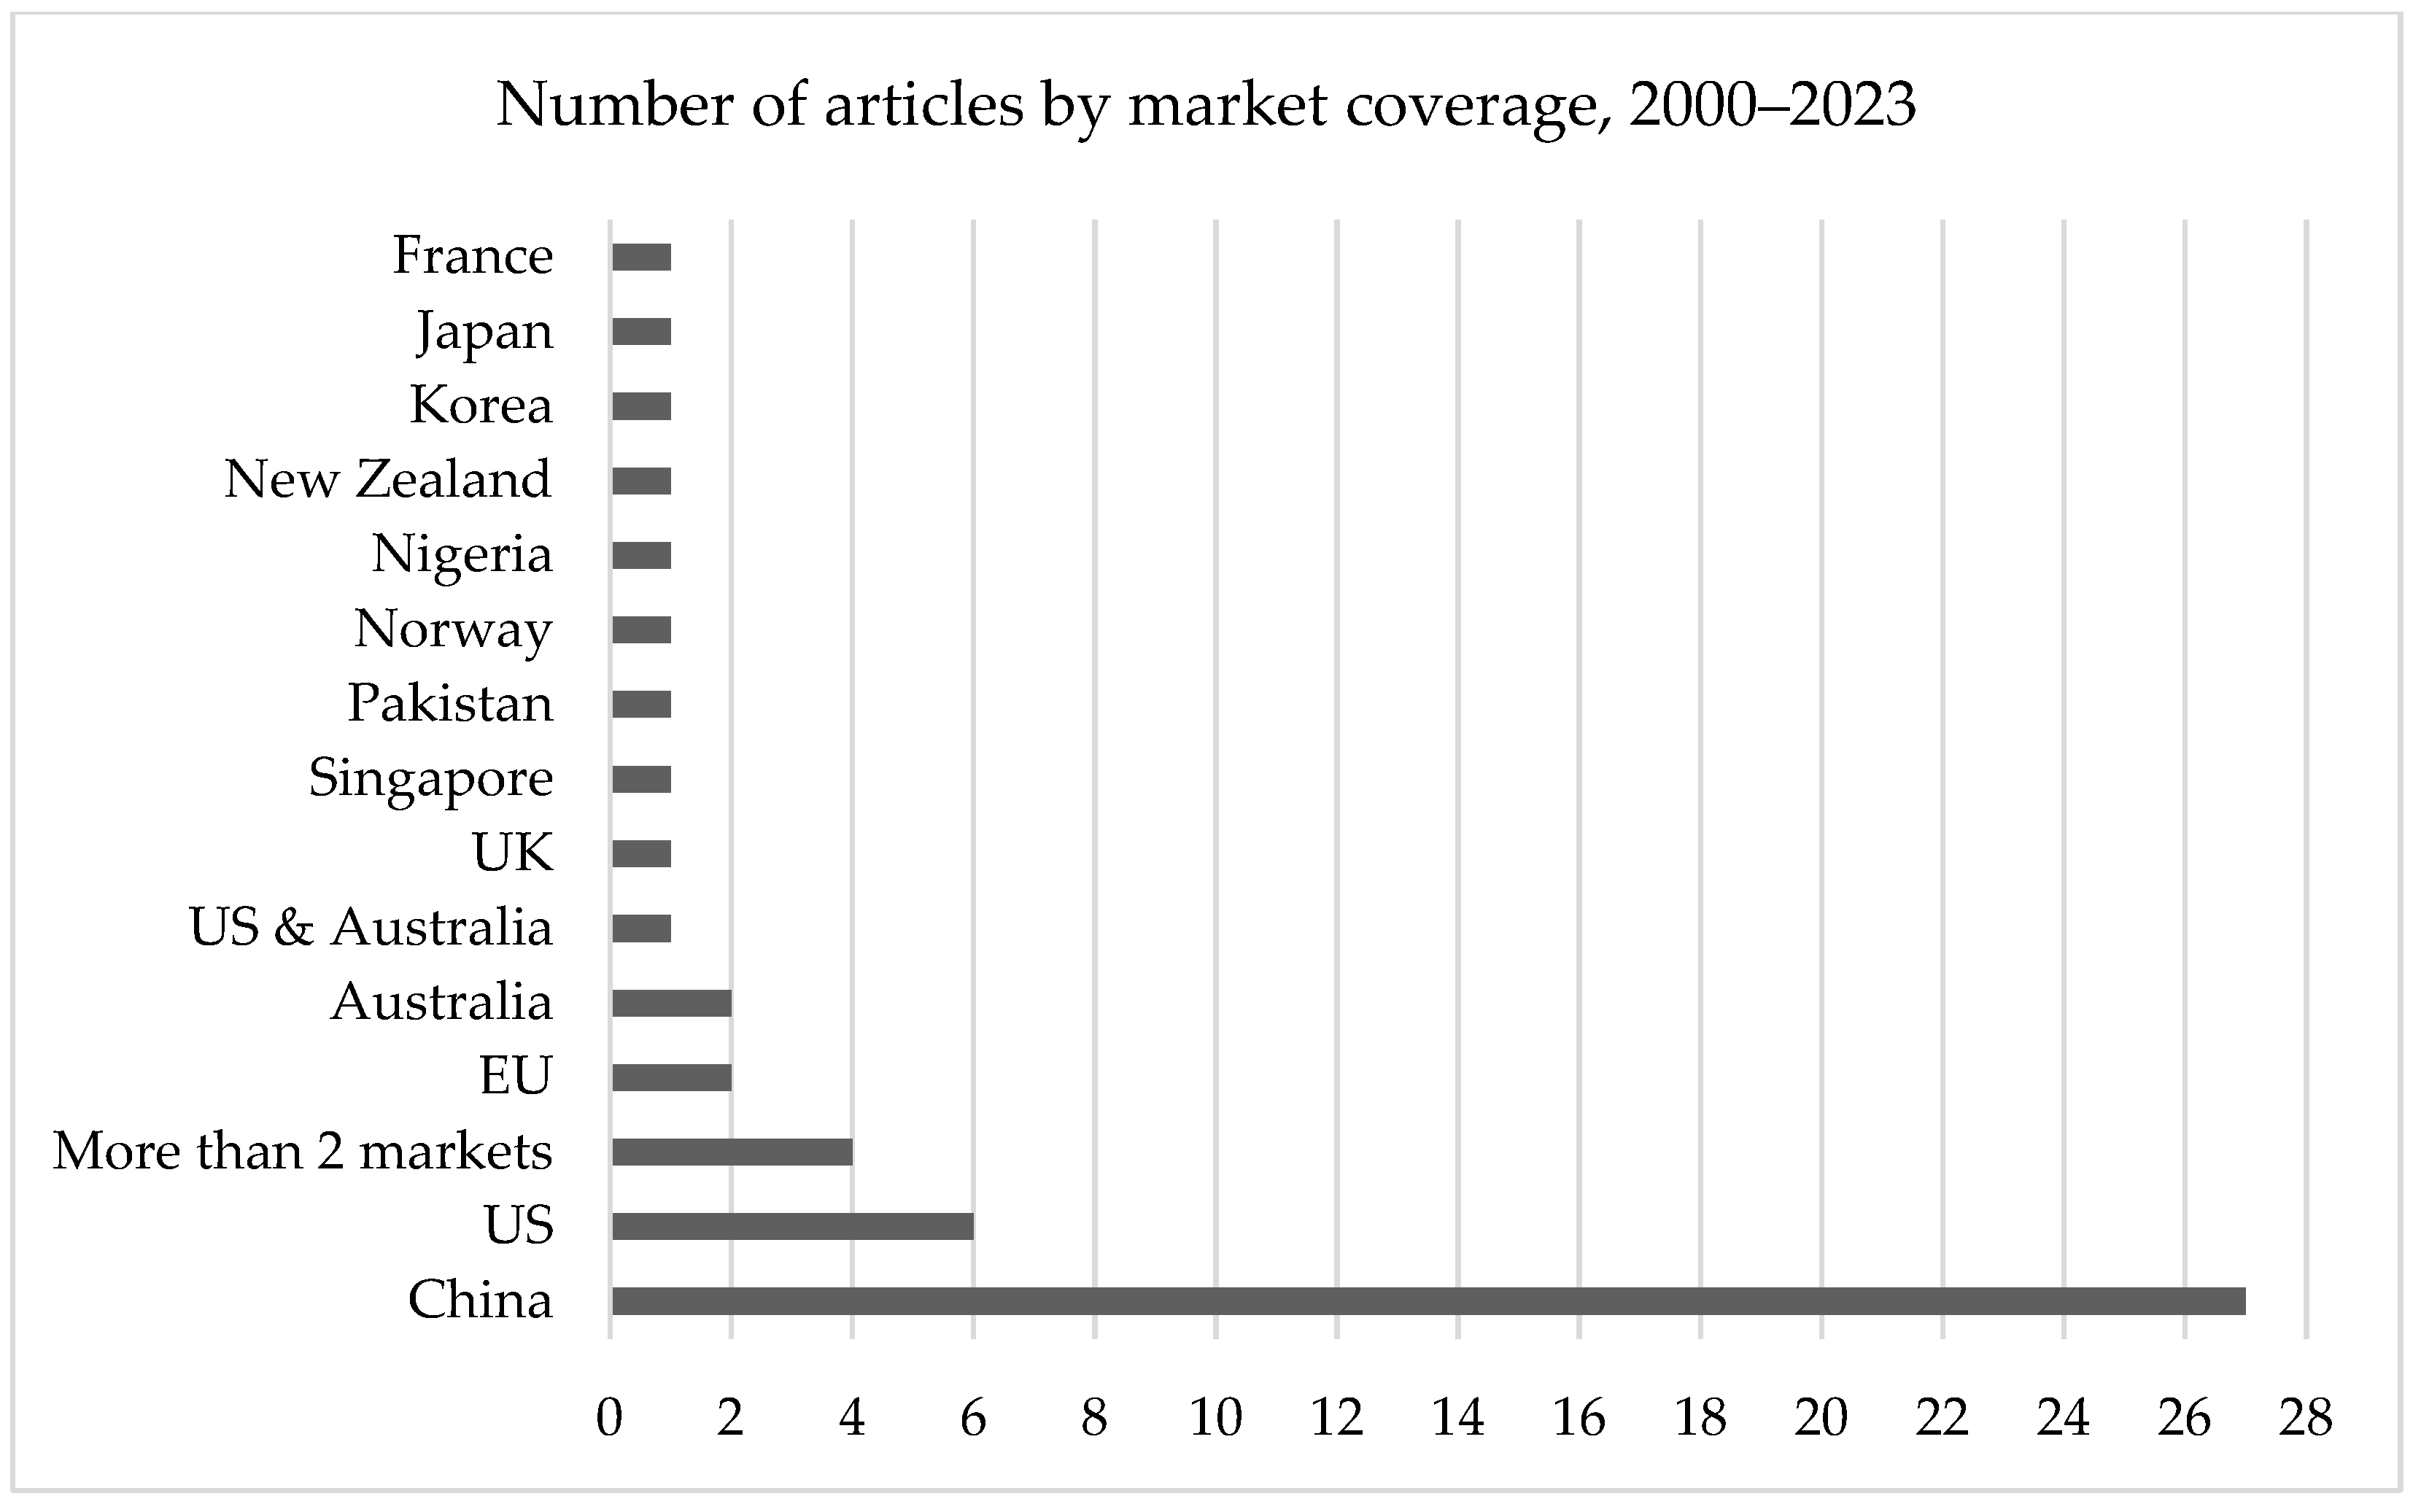
Figure 4 and Figure 5 present the number of empirical studies by year and market coverage from 2000 to 2023, respectively. The majority of the studies are conducted in China (27 of 52 articles or 52%) and published between 2018 and 2023 (39 of 52 articles or 75%). All studies were carefully reviewed to obtain the information such as sample size, data frequency, type of statistical analysis, country, market development, industry consideration, and firm effect. To estimate the regression path analysis and perform SEM analysis, we recorded regression coefficients, significant levels, and standard deviations of the impacts of environmental regulation and climate-related disclosure on financial performance by equity, debt, and firm value (or value in short).

Figure 4.
Number of studies by year, 2000–2023. Source: Authors’ illustration.
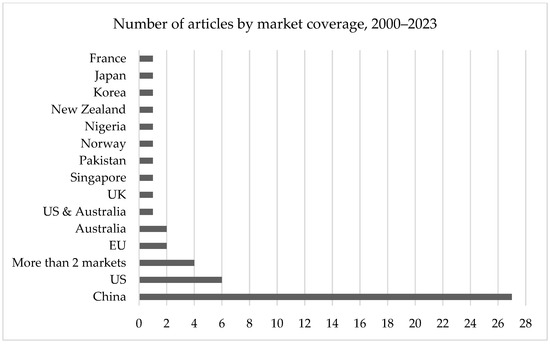
Figure 5.
Number of studies by market coverage, 2000–2023. Source: Authors’ illustration.
Table 2 describes the variable construction. We construct the first variable, environmental regulation (reg), to identify which studies focus on environmental regulation ER (reg = 1) or climate-related disclosure CRD (reg = 2). The second variable, financial performance (perform) is used to categorize the studies into four groups including Equity (perform = 1), Debt (perform = 2), Value (perform = 3), and Mixed (perform = 4) based on the studies’ effects of ER/CRD on a single group (equity, debt, or value) or mixed groups. There are six paths showing the impacts of ERs or CRD on the financial performance of each group: CRD → Perform (Equity), CRD → Perform (Debt), CRD → Perform (Value), ER → Perform (Equity), ER → Perform (Debt), and ER → Perform (Value). The regression coefficients and standard errors of the six paths were collected for our analysis. The 52 empirical studies used in our study consist of various methodologies, data, markets, and industry. Thus, we construct other variables to address the heterogeneity. Table 2 details the construction of these variables, in which, sample size effect (size), method effect (method), time effect (time), and country effect (country) are used to investigate the influence of methodology on the path outcomes. The last three variables, market development effect (market), industry effect consideration (industry), and firm effect (firm) are used to examine the effects of risk-related factors on the paths or relationships between ER/CRD and financial performance.
Table 2.
Variable construction.
4. Results
4.1. Reliability and Regression Path Analysis
The reliability analysis is used to examine a degree of construct reliability that shows the consistency and stability of the construct in the measurement model (Leong et al. 2023). We use Cronbach’s alpha for this analysis. Cronbach’s alpha reliability coefficient, known as composite reliability or rho_A (Hew et al. 2016; Leong et al. 2019), normally ranges between 0 and 1, with three levels of reliable: low (below 0.35), moderate (between 0.35 and 0.70), and high (above 0.70) (Hew and Kadir 2017; Leong et al. 2020; Wong et al. 2014). Table 3 shows the reliability analysis results for two groups of CRD in Panel A and ERs in Panel B, respectively. There are six CRD articles, and the reliability analysis is conducted for all regardless of sample size effect due to insufficient data. In Panel B, there are 46 ER articles, providing sufficient data to analyze the construct reliability by sample size. The mean reliability (mean Cronbach’s alpha) of every construct is above 0.70, indicating a high degree of construct reliability (see Table 3).
Table 3.
Reliability analysis.
The regression path or weight analysis is used to evaluate the predictive power of independent variables CRD and ERs on financial performance (equity, debt, and firm value). Following (Rana et al. 2015) and (Leong et al. 2023), to conduct this weight analysis, we calculate the frequency of significant paths related to a predictor variable and divide it by the total number of articles that report such paths. A weight of 0% means the relationship or path is insignificant across all studies, and a weight of 100% means the relationship is significant across all studies (Ismagilova et al. 2020). Table 4 reports the results of weight analysis. Due to insufficient data (the number of studies k < 3), there are no weight analyses conducted for the two paths CRD → Perform (Debt) with k = 2 and CRD → Perform (Firm Value) with k = 0. The results in Table 4 indicates that the remaining relationships are significant across most studies: the CRD → Perform (Equity) 100%, ER → Perform (Debt) 100%, ER → Perform (Firm Value) 92.86%, and ER → Perform (Equity) 80%.
Table 4.
Regression path analysis.
The direction of each path is identified based on the minimum (min) and maximum (max) values of beta coefficients in Table 4. The CRD → Perform (Equity) path has the min–max range towards negative (−0.018 to 0.001), confirms our H1 because the results indicate the downside effect of mandatory climate-related disclosure on equity market. In terms of the ER → Perform (Equity) path, the min–max range is from −7.384 to 11.830, rejecting H1 because the results show mixed impacts of environmental regulations on the equity market. Regarding the ER → Perform (Debt) path, the min–max range is towards positive (−0.050 to 0.837), showing environment regulations support the debt market, confirms our H2. For the ER → Perform (Firm Value) path, the range is from −3.060 to 2.644, supports our H3 that firm value is affected by environmental regulations either negatively or positively.
4.2. Meta-Analysis Structural Equation Modelling Results
We conducted the MASEM analysis using maximum likelihood estimation with StataBE 17. Table 5 reports the MASEM results showing the magnitude and significance of the causal effects of methodology and risk-related factors on the relationships between ER/CRD and financial performance (Equity, Debt, and Value). We did not separate the estimates for ER and CRD studies due to the small number of CRD studies (4 studies on Equity, 2 studies on Debt, and no studies on Firm Value). The estimated models were evaluated using Goodness-of-Fit indices. According to (Hair et al. 2017), the chi-square Goodness-of-Fit Index, Comparative Fit Index (CFI), and Tucker–Lewis Index (TLI) should be at least 0.95, and Standardized Root Mean Square Residual (SRMR) should be less than 0.05, and Root Mean Square Error of Approximation (RMSEA) should be less than 0.08. The fit statistics in Table 5 suggest the good fit of our models (CFI and TLI = 1.000 > 0.95, SRMR = 0.000 < 0.05, RMSEA = 0.000 < 0.08).
Table 5.
Meta-analysis structural equation modelling results.
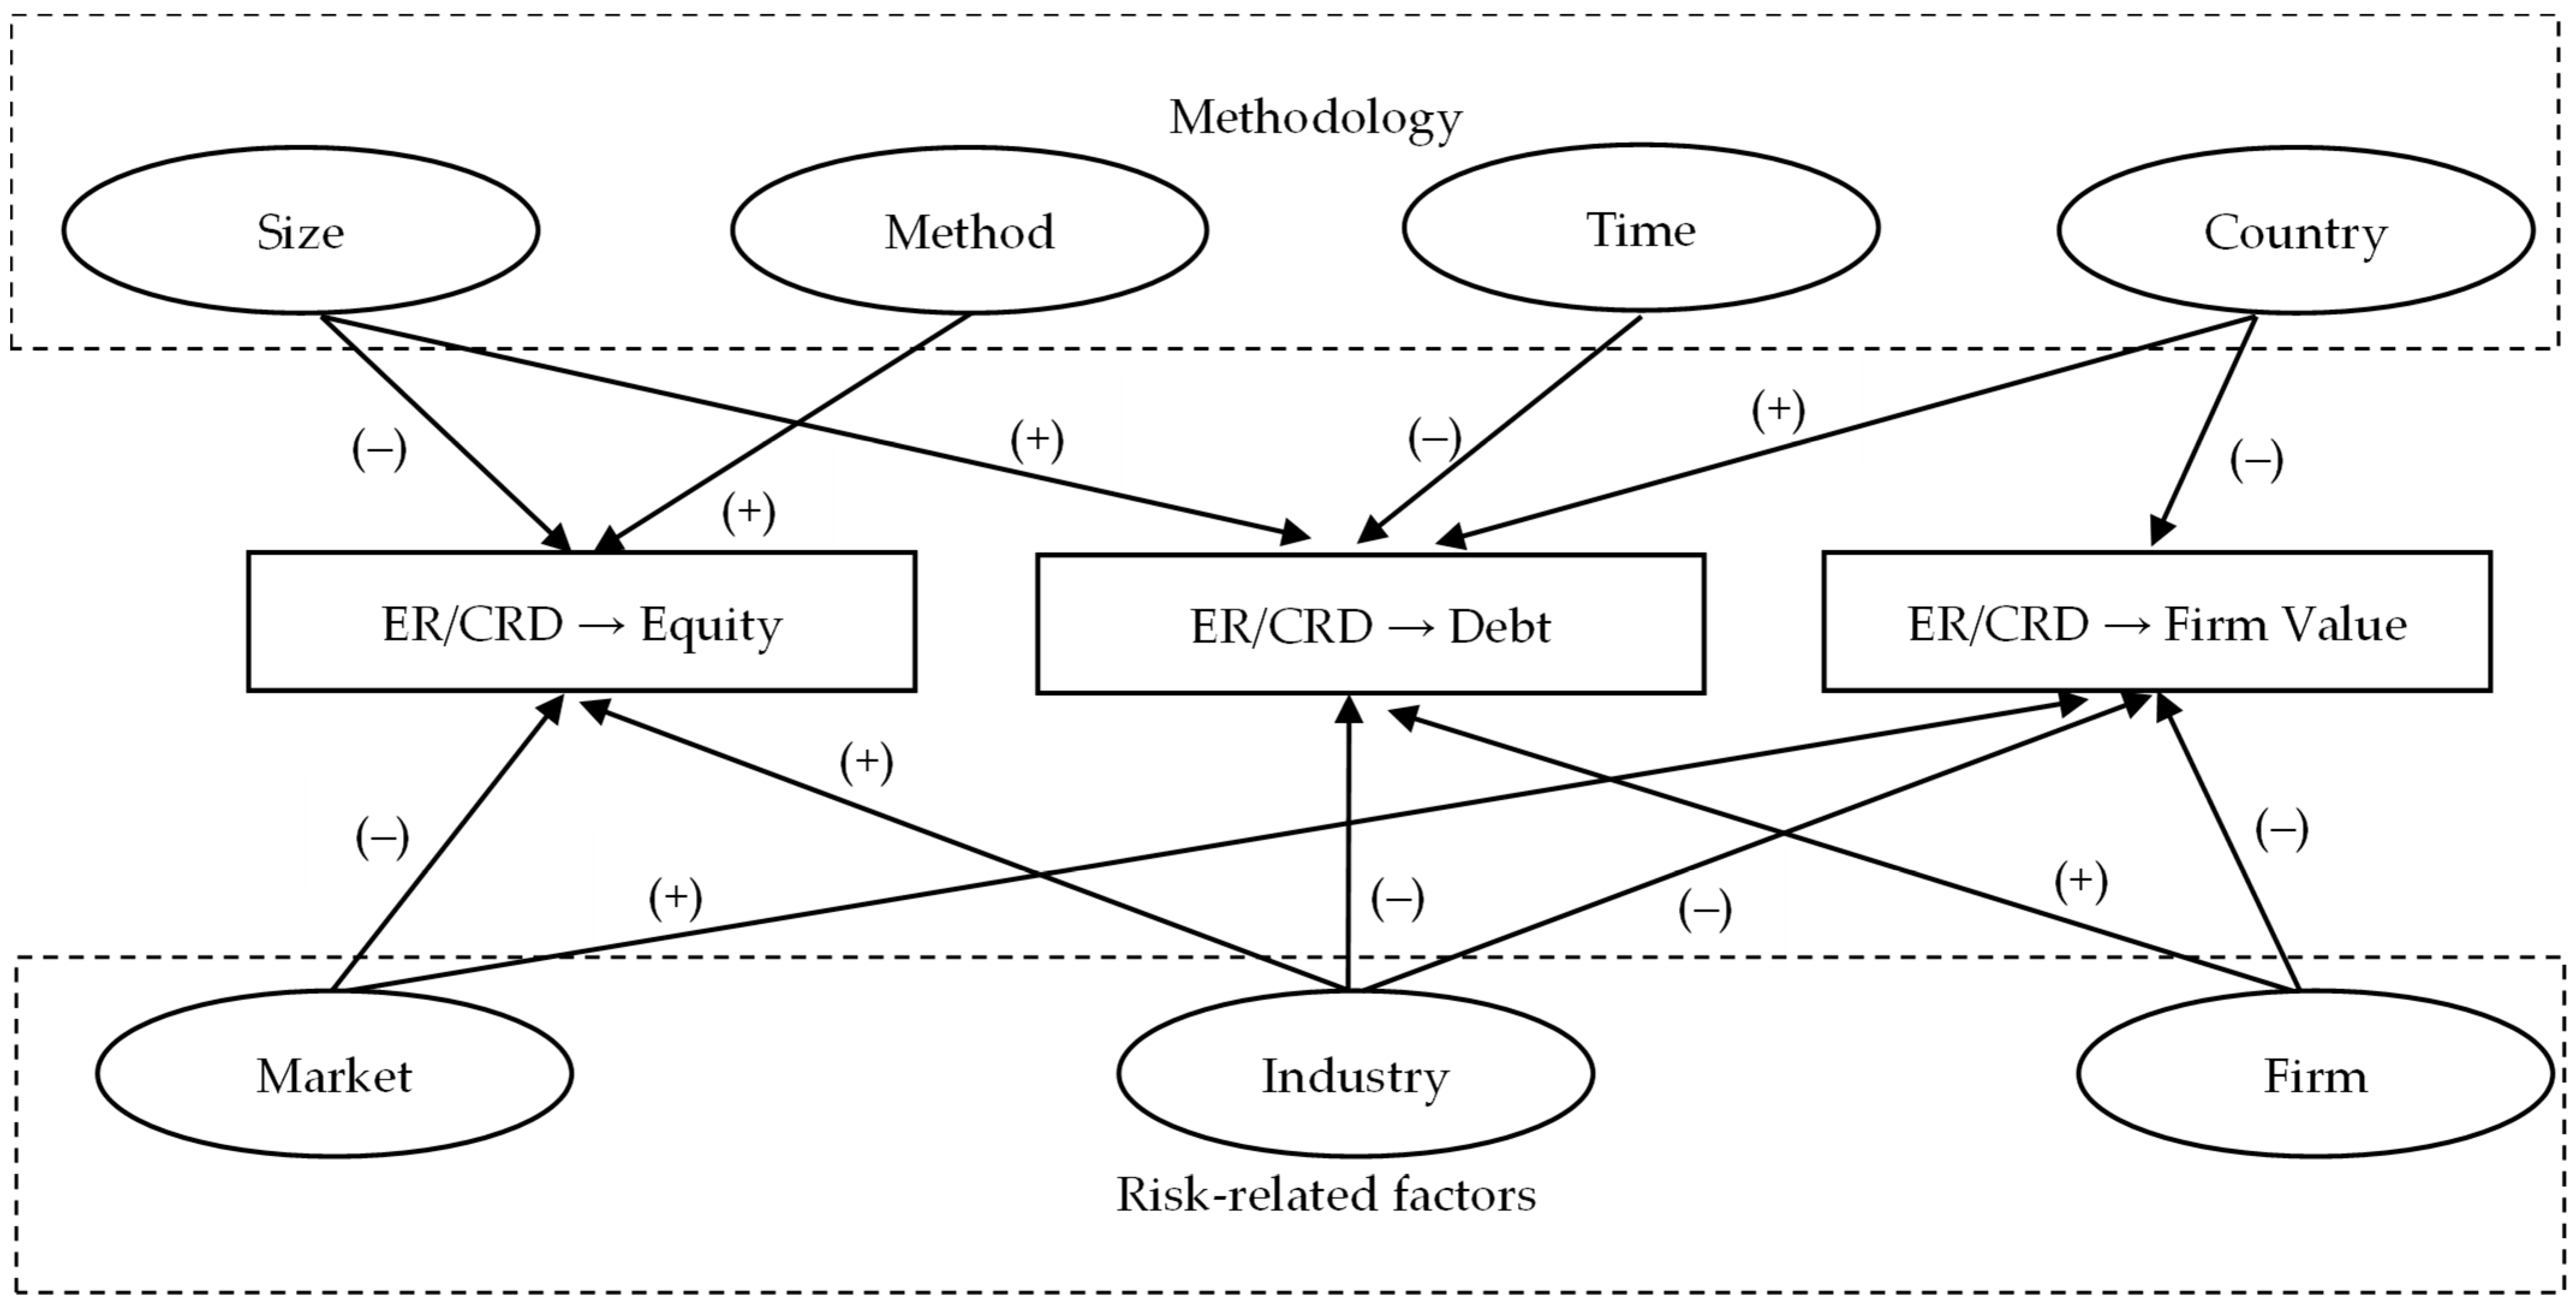
Table 5 shows the MASEM results of three models on the ER/CRD–equity, ER/CRD–debt, and ER/CRD–value relationships. The results of size, method, time, and country show the effects of methodology, while the results of market, industry, and firm show the risk effects on the three relationships.
In terms of the methodology, size (sample size) negatively affects the ER/CRD–equity relationship (−0.672, significant at 1% level), but positively impacts the ER/CRD–debt relationship (1.011, significant at 1% level). The results suggest that using the larger sample size may capture the smaller impact of ERs and CRD on the equity market. For the debt market, the larger sample size the better. Method (type of statistical analysis) significantly affects the ER/CRD–equity outcome (0.582, significant at 5%). This means that selecting a suitable statistical analysis plays an important role in examining the impact of ER/CRD on the equity market. For example, using two or more statistical analyses is better than using one statistical analysis.
Time (data frequency) negatively explains the ER/CRD–debt relationship (−0.445, significant at 5%), suggests that studies which focus on the debt market, using the less frequent data is better. Country (country coverage) positively influences the ER/CRD–debt result (0.772, significant at 5%) but negatively affects the ER/CRD–value outcome (−0.751, significant at 5%). The results show that using data from different countries is better for the debt-related studies. For the firm-value-related studies, using data from fewer countries is better. The findings support our H4 that methodology affects the relationship between CRD and financial markets (see Figure 6).
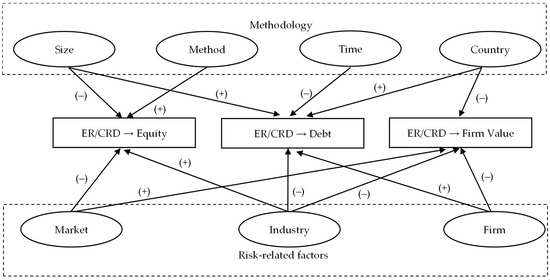
Figure 6.
Methodology and risk-related effects on the ER/CRD–financial market relationship. Source: Authors’ illustration.
Regarding the risk-related factors, market (market development) explains the impacts of ERs and CRD on the equity market and firm value (−0.480 and 0.813, respectively, and significant at 1% level). The results in Table 5 show that focusing on developing or developed markets in a study influences the research outcome. Industry (industry effect consideration) has great impacts on the effects of ERs and CRD on all equity, debt and firm value. However, considering industry effects in a study increases the explanatory of ER/CRD on the equity market (0.815, significant at 1% level), and decreases the explanatory of ER/CRD on the performance of debt market and firm value. In terms of firm risk (firm age and firm size effects), the impact of ERs and CRD on the debt market is highly affected by firm characteristics (0.690, significant at 1% level). Table 5 also shows that the ER/CRD–firm value relationship is affected by all market, industry, and firm risks (all coefficients are significant at 1% level). The findings confirm our H5 that market, industry, and firm characteristics affect the relationship between ER/CRD and financial markets (see Figure 6).
5. Conclusions
This study evaluated the impacts of environmental regulations and climate-related disclosure laws on the financial performance of equity, debt, and firm value. Using the MASEM methodology, we conducted the meta-regression analysis using the outcomes of 52 empirical studies. The results confirm the predictive power of the ERs and CRD on financial performance across all studies. Mandatory climate-related disclosure has a downside effect on the equity market. Our findings provide a new explanation for the impact of mandating climate-related reports in the financial market. Its downside effect should be considered by policy makers, firms, and investors in making decisions on CRD (mandatory or not) to transform towards a sustainable economy. Besides, we found that environmental regulations create mixed impacts on the equity market and support the debt market. Firm value is affected by environmental regulations either negatively or positively. These findings call for future research to investigate how and why climate-related disclosure and environmental regulations affect different financial markets differently.
We also attempted to explain the effects of methodology and risk-related factors on the relationships between ER/CRD and financial performance (Equity, Debt, and Value) in terms of magnitude and significance. The results suggest using a large sample size and less frequent data of many countries for the debt-related studies. Using two or more statistical analyses and a smaller sample size is recommended for the equity-related studies. For the firm value-related studies, using data from fewer countries is effective. Our findings provide strong evidence of the methodology effects on the relationship between ERs or CRD and financial markets.
Besides methodology, the risk-related factors (market, industry, and firm) are important in explaining the relationships between the ER/CRD and financial performance. We found that the impacts of ERs and CRD on the equity market are related to the market development stage (the more developed the market, the less the impact). Considering industry risk is recommended because different industries are exposed to changes in policies differently. The ER/CRD–firm value relationship is affected by all market, industry, and firm risks. Our findings suggest that future studies should consider the effects of different risks in evaluating how and why environmental regulations, especially climate-related reporting laws, create shocks on different financial markets and industries differently.
Our study covered major empirical studies from the WoS and Scopus that are relevant to our research objectives to the most recent (October 2023). However, the data sample based on 52 empirical studies is relatively small due to the scarcity of empirical studies on the relationship between ER/CRD and financial performance. The region coverage is heterogeneous regarding the number of studies (Africa (1), Asia Pacific (35), Europe (5), America (6), and others (5)). The lack of inclusion of countries from Africa and Europe shows a research gap, suggesting that future studies should focus on empirical analyses of the relationship between climate-related regulations and financial performance in African and European markets.
In our study, we aim to use the MASEM technique based on statistical estimates from previous studies. Therefore, we relied on the two dominant collections (Web of Science and Scopus) to obtain the statistical estimates from high quality peer-reviewed publications. Future studies can include more databases such as Google Scholar and Directory of Open Access Journals (DOAJ) to maximize the generalizability of the findings. Our data duration is from 2000 to 2023. Future research can expand the study period to include the most recent studies and capture the more up-to-date findings related to climate-related regulations and financial markets.
Author Contributions
Conceptualization, L.T.H. and C.G.; methodology, L.T.H.; software, L.T.H.; validation, L.T.H., C.G. and Z.Z.; formal analysis, L.T.H.; investigation, L.T.H.; resources, L.T.H. and C.G.; data curation, L.T.H. and Z.Z.; writing—original draft preparation, L.T.H., C.G. and Z.Z.; writing—review and editing, L.T.H., C.G. and Z.Z.; visualization, L.T.H.; supervision, L.T.H.; project administration, L.T.H.; funding acquisition, L.T.H. and C.G. All authors have read and agreed to the published version of the manuscript.
Funding
This research was funded by Faculty Research Seed Fund 2023 (Funding number INT5108) from 24 May 2023 to 30 November 2023, Faculty of Agribusiness and Commerce, Lincoln University, New Zealand.
Data Availability Statement
Data are available on request.
Conflicts of Interest
The authors declare no conflicts of interest. The funders had no role in the design of the study; in the collection, analyses, or interpretation of data; in the writing of the manuscript; or in the decision to publish the results.
References
- Al-Tuwaijri, Sulaiman, Theodore E. Christensen, and K. E. Hughes, II. 2004. The relations among environmental disclosure, environmental performance, and economic performance: A simultaneous equations approach. Accounting, Organizations and Society 29: 447–71. [Google Scholar] [CrossRef]
- Amar, Jeanne, Samira Demaria, and Sandra Rigot. 2022. Enhancing Financial Transparency to Mitigate Climate Change: Toward a Climate Risks and Opportunities Reporting Index. Environmental Modeling & Assessment 27: 425–39. [Google Scholar] [CrossRef]
- Antoniuk, Yevheniia. 2022. The effect of climate disclosure on stock market performance: Evidence from Norway. Sustainable Development 31: 1008–26. [Google Scholar] [CrossRef]
- Bai, Caiquan, Chen Feng, Kerui Du, Yuansheng Wang, and Yuan Gong. 2020. Understanding spatial-temporal evolution of renewable energy technology innovation in China: Evidence from convergence analysis. Energy Policy 143: 111570. [Google Scholar] [CrossRef]
- Birindelli, Giuliana, and Helen Chiappini. 2021. Climate change policies: Good news or bad news for firms in the European Union? Corporate Social Responsibility and Environmental Management 28: 831–48. [Google Scholar] [CrossRef]
- Boulatoff, Catherine, Carol Boyer, and Stephen J. Ciccone. 2012. Voluntary Environmental Regulation and Firm Performance: The Chicago Climate Exchange. The Journal of Alternative Investments 15: 114–22. [Google Scholar] [CrossRef]
- Bowan, Megan, and Daniel Wiseman. 2020. Finance Actors and Climate-Related Disclosure Regulation: Logic Limits and Emerging Accountability. In Climate Finance: Insurance, Finance and the Regulation of Harmscapes. London: Routledge, pp. 153–78. [Google Scholar]
- Charkham, Jonathan P. 1992. Corporate governance: Lessons from abroad. European Business Journal 4: 8. [Google Scholar]
- Clarkson, Peter, Xiaohua Fang, Yue Li, and Gordon D. Richardson. 2010. The relevance of environmental disclosure for investors and other stakeholder groups: Are such disclosures incrementally informative? Accounting Research 22: 41–47. [Google Scholar] [CrossRef]
- Colombelli, Alessandra, Claudia Ghisetti, and Francesco Quatraro. 2020. Green technologies and firms’ market value: A micro-econometric analysis of European firms. Industrial and Corporate Change 29: 855–75. [Google Scholar] [CrossRef]
- Dhaliwal, Dan, Oliver Zhen Li, Albert Tsang, and Yong George Yang. 2014. Corporate social responsibility disclosure and the cost of equity capital: The roles of stakeholder orientation and financial transparency. Journal of Accounting and Public Policy 33: 328–55. [Google Scholar] [CrossRef]
- Diltz, J. David. 2002. U.S. equity markets and environmental policy. The case of electric utility investor behavior during the passage of the Clean Air Act Amendments of 1990. Environmental and Resource Economics 23: 379–401. [Google Scholar] [CrossRef]
- Dowell, Glen, Stuart Hart, and Bernard Yeung. 2000. Do corporate global environmental standards create or destroy market value? Management Science 46: 1059–74. [Google Scholar] [CrossRef]
- Dwivedi, Yogesh K., Nripendra P. Rana, Anand Jeyaraj, Marc Clement, and Michael D. Williams. 2019. Re-examining the Unified Theory of Acceptance and Use of Technology (UTAUT): Towards a revised theoretical model. Information Systems Frontiers 21: 719–34. [Google Scholar] [CrossRef]
- Fama, Eugene F. 1970. Efficient Capital Markets: A Review of Theory and Empirical Work. Journal of Finance 25: 383–417. [Google Scholar] [CrossRef]
- Fan, Haichao, Yuchao Peng, Huanhuan Wang, and Zhiwei Xu. 2021. Greening through finance? Journal of Development Economics 152: 102683. [Google Scholar] [CrossRef]
- Fard, Amirhossein, Siamak Javadi, and Incheol Kim. 2020. Environmental regulation and the cost of bank loans: International evidence. Journal of Financial Stability 51: 100797. [Google Scholar] [CrossRef]
- Freedman, Martin, and Bikki Jaggi. 1982. Pollution disclosures, pollution performance and economic performance. Omega 10: 167–76. [Google Scholar] [CrossRef]
- Gans, Will, and Beat Hintermann. 2013. Market Effects of Voluntary Climate Action by Firms: Evidence from the Chicago Climate Exchange. Environmental and Resource Economics 55: 291–308. [Google Scholar] [CrossRef]
- Guo, Mengmeng, Yicheng Kuai, and Xiaoyan Liu. 2020. Stock market response to environmental policies: Evidence from heavily polluting firms in China. Economic Modelling 86: 306–16. [Google Scholar] [CrossRef]
- Hair, Joe F., Jr., Lucy M. Matthews, Ryan L. Matthews, and Marko Sarstedt. 2017. PLS-SEM or CB-SEM: Updated guidelines on which method to use. International Journal of Multivariate Data Analysis 1: 107. [Google Scholar] [CrossRef]
- He, Yu, and Huan Zheng. 2022. Do environmental regulations affect firm financial distress in China? Evidence from stock markets. Applied Economics 54: 4384–401. [Google Scholar] [CrossRef]
- Hew, Teck-Soon, and Sharifah Latifah Sye Kadir. 2017. The drivers for cloud-based virtual learning environment: Examining the moderating effect of school category. Internet Research 27: 942–73. [Google Scholar]
- Hew, Teck-Soon, Lai-Ying Leong, Keng-Boon Ooi, and Alain Yee-Loong Chong. 2016. Predicting drivers of mobile entertainment adoption: A two-stage sem-artificial-neural-network analysis. Journal of Computer Information Systems 56: 352–70. [Google Scholar] [CrossRef]
- Horváthová, Eva. 2010. Does environmental performance affect financial performance? A meta-analysis. Ecological Economics 70: 52–59. [Google Scholar] [CrossRef]
- Huang, Bihong, Maria Teresa Punzi, and Yu Wu. 2021. Do banks price environmental transition risks? Evidence from a quasi-natural experiment in China. Journal of Corporate Finance 69: 101983. [Google Scholar] [CrossRef]
- Huang, Bihong, Maria Teresa Punzi, and Yu Wu. 2022. Environmental regulation and financial stability: Evidence from Chinese manufacturing firms. Journal of Banking & Finance 136: 106396. [Google Scholar] [CrossRef]
- Hu, Guoqiang, Xiaoqi Wang, and Yu Wang. 2021. Can the green credit policy stimulate green innovation in heavily polluting enterprises? Evidence from a quasi-natural experiment in China. Energy Economics 98: 105134. [Google Scholar] [CrossRef]
- Ismagilova, Elvira, Emma L. Slade, Nripendra P. Rana, and Yogesh K. Dwivedi. 2020. The effect of electronic word of mouth communications on intention to buy: A meta-analysis. Information Systems Frontiers 22: 1203–26. [Google Scholar] [CrossRef]
- Javeed, Sohail Ahmad, Rashid Latief, and Lin Lefen. 2020. An analysis of relationship between environmental regulations and firm performance with moderating effects of product market competition: Empirical evidence from Pakistan. Journal of Cleaner Production 254: 120197. [Google Scholar] [CrossRef]
- Khanna, Madhu, and Lisa A. Damon. 1999. EPA’s voluntary 33/50 program: Impact on toxic releases and economic performance of firms. Journal of Environmental Economics and Management 37: 1–25. [Google Scholar] [CrossRef]
- Kleimeier, Stefanie, and Michael Viehs. 2021. Pricing carbon risk: Investor preferences or risk mitigation? Economics Letters 205: 109936. [Google Scholar] [CrossRef]
- Kong, Gaowen, Shuai Wang, and Yanan Wang. 2022. Fostering firm productivity through green finance: Evidence from a quasi-natural experiment in China. Economic Modelling 115: 105979. [Google Scholar] [CrossRef]
- Lee, Chien-Chiang, Yu-Fang Chang, and En-Ze Wang. 2022. Crossing the rivers by feeling the stones: The effect of China’s green credit policy on manufacturing firms’ carbon emission intensity. Energy Economics 116: 106413. [Google Scholar] [CrossRef]
- Lee, Ki-Hoon, Bum-Jin Park, Hakjoon Song, and Keun-Hyo Yook. 2017. The Value Relevance of Environmental Audits: Evidence from Japan. Business Strategy and the Environment 26: 609–25. [Google Scholar] [CrossRef]
- Leong, Lai-Ying, Teck-Soon Hew, Keng-Boon Ooi, and June Wei. 2020. Predicting mobile wallet resistance: A two-staged structural equation modeling-artificial neural network approach. International Journal of Information Management 51: 1–24. [Google Scholar] [CrossRef]
- Leong, Lai-Ying, Teck-Soon Hew, Keng-Boon Ooi, Bhimaraya Metri, and Yogesh K. Dwivedi. 2023. Extending the Theory of Planned Behavior in the Social Commerce Context: A Meta-Analytic SEM (MASEM) Approach. Information Systems Frontiers 25: 1847–79. [Google Scholar] [CrossRef]
- Leong, Lai-Ying, Teck-Soon Hew, Keng-Boon Ooi, Voon-Hsien Lee, and Jun-Jie Hew. 2019. A hybrid SEM-neural network analysis of social media addiction. Expert Systems with Applications 133: 296–316. [Google Scholar] [CrossRef]
- Li, Meng, Liye Dong, Jing Luan, and Pengfei Wang. 2020. Do environmental regulations affect investors? Evidence from China’s action plan for air pollution prevention. Journal of Cleaner Production 244: 118817. [Google Scholar] [CrossRef]
- Lin, Boqiang, and Nan Wu. 2023. Climate risk disclosure and stock price crash risk: The case of China. International Review of Economics & Finance 83: 21–34. [Google Scholar] [CrossRef]
- Liu, Xinghe, Enxian Wang, and Danting Cai. 2018. Environmental Regulation and Corporate Financing—Quasi-Natural Experiment Evidence from China. Sustainability 10: 4028. [Google Scholar] [CrossRef]
- Lu, Shiyu, and Bo Cheng. 2022. Does environmental regulation affect firms’ ESG performance? Evidence from China. Managerial and Decision Economics 44: 2004–9. [Google Scholar] [CrossRef]
- Ma, Yechi, Yezhou Sha, Zilong Wang, and Wenjing Zhang. 2023. The effect of the policy mix of green credit and government subsidy on environmental innovation. Energy Economics 118: 106512. [Google Scholar] [CrossRef]
- Meng, Jia, and ZhongXiang Zhang. 2022. Corporate environmental information disclosure and investor response: Evidence from China’s capital market. Energy Economics 108: 105886. [Google Scholar] [CrossRef]
- Nerger, Gian-Luca, Toan Luu Duc Huynh, and Mei Wang. 2021. Which industries benefited from Trump environmental policy news? Evidence from industrial stock market reactions. Research in International Business and Finance 57: 101418. [Google Scholar] [CrossRef]
- Odoemelam, Ndubuisi, and Regina Okafor. 2018. The Influence of Corporate Governance on Environmental Disclosure of Listed Non-Financial Firms in Nigeria. Indonesian Journal of Sustainability Accounting and Management 2: 25. [Google Scholar] [CrossRef]
- Paré, Guy, Marie-Claude Trudel, Mirou Jaana, and Spyros Kitsiou. 2015. Synthesizing information systems knowledge: A typology of literature reviews. Information and Management 52: 183–99. [Google Scholar] [CrossRef]
- Pham, Huy Nguyen Anh, Vikash Ramiah, and Imad Moosa. 2020. The effects of environmental regulation on the stock market: The French experience. Accounting and Finance 60: 3279–304. [Google Scholar] [CrossRef]
- Pham, Huy, Van Nguyen, Vikash Ramiah, Priyantha Mudalige, and Imad Moosa. 2019. The Effects of Environmental Regulation on the Singapore Stock Market. Journal of Risk and Financial Management 12: 175. [Google Scholar] [CrossRef]
- Porter, Michael. 1990. Effect of environmental regulation on firm outcomes. Harvard Business Review 40: 1–20. [Google Scholar]
- Ramiah, Vikash, Belinda Martin, and Imad Moosa. 2013. How does the stock market react to the announcement of green policies? Journal of Banking and Finance 37: 1747–58. [Google Scholar] [CrossRef]
- Ramiah, Vikash, Huy Nguyen Anh Pham, Ian Wang, Van Ngoc Tuong Dang, Jose Francisco Veron, and Hung Duong. 2017. The financial consequences of abolishing a carbon trading system. Applied Economics Letters 24: 936–39. [Google Scholar] [CrossRef]
- Ramiah, Vikash, Jacopo Pichelli, and Imad Moosa. 2015a. Environmental regulation, the Obama effect and the stock market: Some empirical results. Applied Economics 47: 725–38. [Google Scholar] [CrossRef]
- Ramiah, Vikash, Jacopo Pichelli, and Imad Moosa. 2015b. The Effects of Environmental Regulation on Corporate Performance: A Chinese Perspective. Review of Pacific Basin Financial Markets and Policies 18: 1550026. [Google Scholar] [CrossRef]
- Ramiah, Vikash, Thomas Morris, Imad Moosa, Michael Gangemi, and Louise Puican. 2016. The effects of announcement of green policies on equity portfolios Evidence from the United Kingdom. Managerial Auditing Journal 31: 138–55. [Google Scholar] [CrossRef]
- Rana, Nripendra P., Yogesh K. Dwivedi, and Michael D. Williams. 2015. A meta-analysis of existing research on citizen adoption of e-government. Information Systems Frontiers 17: 547–63. [Google Scholar] [CrossRef]
- Rassier, Dylan G., and Dietrich Earnhart. 2010. Does the porter hypothesis explain expected future financial performance? The effect of clean water regulation on chemical manufacturing firms. Environmental and Resource Economics 45: 353–77. [Google Scholar] [CrossRef]
- Shane, Philip B., and Barry H. Spicer. 1983. Market Response to Environmental Information Produced outside the Firm. The Accounting Review 58: 521–38. [Google Scholar]
- Shao, Hanhua, Yuansheng Wang, Yao Wang, and Yuanjia Li. 2022. Green credit policy and stock price crash risk of heavily polluting enterprises: Evidence from China. Economic Analysis and Policy 75: 271–87. [Google Scholar] [CrossRef]
- Shu, Hao, and Weiqiang Tan. 2023. Does carbon control policy risk affect corporate ESG performance? Economic Modelling 120: 106148. [Google Scholar] [CrossRef]
- Solomon, Aris, and Linda Lewis. 2002. Incentives and disincentives for corporate environmental disclosure. Business Strategy and the Environment 11: 154–69. [Google Scholar] [CrossRef]
- Sun, Junxiu, Feng Wang, Haitao Yin, and Bing Zhang. 2019. Money Talks: The Environmental Impact of China’s Green Credit Policy. Journal of Policy Analysis and Management 38: 653–80. [Google Scholar] [CrossRef]
- Templier, Mathieu, and Guy Paré. 2018. Transparency in literature reviews: An assessment of reporting practices across review types and genres in top IS journals. European Journal of Information Systems 27: 503–50. [Google Scholar] [CrossRef]
- Tian, Yuan, Alexandr Akimov, Eduardo Roca, and Victor Wong. 2016. Does the carbon market help or hurt the stock price of electricity companies? Further evidence from the European context. Journal of Cleaner Production 112: 1619–26. [Google Scholar] [CrossRef]
- Wang, Jiayi, and Ping Lei. 2020. A new tool for environmental regulation? The connection between environmental administrative talk policy and the market disciplinary effect. Journal of Cleaner Production 275: 124162. [Google Scholar] [CrossRef]
- Wang, Yanbing, Michael S. Delgado, Neha Khanna, and Vicki L. Bogan. 2019. Good news for environmental self-regulation? Finding the right link. Journal of Environmental Economics and Management 94: 217–35. [Google Scholar] [CrossRef]
- Wellalage, Nirosha Hewa, and Vijay Kumar. 2021. Environmental performance and bank lending: Evidence from unlisted firms. Business Strategy and the Environment 30: 3309–29. [Google Scholar] [CrossRef]
- Wen, Fenghua, Nan Wu, and Xu Gong. 2020. China’s carbon emissions trading and stock returns. Energy Economics 86: 104627. [Google Scholar] [CrossRef]
- Wirth, Carolyn, Jing Chi, and Martin Young. 2013. The Economic Impact of Capital Expenditures: Environmental Regulatory Delay as a Source of Competitive Advantage? Journal of Business Finance and Accounting 40: 115–41. [Google Scholar] [CrossRef]
- Wong, Choy-Har, Garry Wei-Han Tan, Siew-Phaik Loke, and Keng-Boon Ooi. 2014. Mobile TV: A new form of entertainment? Industrial Management and Data Systems 114: 1050–67. [Google Scholar] [CrossRef]
- Wu, Jiming, and Hongwei Du. 2012. Toward a better understanding of behavioral intention and system usage constructs. European Journal of Information Systems 21: 680–98. [Google Scholar] [CrossRef]
- Xiao, Han, and KeMin Wang. 2020. Does environmental labeling exacerbate heavily polluting firms’ financial constraints? Evidence from China. China Journal of Accounting Research 13: 147–74. [Google Scholar] [CrossRef]
- Xu, Guangdong, Wenming Xu, and Shudan Xu. 2018. Does the establishment of the Ministry of Environmental Protection matter for addressing China’s pollution problems? Empirical evidence from listed companies. Economics of Governance 19: 195–224. [Google Scholar] [CrossRef]
- Yang, Gangqiang, Ziyu Ding, Haisen Wang, and Lingli Zou. 2022a. Can environmental regulation improve firm total factor productivity? The mediating effects of credit resource allocation. Environment, Development and Sustainability 25: 6799–27. [Google Scholar] [CrossRef]
- Yang, Jingyi, Daqian Shi, and Wenbo Yang. 2022b. Stringent environmental regulation and capital structure: The effect of NEPL on deleveraging the high polluting firms. International Review of Economics and Finance 79: 643–56. [Google Scholar] [CrossRef]
- Yang, Minhua, Vikash Ramiah, Imad Moosa, and Yu He. 2018. Narcissism, political tenure, financial indicators and the effectiveness of environmental regulation. Applied Economics 50: 2325–38. [Google Scholar] [CrossRef]
- Yao, Liming, Ying Luo, Yile Wang, and Haiyue Liu. 2022. Market response to the hierarchical water environment regulations on heavily polluting firm: Evidence from China. Water Resources and Economics 39: 100201. [Google Scholar] [CrossRef]
- Zhang, Xuehui, Jianhua Tan, and Kam C. Chan. 2021. Environmental law enforcement as external monitoring: Evidence from the impact of an environmental inspection program on firm-level stock price crash risk. International Review of Economics & Finance 71: 21–31. [Google Scholar] [CrossRef]
Disclaimer/Publisher’s Note: The statements, opinions and data contained in all publications are solely those of the individual author(s) and contributor(s) and not of MDPI and/or the editor(s). MDPI and/or the editor(s) disclaim responsibility for any injury to people or property resulting from any ideas, methods, instructions or products referred to in the content. |
© 2024 by the authors. Licensee MDPI, Basel, Switzerland. This article is an open access article distributed under the terms and conditions of the Creative Commons Attribution (CC BY) license (https://creativecommons.org/licenses/by/4.0/).