Article

The Stock Market Reaction to Green Bond Issuance: A Study Based on a Multidimensional Scaling Approach

GEF2A Laboratory, Institut Supérieur de Gestion de Tunis, University of Tunis, Tunis Q5V7+P4W, Tunisia
*
Author to whom correspondence should be addressed.
J. Risk Financial Manag. 2024, 17(9), 408; https://doi.org/10.3390/jrfm17090408
Submission received: 28 May 2024 / Revised: 20 July 2024 / Accepted: 25 July 2024 / Published: 10 September 2024
(This article belongs to the Special Issue Emerging Issues in Economics, Finance and Business—2nd Edition)

Abstract

:
The aim of this study is to examine the impact of green bond issuance on the stock market, based on the share prices of 29 companies located in different countries around the world. Using our financial map and applying clustering techniques, we study price fluctuations and identify the influences shaping them. Our contribution lies in methodological innovation through a Multidimensional Scaling approach. Based on this innovative approach, the results of this investigation revealed a complex dynamic in which various factors such as company size, issue volume, total number of issues, geographical location, country GDP, and even governance indices such as the corruption index interact significantly.

1. Introduction

Over the past few decades, awareness of climate issues has significantly increased. It is a crucial response to an existential threat that looms over all of humanity. Dramatic changes in our climate are caused by human activities, especially massive greenhouse gas emissions (GHGs). These climate disruptions manifest through extreme phenomena such as devastating hurricanes, deadly heat waves, and uncontrollable forest fires. They endanger not only our environment but also our economies, food systems, and the security of millions of people worldwide.
Consequently, governments and organizations worldwide have begun to recognize the urgency to act. Environmental movements have mobilized, demanding stricter emission policies, a transition to renewable energy sources, and sustainable agricultural practices. It is in this context that the Paris Agreement, a result of the 2015 Paris Climate Change Conference, has emerged as a major milestone in the global fight against climate change (Zheng et al. 2021). This global agreement aims to limit global warming to less than 2 degrees Celsius compared to pre-industrial levels while continuing efforts to limit the temperature rise to 1.5 degrees Celsius.
This international commitment closely aligns with United Nations Sustainable Development Goal 13, titled “Climate Action”, which calls for the implementation of policies and measures to reduce greenhouse gas emissions, strengthen resilience to climate change, and mobilize financing to support the efforts of developing countries in this crucial fight (Sharma and Payal 2019). To support the efforts of prevention and mitigation of climate change, various innovative financial instruments have been established, among which green bonds are prominent. These instruments have had a significant impact on reducing greenhouse gas emissions, especially after COP21 (Fatica and Panzica 2021).
The sustainable bonds market has experienced exceptional growth in recent years, which is largely attributable to the implementation of international standards such as the Green Bond Principles (GBPs). These standards were established to encourage companies to adopt transparency and reporting practices that significantly enhance investor confidence, allowing investors to more accurately assess the environmental and social impact of companies (Chen and Zhao 2021). The transition to more responsible business practices has not only responded to the urgent call of the climate crisis but has also opened up new prospects in the stock market. This growing awareness has led investors to reassess their investment strategies by favoring companies committed to sustainable and responsible practices.
It is in the above-described context in which green bonds emerged. Green bonds are a type of bond similar to conventional bonds with the additional feature that the financing obtained must be used to finance or refinance green investments (Maltais and Nykvist 2020). The issuance of green bonds therefore implies a company’s commitment to sustainable development.
In the financial literature, there is no consensus regarding the effects of a green bond issuance on the issuer’s share price. A first hypothesis suggests that the market would react positively to the announcement of a green issuance, reflecting a positive evolution of the economic model of the issuer in the long term. In line with the environmental policies of regulators, with less exposure to environmental risks and greater attractiveness from green investors, the company is viewed as entering a positive dynamic with more stable and profitable activities in the long term.
A second hypothesis suggests the opposite. Indeed, the announcement of the use of a new instrument, in particular to finance a transition perceived, by investors, as an activity focused on sustainable development, could be interpreted as a source of uncertainty. Such a consideration could therefore lead to a downward revision of profitability projections, with a negative reaction from the market.
To examine the market reaction to the announcement of a green bond issuance, previous studies considered cumulative abnormal returns (CARs), defined as the difference between realized returns and equilibrium returns estimated by theoretical models. The CAR around the announcement date of green bond issuances is, on average, significantly different from zero.
The major difficulty that arises when studying this market is that of data. During the first years of its development and still today, most players (commercial banks, institutional investors, etc.) have built their own databases.
In our study, our main objective is to analyze the impact of green bond issuance on the stock market. We use a dataset of 29 companies, located in various countries worldwide, that made 124 green bond issuance announcements between 2010 and 2022. By leveraging our financial map and using clusters, we carefully examined various price fluctuations. We found that these fluctuations, whether upward or downward, are not only influenced by the green criterion but also by other factors such as the company’s size, the substantial amount of its issuance, the total number of issuances, and its geographical location, as certain countries play a crucial role in the green bond market. Additionally, elements like the country’s GDP (Gross Domestic Product) and the corruption index can also have a significant impact on these fluctuations.
This article contributes to the existing literature on several aspects. It provides added value to the existing literature and sets out all the theories constituting the theoretical underpinning of this subject. The relationship issuance of green bonds/reaction of stock markets is also studied through factors linked to the characteristics of the issuing companies (size and level of debt), through the characteristics of the issue (volume), and by involving macroeconomic variables (GDP growth rate) and links to governance (corruption index).
One of the main contributions of our paper is the use, for the first time in research work on green bonds, of the MDS method, which is a machine learning technique. This method goes far beyond the classic approach of multiple regressions or even classic event studies. We implement this method because of its ability to rank companies with big data.
This paper is divided into four sections. Section 2 presents the theoretical background, the literature review on market reaction to the announcement of the green bond issuance, and the research hypotheses. Section 3 explains the methodology and data employed in this study. Section 4 outlines the empirical results. Finally, Section 5 concludes with suggestions for future research.

2. Theoretical Background, Literature Review, and Hypotheses Development

2.1. Theoretical Background

In order to explain the relationship between green bond issuance and market reaction, we need to return to our theoretical framework, which is based on the mobilization of three theories: signaling theory, agency theory, and stakeholder theory.

2.1.1. The Signaling Theory

Signaling theory provides a suitable theoretical framework for understanding the notion of informational asymmetry between bond issuers and investors. Indeed, issuers hold information that investors do not, so the latter depend on signals emitted by issuers to deduce the quality of the company (Stiglitz 2000). The “green” label affixed to bonds is a vector of information that signals to investors the company’s willingness to implement a sustainable strategy that respects the environment and is efficient at the same time. This label increases demand for the bond, thereby lowering the cost of capital.
Credible signals enable investors to distinguish high-quality or well-performing companies from lower-quality ones, instilling confidence in their intentions and performances. Applying signaling theory to the context of green bonds, companies truly committed to environmentally friendly practices (high-quality companies) can differentiate themselves as greener by self-selecting for certification or listing on a green exchange, which requires a higher cost and greater effort than standard green bond issuance.
According to Erhart (2018) and Kapraun et al. (2021), green exchanges offer greater visibility for listed bonds. As a result, it would be easier for environmentally conscious investors to find bonds that suit them. Flammer (2018) showed that green bonds enhance firms’ financial and environmental performance while being used as an environmental performance signaling tool. This approach is likely to gain credibility for various reasons. Firstly, they commit to allocating significant amounts to ecological projects, implying a substantial financial investment on their part, showcasing their willingness to support environmentally favorable initiatives. Investors may interpret this financial commitment as a credible signal of the company’s intention to promote sustainable practices.
Empirical studies have shown a significant positive reaction in share prices following the announcement of a company’s green bond issuance. Shareholders often see this type of financing as value-creating, as funds from green bonds are used for profitable projects or as a means of risk management able to attract investor attention, raise awareness of sustainability issues, and reduce borrowing costs for the issuing company or entity (Tang and Zhang 2020; Wang et al. (2020); Flammer 2021; Laborda and Guerra (2021), as well as Verma and Bansal (2021) and Camacci (2022); Pamungkas et al. 2023).
The rise of the green bond market is linked to the Paris Agreement and growing awareness of environmental urgency. Investors are looking for investment opportunities aligned with sustainable objectives that have contributed to the strong expansion of the green bond market. Issuing green bonds can signal to the market that the issuing company or entity is committed to environmental and social sustainability, which can increase investor attention and positive sentiment towards the company’s actions (Ahmed et al. 2023). Moreover, issuing green bonds can help raise awareness of environmental and social issues among investors and the market as a whole. This can lead to a demand for sustainable investment opportunities, which, in turn, can drive up the price of stocks deemed environmentally and socially responsible (Glavas 2019). This is particularly true for investors who prioritize sustainability issues in their investment decisions (Fan et al. 2023). Yang (2024) reveals that Apple Inc.’s involvement in green bonds strengthens its corporate image and attracts investors sensitive to social and environmental issues. Issuing green bonds can also help to reduce the cost of capital for the issuing company or entity.
Flammer (2021), Fatica and Panzica (2021), and Yeow and Ng (2021) have analyzed whether the issuance of green bonds has been used for greenwashing purposes, that is, to make it appear that the company is more environmentally aware than it really is, or whether companies are really sending a credible signal to their stakeholders regarding their environmental commitment. The results obtained support the signaling argument, especially when the issuances have certifications attesting to the “greenness” of the bond. Secondly, green bonds are often verified by independent organizations. These verifications ensure that the funds collected through these bonds are genuinely used to finance the ecological projects described in the bond-related documents. This transparency enhances the credibility of the signal sent by the company, as investors can trust that the funds will be used in accordance with the declared environmental objectives. With this in mind, Zirek and Unsal (2023) assessed the credibility of green bond certification, as well as its relevance and legitimacy as a signaling tool. They show that certification is sufficiently rigorous to guarantee that the capital raised by issuing green bonds actually finances environmentally friendly projects, which could enhance transparency.

2.1.2. The Agency Theory

The works of Fama and Jensen (1983) as well as Jensen and Meckling (1976) have laid the foundations of agency theory. These authors have brought to light the inherent challenges in managing companies where executives act as agents on behalf of shareholders, the owners of the company. This agency relationship creates a potential conflict of interest, as executives may be tempted to prioritize their personal interests over those of the shareholders. This is where the board of directors comes in as an essential governance body responsible for overseeing the actions of executives and ensuring they act in the best interests of the company and its shareholders.
According to Masulis and Reza (2015), corporate use of CSR strategies is aligned with the interests of managers, not shareholders. Funds allocated to CSR practices (often in the form of donations) are often used to protect the interests of CEOs and suggest misuse of company resources and a reduction in their value. Barnea and Rubin (2010) argue that top managers tend to over-invest in CSR activities to enhance their reputational capital, particularly as “good citizens”. Issuing green bonds can be considered a CSR activity. Glavas (2022) uses agency theory to explain the use of green bonds. His results suggest that agency motive is a key determinant of the decision to issue a green bond. Top managers use green bond issuances to signal their commitment to the fight against global warming, and their desire to be seen as “good” corporate citizens.
Based on these findings, companies with agency problems are the ones most likely to issue green bonds. In other words, if a company suffers from agency problems, its managers may be tempted to issue a green bond to reinforce their image as “good citizens”. The managers and shareholders of the company issuing green bonds benefit from a positive investor response but claim that the investment costs always exceed this positive response. Indeed, issuing green bonds entails additional costs compared with conventional bonds for a given bond issuer. Caramichael and Rapp (2024) studied a global panel of green and conventional corporate bonds to assess the borrowing cost advantage at issuance for green bond issuers. They found that, on average, green corporate bonds have a yield spread that is between 3 and 8 basis points lower relative to conventional bonds. According to them, this borrowing cost advantage, or “greenium”, is related to the pressure at issuance. These costs are also linked to the additional auditing and reporting work dictated by the international guidelines accompanying the issuance of green bonds.
In support of the agency’s motive, issuing green bonds involves additional costs and risks, and could therefore lead to a misallocation of investor funds. For example, managers may display a greater inclination to fund green projects, even if these projects have negative net present value or are less favorable compared to non-green projects. For companies with agency problems, management may decide to issue green bonds in order to reassure investors about the company’s allocation of funds and its willingness to align itself with their interests, despite the additional costs involved in issuing green bonds. In this case, issuing green bonds is a partial remedy to agency problems.
Glavas and Bancel (2019) have shown that agency issues play an important role in green bond issuance. Their research identifies key indicators linked to agency issues, such as the size of the board of directors, the value of floating shares relative to market capitalization, and the ratio between supply and demand for shares. The market price and the bid–ask spread influence the decision to issue green bonds. Buchanan et al. (2018) have shown that there is a significant negative correlation between ESG/CSR indicators and Tobin’s Q. They concluded that when agency problems are greater, the costs associated with companies’ overinvestment in ESG/CSR indicators are even higher, leading to a decrease in the value of companies with higher ESG/CSR scores.
Issuing green bonds to solve agency problems can have a negative impact on company value, harming shareholders’ interests and reducing the company’s overall financial performance.
Agency theory is one of the most important theoretical underpinnings around which our paper is structured. We aim to better understand how the issuance of green bonds constitutes a means of managing agency relations between shareholders and management, and how the market reacts to this signal.

2.1.3. The Stakeholder Theory

The stakeholder theory, formulated by Freeman in 1984, revolutionizes the traditional conception of the role of the board of directors within a company. In contrast to the classical approach, which focuses solely on shareholder value maximization, this theory emphasizes the idea that companies have a responsibility to balance the interests of all stakeholders involved, including employees, customers, suppliers, local communities, and the environment. This result can be explained by the company’s ability to integrate itself into a social investment policy and to respond to its major concerns towards its stakeholders. A socially responsible company is expected to record above-average profits. These results confirm the good management hypothesis (Freeman 1984; Fikri 2015).
A concrete example of the application of this theory can be found in the adoption of environmental strategies. Modern companies increasingly recognize the importance of environmental sustainability and integrate eco-friendly practices into their operations. This goes beyond merely creating value for shareholders, as these strategies consider environmental issues and aim to minimize the ecological impact of the company.
The role of the board of directors is crucial in this context, as it is tasked with developing sustainable policies that take into account the long-term interests of both executives and stakeholders. According to this point of view, the board of directors should improve relationships between the company and its stakeholders and develop sustainable policies by aligning the long-term goals of managers and stakeholders (Michelon and Parbonetti 2012). This involves aligning the company’s objectives with those of stakeholders to create a mutually beneficial relationship and ensure the long-term viability of the company.

2.2. Literature Review and Hypotheses Development

2.2.1. Literature Review on Market Reaction to the Announcement of the Green Bond Issuance

The announcement of a green bond issuance is seen as a positive signal, prompting stock markets to react. According to the semi-strong form of the efficient market hypothesis efficient market, new public information is continuously incorporated into the share price. Consequently, any change in the share price suggests that an event has taken place. This event may be the issuance of green bonds and may alter the value of the company (Parlour and Rajan 2020). Baulkaran (2019), defines green bonds as a value-added financing instrument for shareholders. The stock market reacts positively to the announcement of a green bond issuance if it creates value for the company. This value creation takes the form of reduced costs, lower environmental impact, and improved performance. This positive effect is more pronounced for certified bonds (Flammer 2021). Pham and Huynh (2020) study the elements that determine the performance of green bond markets. Their studies highlight investor attention as measured by the daily Google search volume index. Piñeiro-Chousa et al. (2021) analyzed the influence of social networks on investor sentiment. They reported that social networks provide investors with useful information that they take into account in the green bond issuance decision-making process. Tolliver et al. (2020) use a structural equation model on panel data from green bond issuances in 49 countries. They analyze the impact of factors such as the size of the economy, trade openness, capital account, and distance from the equator on the size of green bond issuance. These elements lead to the development of the government bond market, while the control of corruption and the quality of the bureaucracy are determining factors for the development of the green bond market (Eichengreen and Luengnaruemitchai 2004). Banga (2019) argues that the detractors of conventional bond issuance are similar to those of the green bond mission. Also, the commitment of political decision-makers to climate issues and environmental problématqiiues are key determinants of the development of the green bond market in different countries.
Chiesa and Barua (2019) show that coupon, rating, the issuer’s sector, and financial situation influence the size of the green bond issuance. Anh Tu et al. (2020) studied the factors behind green bond issuance. Their study shows that legal infrastructure, interest rates, and economic stability have a significant impact on the amount of green bonds issued on the markets. It is also worth noting that green public policies and the issuance of green bonds by the government are considered a win–win solution for the development of this market (Monasterolo and Raberto 2018).
Wang et al. (2020) and Zhou and Cui (2019) show that the issuance of green bonds impacts both share prices and the value of derivatives held on these shares. Glavas (2019) examined the reaction of U.S. stock prices to green bond issuance, analyzing 780 bonds, both green and conventional. Results showed that green bond announcements generated a more significant and lasting positive reaction in financial markets compared to conventional bonds. The study highlighted the positive impact of global environmental goals, such as the Paris Agreement, and noted that political events like presidential elections could influence investor perception. Baulkaran’s study (Baulkaran 2019) revealed positive and statistically significant abnormal returns around the announcement of green bond issuances by European companies. The 21-day CAR suggested that green bonds were perceived as value-creating instruments for financing growth and managing risks. Anggraeni et al. (2019) illustrated the effect of green bond issuances on the Indonesian stock market, focusing on 16 listed banks from 2013 to 2017. The study employed descriptive and quantitative approaches, utilizing event study methodology.
Results indicated that announcements of green bond issuances, dividends per share, net interest margin, and exchange rates had a significant positive impact on stock prices, while factors such as non-performing loans, debt-to-equity ratio, and central bank interest rates had a negative influence. Kuchin et al.’s study (Kuchin et al. 2019) emphasized the market’s reaction to green bond issuances and whether this reaction was influenced by green certification. Using data from 95 bonds issued by 17 issuers globally, the study confirmed a positive market reaction, leading to increased valuation for issuing companies. However, the presence of a green label alone did not guarantee a positive market response; it depended on various factors such as capital structure and leverage.
Wang et al. (2020) studied the impact of sustainable bond issuance by Chinese companies on debt financing costs and stock market reactions. Using a sample of 159 bonds, including corporate green bonds and enterprise green bonds, they found a positive effect on the cost of debt for sustainable bond issuers. Market reactions indicated positive returns at the announcement, suggesting investor favorability towards sustainability initiatives. Wang’s study in 2020 focused on Chinese companies’ green bond issuance impact on stock performance and market attention. Analyzing 767 green bond issuances from 2011 to 2019, the study revealed a significantly negative impact on stock returns, particularly in the A-share market. Investors’ attention did not result in excessive market reactions, indicating potential challenges and lower awareness of green bonds in mainland China. Tang and Zhang (2020) emphasized the benefits of green bonds for shareholders, analyzing 1510 green bonds issued in 28 countries between 2007 and 2017. The study found positive stock returns for existing shareholders, increased institutional ownership, and improved stock liquidity associated with green bond issuances. Investors exhibited a heightened interest in companies’ environmental activities when making investment decisions.
Laborda and Guerra (2021) focused on evaluating the influence of green bond issuance on European company stock prices. Analyzing 134 green bonds issued between January 2007 and December 2019, they found that stock prices remained stable before the announcement but experienced a significant increase after. The positive effect persisted for three days on average, with a cumulative abnormal return (CAR) reaching 0.28%. This contrasts with traditional capital increase announcements, where stock prices typically decline. Xi and Jing (2021) explored the impact of environmental bonds on the stock prices of Chinese companies listed in Shanghai and Shenzhen between 2016 and 2018. Results indicated a positive effect on stock prices, particularly for companies issuing green bonds for the second time. Increased investor attention towards sustainable initiatives contributed to the positive market response. Lebelle et al. (2020) investigated market reactions to green bond announcements by examining a sample of 475 bonds from 145 issuers between 2009 and 2018. Surprisingly, the study found a negative market reaction to green bond announcements, indicating that investors interpreted them as signals of uncertainty regarding the future profitability of issuing companies. The negative reaction was more pronounced for first-time issuances and in developed markets compared to emerging markets.
Verma and Bansal (2021) conducted the first study on the impact of green bond issuance on stock returns in the Indian context. Using secondary data from six companies in the banking and financial sector, they employed an event study methodology to compare performance before and after green bond issuance. Results showed a significant positive impact on stock returns for most studied companies, reversing negative trends before issuance.
Cioli et al.’s analysis (Cioli et al. 2021) focused on global companies’ stock price reactions to environmental bond issuances from 31 January 2013 to 1 September 2019. Investors responded positively, especially to the first-time issuances, although the positive reaction diminished for subsequent issuances. The study emphasized the importance of continuous innovation and improved environmental performance for attracting environmentally focused investors. Flammer’s exploration (Flammer 2021) of 1189 international green bond issuances between 2013 and 2018 revealed positive market impacts. The announcement of green bond issuances positively affected stock prices, especially when bonds were certified by third parties or represented a company’s initial green bond issuance. Companies improved their environmental performance, attracting long-term investors interested in environmentally friendly initiatives. Chen et al. (2022) conducted a comparative analysis of mainland China and Hong Kong stock market reactions to sustainable financial instruments’ issuance. The study, based on 82 unique green bond announcements from 2016 to 2019, found a generally positive market response, influenced by factors such as the issuing company’s sector, environmental commitment, and bond characteristics.
Recently, in Fan et al.’s research (Fan et al. 2023), a sample of 2160 Chinese green bonds issued between January 2016 and February 2022 was analyzed using an event study methodology. Short-term impacts included positive market reactions during announcements, particularly for first-time issuers. Long-term effects involved improved environmental disclosure and increased attraction for environmentally conscious investors. Birindelli et al.’s study (Birindelli et al. 2023) focused on the market reaction to COP26, analyzing stock prices of 7587 companies from carbon-intensive sectors across China, the U.S., the EU, and India. Results showed that stock prices reacted based on expectations of climate policies, with strict policies leading to the depreciation of stocks for highly polluting companies and lenient regulations resulting in positive valuations. Wang (2023) assessed the impact of corporate green bonds on the Chinese stock market, investors’ reactions, and the cost of capital. Analyzing 174 green bonds from 78 companies, the study found positive market reactions upon announcement, with institutional investors showing increased interest. The absence of a significant premium suggested that investors did not overvalue green bonds compared to other bond types.
Khurram et al. (2023) highlighted the tangible impact of green bond issuance on companies’ performance and market value in China. Using a differences-in-differences model and analyzing data from 2016 to 2020, the study found that green bond issuance positively affected companies’ innovation performance and increased their long-term market value. Dumlu and Keles (2023) explored the immediate effects of green bond issuances on Turkish companies’ stock returns, focusing on 11 announcements from nine companies. The study found immediate positive effects on stock prices, aligning with global trends and reflecting the growing importance of green finance in the Turkish financial context.

2.2.2. Hypotheses Development

This study focuses on the impact of green bond issuance on the stock market. The analyzed literature highlights a growing interest in the use of these sustainable financing instruments. Green bond issuance can impact stock market reactions in a number of ways (Wang 2020).
Our study involves the development of six hypotheses.
Signal theory explains how green bond issuers use these instruments to send a positive signal to investors. By issuing green bonds, companies show their commitment to sustainable development, which can reduce perceived risks and encourage responsible purchasing behavior.
Based on the same signaling theory, Lebelle et al. (2020) suggest that these green bond issuances may also have a negative impact on stock prices. Their study suggests that investors often interpret these announcements as signals of uncertainty regarding the future profitability of issuing companies.
The market’s reaction to the green bond issuance can also be viewed from the angle of a second theory, that of agency theory. Returning to the framework of agency theory, we find that the issue of green bonds helps to resolve agency problems between shareholders and management. For companies with agency problems, management may decide to issue green bonds in order to reassure investors about the company’s allocation of funds and its willingness to align itself with their interests, despite the additional costs involved in issuing green bonds. In this case, issuing green bonds is a partial remedy to agency problems. Issuing green bonds to solve agency problems can have a negative impact on company value, harming shareholders’ interests and reducing the company’s overall financial performance.
According to the prism of stakeholders’ theory, issuing green bonds can be seen as a response to their expectations regarding a company’s sustainability and environmental responsibility.
By issuing regular reports and certifications issued by third parties, green bonds reduce information asymmetry and strengthen transparency (Hyun et al. 2020). This leads to an increase in the trust of stakeholders and the strengthening of the reputation and image of the company which has actively adopted CSR practices (like issuing green bonds). According to Tang and Zhang (2020), the trust of all stakeholders has a positive impact on the value of the company and leads to a favorable reaction from the stock markets.
Another theory that allows us to better understand the market reaction following the issuance of green bonds is the greenwashing hypothesis. According to this theory, companies announce their issuance of green bonds to signal that they support environmental and climate policies, even if they have no serious intention of financing green projects. According to the greenwashing hypothesis, announcing a green bond issuance would not lead to a rise in a company’s shares.
The first version of the greenwashing hypothesis maintains that the stock market simply ignores the announcement of a green bond issuance and that this does not induce any reaction from the stock markets. A second version of the greenwashing hypothesis suggests that the stock market reacts negatively to the announcement of a green bond issuance because it indicates that management is in no way interested in dealing with the operational, financial, and regulatory requirements of their companies (Bhagat and Hubbard 2022). According to Bebchuk and Tallarita (2020), leaders could legitimately claim that they are focused on employees, customers, or the environment rather than the long-term value of the company.
Flugum and Souther (2021) note that some executives publicly embrace ESG policies to cover up their poor financial performance. When managers do not achieve the expected benefits, they take refuge in CSR practices. On the other hand, when they achieve their objectives, they do not apply CSR strategies and do not communicate around ESG dimensions.
In short, green bonds are a way for issuers to finance green projects while meeting growing investor demand for responsible investment. Their success depends on investors’ confidence in the sincerity of issuers and the ability of the projects financed to generate a positive impact on the environment and society.
In short, green bond issuance can have a positive impact on stock market reaction however, the exact impact on the share price can depend on a variety of factors, including market conditions, company performance, financial leverage GDP growth, the governance indices…
Therefore, we formulate our first hypothesis as follows:
H1
A positive stock market reaction is recognized when a company announces a green bond issuance.
The first hypothesis provides answers to the general question we are addressing, which is to test the impact of green bond issuance on stock markets. Hypotheses 2 to 6 seek to answer what the characteristics of the company and the green bonds are that affect the degree of stock market reaction.
Previous research indicates that issuing these bonds creates value in the form of abnormal returns, as people appreciate signals of environmental commitment. Very little research has taken into account variables such as company size and bond size. These two variables can have an impact on the way stock markets react to green bond issuances.
The issue volume of green bonds corresponds to the size of the bonds divided by the company value. This variable allows us to examine whether the market reaction varies with the relative size of the issue, and then to detect the sense and amplitude of this variation. The reasoning behind this approach stems from the theoretical frameworks of greenwashing and signal theory. These theories state that the issuance of a large amount of green bonds may indicate that the company is more committed to green projects, and the issuance of a small amount may suggest that the company is just concerned with its brand image, without having any real interest in green financing issues.
Relative bond size is important because it conveys a signal about the authenticity of a company’s environmental commitment. Issuing a large volume of green bonds could now mean that a company is more committed to tackling the environmental challenges we face today. On the other hand, a low volume of issuance could indicate that the company is using green bonds as a marketing strategy and greenwashing tool.
Chiesa and Barua (2019) assert that the volume of green bond issuance is positively correlated with the issuer’s financial position and credit rating, the coupon rate and availability of collateral, and the sector in which the issuer operates. These characteristics point to a growing demand for green bonds. They are seen as reliable and yielding returns for investors. This facilitates high-volume issuance, leading to a positive reaction from stock markets.
Lebelle et al. (2020) found that there is no significant relationship between the size of green bond issuance and the market reaction.
As far as the signal theory is concerned, a company can signal its social and environmental commitment by issuing a very large volume of green bonds. The larger the amount, the more the company is perceived as a good corporate citizen, committed to CSR practices. The same effect is expected if we apply agency theory. To this end, the issuance of a large volume of green bonds can be perceived by the market as a signal and vector of the issuer’s willingness to reduce conflicts of interest between managers and shareholders. However, if this signal is not credible, the opposite effect will be recorded, and we can expect a negative correlation between the size of the green bond issuance and market reaction. The impact on the markets therefore depends on investors’ confidence in the signals sent by the issuer and its ability to align its interests with those of its shareholders. In a more global sense, the volume of green bond issuances is a signal interpreted and decoded by all stakeholders.
Thus, our second hypothesis is as follows:
H2
The markets react positively when a company announces the issuance of a large amount of green bonds.
In their study, Lestari et al. (2023) uncovered significant influences on stock returns, noting that earnings per share (EPS), debt-to-equity ratio (DER), and firm size play pivotal roles. Similarly, Baulkaran (2019) revealed intriguing insights, illustrating a positive correlation between firm size, Tobin’s Q, and growth with cumulative abnormal returns, while observing a negative association between operating cash flow and cumulative abnormal returns. These findings contribute valuable nuances to the literature on stock market dynamics and investment strategies. Yuliarti and Diyani (2018) found that firm size, return on equity, current ratio, as well as cash flow from operating and investing activities, did not have a significant effect on stock return. Furthermore, Akbar et al.’s study (Akbar et al. 2024) on green bond issuance and its impact on G7-listed firms found a positive correlation with shareholder wealth maximization, spanning from January 2015 to August 2022. Their research supports the notion that adopting sustainable financing practices like green bonds can enhance firm value while aligning with environmental goals.
According to Chen et al. (2023), the positive correlation between green bond issuance and corporate ESG performance is more prominent among companies with larger sizes. Firm size can influence ESG scores (Drempetic et al. 2019).
Accordingly, we formulate the following third hypothesis:
H3
A positive stock market reaction is observed for large companies announcing the issuance of green bonds.
The literature reveals that the efficacy of green bond issuance goes beyond the mere presence of a green label, as underscored by Kuchin et al. (2019). Additional company-specific variables, such as leverage and capital structure, play pivotal roles in determining its positive impact. Moreover, Anggraeni et al. (2019) investigated the Jakarta stock exchange context and identified several key factors influencing stock prices. They observed that announcements regarding corporate bond issuances, dividends per share, net interest margin, and exchange rate fluctuations between the Indonesian rupiah and the US dollar were associated with significant and positive stock price movements. Conversely, variables such as non-performing loans, debt-to-equity ratio, capital adequacy ratio, Bank of Indonesia interest rates, and inflation exhibited significant negative effects on stock prices.
Tannady et al. (2023) explored how profits, debt, growth, and stock prices impact property companies on the IDX. It found that profits and growth contribute positively to company value, while debt levels significantly influence both stock prices and overall company worth.
In line with the above proposals, we formulate the following hypothesis:
H4
A positive stock market reaction is observed when a company with high financial leverage announces a green bond issuance.
Fichtner and Joebges’s (2024) study investigates the relationship between stock indices and real economic activity from 1991 to 2019, addressing potential reasons for their decoupling. Findings suggest that a permanent one-percent change in stock prices is associated with a modest 0.2 percent long-run effect on GDP, materializing within two to three years, though less pronounced and slower for non-Anglo-Saxon economies and during stock price decreases. In contrast, Patatoukas (2021) delves into the interplay between stock returns and economic growth news. Despite thorough investigation, the study finds the correlation between these factors to be statistically insignificant.
According to Tolliver et al. (2020), the capacity to issue green bonds is positively correlated with the size of the economy. Presbitero et al. (2016) show that the higher the GDP per capita, the more frequently the government will tend to issue green bonds. Glomsrod and Wei (2018) confirm that the use of green financing contributes to strengthening economic growth, as is the case in the European Union.
Thus, we formulate the following hypothesis:
H5
The markets react positively when a company belonging to a country with high GDP growth announces a green bond issuance.
Chowdhury et al. (2023) conducted a comprehensive examination of the relationship between corruption and stock market development across various countries. Their findings reveal that while corruption does not exhibit a significant impact on stock market development universally when stratifying the data into high-income (developed) and low-income (developing) countries, a noteworthy correlation emerges. Specifically, in high-income countries, lower levels of corruption are associated with higher stock market capitalization relative to GDP. Contrarily, Aljazaerli et al. (2016) uncovered a contrasting trend in their investigation, indicating a positive influence of corruption on stock market development, particularly in terms of market capitalization. This insight suggests a potential role for corruption in facilitating economic transactions and aiding private enterprises in navigating bureaucratic hurdles within GCC (Gulf Cooperation Council) nations, thereby fostering stock market growth.
Furthermore, Lin et al. (2016) contributed to the literature by analyzing the impact of misconduct by US-listed foreign firms from perceived corrupt countries. Their research underscores a negative investor reaction towards similar companies within the same country, particularly impacting smaller firms, non-dividend payers, and those not audited by top-tier auditing firms. Interestingly, this adverse reaction diminished following the enactment of the Sarbanes–Oxley Act in 2002, suggesting a regulatory intervention mitigating investor concerns regarding misconduct-associated risks.
The sixth hypothesis is formulated as follows:
H6
The markets react positively when a company belonging to a country with high control of corruption announces a green bond issuance.

3. Methodology and Data

3.1. Methodology

Multidimensional Scaling (MDS) is a data analysis technique designed to visually capture distinctions between pairs of objects. MDS achieves this by mapping data into a multidimensional space. This abstract space is characterized by multiple dimensions, with each dimension aligning with the variables or features utilized to describe individual objects or groups.
The objective of MDS is to reduce the number of dimensions while preserving the relationships or similarities between objects. This facilitates the visualization and understanding of underlying structures in the data. In this multidimensional space, it is crucial that the distance between objects optimally reflects the original measures of similarity or dissimilarity. As a result, similar objects are positioned close to each other, while dissimilar objects are positioned farther apart. This technique was developed in the 1930s by psychologists seeking to understand how individuals perceive and evaluate differences between objects. Originally, MDS was based on the distance formula, modeling perception and judgment by assuming that individuals form a mental representation of objects in a psychological space generated by subjective attributes.
The widespread adoption of MDS occurred in the 1950s and 1960s, particularly by statisticians analyzing dissimilarity data in fields such as psychology, sociology, geography, and biology. The evaluation of the fit of an MDS solution relies on the stress value, a measure of fit where a value close to zero indicates a perfect fit and 1 indicates the worst possible fit.
To measure dissimilarities between objects, the Euclidean distance formula is employed. The Euclidean distance (dij) between objects i and j in a p-dimensional space is defined as follows:
d i j = r = 1 p   ( x i r x j r   ) 2
where xir represents the coordinate of object i in dimension r of the p-dimensional space, and xjr represents the coordinate of object j in the same dimension. The formula calculates the Euclidean distance by taking the square root of the sum of the squares of the differences between the corresponding coordinates of the two objects in all dimensions.
In our study, we apply this approach to categorize the 29 companies in our sample based on their responses to green bond issuances. In other words, we aim to group these companies based on their return fluctuations using this method to create a financial map.
Our objective is to obtain a graphical representation with the smallest possible number of dimensions. To achieve this, we utilized PROXimity SCALing, also known as the PROXSCAL procedure in IBM-SPSS version 27. This technique reduces the normalized raw constraint, providing a more precise approximation of distances between input data (Nobbir and Harvey 2007; Khiari and Nachnouchi 2018).
Unlike other MDS methods, our approach relies on an iterative up-weighting algorithm, which facilitates resolution and enhances the efficiency of the results obtained.
Our study encompasses two dimensions. The first examines the variation in stock market return before the issuance announcement, while the second focuses on the variation in stock market return after the issuance announcement. We analyze the return behavior of issuing companies over a 60-day window, divided into two parts: the 30 days preceding the issuance date and the 30 days following the issuance date.

3.2. Data and Descriptive Statistics

The initial sample included 163 companies that issued green bonds between 2010 and 2022, originating from various regions worldwide and operating across a diverse range of industries. However, due to crucial missing data such as total debt, total equity, and total assets, a number of companies had to be excluded from the sample, reducing it to 49 global green bond issuers. Among these 49 companies, it was not possible to trace the historical actions of all companies at their issuance date. Consequently, our final sample was further reduced to 29 companies that made 124 green bond issuance announcements between 2010 and 2022.
These companies are distributed across three continents: the Americas (Canada, Brazil, United States, and the Cayman Islands), Asia (Japan, South Korea, Turkey, India, Hong Kong, Taiwan, China, and the United Arab Emirates), and Europe (the Netherlands and Austria). The companies operate in various sectors, primarily including the banking sector, real estate, renewable energy, corporate financial services, and photovoltaic solar equipment.
As shown in Table 1, our research data were obtained from the Eikon Refinitiv datastream, Yahoo! Finance, investing.com, and the World Bank website.

3.3. Variables

Our study requires the use of several distinct variables. These variables assist us in interpreting the results related to the distribution of the selected companies based on their reactions following the announcement of the green bond issuance.
Our aim is to determine the explanatory factors, whether financial or otherwise, that influence return behavior. The Table 2 below presents the variables related to the specific characteristics of companies included in our study.

4. Empirical Results
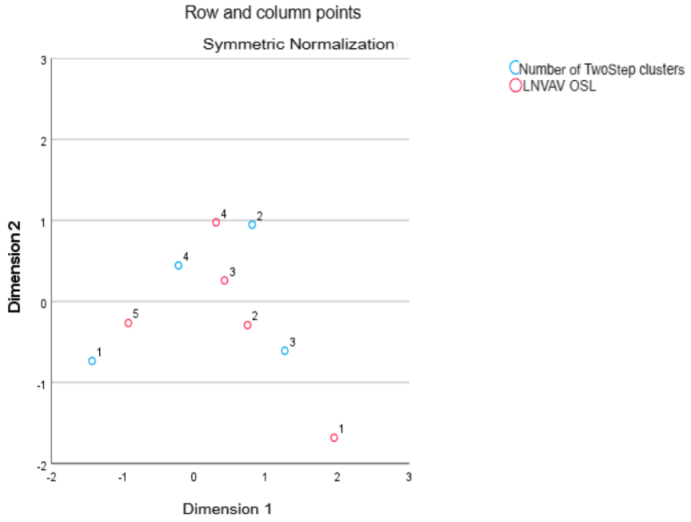
4.1. Financial Map

By analyzing our financial map (see Figure 1 below), we observed the presence of extreme points located at a significant distance from the points grouped in the same area of this space.
These extreme points are as follows:
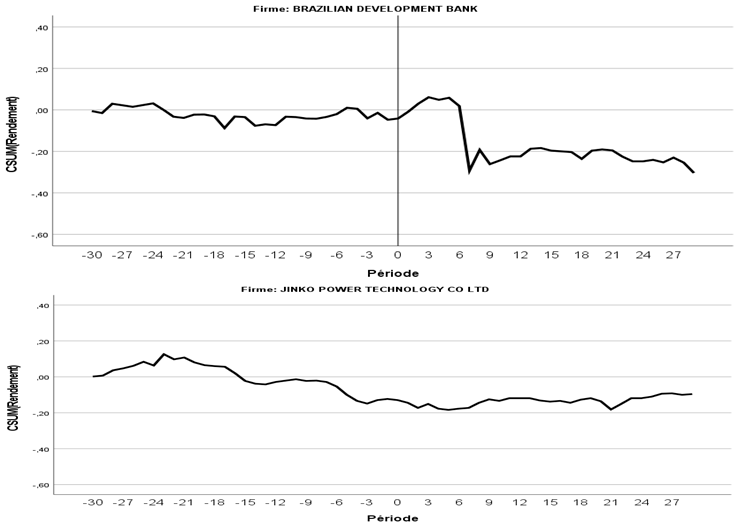
  • VAR 14 represents Jinko Power Technology Co., Ltd.
  • VAR 7 represents Brazilian Development Bank
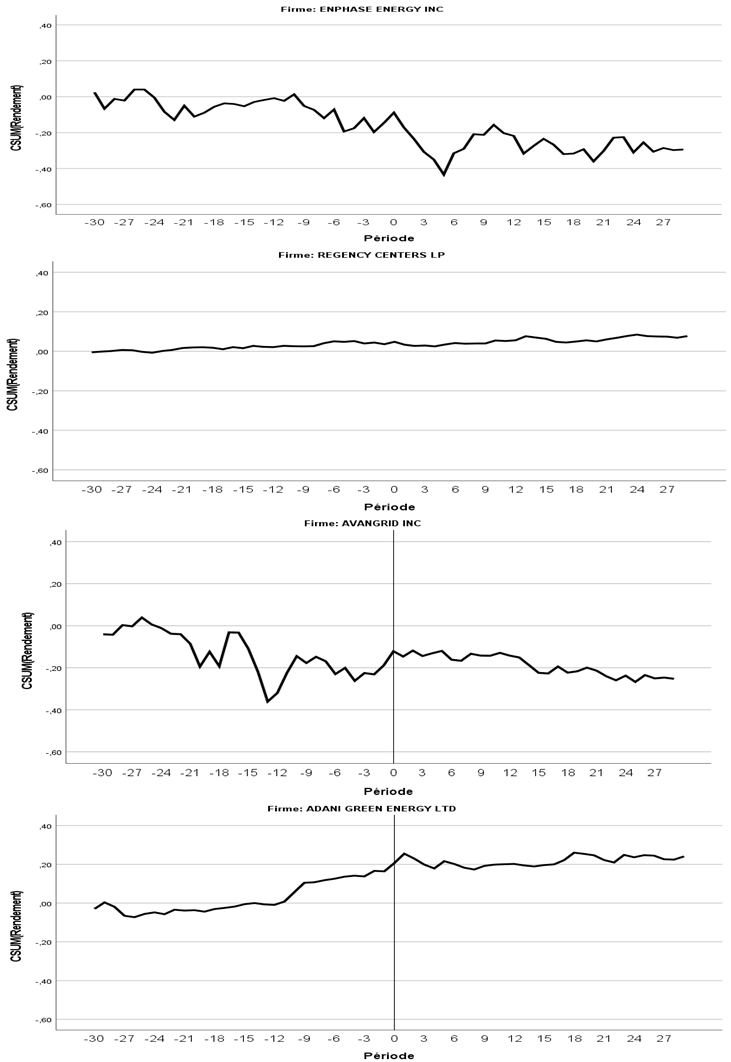
  • VAR 9 represents Enphase Energy Inc.
  • VAR 22 represents Regency Centers LP
  • VAR 5 represents Avangrid Inc.
When analyzing the charts illustrating the variations in return for these five companies, one month before and one month after the issuance announcement, the following can be observed1:
For the “Brazilian Development Bank” (VAR 7), a significant increase is observed immediately after the issuance date, followed by a marked decline after the sixth day. However, there is a subsequent short-term recovery.
For “Jinko Power Technology Co., Ltd.” (VAR 14), “Enphase Energy Inc.” (VAR 9), and “Regency Centers LP” (VAR 22), a short-term decline is noted, followed by a moderate recovery in their stock prices in the days following the issuance. In the case of “Avangrid Inc.” (VAR 5), short-term fluctuations, both rising and falling, are observed throughout the 27 days following the issuance date.
In summary, it can be concluded that these companies situated in extreme positions share an upward trend whether minimal or significant. Short-term volatility appears to be a common characteristic with periods of decline followed by recoveries indicating a complex but generally positive dynamic for these entities. The performance of “Enphase Energy Inc.”, “Regency Centers LP”, and “Avangrid Inc.” may be attributed to their strategic location in the United States, a predominant region in the global green bond market, as highlighted by the rankings from the Climate Bonds Initiative (CBI). These companies secured the first position in 2020 and 2021 and the second position in 2022 in the CBI rankings, corresponding to the years of their issuance. Similarly, “Jinko Power Technology Co., Ltd.”, based in China, holds the top position in the CBI rankings in 2022, reflecting the year of its issuance. Upon examining our data, it is evident that all these companies generate significant emissions, which can be attributed to their solid reputation that instills confidence in investors. Additionally, they stand out due to their large size, providing them with the necessary resources to actively engage in sustainable projects. This financial and operational capacity enhances the ability of these companies to actively participate in initiatives aimed at promoting environmentally and socially responsible business practices.
While reviewing the websites of these entities, we noted that the “Brazilian Development Bank” officially implemented an ESG (Environmental, Social, and Governance) responsibility policy on 24 October 2019, validated by its board of directors and approved by its advisory board on 7 November 2019. However, it is important to note that its green bond issuance took place in 2017, pre-dating the adoption of this policy. This chronological sequence could explain the observed decline a few days after the issuance.
“Jinko Power Technology Co., Ltd.” positions itself as a global provider of sustainable energy services with a commitment to addressing environmental issues by providing clean energy to combat climate change. In 2022, the company officially entered the wind energy market by launching its own range of domestic photovoltaic systems. This initiative coincides with the issuance of green bonds, explaining the evolution of its stock prices. “Enphase Energy Inc.” has revolutionized the solar industry with its microinverter technology, offering a clean, safe, and scalable energy source. “Regency Centers LP” places great importance on ESG values considering them fundamental to its long-term success as indicated in its 2022 corporate responsibility report. Finally, “Avangrid Inc.” positions itself as a leader in sustainable energy in the United States offering a diversified range of services, thus contributing to the transition towards a more sustainable energy future.
In conclusion, the information gathered from company websites clearly reveals their commitment to promoting sustainable practices in their operations, which could be the cause of the upward trend in their stock prices.
When analyzing the charts of companies grouped in the same space, we observed that at the end of the month following their issuance, there is a tendency either upward or downward for these entities in the last days of that month. Half of these 24 companies operate in the banking sector (12 out of 24), while the rest are distributed among renewable energy, plastics production, and automobile manufacturing.
Many of these companies belong to countries that are among the top 20 issuers of green bonds in 2021 and 2022, according to the Climate Bonds Initiative (CBI). Among these countries, the United States ranked first, China third, the Netherlands seventh, Korea eleventh, Japan thirteenth, Canada fourteenth, and Hong Kong fifteenth in 2021. In 2022, the rankings slightly changed with China taking the first place, the United States second, the Netherlands fifth, Japan tenth, and Canada eleventh. This significant involvement of these countries in issuing these bonds could influence market trends due to market dynamics.

4.2. Results of the MDS Approach

The goodness-of-fit indices offered by the PROXSCAL procedure are presented in Table 3 below:
The Multidimensional Scaling (MDS) analysis results for a two-dimensional representation show a generally good fit. The normalized raw stress, which measures the deviation between the obtained configuration and the ideal one, is assessed at 0.08066, which is considered a favorable fit level as it is below the generally accepted threshold of 0.1 according to the criteria of Kruskal and Wish (1978). Furthermore, Tucker’s Congruence Coefficient is 0.95882, indicating a remarkably high fit of the model. Tucker’s Congruence Coefficient measures the similarity between the relative positions of objects in the multidimensional space obtained by the model and in the real space. A value close to 1 suggests a fit close to perfection.

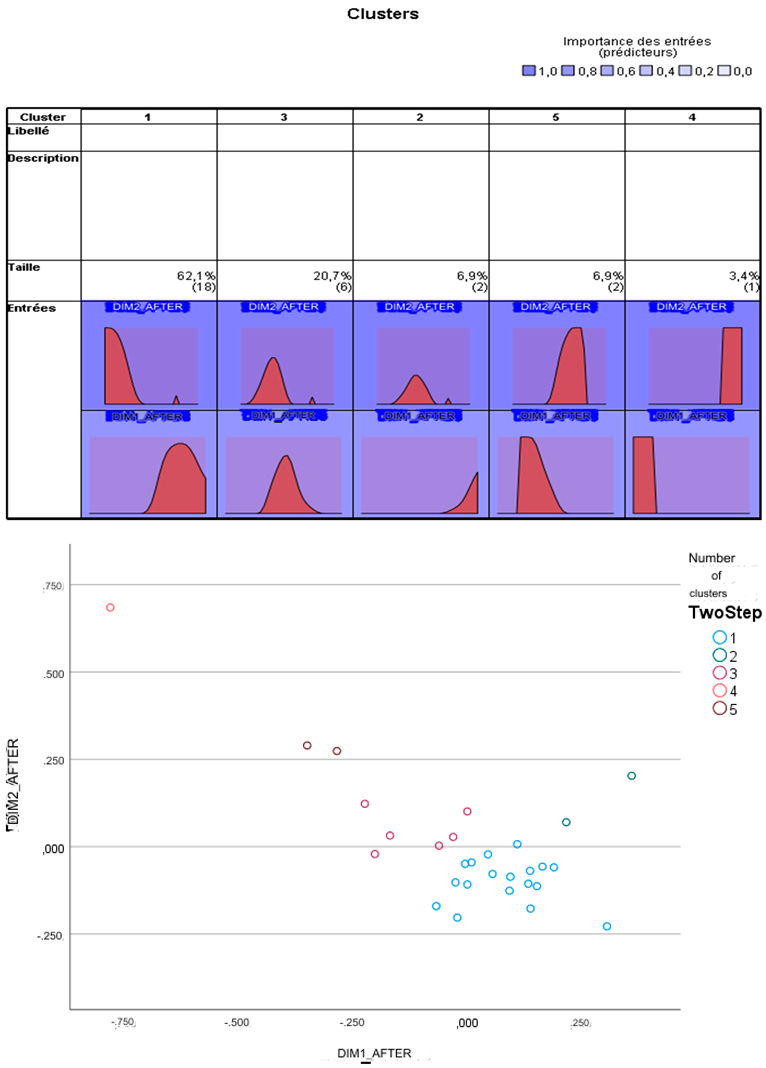
4.3. Two-Step Cluster Analysis

The Two-Step Cluster Analysis procedure in SPSS is a method used to explore clustering structures within a dataset. It stands out due to several important features compared to traditional clustering techniques. Notably, it is distinguished by its flexibility, automation, and scalability. Capable of handling various types of data, Two-Step Cluster Analysis automatically determines the optimal number of groups. Furthermore, this method efficiently adapts to the analysis of large datasets through the use of a clustering feature tree.
The Table 4 and Table 5 present the results of the Two-Step Cluster Analysis before and after issuance announcement. It revealed five distinct clusters, both before and after the announcement of company issuances.
To describe these different clusters, we closely examined charts showing how stock prices of companies change one year before and after issuance. We also used our input data to better understand the reasons behind the observed ups and downs in our entities.
It is noteworthy that only two companies, namely “New World China Land Ltd.” and “Sumitomo Mitsui Financial Group”, have maintained their position within the same cluster both before and after the issuance (Cluster 3). This observation holds true despite variations in the stock prices of these companies before and after the issuance date.
In the first cluster, comprised of 18 companies spanning diverse geographic regions, half are engaged in banking, accounting for 50% (9 out of 18) of the cluster. The rest operate in varied sectors, with proportions distributed as follows: (3 out of 18) 16.66% in renewable energies; (2 out of 18) 11.11% in semiconductors; (1 out of 18) 5.55% in corporate financial services; (1 out of 18) 5.55% in real estate development and operations; (1 out of 18) 5.55% in public services; and (1 out of 18) 5.55% in automobiles and multi-purpose utility vehicles.
Analyzing the post-issuance market reactions to green bonds in our graphs, it is evident that the involved companies experienced either a slight decrease followed by a moderate increase or a short-term stagnation followed by a minimal uptick. This trend is particularly noticeable among all companies in the cluster that have conducted between one and three issuances, except for two companies, “Raiffeisen Bank International AG” and “Kia Corp.”, which have conducted five and eight issuances, respectively.
For these two specific companies, “Raiffeisen Bank International AG” and “Kia Corp.”, an immediate decrease in their stock prices is observed after the first three issuances. Upon analyzing our data to determine explanatory factors for this decrease, it is notable that the corruption indices of the countries to which these companies belong (Austria and Korea) are high.
During the years of the issuance, Austria’s corruption index stood at 71% in 2022, 74% in 2021, and 76% in 2020. Similarly, Korea’s corruption index was recorded at 63% in 2022 and 62% in 2021. A score close to 0 corresponds to a high level of corruption, whereas a score close to 100 indicates a lower level of corruption.
These companies exhibit considerable scale. Regarding financial leverage, it is observed that “Raiffeisen Bank International AG” has low leverage, explaining its independence from debts, while “Kia Corp.” has high leverage, explaining its debt dependency but this could also explain the decrease in its stock price. The perception of high indebtedness can raise concerns among investors about the company’s ability to repay its debts, which could contribute to the decline in its stock value. Furthermore, the GDP growth rate is positive for both countries. It is thus plausible that the observed decrease is linked to the substantial amount of their issuances, as shown in our data (USD 13,376,000 for “Raiffeisen Bank International AG” and USD 1,400,000,000 for “Kia Corp.”). This situation might have elicited some caution among investors, who may prefer less costly and less risky projects.
Regarding the other 16 companies that experienced a decline or stagnation followed by a moderate increase, it is worth noting that the majority of them exhibited these trends between 2019 and 2022, during the COVID-19 pandemic. This exceptional period could explain the observed moderate decline, reflecting the uncertainties and economic adjustments associated with the global health crisis.
In the literature, several studies have examined the impact of the pandemic on green bonds. Hacıomeroglu et al. (2022) observed that during the pandemic, green bond yields slightly decreased compared to conventional bonds in the primary market, while in the secondary market, there was stronger demand for green bonds, and their yields declined less than those of conventional bonds.
However, Jin and Zhang (2022) found that companies issuing green bonds experienced positive cumulative abnormal returns during official announcements of the COVID-19 epidemic, primarily observed among non-financial companies.
Another study conducted by Yi et al. (2021) explored the impact of the pandemic on the green bond market in China. Their results revealed a significant market reaction of green bonds to the pandemic, with a notable increase in cumulative abnormal returns of green bonds during the crisis, followed by a significant decrease after the pandemic relief.
In summary, while the results of the studies vary, they generally indicate a complex dynamic between the pandemic and the performance of green bonds.
For the second cluster, which includes only two companies operating in the banking sector and the real estate leasing sector, development and operation. We note fluctuations in prices accompanied by a short-term decrease.
To better understand this reaction, an analysis of the data reveals that these companies are of medium size but have a significant total debt. This high level of indebtedness can be a key factor contributing to fluctuations and declines in stock prices. Another factor that may explain this reaction is that these two companies are located in Turkey and the Cayman Islands, where their corruption index is not high, as it is close to 0.
For instance, Turkey recorded corruption indices of 38% in 2021 and 40% in 2019, whereas the Cayman Islands registered a corruption index of 45% in 2018, coinciding with their issuance dates. Additionally, these companies have not issued many bonds. “Turkiye IS Bankasi AS” has issued two bonds with significant amounts of USD 50,000,000 and USD 13,000,000, respectively, while “New World China Land Ltd.” has only issued one bond of USD 310,000,000. This may indicate limited involvement in environmental sustainability initiatives.
The third cluster consists of six companies from different countries operating in various sectors. Specifically, half of these companies (three out of six) are active in the banking sector, while the others operate in plastics, electricity utilities, as well as automobile and truck manufacturing. A trend of increasing prices is observed in the month following their issuances. All companies in this group have conducted between two and ten issuances, demonstrating their ongoing commitment to environmentally friendly projects. This consistency in environmental initiatives helps explain the upward trend in the value of their stocks. It is also noteworthy that these companies are of significant scale, which reinforces their commitment to the natural world.
Moreover, the levels of corruption in the countries of these companies are high, with indices such as 63% for Korea, 73% for Japan, 69% for the USA, and 67% for the UAE, which may also contribute to this increase. Additionally, the GDP growth rates of these countries are positive, indicating a healthy economic environment.
The fourth cluster encompasses a single company based in Brazil, specializing in financial services for businesses. Upon examining the graph, it becomes evident that the company’s stock prices experienced an increase one month after issuance, with this trend persisting for the following three months. This growth could be attributed to the considerable scale of the company highlighted in our data. Larger companies often benefit from greater financial resources, enabling them to invest significantly in various sustainable projects.
While Brazil’s corruption index remains relatively low at 37% in 2017, it is important to highlight the company’s substantial level of indebtedness. Additionally, it is worth noting that the company has only conducted two issuances in the same year, amounting to a total of USD 2 billion.
The fifth and last cluster encompasses two prominent US-based companies operating in distinct sectors: specialized real estate investment funds and solar photovoltaic systems and equipment. These firms play pivotal roles in the green bond market, with Tesla Energy Operations Inc issuing 57 bonds and the other company issuing five, all with substantial sums. Both companies are heavyweight entities. Their stock prices demonstrate notable volatility, alternating between persistent upward and downward trends. These significant fluctuations can be ascribed to various factors, including the dynamics of the US green market, which ranks at the forefront according to the CBI, and the country’s GDP, serving as a barometer of overall economic vitality.
Moreover, the corruption index of the United States varied over the years of issuance reporting: 74% in 2015, 76% in 2016, 67% in 2020, 67% in 2021, and 69% in 2022. However, the US corruption index remains high and far from 0, so it may also contribute to these fluctuations. Despite their considerable leverage, underscoring their debt reliance, these companies persist as influential players in the market.
For the first group, we observed that all of the hypotheses had been rejected. Both companies whose data we analyzed experienced a decline after the third issuance, unlike the others.
H1 is rejected because the issuance of green bonds led to a decrease rather than an increase. H2 is rejected because, despite significant sums invested in these issuances, the companies experienced a decline.
H3 is invalidated because despite being sizable entities, both companies experienced stock price declines. H4 is rejected because “Raiffeisen Bank International AG” has a low level of debt and “Kia Corp.” has a high level, yet both experienced a decline. H5 is contradicted by the fact that even amid positive GDP growth, stock prices for both companies plummeted. H6 is rejected because the countries of these companies have a high corruption control index, which signifies a good sign as a higher index indicates a less corrupt country, but they still suffered a decrease.
All of the hypotheses in the second group are rejected also. The first hypothesis (H1) is rejected due to observed fluctuations accompanied by a short-term decline. Similarly, the second hypothesis (H2) is rejected because, despite the significant issuance of one or two bonds by companies in this cluster, their stock prices fluctuated and then declined.
The third hypothesis (H3) is rejected because medium-sized companies experienced fluctuations followed by short-term declines. Additionally, the fourth hypothesis (H4) is rejected due to a high level of debt, which may explain the observed decline. Finally, the sixth hypothesis (H6) is also rejected because the countries of these companies have a low corruption index, which, contrary to expectations, corresponds to a negative sign and is associated with a decline in stock prices.
In the third group, unlike the first two clusters, the hypotheses are accepted or affirmed. Firstly, H1 is accepted as the issuance of green bonds by companies in this cluster has led to an increase in stock prices, demonstrating a positive effect. Secondly, H2 is accepted as companies in this group have conducted between two and ten green bond issuances, with substantial amounts, and have experienced positive effects as a result.
Similarly, H3 is confirmed as these companies are of large scale and have enjoyed favorable effects following the issuance of green bonds. As for H4, the companies have a positive GDP and experienced an increase after the issuance of green bonds. Finally, H6 is accepted as the countries where these companies operate have high corruption control indices and have also benefited from an increase following the issuance of green bonds.
For the fourth group, the only company in this group experienced an increase in the month following the issuance, which persisted for three months, confirming the first hypothesis (H1). H2 is accepted because this company conducted its two issuances with a substantial amount of USD 2 billion and experienced a positive effect.
H3 is accepted as well because it is a large-scale company that saw a rise in stock prices following the issuance of green bonds. H4 is also accepted because, despite the company’s high level of debt, it experienced a positive effect on the issuance of green bonds. However, H6 is rejected because the country of the company in this cluster has a low corruption control index, which represents a negative sign.
For the last group, we observed both upward and downward trends, indicating volatility for the companies in this cluster. The first hypothesis (H1) is supported as the issuance of green bonds initially had a positive effect on these firms. Similarly, the second hypothesis (H2) is validated as these companies generate a significant number of emissions (ranging from 5 to 57), resulting in a positive impact.
The third hypothesis (H3) is upheld by the fact that companies in this cluster are large in size and experienced an increase upon the issuance of green bonds. Regarding the fourth hypothesis (H4), it is affirmed due to the high GDP growth rate in the country of origin of the cluster’s companies (the USA), leading to a positive effect on the issuance of green bonds. Lastly, the sixth hypothesis (H6) is accepted, as the USA, characterized by a high corruption index, experienced a favorable effect on the issuance of green bonds.
Overall, the analysis underscores the complexity of the relationship between green bond issuances and stock prices, emphasizing the importance of considering various factors beyond just the environmental focus of these bonds.

5. Conclusions and Implications

Environmental sustainability has become an increasingly common theme in everyday life, particularly in this historic period when the financial world is focusing more and more on this topic. The recent growth of the green bond phenomenon calls for an analysis of the stock market’s reaction to these issues, the relative benefits for companies, and whether they actually contribute to improving companies’ environmental footprints or are simply a form of “greenwashing”.
This study explores the link between the issuance of green bonds and the market reaction. Our results show that there is an effect, whether positive or negative (an upward or downward trend), that is in line with the literature. We then explored whether the market reaction following the issuance of the bonds can be influenced by other factors in relation to the very characteristics of the issue (volume of the issue), the size of the company issuer, its level of debt, and macroeconomic and governance variables such as the GDP growth rate and the corruption index.
By using machine learning techniques and in particular clustering by MDS, we were able to classify the companies in our database into groups. The results obtained were not congruent. Indeed, our hypotheses were validated for some groups and invalidated in other groups. This result confirms what has been put forward in the literature. There is no consensus around the exact reaction of the financial markets following the announcement of the issuance of green bonds. The absence of a single, consensual answer on this subject is likely to encourage research to explore this very fertile area, hence our interest in this subject.
Another point that constitutes a major contribution of our work is the use of an innovative approach that combines the MDS method for ranking companies on the basis of their post-issuance performance, with a two-stage clustering analysis. Our contribution lies in this methodological innovation, which contrasts with traditional regression methods (with the need to carry out robustness tests) or event studies with measures of abnormal returns and cumulative abnormal returns. Our work goes beyond this largely traditional framework to implement the advantages of artificial intelligence by employing one of the most powerful machine learning techniques, namely the MDS method.
To the best of our knowledge, our study is the first to use this approach to test the impact of the issuance of green bonds on the reaction of financial markets, almost everywhere in the world.
Our findings have several managerial contributions for portfolio managers investing in green bonds, enabling them to anticipate market movements, review their expectations of future developments and, consequently, adapt their portfolio management strategies. These results help managers to understand that these fluctuations, whether upwards or downwards, are influenced not only by the green criterion but also by other factors such as the size of the company, the substantial amount of its issues, the total number of issues, and its geographical location, as certain countries play a crucial role in the green bond market. In addition, elements such as the country’s GDP (Gross Domestic Product) and corruption index can also have a significant impact on these fluctuations.
All countries in the world are today called upon to look at CSR practices and address environmental and social challenges. By focusing on the study of the reactions of financial markets (an indicator of the economic development of any country), our article contributes to the promotion of public and government policies. This research article will help governments issue more green bonds so that the proceeds can be utilized for green projects. Moreover, governments should motivate corporations and financial institutions to issue more green bonds to increase the firms’ value, boost returns to investors, and help the economy grow.
However, like all research work, our study is affected by several limitations. Firstly, it focuses only on investors’ short-term reactions, without taking into account the long-term benefits of green projects. Secondly, our final sample comprises only 29 companies, due to the scarcity of certain data. This constraint limited the scope of our work, but it may also serve as motivation for future studies. Indeed, future research might consider extending the analysis by using other machine learning methods like t-SNE or PCA (principal component analysis) methods. It could be interesting to compare the results from each method. For example, PCA is a dimensionality reduction method that is often used to reduce the dimensionality of large datasets by transforming a large set of variables into a smaller one that still contains most of the information in the large set. To legitimize the use of these methods, we will need to constitute a larger database and a larger sample.

Author Contributions

Conceptualization, W.K. and F.B.; methodology, I.B.F., W.K. and F.B.; software, F.B.; validation, I.B.F. and A.L.; formal analysis, I.B.F., A.L. and F.B.; investigation, A.L. and I.B.F.; resources, F.B. and W.K.; data curation, F.B.; writing—original draft F.B.; writing—review and editing, W.K., I.B.F. and A.L.; visualization, I.B.F., A.L. and F.B.; supervision, W.K.; project administration, W.K. and F.B.; funding acquisition, I.B.F. and A.L. All authors have read and agreed to the published version of the manuscript.

Funding

This research received no funding.

Data Availability Statement

The data are available and can be emailed upon request.

Acknowledgments

Authors want to thank Adel KARAA for his valuable advices.

Conflicts of Interest

The authors declare that there are no conflicts of interest regarding the publication of this article.

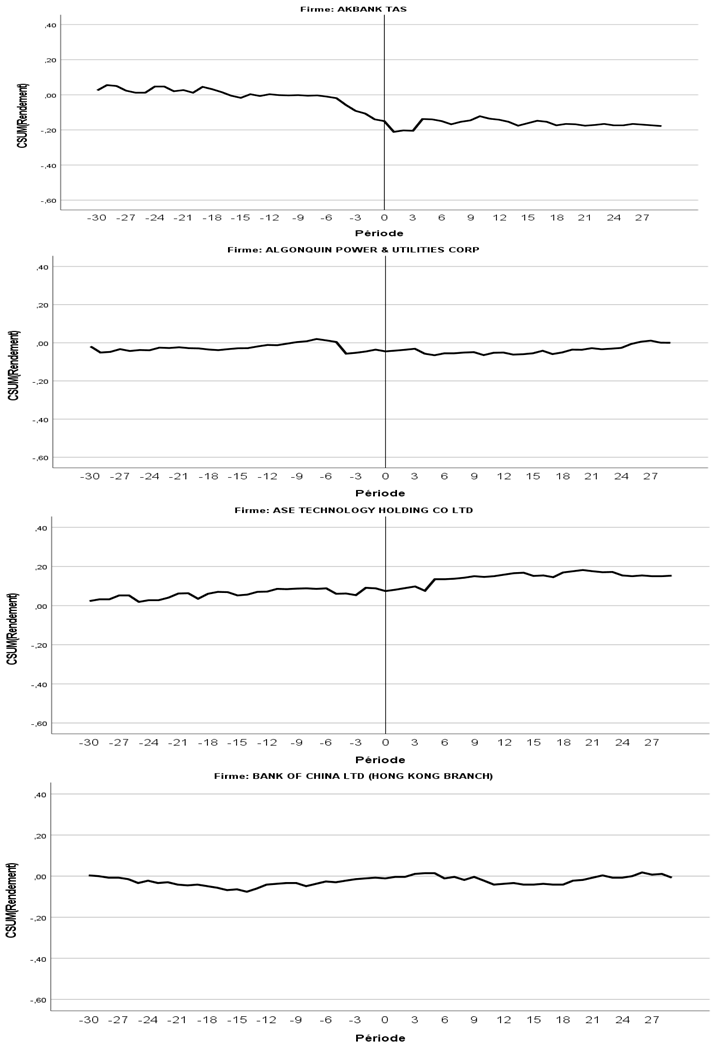
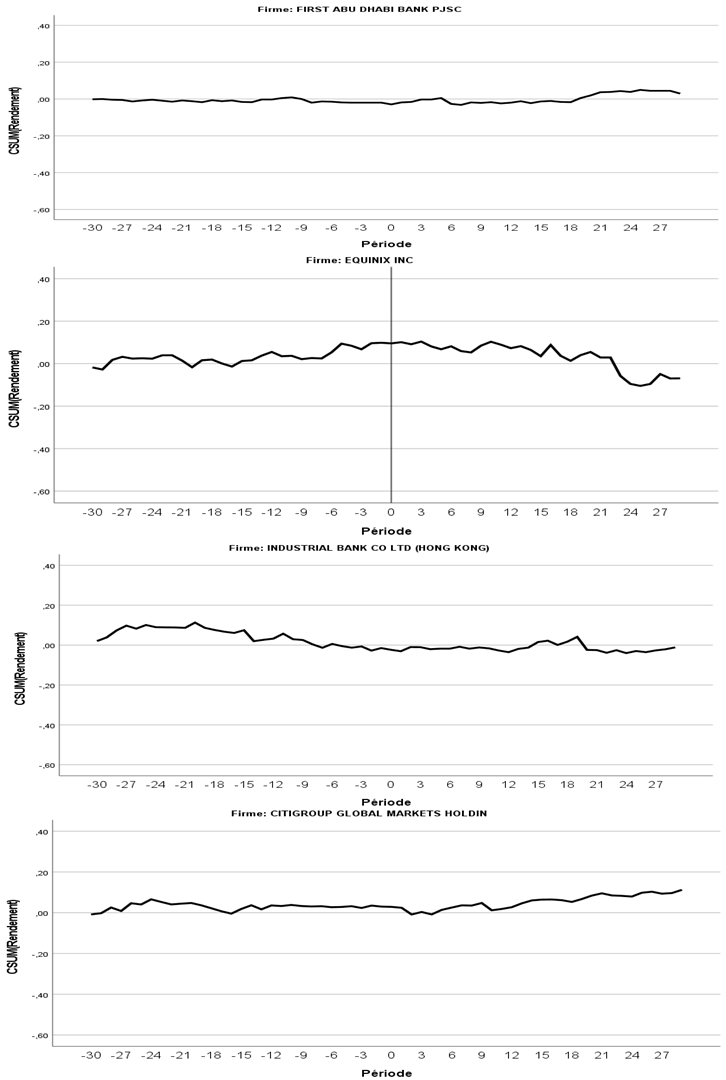
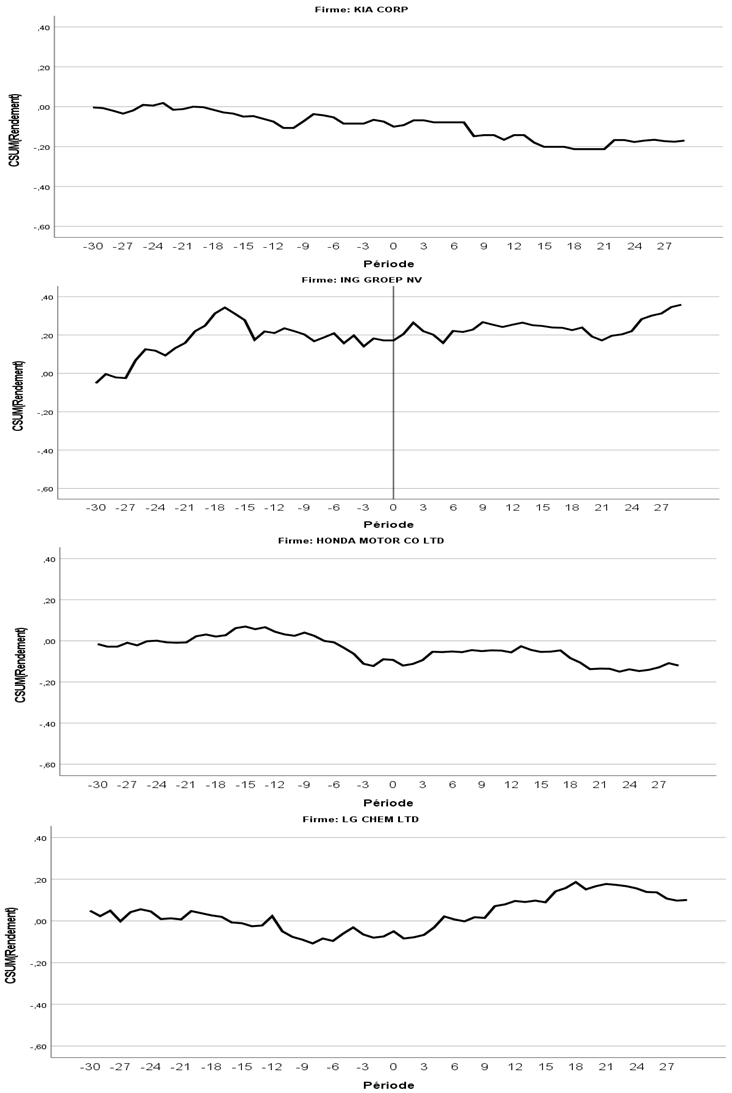
Appendix A. The Evolution of Stock Market Return

Jrfm 17 00408 i001a
Jrfm 17 00408 i001b
Jrfm 17 00408 i001c
Jrfm 17 00408 i001d
Jrfm 17 00408 i001e
Jrfm 17 00408 i001f
Jrfm 17 00408 i001g
Jrfm 17 00408 i001h

Appendix B. Fit and Stress Measurement

Dimensionality2
Normalized gross stress0.08066
Constraint I0.28401 i
Constraint II0.51648 i
Constraint S0.18181 j
Dispersion shown (D.A.F.)0.91934
Tucker’s Congruence Coefficient0.95882
PROXSCAL reduces normalized gross stress.
Jrfm 17 00408 i002a
Jrfm 17 00408 i002b

Notes

1

References

  1. Ahmed, Rizwan, Fatima Yusuf, and Maria Ishaque. 2023. Green bonds as a bridge to the UN sustainable development goals on environment: A climate change empirical investigation. International Journal of Finance and Economics 29: 2428–51. [Google Scholar] [CrossRef]
  2. Akbar, Salma Ume, Niaz Ahmed Bhutto, and Naseer Ullah Khan. 2024. Boosting Shareholder Value: The Impact of Green Bonds on Equity Markets. Pakistan Social Sciences Review 8: 41–52. [Google Scholar] [CrossRef]
  3. Aljazaerli, Moaz Aljazaierli, Rasha Sirop, and Sulaiman Mouselli. 2016. Corruption and stock market development: New evidence from GCC countries. Business, Management and Education 17: 117–27. [Google Scholar] [CrossRef]
  4. Anggraeni, Adithia, Sri Hartoyo, and Hendro Sasongko. 2019. The Effect Analysis of Banking Corporate Bond Issuance Towards the Stock Market Reaction. Journal of Finance and Accounting 10: 615–24. [Google Scholar] [CrossRef]
  5. Anh Tu, Phan, Do Thu Huong, and Phan Minh Triet. 2020. The moderating effects of managers experience and gender on internationalization and firm performance of manufacturing enterprises in Turkey. Accounting 6: 1209–16. [Google Scholar] [CrossRef]
  6. Banga, Josué. 2019. The green bond market: A potential source of climate finance for developing countries. Journal of Sustainable Finance & Investment 9: 17–32. [Google Scholar] [CrossRef]
  7. Barnea, Amir, and Amir Rubin. 2010. Corporate social responsibility as a con-flict between shareholders. Journal of Business Ethics 97: 71–86. [Google Scholar] [CrossRef]
  8. Baulkaran, Vishaal. 2019. Stock market reaction to green bond issuance. Journal of Asset Management 20: 331–40. [Google Scholar] [CrossRef]
  9. Bebchuk, Lucian A., and Roberto Tallarita. 2020. The illusory promise of stakeholder governance. Cornell Law Review 106: 91. [Google Scholar] [CrossRef]
  10. Bhagat, Sanjai, and Glenn Hubbard. 2022. Rule of law and purpose of the corporation. Corporate Governance: An International Review 30: 10–26. [Google Scholar] [CrossRef]
  11. Birindelli, Giuliana, Aline Miazza, Victoriia Paimanova, and Vera Palea. 2023. Just “blah blah blah”? Stock market expectations and reactions to COP26. International Review of Financial Analysis 88: 102699. [Google Scholar] [CrossRef]
  12. Buchanan, Bonnie, Cathy Cao, and Chongyong Chen. 2018. Corporate social responsibility, firm value, and influential institutional ownership. Journal of CorporateFinance 52: 73–95. [Google Scholar] [CrossRef]
  13. Camacci, Rachele. 2022. Corporate Green Bond: Issuance and Equity Market Reaction. In Climate Change Adaptation, Governance and New Issues of Value. Edited by Carlo Bellavite Pellegrini, Laura Pellegrini and Massimo Catizone. London: Palgrave Macmillan, pp. 227–49. [Google Scholar]
  14. Caramichael, Jhon, and Andreas Rapp. 2024. The green corporate bond issuance premium. Journal of Banking & Finance 162: 107126. [Google Scholar] [CrossRef]
  15. Chen, Jinyu, Yan Yang, and Ran Liu. 2023. Chen, Jinyu, Yan Yang, and Ran Liu. 2023. Green bond issuance and corporate ESG performance: The perspective of internal attention and external supervision. Humanities and Social Sciences Communications 10: 437. [Google Scholar] [CrossRef]
  16. Chen, Xingxing, Olaf Weber, and Vasundhara Saravade. 2022. Does It Pay to Issue Green? An Institutional Comparison of Mainland China and Hong Kong’s Stock Markets Toward Green Bonds. Frontiers in Psychology 13: 833–47. [Google Scholar] [CrossRef]
  17. Chen, Yujin, and Zhirong Jerry Zhao. 2021. The rise of green bonds for sustainable finance: Global standards and issues with the expanding Chinese market. Environmental Sustainability 52: 54–57. [Google Scholar] [CrossRef]
  18. Chiesa, Mikol, and Suborna Barua. 2019. The surge of impact borrowing: The magnitude and determinants of green bond supply and its heterogeneity across markets. Journal of Sustainable Finance and Investment 9: 138–61. [Google Scholar] [CrossRef]
  19. Chowdhury, Shahedur, Maroula Khraiche, and James Boudreau. 2023. Corruption and stock market development: Developing vs. developed economies. International Review of Financial Analysis 89: 102795. [Google Scholar] [CrossRef]
  20. Cioli, Valentina, Lorenzo Andrea Colonna, Alessandro Giannozzi, and Oliviero Roggi. 2021. Corporate Green Bond and Stock Price Reaction. International Journal of Business and Management 16: 75–84. [Google Scholar] [CrossRef]
  21. Drempetic, Samuel, Christian Klein, and Bernhard Zwergel. 2019. The influence of firm size on the ESG score: Corporate sustainability ratings under review. Journal of Business Ethics 167: 333–60. [Google Scholar] [CrossRef]
  22. Dumlu, Togla, and Emrah Keles. 2023. Corporate green bonds and firm value: Evidence from Turkey. Finans Ekonomi ve Sosyal Arastirmalar Dergisi 1: 261–69. [Google Scholar] [CrossRef]
  23. Eichengreen, Barry, and Pipat Luengnaruemitchai. 2004. Why Doesn’t Asia Have Bigger Bond Markets? NBER Working Paper No. w10576. Available online: https://papers.ssrn.com/sol3/papers.cfm?abstract_id=559226 (accessed on 24 July 2024).
  24. Erhart, Szilard. 2018. Exchange-Traded Green Bonds. Journal of Environmental Investing, 1–41. [Google Scholar]
  25. Fama, Eugene, and Michael Jensen. 1983. Agency problems and residual claims. Journal of Law and Economics 26: 327–49. [Google Scholar] [CrossRef]
  26. Fan, Ruixin, Xiong Xiong, Youwei Li, and Ya Gao. 2023. Do green bonds affect stock returns and corporate environmental performance? Evidence from China. Economics Letters 232: 111322. [Google Scholar] [CrossRef]
  27. Fatica, Serena, and Roberto Panzica. 2021. Green bonds as a tool against climate change? Business Strategy and the Environnement 30: 2688–701. [Google Scholar] [CrossRef]
  28. Fichtner, Ferdinand, and Heike Joebges. 2024. Stock Market Returns and GDP Growth. IMK Study, No. 90. Düsseldorf: Hans-Böckler-Stiftung, Institut für Makroökonomie und Konjunkturforschung (IMK). [Google Scholar]
  29. Fikri, Khalid. 2015. Approche analytique et critique autour de la relation entre RSE et Performance Financière. Dossiers de Recherches en Economie et Gestion 1: 12–33. [Google Scholar] [CrossRef]
  30. Flammer, Caroline. 2018. Competing for Government Procurement Contracts: The Role of Corporate Social Responsibility. Strategic Management Journal 39: 1299–324. [Google Scholar] [CrossRef]
  31. Flammer, Caroline. 2021. Corporate Green Bonds. Journal of Financial Economics 142: 499–516. [Google Scholar] [CrossRef]
  32. Flugum, Ryan, and Matthew Souther. 2021. Stakeholder Value: A Convenient Excuse for Underperforming Managers? Available online: https://ssrn.com/abstract=3725828 (accessed on 7 September 2023).
  33. Freeman, R. Edward. 1984. Strategic Management: A Stakeholder Approach. Boston: Pitman. [Google Scholar]
  34. Glavas, Dejan. 2019. Green bond market: Green regulation and stock price reaction to green bond issuance. Finance 41: 7–51. [Google Scholar] [CrossRef]
  35. Glavas, Dejan. 2022. Do green bond issuers suffer from financial constraints? Applied Economics Letters 30: 1887–90. [Google Scholar] [CrossRef]
  36. Glavas, Dejan, and Frank Bancel. 2019. Are Agency Problems a Determinant of Green Bond Issuance? Univ. Libr. MunichGer. 2018. MPRA Paper No. 88377. Available online: https://www.researchgate.net/publication/326852214 (accessed on 24 July 2024).
  37. Glomsrod, Solveg, and Taoyuan Wei. 2018. Business as unusual: The implications of fossil divestment and green bonds for financial flows, economic growth and energy market. Energy for Sustainable Development 44: 1–10. [Google Scholar] [CrossRef]
  38. Hacıomeroglu, Hande Ayaydın, Seza Danısoglu, and Nuray Güner. 2022. For the love of the environment: An analysis of Green versus Brown bonds during the COVID-19 pandemic. Finance Research Letters 47: 102576. [Google Scholar] [CrossRef]
  39. Hyun, Suk, Donghyun Park, and Shu Tian. 2020. Pricing of Green Labeling: A Comparison of Labeled and Unlabeled Green Bonds. Finance Research Letters 41: 101816. [Google Scholar] [CrossRef]
  40. Jensen, Michael C., and William H. Meckling. 1976. Theory of the Firm: Managerial Behavior, Agency Costs and Ownership Structure. Journal of Financial Economics 3: 305–60. [Google Scholar] [CrossRef]
  41. Jin, Jiongye, and Jianing Zhang. 2022. The Stock Performance of Green Bond Issuers During COVID-19 Pandemic: The Case of China. Asia-Pac Financ Markets 30: 211–30. [Google Scholar] [CrossRef]
  42. Kapraun, Julia, Carmelo Latino, Cristopher Scheins, and Christian Schlag. 2021. (In)-Credibly Green: Which Bonds Trade at a Green Bond Premium? Proceedings of Paris December 2019 Finance Meeting EUROFIDAI—ESSEC. Available online: https://ssrn.com/abstract=3347337 (accessed on 24 July 2024).
  43. Khiari, Wided, and Jamila Nachnouchi. 2018. Banks’ systemic risk in the Tunisian context: Measures and Determinants. Research in International Business and Finance 45: 620–31. [Google Scholar] [CrossRef]
  44. Khurram, Muhammad Usman, Wenwu Xie, Mirza Sultan Sikandar, and Hao Tong. 2023. Green bonds issuance, innovation performance, and corporate value: Empirical evidence from China. Heliyon 9: 14895. [Google Scholar] [CrossRef]
  45. Kruskal, Joseph, and Myron Wish. 1978. Multidimensional Scaling. Sage University Paper Series on Quantitative Applications in the Social Sciences, No. 07-011. Newbury Park: Sage Publications. [Google Scholar] [CrossRef]
  46. Kuchin, Ilia, Gennadiy Baranovsky, Yury Dranev, and Alexander Chulok. 2019. Does Green Bonds Placement Create Value for Firms? Basic Research Program Working Papers. Moscow: National Research University Higher School of Economics. [Google Scholar] [CrossRef]
  47. Laborda, Juan, and Alvaro Sanchez Guerra. 2021. Green Bond Finance in Europe and the Stock Market Reaction. Studies of Applied Economics 39: 1–22. [Google Scholar] [CrossRef]
  48. Lebelle, Martin, Souad Lajili Jarjir, and Syrine Sassi. 2020. Corporate Green Bond Issuances: An International Evidence. Journal of Risk Financial Management 13: 25. [Google Scholar] [CrossRef]
  49. Lestari, Suryadi, Edy Yolifiandri, Sigit Mareta, and Irwan Irawadi Barus. 2023. The Influence of Earnings Per Share, Debt to Equity Ratio and Company Size on Stock Return. Economics, and Communication, KnE Social Sciences, 137–48. [Google Scholar] [CrossRef]
  50. Lin, Chen, Micah S. Officier, and Zengyuan Sun. 2016. Corruption and trust: Evidence from stock market. China International Conference in Finance, 1–48. [Google Scholar]
  51. Maltais, Aaron, and Bjorn Nykvist. 2020. Understanding the role of green bonds in advancing sustainability. Journal of sustainable Finance and Investment, 1–20. [Google Scholar] [CrossRef]
  52. Masulis, Ronald, and Syed Walid Reza. 2015. Agency Problems of Corporate Philanthropy. The Review of Financial Studies 28: 592–636. [Google Scholar] [CrossRef]
  53. Michelon, Giovanna, and Antonio Parbonetti. 2012. The effect of corporate governance on sustainability disclosure. Journal of Management and Governance 16: 477–509. [Google Scholar] [CrossRef]
  54. Monasterolo, Irene, and Marco Raberto. 2018. The EIRIN Flow-of-funds Behavioural Model of Green Fiscal Policies and Green Sovereign Bonds. Ecological Economics 144: 228–43. [Google Scholar] [CrossRef]
  55. Nobbir, Ahmed, and J. Miller Harvey. 2007. Time–Space Transformations of Geographic Space for Exploring, Analyzing and Visualizing Transportation Systems. Journal of Transport Geography 15: 2–17. [Google Scholar]
  56. Pamungkas, Wihandaru Sotya, Edi Supriyono, and Meika Kurnia Puji Rahayu. 2023. The persistent effect of equity market timing on capital structure during right issue. International Journal of Applied Economics, Finance and Accounting 15: 53–60. [Google Scholar] [CrossRef]
  57. Parlour, Christine, and Uday Rajan. 2020. Contracting on credit ratings: Adding value to public information. Review of Financial Studies 33: 1412–44. [Google Scholar] [CrossRef]
  58. Patatoukas, Panos. 2021. Stock market returns and GDP news. Journal of Accounting, Auditing & Finance 36: 776–801. [Google Scholar] [CrossRef]
  59. Pham, Linh Hoang Mai Linh, and Toan Luu DucHuynh. 2020. How does investor attention influence the green bond market? Finance Research Letters 35: 101533. [Google Scholar] [CrossRef]
  60. Piñeiro-Chousa, Juan, Ángeles López-Cabarcos, Jérôme Caby, and Aleksandar Šević. 2021. The influence of investor sentiment on the green bond market. Technological Forecasting and Social Change 162: 120351. [Google Scholar] [CrossRef]
  61. Presbitero, Andrea, Ghura Dhaneshwar, Adedeji Olumuyiwa, and Njie Lamin. 2016. Sovereign bonds in developing countries: Drivers of issuance and spreads. Review of Development Finance 1: 1–15. [Google Scholar] [CrossRef]
  62. Sharma, Preeti, and Priyanka Payal. 2019. Climate Change and Sustainable Development: Special context to Paris Agreement. Paper presented at the International Conference on Sustainable Computing in Science, Technology and Management (SUSCOM), Jaipur, India, March 26–28. [Google Scholar]
  63. Stiglitz, Joseph. 2000. The Contributions of the Economics of Information to Twentieth Century Economics. The Quarterly Journal of Economics 115: 1441–78. [Google Scholar] [CrossRef]
  64. Tang, Dragon Yongjun, and Yupu Zhang. 2020. Do shareholders benefit from green bonds? Journal of Corporate Finance 61: 101427. [Google Scholar] [CrossRef]
  65. Tannady, Hendy, Nuzulya Pahlawi, Moch Arif Hernawan, Deddy Novie Citra Arta, and Sri Dewi Yusuf. 2023. Role of Stock Performance as an Intervening Variable in a Relationship Between Profitability, Leverage, Growth and Company Value. JEMSI (Jurnal Ekonomi, Manajemen, dan Akuntansi) 9: 220–25. [Google Scholar] [CrossRef]
  66. Tolliver, Clarence, Alexander Ryota Keeley, and Shunsuke Managi. 2020. Drivers of green bond market growth: The importance of Nationally Determined Contributions to the Paris Agreement and implications for sustainability. Journal of Cleaner Production 244: 118643. [Google Scholar] [CrossRef]
  67. Verma, Rakesh Kumar, and Rohit Bansal. 2021. Stock Market Reaction on Green Bond Issue: Evidence from Indian Green-Bond Issuers. The Journal of Business Perspective 162: 120351. [Google Scholar] [CrossRef]
  68. Wang, Hang. 2023. An Empirical Study on the Stock Market Reaction to Corporate Green Bond Issuance in China. Highlights in Business Economics and Management 10: 417–24. [Google Scholar] [CrossRef]
  69. Wang, Jiazhen, Xin Chen, Xiaoxia Li, Jing Yu, and Rui Zhong. 2020. The market reaction to green bond issuance: Evidence from China. Pacific-Basin Finance Journal 60: 101294. [Google Scholar] [CrossRef]
  70. Wang, Yuqing. 2020. Green Bond Issuance and Investors, Attention: Evidence Based on AH Shares. Paper presented at 2020 International Conference on Social Science, Education and Management, Datong, China, March 29–30; pp. 289–98. [Google Scholar]
  71. Xi, Bin, and Huimin Jing. 2021. Research on the impact of green bond issuance on the stock price of listed companies. Kybernetes 51: 1478–97. [Google Scholar] [CrossRef]
  72. Yang, Taisheng. 2024. Analysis and Suggestions on the Issuance of Green Bond-Taking Apple as an Example. SHS Web of Conferences 181: 02026. [Google Scholar] [CrossRef]
  73. Yeow, Kim Ee, and Sin Huei Ng. 2021. The impact of green bonds on corporate environmental and financial performance. Managerial Finance 47: 1486–510. [Google Scholar] [CrossRef]
  74. Yi, Xing, Caiquan Bai, Siyuan Lyu, and Lu Dai. 2021. The impacts of the COVID-19 pandemic on China’s green bond market. Finance Research Letters 42: 101948. [Google Scholar] [CrossRef] [PubMed]
  75. Yuliarti, Atika, and Lucia Ari Diyani. 2018. The Effect of Firm Size, Financial Ratios and Cash Flow On Stock Return. The Indonesian Accounting Review 8: 229–43. [Google Scholar] [CrossRef]
  76. Zheng, Jingyun, Yang Liu, Zhixin Hao, and Quansheng Ge. 2021. State-of-art and perspective on global synthesis studies of climate change for the past 2000 years. Quaternary Sciences 41: 309–22. [Google Scholar] [CrossRef]
  77. Zhou, Xiaoguang, and Yadi Cui. 2019. Green Bonds, Corporate Performance, and Corporate Social Responsibility. Sustainability 11: 6881. [Google Scholar] [CrossRef]
  78. Zirek, Duygu, and Omer Unsal. 2023. Green bonds: Do investors benefit from third-party certification? Global Finance Journal 58: 100872. [Google Scholar] [CrossRef]
Figure 1. Financial map.
Jrfm 17 00408 g001
Table 1. Variable definitions.
VariableDescriptionSource
Stock market return variationInvolves the fluctuations in stock market returns.
Concerns the daily fluctuations in stock market returns, specifically the return from day j minus day j − 1 divided by the return from day j − 1, multiplied by 100.
Percentage Change = (Return t − Return t − 1/Return t − 1) × 100
Yahoo! Finance and investing.com
GB issuanceRepresents a binary variable set to 1 when the company issues green bonds and 0 otherwise, from 2010 up to 2022.Eikon Refinitiv datastream
GB issuance amountRepresents the total amount of green bonds issued by a company, encompassing both currently issued bonds and those issued in the past, from 2010 up to 2022.Eikon Refinitiv datastream
SizeThe size of the company is calculated by taking the logarithm of total assets.Eikon Refinitiv datastream
LeverageDetermined by dividing the total amount of debt by the total value of the company’s equity.Eikon Refinitiv datastream
GDP growthAn indicator of economic growth for a country or region calculated using the following formula:
(Current-year GDP − Previous-year GDP)/Previous-year GDP × 100
World Bank website
Control of corruptionAn index measuring levels of corruption within an organization or a country. A score closer to 0 corresponds to more corruption and a score closer to 100 to less corruption.World Bank website
Table 2. Descriptive statistics.
VariableObsMeanStd. Dev.MinMax
Stock market return variation1050.0010.023−0.1050.081
GB issuance amount4032.3716.41903010
GB issuance4030.1220.32701
Size40319.11610.66818.48129.068
Leverage4031.7333.385−5.45232.757
GDP growth3630.9640.893−3.7382.528
Control of
corruption
4030.8870.815−1.0912.091
Table 3. Goodness-of-fit indices.
Dimensionality2
Normalized raw stress0.08066
Tucker’s Congruence Coefficient0.95882
Table 4. Results of the Two-Step Cluster Analysis before issuance.
ClustersCompaniesN = 28
1
-
Brazilian Development Bank
1
2
-
Tesla Energy Operations Inc.
-
AK Bank TAS
-
Equinix Inc.
-
LG Chem Ltd.
-
First Abu Dhabi Bank PJSC
-
New World China Land Ltd.
-
Honda Motor Co., Ltd.
7
3
-
Turkiye Garanti Bankasi AS
-
Citigroup Global Markets Holdings Inc.
-
Sumitomo Mitsui Financial Group
3
4
-
Enphase Energy Inc.
-
Adani Green Energy Ltd.
-
Algonquin Power & Utilities Corp.
-
Bank of China Ltd. (HK branch)
-
Kia Corp.
-
Toronto Dominion Bank
6
5
-
PNC Financial Services Group Inc.
-
Avangrid Inc.
-
ING Groep NV
-
Raiffeisen Bank International AG
-
Renesas Electronics Corp.
-
Ase Technology Holdings Co., Ltd.
-
Industrial Bank Co., Ltd. (HK)
-
Jinko Power Technology Co., Ltd.
-
Mirae Asset Securities Co., Ltd.
-
NTT Finance Corp.
-
Regency Centers LP
11
Table 5. Results of the Two-Step Cluster Analysis after issuance.
ClustersCompaniesN = 29
1
-
Mirae Asset Securities Co., Ltd.
-
Jinko Power Technology Co., Ltd.
-
Renesas Electronics Corp.
-
Raiffeisen Bank International AG
-
Industrial Bank Co., Ltd. (HK)
-
Enphase Energy Inc.
-
Toronto Dominion Bank
-
Adani Green Energy Ltd.
-
NTT Finance Corp.
-
Turkiye Garanti Bankasi AS
-
PNC Financial Services Group Inc.
-
Regency Centers LP
-
Algonquin Power & Utilities Corp.
-
Ase Technology Holdings Co., Ltd.
-
ING Groep NV
-
Bank of China Ltd. (HK Branch)
-
Citigroup Global Markets Holdings Inc.
-
Kia Corp.
18
2
-
Turkiye IS Bankasi AS
-
New World China Land Ltd.
2
3
-
Honda Motor Co., Ltd.
-
Avangrid Inc.
-
AK Bank TAS
-
LG Chem Ltd.
-
First Abu Dhabi Bank PJSC
-
Sumitomo Mitsui Financial Group
6
4
-
Brazilian Development Bank
1
5
-
Tesla Energy Operations Inc.
-
Equinix Inc.
2
Disclaimer/Publisher’s Note: The statements, opinions and data contained in all publications are solely those of the individual author(s) and contributor(s) and not of MDPI and/or the editor(s). MDPI and/or the editor(s) disclaim responsibility for any injury to people or property resulting from any ideas, methods, instructions or products referred to in the content.

